PVT Osc - Price Volume Trend Oscillator [UTS]The oscillator version of the Price Volume Trend indicator (PVT) can be considered as a leading indicator of future price movements. The PVT Indicator is similar to the On Balance Volume indicator as it is also used to measure the strength of a trend.
The difference between the OBV and the PVT is that where the OBV adds all volumes when price achieves higher daily closes and subtracts them when price registers a lower daily close, the PVT adds or subtracts only a portion of the volume from the cumulative total in relation to a percentage change in price.
The general market consensus is that this difference enables the PVT to more accurately represent money flow volumes in and out of a stock or commodity.
The PVT has been designed so that it is capable of forecasting directional changes in price. For instance, if the price of a stock is rising and the PVT begins to fall, then this is indicative that a price reversal could occur very soon.
The general consensus is that the PVT is more accurate at detecting new trading opportunities than the OBV because of the differences in their construction. The OBV is designed so that it adds the same amount of volume whether the price closes upwards by just a small fraction or by multiples of its day opening value. On the other hand, the PVT adds volume proportional to the amount the price closed higher.
General Usage
Plain old PVT can be used to confirm trends, as well as spot possible trading signals due to divergences.
A benefit of the oscillator version is that it can produce LONG or SHORT signals on zero line cross.
Or controversy, disallow LONG trades in bearish territory and disallow SHORT trades in bullish territory.
Moving Averages
4 different Moving Averages are available:
EMA (Exponential Moving Average)
SMA (Simple Moving Average)
VWMA (Volume Weighted Moving Average)
WMA (Weighted Moving Average)
"volume indicator" için komut dosyalarını ara

Big 9 Real volume exchanges - On Balance VolumeHere is an On Balance Volume indicator using only volume data from the 9 biggest exchanges trading BTC/USD or BTC/USDT. These 9 exchanges were chosen based on the report by Bitwise Invest stating that 95% of the volume on CoinMarketCap is fake. On these 9 exchanges, however, volume data appears to be reliable. Please note BitFlyer was not included because it does not trade in USD. Please note also that data on all 9 exchanges is only available from August 2017. A separate volume indicator indicator is available at
Anyone is welcome to share and modify.
- stargazer
RSI + KVO TriggerRSI + KVO Trigger is a momentum‑and‑volume indicator that combines a standard RSI with the Klinger Volume Oscillator’s trigger line in the same pane. It helps you see whether price momentum (RSI) and volume‑based money flow (KVO) are confirming each other or starting to diverge, using the same central 50/0 line for quick visual decisions.
-------------------------------
What the indicator shows.
In this script, the RSI 50 line is also the KVO “zero” line, so when:
RSI is above 50, price momentum is bullish.
KVO trigger is above that same line, volume/money flow is bullish.
Either one dipping below the line shows weakening in that dimension.
-------------------------------
Using it for entries.
You can think of the RSI as your main trend/momentum filter and the KVO trigger as confirmation (or a warning) from volume. Typical entry ideas:
Long setups:
RSI above 50 and rising, showing bullish momentum.
KVO trigger also above the midline or crossing up toward/through it, showing volume backing the move.
Extra aggressive: buy on pullbacks where RSI stays above 50 while KVO trigger turns back up above the line after a dip.
Short setups:
RSI below 50 and falling, showing bearish momentum.
KVO trigger below the midline or crossing down through it, showing selling pressure dominating.
Extra aggressive: short on bounces where RSI stays below 50 and KVO trigger rolls back down from near the midline.
-------------------------------------
Using it for exits and trade management.
You can also use the combination to manage open trades, watching for disagreement between price, RSI, and KVO. For example:
Exiting longs:
You’re in a long while RSI is above 50 and KVO trigger is above midline.
If KVO trigger drops below the midline first while RSI is still above 50, it can be an early warning that the trend is losing volume support, so you might tighten stops or scale out.
If RSI then also breaks below 50, that’s stronger confirmation to close the position or be very defensive.
Exiting shorts:
You’re in a short while RSI is below 50 and KVO trigger is below midline.
If KVO trigger pops above the midline ahead of RSI, it can signal selling pressure is fading; consider reducing size or tightening your stop.
A later RSI cross back above 50 can be your hard exit rule.
-------------------------------------
Divergences and “late‑trend” signals.
Because both lines share the same center level, it’s easy to spot situations where price is still trending but one of the components is lagging:
Bullish risk signal:
Price pushes higher, RSI stays above 50, but KVO trigger spends more time below the midline or fails to follow price higher.
This suggests a maturing/uptrend with weaker participation, making new longs riskier and encouraging partial profit‑taking or tighter stops.
Bearish risk signal:
Price makes lower lows, RSI stays below 50, but KVO trigger keeps drifting above the midline.
That can hint at hidden accumulation, where you might be more cautious with new shorts and watch for a trend reversal.
------------------------------------
Used this way, the indicator is not a standalone “buy/sell arrow,” but a structured way to demand agreement between momentum (RSI) and volume (KVO trigger) for entries, and to notice early when that agreement starts to break down for exits or risk management.

GCM Price Volume Trend with BB [Dual Signal]Title:
GCM Price Volume Trend with BB
Description:
This script presents an advanced variation of the Price Volume Trend (PVT) indicator, enhanced with a Dual-Signal system and Bollinger Bands to provide a complete volume-momentum analysis tool.
The Concept:
Standard PVT can often produce jagged, noisy signals that make trend identification difficult. To solve this, this script integrates three distinct technical concepts into a single "Volume Dashboard":
Trend Baseline (Signal 1 - SMA): A standard Simple Moving Average (Length 21) acts as the slow-moving baseline to filter out minor volume noise.
Volume-Weighted Trigger (Signal 2 - VWMA): We utilize a Volume Weighted Moving Average (VWMA) (Length 9) as the fast signal. Applying a Volume-Weighted average on top of a Volume indicator (PVT) provides a double-confirmation of volume momentum, making the signal highly sensitive to significant volume spikes while ignoring low-volume drift.
Volatility Context (Bollinger Bands): Standard Bollinger Bands are calculated on the PVT data itself. This allows traders to identify when the volume trend is statistically overextended (touching Upper Band) or oversold (touching Lower Band), which often precedes a price reversal.
Key Features
Dynamic Trend Coloring: The PVT line changes color (Bright Green/Red) based on its immediate slope (Rising vs. Falling), offering instant visual feedback on momentum.
Dual Ribbon System:
Ribbon 1: Fills the space between PVT and the Baseline (SMA) to show the macro trend.
Ribbon 2: Fills the space between PVT and the Fast Trigger (VWMA). By default, this ribbon changes color based on the slope of the PVT, highlighting the strength of the move.
Volatility Bands: A background fill between the Bollinger Bands helps visualize the "normal" operating range of the volume trend.
How to Use
Trend Confirmation: Look for the PVT line to be above the SMA (Signal 1) and the Ribbon to be Green.
Entry Signals: A crossover of the PVT above the VWMA (Signal 2) suggests an immediate influx of buying volume.
Exhaustion: If the PVT line touches or exceeds the Upper Bollinger Band, the volume trend may be overheated, suggesting a potential pause or reversal in price.
Settings
Signal 1: Defaults to SMA (21) for the baseline.
Signal 2: Defaults to VWMA (9) for the fast trigger.
Bollinger Bands: Enabled by default (2.0 Deviation, 20 Length).
Visuals: Fully customizable transparency, colors, and line types.

Simple Volume IndicatorVolume is an important indicator in technical analysis because it is used to measure the relative significance of a market move.
The higher the volume during a price move, the more significant the move and the lower the volume during a price move, the less significant the move.
here i made some changes using Significant volume which helps to see the Price moment
Black = Unconsumed Selling
Blue = Exceptional Buying Strength
Yellow = Demand Strength
The Supply–Demand Battle
Think of it like this:
Black bar = supply waiting to be absorbed.
Blue = demand stepping in to absorb supply.
Yellow = Strength of move
If Black dominate without follow-up blue/yellow, price struggles.
If blue/yelow appear after Black, it signals buyers are winning.

Cumulative Volume Delta (HA Option)# **📘 Ultimate Guide to Trading With CVD Heikin Ashi (CVD+)**
## **🔍 What This Indicator Shows**
This tool plots **Cumulative Volume Delta (CVD)** as candlesticks—optionally transformed into **Heikin Ashi CVD candles**.
Instead of price, each candle represents the *battle between buyers and sellers* within your chosen timeframe.
**Volume Delta = Buying Volume – Selling Volume**
CVD takes all deltas and stacks them cumulatively, showing who is controlling the auction *over time*.
With Heikin Ashi smoothing layered on top, trend detection becomes cleaner, letting you see the “true pressure” behind price moves.
---
# **💡 Why CVD Is a Game Changer**
Most traders only see price.
Serious traders watch **pressure**.
CVD exposes what price hides:
* Absorption
* Hidden accumulation
* Seller exhaustion
* Fake breakouts
* True reversals
* Momentum strength / weakness
* Smart money footprint
When combined with Heikin-Ashi smoothing, you get delta trends with way less noise and fewer fake flips.
---
# **📈 How to Actually Use It (The Edge)**
## **1. Spot True Trend vs. Fake Trend**
If **price goes up** but **CVD goes down**, that’s:
* Passive sellers absorbing
* A weak rally
* High probability of reversal
If **price pulls back** but **CVD keeps rising**, that’s:
* Secret accumulation
* A continuation setup
* Great dip-buy opportunity
**Rule of thumb:**
🔹 *Follow the CVD trend, not the price noise.*
---
## **2. Catch Reversals Early**
Watch for:
### **🔻 Bearish Reversal Signals**
* CVD makes a **lower high**
* Heikin Ashi CVD prints **red bodies with rising upper shadows**
* Price makes one final push up on low delta
This is classic distribution → the drop usually follows fast.
### **🔹 Bullish Reversal Signals**
* CVD forms a **higher low**
* HA CVD flips from red to green with full bodies
* Price still looks weak = bottom forming
This is exactly how pros catch bottoms early.
---
## **3. Identify Absorption Levels**
If price hits a level multiple times but CVD keeps climbing (or falling), that level is being defended.
Example:
* Price stalls at support
* CVD keeps rising
= **Buyers absorbing sells → high-probability bounce**
Opposite works for resistance.
---
## **4. Validate Breakouts**
A breakout with *weak or negative CVD* is usually a trap.
A breakout with **strong, rising HA CVD** is real.
If CVD diverges from the breakout direction → fade it.
If CVD confirms → ride it.
---
## **5. Use Heikin Ashi to Stay in Trends**
HA smoothing removes the nasty chop of raw delta data.
Look for:
* Consecutive **full-body teal candles = strong buying wave**
* Consecutive **full-body red candles = strong selling wave**
* Small-bodied candles after a trend = momentum dying
This keeps you in winners longer and cuts losers faster.
---
# **🎯 Practical Trading Playbook**
### **A) Long Setup**
1. Price pullback into support
2. CVD stays bullish or makes a higher low
3. HA CVD flips green or prints a strong body
4. Enter long
5. Stop under CVD structural low
### **B) Short Setup**
1. Price pushes into resistance
2. CVD forms bearish divergence
3. HA CVD prints red bodies
4. Enter short
5. Stop above CVD swing high
### **C) Chop Filter**
No clear HA CVD trend = avoid trading → stop donating money to the market.
---
# **🧠 Tips for Mastery**
* Use lower timeframe delta (1m–5m) for scalping entries
* Use a higher anchor timeframe (1D) to define direction
* When price trends but CVD is flat → expect a fakeout
* When CVD trends but price is flat → expect a breakout
* Trade WITH delta, fade AGAINST delta
---
# **⚠️ Important Notes**
* Crypto = full tick-by-tick volume → CVD is extremely accurate
* Stocks = depends on your broker/data vendor
* Futures = best signal-to-noise ratio
* If your symbol has no volume → indicator will warn you
---
# **📥 Recommended Settings**
* **Anchor timeframe**: 1D or 4H
* **Lower timeframe**: 1m, 3m, or 5m
* **Heikin Ashi**: ON for trend filtering, OFF for raw delta
---
# **🔥 Final Word**
Price can lie.
Delta usually doesn’t.
CVD + Heikin Ashi gives you the closest thing to reading the market’s heartbeat in real time.
Use it to confirm breakouts, detect reversals early, identify real trend strength, and avoid getting caught in manipulation.
If you learn to read CVD well…
you stop trading price, and start trading the **intent** behind the price.

PLANBXPRESS ENTRYThe Combined Signal + Auto Day Plan + Volume indicator merges multiple professional trading concepts into one visual tool — helping traders identify momentum shifts, entry zones, and daily trading plans with volume confirmation.
It automatically detects trend direction, generates dynamic take-profit & stop-loss levels, and overlays key daily reference points such as VWAP, pivot, support, and resistance zones based on ATR and trend context.
⚙️ Main Components
1️⃣ Signal System
Detects trend bias using SMA-based logic.
Generates entry price, TP1–TP3, and SL dynamically from recent impulse ranges.
Updates signals automatically when trend bias changes or previous targets are hit.
Visual levels are drawn directly on the chart.
2️⃣ Volume Analysis
Compares current volume against a moving average (SMA).
Classifies volume as:
🟢 Strong (above 1.5× average)
🟡 Average
🔴 Weak (below 0.8× average)
Displays the current volume strength and trend bias in an on-chart table.
3️⃣ Auto Day Plan
Uses multi-timeframe ATR calculations to define:
Support / Resistance zones
Pivot & Balance areas
Daily VWAP
Auto Targets (ATR-based expansion levels)
Adapts automatically to selected base timeframe (1H, 4H, or Daily).
4️⃣ Trend Context
Dual EMA system (50 & 200) to confirm bullish/bearish structure.
Aligns expected direction with VWAP & pivot location for context-aware bias.
🎯 What You Get on Chart
📈 Automatic LONG/SHORT signals
🎯 TP1, TP2, TP3, and SL levels
📊 Volume strength meter
🧭 VWAP, pivot, support/resistance & balance zones
🎨 Clean visual layout for intraday and swing traders
🧩 Inputs
Parameter Description
lenImpulse Impulse range length
smaLen SMA length for trend bias
levelRatio SL/TP ratio multiplier
volLen Volume SMA length
baseTF Base timeframe for zones/VWAP
atrMult1 / atrMult2 ATR multipliers for target levels
fwdBars Extension range for future projection
💡 How to Use
Add the script to your chart and choose your preferred timeframe.
Observe signal direction (📈 LONG / 📉 SHORT) and TP/SL levels.
Confirm entries when:
Trend aligns with VWAP direction, and
Volume category shows Strong or Average.
Use Auto Day Plan levels (pivot, balance, VWAP) as intraday reaction zones.

Volume (Custom Timeframe & Color)This indicator displays volume data from a custom timeframe, regardless of the current chart resolution.
The bar color is determined by the price movement of the selected timeframe (green for bullish, red for bearish).
Features:
- Select any custom timeframe for volume (e.g., 5m, 15m, 1h, 1D).
- Volume bars are painted according to the candle direction of that timeframe.
- Useful for multi-timeframe analysis and detecting higher timeframe volume trends.
Inspired by TradingView’s built-in Volume indicator, but enhanced with custom timeframe and consistent coloring.

Volume Surge Detector[SpeculationLab]Volume Surge Detector
This tool is especially useful for spotting early signs of breakouts, news-driven spikes, or institutional activity that are often preceded by abnormal surges in volume.
For better chart readability, the volume bar colors are based on TradingView’s original Volume indicator, while all other code is fully original by Speculation Lab.
You can customize both the SMA line and the volume bar colors to fit your style.
The logic compares the current volume against its SMA (default length: 14, fully adjustable).
The script comes with two surge levels:
Surge Level 1 (default = 5) → When volume is more than 5× the SMA, the bar turns aqua.
Surge Level 2 (default = 10) → When volume is more than 10× the SMA, the bar turns yellow.
It also includes built-in alerts, so you’ll be notified instantly whenever a surge is detected.
This makes it easier to spot potential breakout moves or large market participation in real time.
Disclaimer: This script is for educational purposes only. It does not provide financial advice.
这是一个用于探测 成交量爆发 的指标。
为了图表美观,成交量柱的颜色借鉴了 TradingView 原始 Volume 指标,其余代码均为 Speculation Lab 原创。
用户可以自由调整成交量柱和其对应的 SMA 均线的颜色。
指标通过对比成交量和其 SMA(默认长度为14,可自定义长度和颜色)的比例来检测放量。
默认设置了两个放量级别:
Surge Level 1(默认=5):当成交量超过均量的 5 倍时,量柱变为水蓝色。
Surge Level 2(默认=10):当成交量超过均量的 10 倍时,量柱变为黄色。
脚本还设置了 内置警报功能,方便交易者在出现放量时实时收到通知。

VSA-Stopping VolumeVSA Stopping Volume Indicator
Stopping Volume occurs when candles show decreasing body sizes (narrow spreads) while volume steadily increases.
Example chart:
As you see:
3 consecutive candles in same direction (all green OR all red)
Body sizes (spreads) decreasing progressively: Candle 1 > Candle 2 > Candle 3
Volume increasing progressively: Volume 1 < Volume 2 < Volume 3
This pattern indicates price absorption - increased buying/selling pressure but declining price movement, often signaling exhaustion and potential reversal.
Indicator Features
This indicator detects Stopping Volume candlestick clusters with two signal types:
🔹 BUY/SELL Signals: Generated when pattern occurs at support/resistance zones
🔹 Directional Alerts (▲-green, ▼-red): Generated when pattern occurs outside key levels
Trading Guidelines:
⚠️ Auto-drawn S/R zones are reference only - manual level plotting recommended for accuracy
📊 Best for scalping: M5, M10, M15 timeframes
🛡️ Stop Loss: Place beyond the S/R zone you're trading
🎯 Take Profit: Based on your risk management
Key Concept: Volume expansion + price contraction = potential reversal, especially at SnR levels.
Perfect for scalpers looking to catch reversals at critical zones!

Time-Specific Volume AverageA volume indicator based on historic volume.
Checks for the average volume in the past few days at the same time of day. This helps you determine when there is truly volume in the markets.
We will see often see sustained volume above the average during a clear trend. If you see spikes in volume without it being sustained above the average, it is very likely that the trend will die off quickly.
This is very helpful in determining whether to trade based on a trend following system, or a range based system.
Settings are below:
Days to average: Number of days to look back(tradingview has limits depending on your plan)
SMA Length: Number of "volume averages" to look at. Keep this at 1 if you want the average volume at the exact moment in the day. If you increase it, will also average in the past few candles of "volume averages".
SMA Multiplier: Multiplies the SMA by this amount(helps to get higher quality trends)

Intraday Volume by Saurabh Maggoinspired by volume indicator by nitin
Key Features
Dynamic Volume Visualization: Features thicker volume bars with color-coded insights—grey for normal volume (0.5x-1.5x baseline), orange for low volume (<0.5x), blue for Intraday Pocket Pivots (IPP), green for high up volume, and red for high down volume.
Snort Signals: Identifies strong moves with green Bull Snorts (below bars) and red Bear Snorts (above bars), triggered by volume exceeding 2.0x the baseline with significant price action.
Highest/Lowest Volume Markers: Blue squares mark the highest volume bar, and a single orange square marks the first lowest volume bar, aiding trend identification.
Enhanced Table Metrics: A 2x3 table displays Trend Strength (TS, green >100%, red <100%), Buy/Sell Signal (BS, green "Buy", red "Sell", grey "Neutral"), and Net Pressure (NP, green >0%, red <0%), offering a comprehensive view of volume and price pressure, reset daily at 9:15 AM IST.

Breakout Volume PROBreakout Volume PRO
Real + Projected Volume Detection
This advanced volume indicator detects breakouts based on both actual and projected volume, allowing you to anticipate strong market moves before the current candle closes.
🔹 Key Features:
Volume breakout detection based on configurable moving average and multiplier.
Early signal when projected volume exceeds threshold before candle close.
Distinct coloring for bullish, bearish, and early breakout volume.
Customizable volume threshold area and base average.
Compatible with any timeframe, including daily and intraday.
Colors:
🔵 Blue: Bullish breakout
🔴 Red: Bearish breakout
🟠 Orange: Projected breakout in progress
⚪️ Gray: Normal volume
Perfect for identifying accumulation, distribution, or high-volume events that may precede price breakouts.
Enhanced Volume w/ Pocket Pivots, Milestones & LiquiditySure! Here’s a professional and clear **description** you can use when saving or publishing the script on TradingView:
---
## 📄 Script Description: *Enhanced Volume w/ Pocket Pivots, Milestones & Liquidity*
This custom volume indicator enhances the default volume view by combining key institutional-level insights into a single tool. It highlights meaningful volume activity, liquidity conditions, and milestone events to help traders better understand accumulation/distribution and smart money participation.
### 🔍 Features:
* **Color-coded volume bars**:
* 🔵 **Pocket Pivot Volume (PPV)**: Up-day with volume > highest down-day volume of last 10 bars.
* 🟢 **Up Volume**: Up-day with volume > 50-day average.
* 🔴 **Down Volume**: Down-day with volume > 50-day average.
* 🟠 **Dry Volume**: Low-volume bars < 20% of 50-day average.
* ⚫ **Neutral/Other bars**: No significant signal.
* **Volume Milestones**:
* **HVE**: Highest volume ever (20 years lookback).
* **HVY**: Highest volume in the past 1 year (252 bars).
* **HVQ**: Highest volume in the past quarter (63 bars).
* **Projected Volume**:
* Real-time estimate of end-of-day volume based on elapsed session time.
* **Liquidity Metrics**:
* Displays current and 50-day average dollar volume.
* Estimates 1-minute liquidity for large-position feasibility.
* **Relative Volume Label**:
* Displays how today’s volume compares to the 50-day average.
* **Alerts Included**:
* Set alerts for HVE, HVY, and HVQ to catch key breakout or climactic volume events.
---
### 🧠 Ideal For:
* Growth stock traders
* Volume/price analysts
* Intraday & swing traders
* Institutions or prop traders needing liquidity benchmarks
---
Let me know if you'd like a short or promotional version (for sharing with others).

Hidden Gap`s VSA Volume Auto-TimeframeHidden Gap's VSA Volume with Auto-Timeframe Adaptation
Enhanced Version of Classic Volume Spread Analysis Indicator
Description:
This evolved version of the original "Hidden Gap's VSA Volume" indicator introduces intelligent timeframe adaptation while preserving its core Volume Spread Analysis (VSA) logic. The key enhancement automatically synchronizes volume calculations with your chart's current timeframe, eliminating manual resolution adjustments.
New Features:
✅ Auto-Timeframe Detection
Dynamically adjusts to any chart timeframe (1M/5M/1H/4H/D/W/M)
✅ Smart Resolution Switching
Seamlessly works across multiple timeframes without parameter changes
✅ Manual Override Option
Retains custom resolution input for multi-timeframe analysis (e.g., view weekly volume on daily charts)
✅ Modernized Engine
Upgraded to Pine Script v6 for optimal TradingView performance
Core Functionality Preserved:
• Multi-layer volume analysis using 40/20/2-period comparisons
• Color-coded histogram detecting:
Black: 40-period high volume
Gray: 20-period low volume
Purple: 2-period volume contraction
Blue/Red: Immediate volume changes
• Integrated 20-period SMA reference line
Usage Scenarios:
Intraday Trading: Auto-adjusts from 1-minute to 4-hour charts
Multi-Timeframe Analysis: Compare current volume against higher timeframe patterns
Swing Trading: Maintain consistent analysis across D/W/M timeframes
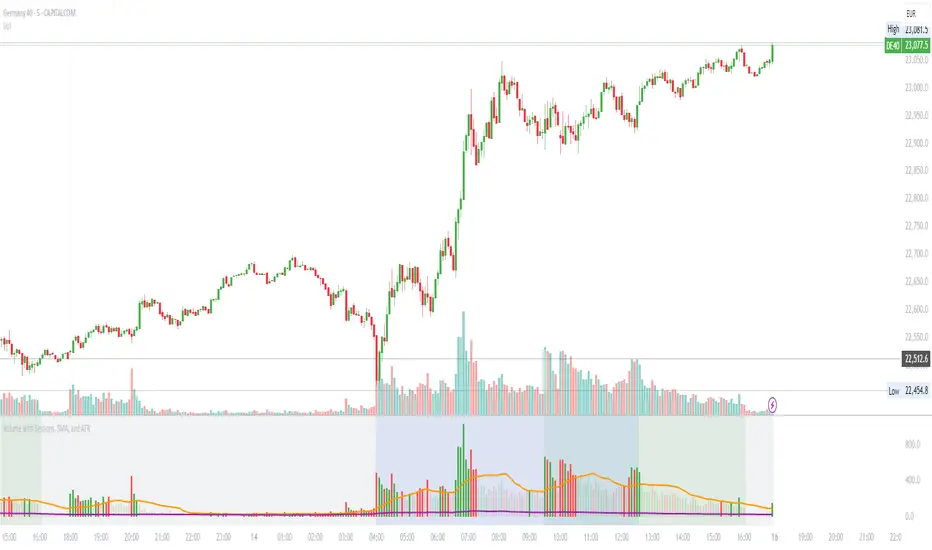
Volume with Sessions, SMA, and ATR Pine Script creates a custom volume indicator with several features, including:
SMA of Volume: It calculates the simple moving average (SMA) of the volume, which helps identify trends and determine if the current volume is above or below the average.
ATR (Average True Range): It calculates the ATR, which measures market volatility over a defined period.
Bullish/Bearish Volume Coloring: The script colors the volume bars depending on whether the price is moving up (bullish) or down (bearish), and whether the volume is above or below the SMA of volume.
Session Highlighting: It defines two major trading sessions:
NYSE (New York Stock Exchange) session from 9:30 AM to 4:00 PM Eastern Time.
LSE (London Stock Exchange) session from 8:00 AM to 4:30 PM GMT. These sessions are highlighted with background colors for easy identification.
Plotting: The volume is plotted as a histogram with varying colors depending on price movement and volume relative to its SMA. The ATR is also plotted as a purple line, and the SMA of volume is displayed as an orange line.
Background Colors: Background colors are applied during the NYSE and LSE sessions to visually differentiate between these trading periods.
Here's a breakdown of each section:
Key Inputs:
smaLength and atrLength: User-defined values for the lengths of the SMA and ATR calculations.
Main Calculations:
smaVolume: The SMA of the volume over the user-defined length (smaLength).
atrValue: The Average True Range over the user-defined length (atrLength).
Color Logic for Volume Bars:
If the current close is higher than the previous close, the volume is considered bullish, and the bar is colored green. If the volume is above the SMA, it’s a darker green; otherwise, it’s a lighter shade.
If the current close is lower than the previous close, the volume is considered bearish, and the bar is colored red. If the volume is above the SMA, it’s a darker red; otherwise, it’s a lighter red.
Plotting:
The script plots the volume as a histogram with dynamic coloring.
The SMA of the volume is plotted as a line.
ATR is plotted as a purple line for reference.
Background Color Highlighting:
The background is colored green during the NYSE session and blue during the LSE session.
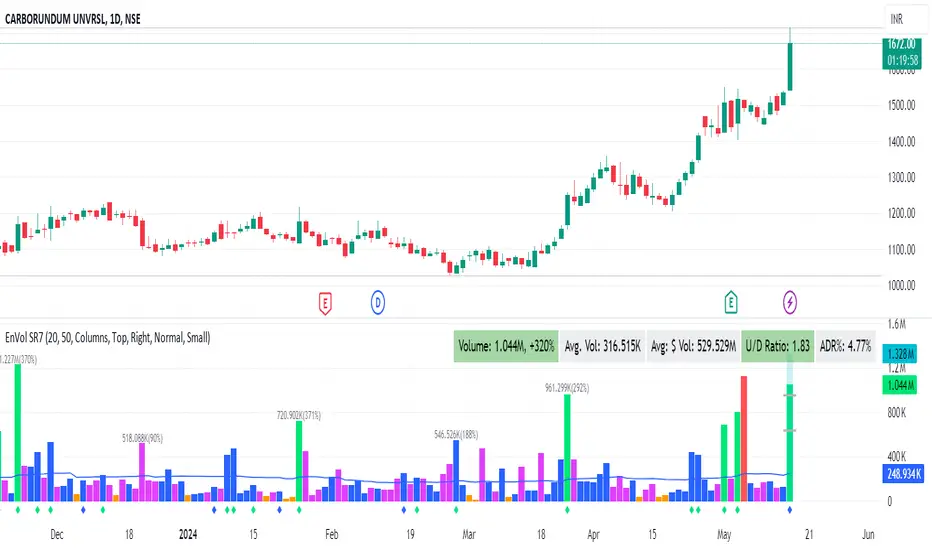
Pivot P/N VolumesTitle: Pivot P/N Volumes
Short Title: PPNV
Description:
The "Pivot P/N Volumes" indicator is a minimalistic volume analysis tool designed to cut through market noise and highlight key volume events in a separate pane. It strips away conventional volume clutter, focusing on four distinct volume types with clear visual cues, making it ideal for traders seeking actionable insights without distractions.
Key Features:
Blue Bars: Pocket Pivot Volumes (PPV) - Up-day volumes exceeding the highest down-day volume of the last 10 down-days, signaling potential bullish strength.
Orange Bars: Pivot Negative Volumes - Down-day volumes greater than the highest up-day volume of the last 10 up-days, indicating significant bearish pressure.
Red Bars: Down-day volumes above the 50-period EMA of volume, highlighting above-average selling activity.
Green Bars: Up-day volumes above the 50-period EMA of volume, showing above-average buying interest.
Noise: All other volumes are muted as dark grey (down-days) or light grey (up-days) for easy filtering.
RVOL Color-Coded VolumeRVOL Color-Coded Volume Indicator
This tool visualizes volume intensity through color-coded bars in a separate panel, making it easy to identify significant market moves driven by unusual volume.
Key Features:
- Displays volume bars with varying colors and intensities based on RVOL (Relative Volume)
- Shows a customizable moving average line for volume reference
- Includes alert conditions for different RVOL thresholds
Color System:
Blue shades (Bullish):
- Light: Normal volume (RVOL < 1)
- Medium: Above average volume
- Dark: Heavy buying volume
- Solid: Extreme volume surge
Pink shades (Bearish):
- Light: Normal volume (RVOL < 1)
- Medium: Increased selling
- Dark: Heavy selling
- Solid: Extreme selling pressure
Gray shades (Neutral):
- Used when opening and closing prices are equal
- Intensity varies with RVOL level
Additional Features:
- Dotted threshold lines for easy reference
- Background highlighting for extreme volume events
- Data window shows exact RVOL values
- Multiple alert conditions for volume thresholds
The indicator helps traders spot potential trend changes and momentum shifts by highlighting unusual volume patterns without interfering with price analysis.

Modified Volume IndicatorThis indicator colors volume bars based on price and range conditions for a given period:
Green Bars:
The close is at least 70% of the way up the daily range (from the low).
The close is also 1% or more above the low.
Red Bars:
The close is at least 70% of the way down the daily range (from the high).
The close is also 1% or more below the high.
Gray Bars:
Volume bars that don’t meet the above conditions are neutral.
Purpose
Green Bars highlight strong upward closes.
Red Bars indicate weak downward closes.
Gray Bars show neutral or inconclusive price movement.
This indicator helps traders identify momentum shifts and trend strength in real-time.
5x Volume indicator - Day Trading5x Volume Screener - Day Trading
Version: 6.0
Description:
This indicator is designed to identify significant volume spikes in crypto and stock markets,
specifically targeting instances where volume exceeds 5x the average of a 10-period Simple Moving Average (SMA) as the baseline.
Perfect for day traders and momentum traders looking for high-volume breakout opportunities.
Key Features:
Tracks real-time volume compared to 5-period moving average
Visual alerts through green histogram bars for 5x volume spikes
Dynamic volume ratio display showing exact multiple of average volume
Clear threshold line for quick reference
Optional labels showing precise volume ratios
Benefits:
Instantly spot unusual volume activity
Identify potential breakout opportunities
Validate price movements with volume confirmation
Perfect for day trading and scalping
Works across multiple timeframes
Best Used For:
Day trading setups
Breakout trading
Volume confirmation
Momentum trading
Market reversal identification
Created by: CigarSavant
Last Updated: December 2024

AndreundCristianIndicator Overview:
The "Trade Signals with Volume" indicator is a custom script that generates buy and sell signals based on the crossover of two moving averages (a fast one and a slow one) and adds a volume filter to validate these signals. It plots these signals directly on the chart, using arrows or labels to indicate where buy and sell signals occur.
Key Features:
Moving Averages (MA):
The indicator uses two Simple Moving Averages (SMA): a fast SMA and a slow SMA.
A buy signal is triggered when the fast MA crosses above the slow MA, signaling potential bullish momentum.
A sell signal is triggered when the fast MA crosses below the slow MA, indicating potential bearish momentum.
Volume Filter:
To ensure that signals are more reliable, the indicator only triggers a buy or sell signal if the volume is above a certain threshold. This threshold can be adjusted by the user in the input settings.
For example, if the volume exceeds 100,000 (or any set value), and a crossover occurs, the signal is validated.
Visual Representation:
Buy signals are represented with green labels or arrows below the price bars.
Sell signals are represented with red labels or arrows above the price bars.
The MAs are also plotted on the chart for visual reference.
Input Parameters:
Fast Moving Average Length: The number of periods for the fast SMA (default is 9 periods).
Slow Moving Average Length: The number of periods for the slow SMA (default is 21 periods).
Volume Threshold: The minimum volume required to validate a buy or sell signal (default is 100,000).
Enhanced Volume by SR7SiddharthaRay007's Enhanced Volume Indicator works on any Timeframe
⦿ Volume Labels:
1. Current Volume, Volume Change%, Average Volume, Average Doller Volume, Up/Down Ratio, ADR%.
=>Average value can be changed using 'Lookback Length' (Default: 20)
⦿ Simple Moving Average: MA (Default: 50). Color of MA changes based on the up down volume ratio.
1. Up/Down Ratio > 1: Blue
2. Up/Down Ratio < 1: Orange
⦿ Volume Bar Colors:
1. High Relative Volume Positive Candle: Lime Green .
2. High Relative Volume Negative Candle: Red .
3. Normal Volume Positive Candle: Blue .
4. Normal Volume Negative Candle: Fuchsia .
5. Low Relative Volume Positive/Negative Candle: Orange .
=>High Relative Volume > 300% of Average Volume; Low Relative Volume < 30% of Average Volume
⦿ Pocket Pivot (A pocket pivot is an up day with volume greater than any of the down days volume in the past 10 days)
1. 10 day Pocket Pivots: Lime Green Diamond below volume bar
2. 5 day Pocket Pivots: Blue Diamond below volume bar
⦿ 'Highest Volume (HV) ' on top of the Volume Bar:
1. Highest Volume Ever (HVE)
2. Highest Volume in Over a Year (HVY)
⦿ Projected Volume Bar: Aqua
⦿ Plot a line at 2x and 3x Average Volume and set Alerts
Relative Volume (RV)Relative Volume take the volume at a given time of day and compares it to the average volume at that time of day. You can either use the current volume or the cumulative volume in this analysis. You have the option to either see the average and the current volume or a comparative view where you see the percent difference between now and the average.
My implementation of relative volume uses a key-value pair to simplify the process of getting the average volume for the time of day. This reduces the lines of code needed and makes it easier to understand. I have added the normal features you would find in a relative volume indicator with the addition of an average above/below average section for comparing the significance of above/below average moves are. I hope this script is not only useful but educational.
Enjoy
