Gold Smart Scalper V3 - Clean ChartOverview
The Gold Smart Scalper V3 is a trend-following momentum strategy specifically optimized for XAU/USD (Gold). It focuses on catching "value pullbacks" within a strong trend, avoiding the noise of sideways markets. Unlike many scalpers that use lagging indicators for exits, this version uses fixed ATR-based targets to lock in profits during high-volatility moves common in Gold.
Core Methodology
The strategy operates on three layers of confirmation:
Macro Trend (HTF Filter): Uses a 50-period EMA to ensure trades are only taken in the direction of the higher-timeframe momentum.
The Value Zone: Instead of "chasing" green or red candles, the script waits for a pullback to the space between the 9 EMA and 21 EMA. This ensures a better risk-to-reward entry point.
The Trigger: A trade is only executed when price confirms the resumption of the trend by crossing back over the signal EMA after the pullback.
Key Features
Fixed Profit Targets: Replaced dynamic trailing stops with fixed Take Profit (TP) and Stop Loss (SL) levels based on ATR, ensuring exits aren't "hunted" by Gold's signature volatility spikes.
C lean Chart Interface : All moving average plots are hidden. The only visuals provided are the active TP/SL levels when a trade is live, keeping your workspace clutter-free.
Single-Trade Logic: The script includes a "One Trade Per Cross" gate, preventing the strategy from over-trading or "stacking" positions during choppy price action.
Settings & OptimizationATR Multipliers :
Stop Loss (SL): Default $2.0 \times ATR$. Protects against standard market noise.Take Profit (TP): Default $3.0 \times ATR$. Designed for a high Risk/Reward profile.Timeframe Recommendation: Optimized for 15m and 1H for swing scalping, or 5m for aggressive scalping.Instrument: Specifically tuned for Gold (XAU/USD), but applicable to other high-volatility pairs like GBP/JPY or NASDAQ.
Disclaimer
This script is for educational and backtesting purposes only. Past performance does not guarantee future results. Always practice proper risk management.
"trigger" için komut dosyalarını ara

Daytrading Suite: Neon TPO + FVG v6.1Here is the summary of the code and the trading guide in English.
---
### 1. Code Summary: What does the chart show?
The script combines three dimensions of trading into a single chart:
* **The Context (TPO / Market Profile - Yesterday):**
* **Gold Zone (Center):** Yesterday's **POC (Point of Control)**. This was the "fairest price". It often acts as a magnet.
* **White Dashed Lines:** The **VAH (Value Area High)** and **VAL (Value Area Low)**. Yesterday, 70% of all trading volume happened between these lines. This is the area of "Balance".
* **The Structure (HTF - 1 Hour+):**
* **Red/Green Boxes (Right Edge):** Automatic **Supply & Demand Zones** based on the 1-hour chart (or your setting). They indicate major resistance and support levels.
* **The Timing (Entries):**
* **Neon FVG Boxes (Small):** "Fair Value Gaps". These represent imbalances in price. If price revisits these, it is often your **entry signal**.
* **Lines (VWAP, EMA, PDH/PDL):** Act as dynamic support and trend indicators.
---
### 2. Trading Strategy: How to use it
Do not just trade every colored spot. You must combine **Location (TPO)** with **Signal (FVG)**.
#### Step A: The Open (Where are we?)
In the morning (or at the US Open), check where the price is relative to the **white TPO lines**.
1. **Inside the White Lines (In Balance):**
* The market is undecided. Expect ranging/choppy behavior.
* **Strategy:** Buy at the bottom edge (VAL), Sell at the top edge (VAH). The target is often the Gold Zone (POC) in the middle.
2. **Outside the White Lines (Imbalance):**
* The market is seeking new prices. Danger of a Trend!
* **Strategy:** If price breaks above VAH and tests it from above -> **Long**. If it breaks below VAL -> **Short**.
#### Step B: The Setup (The High Probability Scenario)
Here is the "Rejection" Setup (Long Example):
1. Price drops to the lower white line (**VAL**) or into a green **Demand Zone**.
2. It bounces (shows a wick).
3. In the process, a small **green Neon FVG** is formed.
4. **Entry:** Limit Order at the top of the Neon FVG.
5. **Target:** The Gold Zone (POC) or the upper white line (VAH).
6. **Stop Loss:** Below the recent swing low.
#### Step C: Warning Signals (When NOT to trade)
* **In "No Man's Land":** If the price is sitting right in the middle between Gold (POC) and White (VAH/VAL), do nothing. The risk is 50/50. Wait until price hits an edge.
* **Against the Flow:** If EMA 9 and 21 are pointing steeply downwards, do not buy blindly at the VAL just because the line is there. Wait for confirmation (FVG).
### Pre-Trade Checklist:
1. **Level:** Am I at a white line (VAH/VAL) or the Gold Zone (POC)?
2. **Structure:** Do I have an HTF Demand/Supply Zone backing me up?
3. **Trigger:** Do I see a Neon FVG pointing in my direction?

Kinetic RSI [Vel + Accel] + AlertsThe Problem with Standard RSI
Most traders use the Relative Strength Index (RSI) to see if a market is "Overbought" (above 70) or "Oversold" (below 30). The problem? A strong trend can stay overbought for days, burning short sellers, or an asset can stay oversold while price continues to crash. Standard RSI tells you where the price is, but it doesn't tell you how hard it is moving.
The Solution: Kinetic RSI
This script reimagines RSI by applying basic physics concepts: Velocity and Acceleration.
Instead of asking "Is RSI below 30?", this indicator asks: "Is RSI below 35 AND did it just make a violent, high-speed turn upwards?"
It filters out lazy, drifting price action and only signals when momentum is accelerating in a new direction.
How It Works (The Math)
Velocity: We calculate the speed of the RSI change (Current RSI - Previous RSI).
Acceleration: We calculate if that speed is increasing (Current Velocity - Previous Velocity).
The Trigger: A signal is only generated if the RSI is in an extreme zone (<35 or >65) AND it has high Velocity AND positive Acceleration.
How to Trade It
1. The "Kick" Signals (Background Highlights)
🟢 Green Background (Bullish Kick): The RSI was low, but buyers stepped in aggressively. The momentum is not just positive; it is accelerating upward. This is often a "V-Bottom" catch.
🔴 Red Background (Bearish Kick): The RSI was high, but sellers slammed the price down. Momentum is accelerating downward.
2. The Line Color
Lime Line: Velocity is positive (Momentum is rising).
Fuchsia Line: Velocity is negative (Momentum is falling).
Usage: If the background flashes Green (Buy Signal), but the line turns back to Fuchsia (Red) a few bars later, the move has failed—exit the trade.
Settings & Alerts
RSI Length: Standard 14 (Adjustable).
Velocity Threshold: Controls sensitivity.
Lower (e.g., 2-3): More signals, catches smaller reversals.
Higher (e.g., 5+): Fewer signals, catches only massive "shocks" to the price.
Alerts Included: You can set alerts for "Bullish Kick," "Bearish Kick," or "Any Kick" to get notified of volatility spikes.
Best Practices
Wait for the Close: This indicator measures the closing velocity. Always wait for the bar to close to confirm the background color signal.
Trend Filtering: This works best as a "Reversal" indicator. If the market is in a super-strong uptrend, ignore the Bearish (Red) signals and only take the Bullish (Green) dips.

UK100 London Judas & IFVG SetupUK100 London Judas & IFVG Setup
Overview This indicator is a specialized trading tool designed to automate the ICT Judas Swing strategy specifically for the UK100 (FTSE 100) index during the London Market Open. It combines institutional time-based logic with price action confirmation using Inversion Fair Value Gaps (IFVG) to identify high-probability reversal setups.
How It Works The strategy is based on the concept that the initial move after the London Open is often a "fake-out" (manipulation) designed to trap retail traders and engineer liquidity before the true trend of the day begins.
Session & Opening Price:
The script marks the London Open price (default 09:00 Warsaw / 08:00 London time) with a dashed line.
This serves as the "line in the sand." Prices moving away from this line initially are monitored for manipulation.
Judas Swing (Liquidity Sweep):
If price moves BELOW the open, it is hunting Sell-Side Liquidity (trapping sellers).
If price moves ABOVE the open, it is hunting Buy-Side Liquidity (trapping buyers).
The Entry Trigger: Inversion FVG (IFVG):
The indicator scans for Fair Value Gaps (FVG) created during the manipulation phase.
BUY Signal: The price manipulates lower, creates a Bearish FVG (Red Box), but then aggressively reverses and closes ABOVE that gap. The gap is now "Inverted" (turns Green), acting as support.
SELL Signal: The price manipulates higher, creates a Bullish FVG (Green Box), but then aggressively reverses and closes BELOW that gap. The gap is now "Inverted" (turns Orange), acting as resistance.
Key Features
Automated Pattern Recognition: No need to manually draw gaps. The script detects valid FVG inversions that align with the Judas Swing logic.
Built-in Risk Calculator: The signal labels display the exact Lot Size you should use based on your account balance and risk percentage (default 0.5%). It calculates this dynamically based on the Stop Loss distance.
Institutional Targets: The indicator fetches H1 Fractals (Liquidity) from the 1-hour timeframe and plots them on your 1-minute chart as blue lines. These are your primary Take Profit (TP) levels.
Stop Loss Visualization: Automatically suggests a Stop Loss placement behind the swing high/low of the reversal structure.
How to Use
Timeframe: Set your chart to 1 Minute (1m).
Asset: UK100 (FTSE 100).
Wait: Allow the London session to open. Watch for price to move away from the opening line.
Execute: When a BUY or SELL label appears:
Enter the trade using the Lot Size shown on the label.
Set your Stop Loss at the price shown on the label.
Target the blue H1 Liquidity lines for profit taking.
Settings
Timezone: Set this to your chart/exchange timezone (Default: Europe/Warsaw).
Account Balance: Input your current trading capital (e.g., 100,000) for accurate risk calculations.
Risk Per Trade %: The percentage of your account you are willing to lose if the Stop Loss is hit (Standard: 0.5% - 1.0%).
Contract Size: The value of 1 point movement (Check your broker's specifications. Usually 1 for CFDs).
Alerts You can set a single alert in TradingView to capture all signals. Select the indicator and choose "Any alert() function call". You will receive a notification with the direction (Buy/Sell), Entry Price, and Lot Size.

Squeeze Momentum OscillatorTitle: Squeeze Momentum Oscillator
Description: This indicator is a panel-based oscillator designed to visualize the relationship between market volatility and momentum. Based on the classic TTM Squeeze concept, it helps traders identify periods of consolidation ("The Squeeze") and the subsequent release of energy ("The Breakout").
Originality & Enhancements: Standard squeeze oscillators only show when a squeeze fires (turning from red to green). This enhanced version adds a specific Breakout Validation layer. It changes the center-line dot color to Fuchsia or Blue only if the squeeze release is confirmed by the slope of the 20-period Moving Average, filtering out weak or false fires.
How It Works:
1. The Center Line (Volatility State): The dots along the zero line tell you the current volatility condition:
🔴 Red Dot: Squeeze ON. Bollinger Bands are inside Keltner Channels. Volatility is compressed. The market is charging up.
🟣 Fuchsia Dot: Bullish Breakout. The squeeze has fired upward, and the underlying trend (20 SMA slope) is positive.
🔵 Blue Dot: Bearish Breakout. The squeeze has fired downward, and the underlying trend (20 SMA slope) is negative.
🟢 Green Dot: Squeeze OFF. Normal volatility conditions.
2. The Histogram (Momentum): The bars indicate the strength and direction of the price movement using Linear Regression logic:
Cyan/Green: Bullish momentum. (Darker = weakening).
Red/Maroon: Bearish momentum. (Darker = weakening).
Visual Guide:
Setup: Wait for a series of Red Dots.
Trigger: Look for the first Fuchsia (Bullish) or Blue (Bearish) dot accompanied by an expanding Histogram in the same direction.
Settings:
Feature Toggle: You can turn the "Breakout Colors" (Fuchsia/Blue) on or off if you prefer the classic look.
Sensitivity: Fully customizable lengths and multipliers for Bollinger Bands and Keltner Channels.
Credits: Based on the foundational TTM Squeeze oscillator logic. Linear regression momentum calculation adapted from standard open-source methods. Breakout validation logic added for enhanced reliability.

Smart Money Alpha Signals (Performance Dashboard) Smart Money Alpha Signals: Identifying Market Leaders & Generating Alpha
GMP Alpha Signals (Global Market Performance Alpha) is a specialized analysis tool designed not merely to find stocks that are rising, but to identify "Alpha" assets—Market Leaders that defend their price or rise even under adverse conditions where the market index falls or consolidates.
This indicator visualizes the concept of Comparative Relative Strength (RS) and Smart Money accumulation patterns, helping traders capture profit opportunities even during bearish market phases.
Key Objectives (Purpose)
Alpha Capture: Identifying assets generating 'excess returns' that outperform the market Beta.
Smart Money Tracking: Detecting traces of 'institutional buying' and 'accumulation' that defend prices during index plunges.
Decoupling Identification: Spotting assets moving on independent catalysts or momentum, regardless of the broader market direction.
Stop Hunt Filtering: Distinguishing 'fake drops' where price dips temporarily, but Relative Strength remains intact.
Dashboard Guide
Interpretation of the information panel (Table) displayed on the chart.
Rel. Performance: Shows the excess return compared to the index over the set period. (Positive/Green = Stronger than the market).
Decoupling Strength: The correlation coefficient with the index. Lower values (0 or negative) indicate movement independent of market risk.
Bullish: The count/rate of rising or limiting losses when the index drops sharply (e.g., < -0.5%). (Gold = Market Crash Leader).
Defended: The count/rate of holding support levels when the index shows mild weakness (e.g., < -0.05%). (Gold = Strong Accumulation).
Bench. Defense: The defense rate of the comparison benchmark (e.g., TSLA, ETH). Your target asset must be higher to be considered the sector leader.
Input Options & Settings Guide
You can optimize settings according to your trading style and asset class (Stocks/Crypto).
(1) Main Settings
Major Index: The baseline market index for comparison.
(US Stocks: NASDAQ:NDX or TVC:SPX / Crypto: BINANCE:BTCUSDT)
Benchmark Symbol: A competitor within the sector.
(e.g., Set NVDA when analyzing Semiconductor stocks).
Correlation Lookback: The lookback period for judging decoupling. (Default: 30)
Performance Lookback: The number of bars to calculate cumulative returns and defense rates. (Default: 60)
(2) Dashboard Thresholds
These settings define the criteria for what qualifies as "Defended" or "Bullish".
Performance (Max %): Used to find assets that haven't pumped yet. Signals trigger only when Alpha is below this value.
Defended Logic:
Index Drop Condition: The index must drop by at least this amount to start checking. (e.g., -0.05%)
Asset Buffer: How much the asset must outperform the index drop.
(Example: If Index drops -1.0% and Buffer is 0.2%, the asset must be at least -0.8% to count as 'Defended').
Bullish Logic: Measures resilience during steeper market dumps (e.g., -0.5% drop) compared to the Defended Logic.
Volume Settings: Decides whether to count Defended/Bullish instances only when accompanied by volume above the SMA.
(3) Signal Logic Settings (Crucial)
Customize conditions to trigger alerts. The choice between AND / OR is crucial.
AND: Condition must be met SIMULTANEOUSLY with other active conditions (Conservative/High Certainty).
OR: Condition triggers the signal INDEPENDENTLY (Aggressive/Opportunity Capture).
Performance: Is the relative performance within the threshold? (Basic Filter).
Decoupling: Has the correlation dropped? (Start of independent move).
Bullish Rate: Is the Bullish rate high during market dumps?
Defended Rate (High): (Recommended) Is there continuous price defense occurring? (Accumulation detection).
Defended Rate (Low): (Warning) Has the defense rate broken down? (For Stop Loss).
Defended > Benchmark: Is it stronger than the Benchmark (2nd tier)?
Volume Spike: Has volume surged compared to the average? (Institutional involvement).
RSI Oversold: Is it in oversold territory? (Counter-trend trading).
Decoupling Move: Does the current bar show the "Index Down / Asset Up" pattern?
Min USD Volume: Transaction value filter (To exclude low liquidity assets).

Regime EngineRegime Engine
Overview
Regime Engine is a market regime detection system that classifies price action into bullish, bearish, or neutral states using weighted exponential moving average analysis. Once the regime is identified, the indicator generates buy and sell signals based on Donchian channel breakouts, filtered by ADX trend strength and RSI momentum conditions.
The Money Line
The core of regime detection is the Money Line, a weighted combination of two exponential moving averages. By default, the short EMA (8 periods) receives 60% weight while the long EMA (24 periods) receives 40% weight. This weighting allows the Money Line to be more responsive than a simple long-period average while remaining smoother than a short-period average alone.
The Money Line changes color based on the current regime: green for bullish, red for bearish, and yellow for neutral. This provides immediate visual feedback about the market state.
Regime Classification
The indicator determines market regime by comparing the relative positions of the short and long EMAs while also considering RSI levels to avoid classifying overbought or oversold conditions as trend states.
Bullish regime is identified when the short EMA is above the long EMA and RSI is not in overbought territory. This combination suggests upward momentum that is not yet exhausted.
Bearish regime is identified when the short EMA is below the long EMA and RSI is not in oversold territory. This indicates downward momentum with room to continue.
Neutral regime applies when the EMAs are close together or RSI conditions prevent trend classification. The indicator provides two optional methods for enhanced neutral detection.
Neutral Zone Detection
Markets often transition through periods where trend direction is unclear. The indicator offers two complementary methods for detecting these neutral zones.
The slope method examines the rate of change of the Money Line relative to ATR. When the Money Line is moving slowly (slope below a tolerance threshold), the market is classified as neutral regardless of EMA positioning.
The EMA distance method calculates the percentage distance between the short and long EMAs. When they are within a specified percentage of each other, the EMAs are considered too close to reliably indicate direction.
Either or both methods can be enabled, and if either triggers, the regime is classified as neutral.
Donchian Channel Signals
Buy and sell signals are generated when price interacts with the Donchian channel boundaries. The Donchian channel plots the highest high and lowest low over a lookback period (default 20 bars), offset by one bar to prevent repainting.
Buy signals trigger when price touches or breaks below the lower Donchian band, indicating a potential support level. Sell signals trigger when price touches or breaks above the upper Donchian band, indicating potential resistance.
An optional setting requires the close to confirm the break rather than just the wick, providing more conservative signal generation.
ADX Trend Strength Filter
The Average Directional Index filters signals to ensure they occur during trending conditions. When enabled, signals only fire if ADX exceeds the threshold (default 24), confirming that the market has sufficient directional momentum for breakout trades to succeed.
The indicator uses Wilder's original smoothing method for ADX calculation, providing the traditional interpretation of trend strength values.
RSI Momentum Filter
RSI provides additional signal filtering to ensure entries occur at favorable momentum levels. Buy signals require RSI to be at or below the oversold threshold (default 30), indicating potential exhaustion of selling pressure. Sell signals require RSI to be at or above the overbought threshold (default 70), suggesting exhaustion of buying pressure.
These filters can be disabled for traders who prefer unfiltered Donchian breakout signals.
BBWP Volatility Monitoring
Bollinger Band Width Percentile measures current volatility relative to its historical range. The indicator calculates BB width and ranks it against the specified lookback period (default 252 bars, approximately one trading year).
BBWP above 70% indicates elevated volatility, which may signal trend acceleration or potential reversals. BBWP below 30% indicates compressed volatility, often preceding significant moves. The information panel displays the current BBWP reading with color coding to highlight these conditions.
Signal Cooldown
To prevent signal clustering during extended breakout periods, a configurable cooldown prevents new signals of the same type for a specified number of bars after each signal. This ensures each signal represents a distinct trading opportunity.
Visual Components
The Donchian channel can display shaded bands between the upper and lower boundaries. The shading color reflects the current regime: green for bullish, magenta for bearish, and blue for neutral. This provides at-a-glance context for where price is trading within its recent range.
An ADX strength bar at the bottom of the chart uses color coding: white for weak trend (ADX below 15), orange for ranging (ADX 15-24), and blue for trending (ADX above 24). This matches the trend strength display in the information panel.
Price labels appear at signal locations showing the signal type and entry price. Labels are automatically cleaned up after reaching a configurable history limit to maintain chart performance.
Signal candles are highlighted in blue, making it easy to identify exactly which bars generated signals when reviewing historical performance.
Information Panel
A compact table displays key metrics: current regime bias, trend strength classification, BBWP volatility reading, RSI level, and ADX value. Each metric is color-coded to highlight favorable or unfavorable conditions.
The panel can be positioned at any corner or middle edge of the chart. An alternative label-based display anchored to the chart is also available for those who prefer that format.
Trend Persistence Option
By default, the regime is recalculated on every bar. An optional persistence mode changes this behavior so that the regime only changes on EMA crossovers. This reduces regime flipping during choppy conditions but may delay regime recognition during gradual trend changes.
How to Use
Monitor the Money Line color and information panel for current regime. In bullish regimes, focus on buy signals at the lower Donchian band as potential pullback entries. In bearish regimes, focus on sell signals at the upper band as potential short entries or exit points.
Use the ADX strength indicator to gauge signal reliability. Signals during trending conditions (blue ADX bar) have historically higher success rates than signals during ranging conditions (orange bar) or weak trends (white bar).
Watch BBWP for volatility context. Low BBWP readings suggest a significant move may be developing, while high readings indicate the current move may be overextended.
The combination of regime awareness, Donchian breakout signals, and ADX/RSI filtering provides a structured approach to identifying trading opportunities across different market conditions.
Settings Guidance
The default settings work well for cryptocurrency and forex markets on intraday timeframes. For stocks or longer timeframes, consider increasing the EMA periods and Donchian lookback. The ADX threshold can be adjusted based on the typical ADX range for the traded instrument.
The RSI filter levels can be relaxed (higher oversold, lower overbought) for more signals or tightened for higher-quality but less frequent signals. The cooldown period should be adjusted based on timeframe, with shorter timeframes typically requiring longer cooldown periods.

Crypto Leverage Index(OI Norm. + FR)Crypto Leverage Index (OI Z-Score + Funding Rate Signals)
(A tool for detecting speculative extremes and leverage load in crypto derivatives markets.)
Hello, fellow traders around the globe!
In today's crypto futures market, often perceived as a 'playground for large players' (whales/smart money), catching extreme leverage behavior is crucial for survival. I wanted to come up with an indicator to quickly identify such market extremes by focusing on the two most potent indicators of leveraged action: Open Interest (OI) and Funding Rate (FR). The goal is to ride on the shoulders of the market movers by anticipating their next liquidity-driven actions. hope this helps.
❗ IMPORTANT NOTE: This indicator works exclusively on Perpetual Futures or Swap Charts that provide Open Interest (OI) data.
⚪ Overview
This indicator provides a standardized view of speculative activity by calculating the Open Interest (OI) Z-Score . This score reveals when the current level of open leverage is abnormally high (premium) or low (discount) relative to its historical mean and volatility. The index is also augmented with Extreme Funding Rate Signals , which plot simple White Dots on the chart when derivative positioning (long or short bias) reaches an unsustainable, overheated level. The combination of OI volume and positioning bias offers a good method to identify potential market reversal zones driven by leverage liquidation risks (short/long squeezes).
⚪ Score Components
Open Interest Z-Score (Leverage Load)
The primary component standardizes the Open Interest value over a defined lookback `Period` (default 50). This calculation reveals the statistical deviation of current leverage from the norm.
OI Z-Score = (OI - Mean(OI)) / StDev(OI)
Funding Rate (Positioning Bias)
Calculates the approximate funding rate using a TWAP (Time-Weighted Average Price) of the Perpetual Futures Premium, combined with the standard 0.01% Interest Rate.
⚪ Extreme Condition Detection
OI Z-Score Extremes
* Premium Zone (Red Fill) : OI Z-Score is above the user-defined `Threshold` (default 2.0). Indicates high/overstretched leverage.
* Discount Zone (Green Fill) : OI Z-Score is below the user-defined negative threshold (default -2.0). Indicates low/unwinded leverage.
Funding Rate Extreme Signals (White Dots)
These appear as small White Dots ( · ) plotted at fixed levels within the indicator pane. The position indicates the bias:
* Top Dot (Excessive Longs) : Triggered when Funding Rate is greater than Abnormal Funding Rate Threshold (e.g. 0.03%). Indicates excessive Long positioning/greed and potential for a short-term reversal (Long Squeeze risk). The dot is plotted at the positive `FR Signal Plot Level`.
* Bottom Dot (Excessive Shorts) : Triggered when Funding Rate is lower than -Abnormal Funding Rate Threshold(e.g. -0.03%). Indicates excessive Short positioning/fear and potential for a short-term reversal (Short Squeeze risk). The dot is plotted at the negative `FR Signal Plot Level`.
⚪ Leverage Case Scenarios (Price, OI Dynamics & Context)
The OI Z-Score reflects the premium/discount state of *leverage* (Open Interest) , not the price. The price may not be in a premium or discount area simply because the OI is. OI only indicates the volume of outstanding futures positions. You must observe price action and candlestick patterns alongside the OI movements to determine the true contextual hint. Understanding the relationship between price and Open Interest (OI) change is key to interpreting market movements. The cases listed below represent the most common and thinkable patterns, but do not exhaust all possible market behaviors.
1. Long Build-Up (Price ▲, OI ▲): New long positions enter, confirming the rising trend.
2. Short Build-Up (Price ▼, OI ▲): New short positions enter, confirming the falling trend. Due to the inherently long-biased nature of the crypto market, this scenario is less frequently observed than Long Build-Up.
3. Long Covering/liquidation (Price ▼, OI ▼): Existing longs are closed/liquidated. This activity usually results from Panic Selling or forced long liquidation.
4. Short Covering (Price ▲, OI ▼): Existing shorts are forced to close (Short Squeeze).
5. Long Trap (Price ▲, OI ▲ or ▼): Price rises, but OI suggests new positioning that might be trapping longs. Bearish candle pattern can be often shown with the sweep.
6. Short Trap (Price ▼, OI ▲ or ▼): Warning Sign - Price falls, but OI suggests new positioning that might be trapping shorts.
⚪ Key Input Parameters
OI Z-Score
* Period (Default: 50)
Determines how many recent bars are used to calculate the rolling mean and volatility (standard deviation) of the Open Interest data.
* Z-Score Threshold (Default: 2.0)
The critical level that the OI Z-Score must cross to be considered 'extreme' (overstretched leverage).
Funding Rate
* Abnormal FR Threshold (Default: 0.03)
The absolute percentage value (e.g., 0.03%) that the Funding Rate must exceed or fall below to trigger an extreme signal dot.
* FR Signal Plot Level (Default: 4.0)
Sets the fixed vertical position (Y-level) on the Z-Score chart where the Funding Rate signal dots will appear. (e.g., 4.0 plots the dot at the Z-Score +-4.0 level).
Disclaimer
This script is for educational and informational purposes only and does not constitute financial advice or investment recommendations. Trading cryptocurrencies involves significant risk and you are solely responsible for your own investment decisions, based on your financial situation, objectives, and risk tolerance. The author assumes no liability for losses arising from the use of this indicator.

T-DOW-FLOW: Final Edition
T-DOW-FLOW: Market Structure & Smart Pivot Zones
This indicator is a comprehensive technical analysis tool designed to visualize "Market Structure" based on Dow Theory and precise Supply/Demand Zones. It helps traders identify the true market trend and high-probability reaction levels by analyzing raw price action (ZigZag Pivots) rather than lagging indicators.
The script integrates three core systems:
ZigZag Trend Cloud: Visualizes the market bias (Uptrend/Downtrend).
Smart Pivot Zones (Type 1): Highlights the specific "Wick-to-Body" area of recent pivots.
Auto Density Channels (Type 2): Detects historical support/resistance clusters.
1. ZigZag Trend Identification
Logic: The script utilizes ta.highestbars and ta.lowestbars to detect Swing Highs and Swing Lows.
Trend Cloud:
If the structure creates a Higher High, the background cloud turns Green (Uptrend).
If the structure creates a Lower Low, the background cloud turns Red (Downtrend).
This provides an instant visual filter for "Trend Flow," encouraging traders to trade only in the direction of the dominant market structure.
2. SR Type 1: Smart Pivot Zones (Wick-to-Body)
Unlike standard indicators that draw thin lines at the absolute High/Low, this script focuses on the "Imbalance Zone".
It calculates the price range between the Pivot's Wick and the Pivot's Body (Open/Close) and fills this area with a colored zone.
Why? The area between the wick and body often represents the precise zone where institutional orders were filled, acting as a more reliable support/resistance level than a single price point.
3. SR Type 2: Auto Density Channels
This module scans a significant amount of historical data (default: 300 bars) to find clusters of pivot points.
Areas where multiple pivots align within a specific width are drawn as Channels. These represent strong, long-term psychological levels.
Trend Filter: Check the Trend Cloud color.
Green: Look for Long opportunities.
Red: Look for Short opportunities.
Entry Trigger: Wait for the price to retrace into a Smart Pivot Zone (Type 1) or an Auto Channel (Type 2).
Look for price rejection (wicks) at these zones in the direction of the Trend Cloud.
Structure Confirmation: Use the ZigZag lines and labels (HH, HL, etc.) to confirm that the market structure is still intact before entering.
ZigZag Settings: Adjust the sensitivity of the trend detection.
SR Type 1: Toggle the "Wick-to-Body" fill and choose between Wicks or Bodies as the primary source.
SR Type 2: Adjust the historical loopback period and channel width sensitivity.
This script is for educational and technical analysis purposes only. Past performance does not guarantee future results.
(以下、日本語説明 / Japanese Description)
このインジケーターは、「ダウ理論」に基づくトレンド判定と、精密な「需給ゾーン(Supply/Demand)」を可視化するための市場構造分析ツールです。 遅行指標を使わず、純粋なプライスアクション(ZigZagピボット)に基づいて、機関投資家の意識する価格帯を特定します。
1. ZigZagトレンドクラウド
ロジック: 一定期間の高値・安値を検出し、ダウ理論に基づいてトレンドを判定します。
視覚化: 高値切り上げ(上昇トレンド)なら「緑」、安値切り下げ(下落トレンド)なら「赤」の背景色を表示します。これにより、トレードすべき方向(順張り)を一目で判断できます。
2. SR Type 1: スマートピボットゾーン (Wick-to-Body)
単なる水平線ではなく、ローソク足の**「ヒゲ先」から「実体」までの価格差**をゾーンとして塗りつぶして表示します。
理由: ヒゲと実体の間の領域は、大口の注文が執行された(需給の不均衡が発生した)重要なエリアであることが多く、ピンポイントのラインよりも信頼性の高い反発ゾーンとして機能します。
3. SR Type 2: オート・デンシティ・チャネル
過去の長期間(デフォルト300本)のデータをスキャンし、ピボットが密集している価格帯を自動で「チャネル」として描画します。長期的に意識される強力なレジサポ帯です。
環境認識: 背景のトレンドクラウドの色に従い、目線を固定します。
エントリー: 価格がSRゾーン(Type 1)やチャネル(Type 2)に引きつけて、反発する動きを確認してエントリーします。
構造確認: ZigZagラインとラベル(HH/HLなど)を見て、トレンドが崩れていないことを確認します。

VCP Trendline breakoutThe Signal:
Green Triangles indicate the price is approaching the trendline (Watchlist candidate).
Yellow Triangles indicate the price is very tight against the line (Execution imminent).
The Trigger: When price closes above the Grey Dotted Line, the line stops extending. This is your breakout signal.
Indicator Overview
The The VCP Trendline breakout indicator is a sophisticated technical indicator designed for trend followers and breakout traders (O'Neil, Minervini, Wyckoff styles). This script employs a State Machine logic to identify structural Volatility Contraction Patterns (VCP) in real-time.
It automatically detects valid Bases, tracks the "Right Side" construction, identifies nested handles (contractions), and draws precise supply trendlines—while strictly enforcing structural integrity rules (Higher Lows).
Core Logic & Features
1. Smart Base Detection
Trend Filter: The pattern recognition engine only activates when the price is above the 200 SMA, ensuring you are trading with the primary trend.
Base Validation: It identifies a "Base High" (H1) based on a configurable lookback period. It tracks the depth of the base and automatically invalidates the pattern if the drawdown exceeds the user-defined threshold (default 30%).
2. Recursive Nested Trendlines (VCP)
The indicator is capable of drawing Nested Trendlines (recursive resistance). It doesn't just draw a line from the peak; it identifies internal contractions within the base.
H1 (Primary): The main supply line from the top of the base.
H2, H3 (Internal): Trendlines connecting subsequent lower highs (handles) as volatility contracts.
Smart Fan: Includes a "Clean Fan" mode to show only the most relevant, latest trendline per anchor point.
3. Structural Integrity Enforcement (The "Higher Low" Rule)
This is the standout feature of this script. It performs an Anchor Integrity Check on every bar.
In a valid VCP, every contraction must form a Higher Low.
If the price creates a new pivot (H3) but then crashes lower than the previous contraction's floor (H2), the script identifies this as a Structural Failure.
Auto-Deletion: It immediately retroactively deletes the invalid trendlines associated with that failed contraction, keeping your chart clean and free of "ghost" signals.
4. "Right-Side" Logic
Collision Detection: Trendlines are calculated using "Right-Side Clearance." A line is only drawn if the path from the anchor to the new pivot is unobstructed by price action.
Signal Protection: "Watch" and "Near" signals are suppressed during the decline phase (Left Side). They only appear once the "Bottom" (L1) has been confirmed and price is recovering on the Right Side.
5. Proximity Alerts & Breakouts
Watch Zone (Green Triangle): Appears when the Low of the bar is within 8% (configurable) of a valid trendline.
Near Zone (Yellow Triangle): Appears when the Low of the bar is within 4% (configurable) of a valid trendline.
Breakout Stop: Trendlines are dynamic. The moment a bar closes above a trendline, the line stops extending immediately, marking the exact breakout point.
How to Use This Indicator
The Setup: Look for a stock in an uptrend (Price > 200 SMA).
The Construction: Wait for the script to identify the Base High (H1). As the price corrects and begins to recover, you will see Grey Dotted Lines appear, connecting the highs.
The Contraction: Watch for Nested Trendlines. If you see a second or third line form from a lower high (H2, H3), it indicates a tightening of price action (VCP).
Settings Configuration
Moving Averages
21 EMA, 50 SMA, 200 SMA: Built-in reference averages.
Base Settings
H1 Lookback: How many bars back the script looks to find the "Start" of the base (Default: 21). Increase this for longer-term bases.
Sub-High Pivot Bars: Controls the sensitivity of identifying internal highs (handles).
Max Base Depth: If the base drops more than this % (Default: 30%), the structure is considered failed and lines are removed.
Enable Nested Trendlines: Toggle ON to see internal VCP lines (H2, H3). Toggle OFF to see only the main H1 trendline.
Show Only Latest Line: Keeps the chart clean by removing older lines from the same anchor point.
Visuals & Signals
Near/Watch Zone %: Adjust the sensitivity of the Green/Yellow triangles.
Signal Size: Change the size of the triangle markers.
DISCLAIMER
This is an indicator, not a trading system. Apply good risk management and do your own due diligence before putting your hard earned money into anything.
This script is for educational and analytical purposes only. It does not constitute financial advice. Automated pattern recognition has limitations and should always be verified visually.

Smart MACD Crossover█ OVERVIEW
Smart MACD Crossover is an indicator designed for traders who trade based on MACD line crossovers. It significantly reduces the number of false crossover signals by adding a breakout-box confirmation mechanism. Price must close outside the box created at the moment of the MACD crossover for a signal to trigger. The script also includes optional scaled MACD lines on the price chart, candle coloring, multi-layer “fog” visualization, fully customizable entry signals, automatic Take Profit / Stop Loss levels and a real-time table.
█ CONCEPTS
Standard MACD crossovers frequently produce noise, especially in ranging markets. Smart MACD Crossover attempts to solve this issue: a horizontal box is drawn at the exact bar where the crossover occurs, and a trade signal is generated only when price actually breaks out of that box. By default, the show_only_matching filter is enabled — signals are shown only when the breakout direction matches the original MACD crossover direction (bullish box → long only, bearish box → short only).
█ FEATURES
Fully configurable classic MACD (default 12/26/9)
Optional MACD & Signal lines scaled and plotted directly on the price chart (show_macd_overlay)
Trend-based candle coloring
One-Side Histogram Fog:
- 6 layers above and 6 layers below hl2
- layer height based on average candle size × offset_mult (default 0.7)
- increasing transparency (base 80 + increment 4) for depth effect
- fully customizable colors
Breakout Boxes:
- created on every MACD crossover
- default height = high-low of the signal candle
- optional extension using average candle size × box_multiplier
- semi-transparent fill (85) with colored borders, extended right until breakout
Signals:
- Triangles or “BUY” / “SELL” labels
- show_only_matching filter (enabled by default) — only direction-consistent breakouts generate signals
- when disabled, every box breakout generates a signal according to breakout direction
- Built-in alerts: BUY and SELL
Take Profit / Stop Loss:
- TP1, TP2, TP3 and SL levels drawn automatically after each confirmed signal
- two modes: Candle Multiplier (based on average candle size) or Percentage
- all multipliers/percentages fully adjustable in “Risk Management Settings”
- real-time table in the top-right corner showing current TP/SL prices
█ HOW TO USE
Add via Pine Editor → paste code → Add to Chart.
Settings overview:
- MACD Settings: lengths and source
- Risk Management Settings: TP/SL mode, multipliers/percentages, average candle period
- MACD Overlay Lines: toggle scaled MACD lines on price chart
- Fog: enable/disable, adjust height and transparency
- Visual Settings: candle coloring
- Boxes: optional size multiplier (use_box_multiplier)
- Signals: choose Triangles or Labels, enable/disable direction filter
Signal meaning:
- Triangle below bar / “BUY” label → upward breakout from a box created after bullish MACD crossover
- Triangle above bar / “SELL” label → downward breakout from a box created after bearish MACD crossover
- Open boxes = pending breakout zones
- Fog below price = bullish pressure, fog above price = bearish pressure
█ APPLICATIONS
The indicator reduces false signals coming from plain MACD crossovers. For additional trend confirmation, the scaled MACD lines can be enabled.
Entry into a position is triggered by the BUY/SELL signal generated after the breakout. The TP1–TP3 and SL levels are drawn automatically only for convenience and as a quick reference – they are fully optional and traders can (and usually should) use their own preferred exit strategies, trailing stops, partial closes, or other money-management methods.
█ NOTES
- Due to MACD line scaling onto the price chart, classic MACD divergences cannot be identified

MACD Forecast Colorful [DiFlip]MACD Forecast Colorful
The Future of Predictive MACD — is one of the most advanced and customizable MACD indicators ever published on TradingView. Built on the classic MACD foundation, this upgraded version integrates statistical forecasting through linear regression to anticipate future movements — not just react to the past.
With a total of 22 fully configurable long and short entry conditions, visual enhancements, and full automation support, this indicator is designed for serious traders seeking an analytical edge.
⯁ Real-Time MACD Forecasting
For the first time, a public MACD script combines the classic structure of MACD with predictive analytics powered by linear regression. Instead of simply responding to current values, this tool projects the MACD line, signal line, and histogram n bars into the future, allowing you to trade with foresight rather than hindsight.
⯁ Fully Customizable
This indicator is built for flexibility. It includes 22 entry conditions, all of which are fully configurable. Each condition can be turned on/off, chained using AND/OR logic, and adapted to your trading model.
Whether you're building a rules-based quant system, automating alerts, or refining discretionary signals, MACD Forecast Colorful gives you full control over how signals are generated, displayed, and triggered.
⯁ With MACD Forecast Colorful, you can:
• Detect MACD crossovers before they happen.
• Anticipate trend reversals with greater precision.
• React earlier than traditional indicators.
• Gain a powerful edge in both discretionary and automated strategies.
• This isn’t just smarter MACD — it’s predictive momentum intelligence.
⯁ Scientifically Powered by Linear Regression
MACD Forecast Colorful is the first public MACD indicator to apply least-squares predictive modeling to MACD behavior — effectively introducing machine learning logic into a time-tested tool.
It uses statistical regression to analyze historical behavior of the MACD and project future trajectories. The result is a forward-shifted MACD forecast that can detect upcoming crossovers and divergences before they appear on the chart.
⯁ Linear Regression: Technical Foundation
Linear regression is a statistical method that models the relationship between a dependent variable (y) and one or more independent variables (x). The basic formula for simple linear regression is:
y = β₀ + β₁x + ε
Where:
y = predicted variable (e.g., future MACD value)
x = independent variable (e.g., bar index)
β₀ = intercept
β₁ = slope
ε = random error (residual)
The regression model calculates β₀ and β₁ using the least squares method, minimizing the sum of squared prediction errors to produce the best-fit line through historical values. This line is then extended forward, generating a forecast based on recent price momentum.
⯁ Least Squares Estimation
The regression coefficients are computed with the following formulas:
β₁ = Σ((xᵢ - x̄)(yᵢ - ȳ)) / Σ((xᵢ - x̄)²)
β₀ = ȳ - β₁x̄
Where:
Σ denotes summation; x̄ and ȳ are the means of x and y; and i ranges from 1 to n (number of observations). These equations produce the best linear unbiased estimator under the Gauss–Markov assumptions — constant variance (homoscedasticity) and a linear relationship between variables.
⯁ Regression in Machine Learning
Linear regression is a foundational model in supervised learning. Its ability to provide precise, explainable, and fast forecasts makes it critical in AI systems and quantitative analysis.
Applying linear regression to MACD forecasting is the equivalent of injecting artificial intelligence into one of the most widely used momentum tools in trading.
⯁ Visual Interpretation
Picture the MACD values over time like this:
Time →
MACD →
A regression line is fitted to recent MACD values, then projected forward n periods. The result is a predictive trajectory that can cross over the real MACD or signal line — offering an early-warning system for trend shifts and momentum changes.
The indicator plots both current MACD and forecasted MACD, allowing you to visually compare short-term future behavior against historical movement.
⯁ Scientific Concepts Used
Linear Regression: models the relationship between variables using a straight line.
Least Squares Method: minimizes squared prediction errors for best-fit.
Time-Series Forecasting: projects future data based on past patterns.
Supervised Learning: predictive modeling using labeled inputs.
Statistical Smoothing: filters noise to highlight trends.
⯁ Why This Indicator Is Revolutionary
First open-source MACD with real-time predictive modeling.
Scientifically grounded with linear regression logic.
Automatable through TradingView alerts and bots.
Smart signal generation using forecasted crossovers.
Highly customizable with 22 buy/sell conditions.
Enhanced visuals with background (bgcolor) and area fill (fill) support.
This isn’t just an update — it’s the next evolution of MACD forecasting.
⯁ Example of simple linear regression with one independent variable
This example demonstrates how a basic linear regression works when there is only one independent variable influencing the dependent variable. This type of model is used to identify a direct relationship between two variables.
⯁ In linear regression, observations (red) are considered the result of random deviations (green) from an underlying relationship (blue) between a dependent variable (y) and an independent variable (x)
This concept illustrates that sampled data points rarely align perfectly with the true trend line. Instead, each observed point represents the combination of the true underlying relationship and a random error component.
⯁ Visualizing heteroscedasticity in a scatterplot with 100 random fitted values using Matlab
Heteroscedasticity occurs when the variance of the errors is not constant across the range of fitted values. This visualization highlights how the spread of data can change unpredictably, which is an important factor in evaluating the validity of regression models.
⯁ The datasets in Anscombe’s quartet were designed to have nearly the same linear regression line (as well as nearly identical means, standard deviations, and correlations) but look very different when plotted
This classic example shows that summary statistics alone can be misleading. Even with identical numerical metrics, the datasets display completely different patterns, emphasizing the importance of visual inspection when interpreting a model.
⯁ Result of fitting a set of data points with a quadratic function
This example illustrates how a second-degree polynomial model can better fit certain datasets that do not follow a linear trend. The resulting curve reflects the true shape of the data more accurately than a straight line.
⯁ What is the MACD?
The Moving Average Convergence Divergence (MACD) is a technical analysis indicator developed by Gerald Appel. It measures the relationship between two moving averages of a security’s price to identify changes in momentum, direction, and strength of a trend. The MACD is composed of three components: the MACD line, the signal line, and the histogram.
⯁ How to use the MACD?
The MACD is calculated by subtracting the 26-period Exponential Moving Average (EMA) from the 12-period EMA. A 9-period EMA of the MACD line, called the signal line, is then plotted on top of the MACD line. The MACD histogram represents the difference between the MACD line and the signal line.
Here are the primary signals generated by the MACD:
• Bullish Crossover: When the MACD line crosses above the signal line, indicating a potential buy signal.
• Bearish Crossover: When the MACD line crosses below the signal line, indicating a potential sell signal.
• Divergence: When the price of the security diverges from the MACD, suggesting a potential reversal.
• Overbought/Oversold Conditions: Indicated by the MACD line moving far away from the signal line, though this is less common than in oscillators like the RSI.
⯁ How to use MACD forecast?
The MACD Forecast is built on the same foundation as the classic MACD, but with predictive capabilities.
Step 1 — Spot Predicted Crossovers:
Watch for forecasted bullish or bearish crossovers. These signals anticipate when the MACD line will cross the signal line in the future, letting you prepare trades before the move.
Step 2 — Confirm with Histogram Projection:
Use the projected histogram to validate momentum direction. A rising histogram signals strengthening bullish momentum, while a falling projection points to weakening or bearish conditions.
Step 3 — Combine with Multi-Timeframe Analysis:
Use forecasts across multiple timeframes to confirm signal strength (e.g., a 1h forecast aligned with a 4h forecast).
Step 4 — Set Entry Conditions & Automation:
Customize your buy/sell rules with the 20 forecast-based conditions and enable automation for bots or alerts.
Step 5 — Trade Ahead of the Market:
By preparing for future momentum shifts instead of reacting to the past, you’ll always stay one step ahead of lagging traders.
📈 BUY
🍟 Signal Validity: The signal will remain valid for X bars.
🍟 Signal Sequence: Configurable as AND or OR.
🍟 MACD > Signal Smoothing
🍟 MACD < Signal Smoothing
🍟 Histogram > 0
🍟 Histogram < 0
🍟 Histogram Positive
🍟 Histogram Negative
🍟 MACD > 0
🍟 MACD < 0
🍟 Signal > 0
🍟 Signal < 0
🍟 MACD > Histogram
🍟 MACD < Histogram
🍟 Signal > Histogram
🍟 Signal < Histogram
🍟 MACD (Crossover) Signal
🍟 MACD (Crossunder) Signal
🍟 MACD (Crossover) 0
🍟 MACD (Crossunder) 0
🍟 Signal (Crossover) 0
🍟 Signal (Crossunder) 0
🔮 MACD (Crossover) Signal Forecast
🔮 MACD (Crossunder) Signal Forecast
📉 SELL
🍟 Signal Validity: The signal will remain valid for X bars.
🍟 Signal Sequence: Configurable as AND or OR.
🍟 MACD > Signal Smoothing
🍟 MACD < Signal Smoothing
🍟 Histogram > 0
🍟 Histogram < 0
🍟 Histogram Positive
🍟 Histogram Negative
🍟 MACD > 0
🍟 MACD < 0
🍟 Signal > 0
🍟 Signal < 0
🍟 MACD > Histogram
🍟 MACD < Histogram
🍟 Signal > Histogram
🍟 Signal < Histogram
🍟 MACD (Crossover) Signal
🍟 MACD (Crossunder) Signal
🍟 MACD (Crossover) 0
🍟 MACD (Crossunder) 0
🍟 Signal (Crossover) 0
🍟 Signal (Crossunder) 0
🔮 MACD (Crossover) Signal Forecast
🔮 MACD (Crossunder) Signal Forecast
🤖 Automation
All BUY and SELL conditions can be automated using TradingView alerts. Every configurable condition can trigger alerts suitable for fully automated or semi-automated strategies.
⯁ Unique Features
Linear Regression: (Forecast)
Signal Validity: The signal will remain valid for X bars
Signal Sequence: Configurable as AND/OR
Table of Conditions: BUY/SELL
Conditions Label: BUY/SELL
Plot Labels in the graph above: BUY/SELL
Automate & Monitor Signals/Alerts: BUY/SELL
Background Colors: "bgcolor"
Background Colors: "fill"
Linear Regression (Forecast)
Signal Validity: The signal will remain valid for X bars
Signal Sequence: Configurable as AND/OR
Table of Conditions: BUY/SELL
Conditions Label: BUY/SELL
Plot Labels in the graph above: BUY/SELL
Automate & Monitor Signals/Alerts: BUY/SELL
Background Colors: "bgcolor"
Background Colors: "fill"

DarkPool's Squeeze Momentum @author LazyBearDarkPool's Squeeze Momentum Pro is a comprehensive overhaul of the classic volatility indicator, designed for the modern trader who requires deeper market insight. While staying true to the core logic of the original TTM Squeeze, this version introduces advanced features like automatic divergence detection, dynamic moving average selection, and main-chart integration to help you time entries and exits with precision.
Credit: This script is built upon the foundational "Squeeze Momentum Indicator" originally developed by LazyBear. This version expands on that legacy with enhanced visualization, alert systems, and divergence logic.
Key Features
1. Advanced Divergence Detection
The indicator automatically scans for Regular Bullish and Regular Bearish divergences between price action and momentum.
Bullish Divergence (Green "BULL" Label): Occurs when Price makes a Lower Low, but Momentum makes a Higher Low. This often precedes a bullish reversal.
Bearish Divergence (Red "BEAR" Label): Occurs when Price makes a Higher High, but Momentum makes a Lower High. This often precedes a bearish reversal.
2. Multi-Mode Squeeze Detection
The central dots on the zero line tell you the state of market volatility:
Red Dot (Squeeze ON): Volatility is compressed. The Bollinger Bands are inside the Keltner Channels. The market is "coiling" and preparing for an explosive move. Do not trade yet—wait for the fire.
Grey Dot (Squeeze OFF): The squeeze has "fired." Volatility is expanding, and price is moving.
Blue Dot (Wide Bands): Volatility is extremely high. The bands are exceptionally wide, often indicating the end of a trend or a period of high risk.
3. "Ghost" Histogram & Visual Depth
The momentum histogram features a "Ghost" fill (transparent background) to help visualize the volume of momentum without cluttering the screen.
Bright Green: Strong Bullish Momentum (Rising).
Dark Green: Weakening Bullish Momentum (Fading).
Bright Red: Strong Bearish Momentum (Falling).
Dark Red: Weakening Bearish Momentum (Recovering).
4. Dynamic Candle Coloring
Enabled by default, this feature colors the candles on your main chart to match the momentum histogram. This allows you to instantly gauge the trend strength without looking down at the oscillator pane.
5. Adaptive Calculation Engines
Unlike standard versions fixed to SMA, you can now select the moving average algorithm that drives the Bollinger Bands and Keltner Channels:
SMA: Standard, stable signals.
EMA: More reactive to recent price action.
WMA/RMA: Weighted options for specific strategies.
🛠 How to Operate
The "Squeeze & Fire" Strategy
Identify the Squeeze: Look for a series of Red Dots on the zero line. This indicates the market is resting and building energy.
The Trigger: Wait for the dot to turn Gray AND for the histogram to expand clearly in one direction.
Long Signal: Squeeze fires (Red -> Gray) + Histogram turns Green.
Short Signal: Squeeze fires (Red -> Gray) + Histogram turns Red.
The "Divergence Reversal" Strategy
Watch for "BULL" or "BEAR" labels appearing near the peaks or valleys of the histogram.
Confirmation: A divergence is a warning. Wait for the histogram color to change (e.g., from Bright Red to Dark Red) before entering a reversal trade.
⚙️ Settings Guide
Basis MA Type: Choose between SMA, EMA, WMA, or RMA to tune the sensitivity of the squeeze.
BB/KC Settings: Fully customizable Length and Multipliers to adapt to different assets (Crypto, Forex, or Stocks).
Pivot Lookback: Controls how strict the divergence detection is. Higher numbers = fewer, more significant signals.
Colour Main Chart Candles: Toggle this OFF if you prefer your standard candle colours.
Disclaimer
Trading involves a high level of risk and is not suitable for all investors. This indicator is a tool for technical analysis and does not constitute financial advice. Past performance is not indicative of future results. Always use proper risk management and do not trade based solely on a single indicator.

MTF Scalper - alemicihanMulti-Timeframe Scalper Strategy: Aligning the Big Picture for Quick Gains
This article presents a robust futures trading strategy designed for high-frequency scalping in the crypto market. It’s built on the principle of minimizing risk by ensuring that short-term entries are always aligned with the dominant, higher-timeframe trend.
The Core Concept: Alignment is Key
A Balanced Trend Follower approach, now refined for rapid scalping, uses a Multi-Timeframe (MTF) confirmation system to filter out market noise and increase the probability of a successful trade.
The strategy operates on a Low Timeframe (LTF) chart (e.g., 3m, 5m, or 15m) but only executes trades if the direction is validated by three Higher Timeframes (HTF).
ComponentPurposeFunctionHTF (D, 4h, 1h) EMA => Trend Confirmation =>Checks if the current price is above/below all three Exponential Moving Averages (EMA 20). This provides a strong directional bias.
LTF (5m) Stochastic RSI => Momentum Entry => Generates the actual buy/sell signal by spotting a swift crossover, indicating fresh momentum in the direction of the confirmed HTF trend.
How The Signal Is Generated
Trend Alignment: The system first confirms the trend. If the price is trading above the Daily, 4-Hour, and 1-Hour EMAs, the market is deemed to be in a Strong LONG Trend. Only LONG signals are permitted.
Momentum Trigger: Once the trend is confirmed, a Long Signal is generated only when the Stochastic K-Line crosses above the D-Line, indicating a momentum shift (a pullback ending) towards the main trend direction.
Short Signal: The inverse logic applies to the Short Trend confirmation and entry signal.
Mandatory Risk Management: ATR-Based Exit
Given the high leverage nature of futures and scalping, static Stop-Loss (SL) and Take-Profit (TP) levels are inefficient. This strategy uses the Average True Range (ATR) indicator to dynamically set profit and loss targets based on current market volatility.
Stop Loss (SL): Set dynamically at 1.5 x ATR below (for long) or above (for short) the entry price. This gives the trade enough room to breathe without risking excessive capital.
Take Profit (TP): Set dynamically at 3.0 x ATR, establishing a robust Risk-to-Reward Ratio of 1:2.
Final Thoughts on Testing
This sophisticated approach combines the reliability of MTF analysis with the speed of momentum indicators. However, data analysis is key. Backtesting these parameters (EMA, ATR Multipliers, RSI/Stochastic lengths) on your chosen asset (like BTC/USDT or ETH/USDT) and timeframe is crucial to achieving optimal performance.

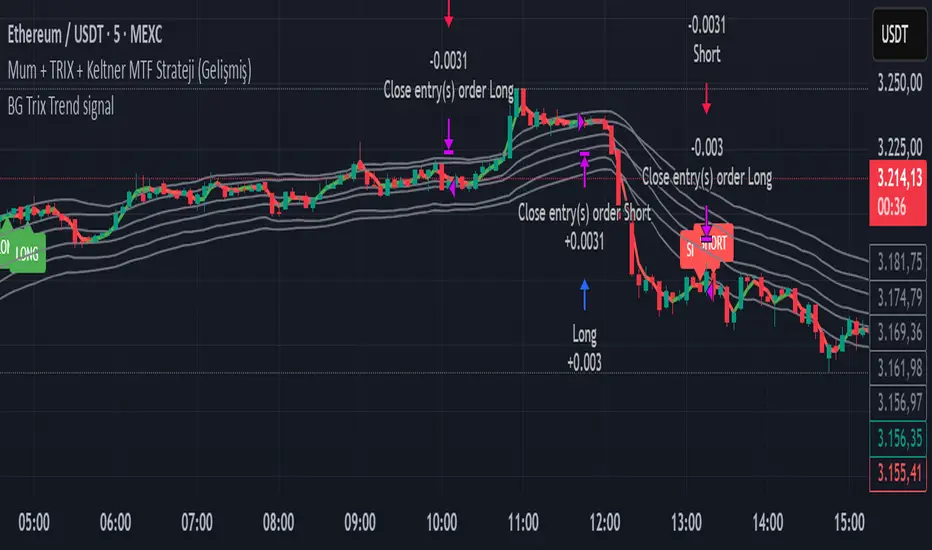
BG Trix Trend signalovides dynamic long and short signals based on a multi-timeframe candle averaging method. It calculates a four-step average of recent candles to determine the trend and changes candle color accordingly (green for upward, red for downward).
Features:
Multi-Timeframe Candle Analysis: Combines current and previous candle data to smooth price action.
Optional TRIX Filter: Adds a TRIX-based trend filter from a separate timeframe. Only triggers signals when TRIX confirms the trend.
Optional Keltner Channel Filter: Prevents signals when the price is inside the Keltner channel. Long signals only trigger above the upper band; short signals only trigger below the lower band. Separate MTF and MA type can be selected for the channel.
Visual Signals: Long and short signals are displayed as arrows on the chart. Candle color reflects trend direction.
Fully Customizable: Users can enable/disable TRIX and Keltner filters and select MA types and timeframes independently.
This indicator is ideal for traders who want clear trend signals while filtering out trades inside key price channels. No exit management is included—signals are purely for entry visualization.
Candlestick toolkit (Candle Over Candle)Candlestick pattern toolkit focused on reading price action via candle anatomy, body dynamics, and a specific 2-bar continuation/reversal pattern.
This indicator highlights:
Long upper and lower wicks (“topping” and “bottoming” tails) that can signal exhaustion or potential reversal.
Large bullish bodies relative to Average True Range (ATR), showing strong momentum.
Sequences of large green candles.
Runs of green candles with strictly increasing or strictly decreasing body size, to visualize acceleration vs. momentum fade.
A two-candle pattern:
“Candle over Candle” (CoC) for long bias: two bullish bars where the first has a small upper wick and the second has a modest lower wick (a brief dip then push higher).
Optional mirrored “Candle under Candle” (CuC) for short bias.
The script labels:
Topping/Bottoming tails (TT/BT).
Large-green sequences and increasing/decreasing bodies (N×LG, ↑B, ↓B).
CoC/CuC pattern bars as “PRE” and the actual breakout bars as “GO”.
While a pattern is “live,” a reference line marks the trigger level (pattern high for longs, pattern low for shorts).
Inputs let you:
Tune wick and body percentage thresholds for tail detection.
Adjust ATR length and the multiplier that defines a “large” body.
Change how many candles are required for large-green sequences and body size trends.
Configure the two-candle pattern (maximum wick sizes, whether a small dip is required, confirmation within N bars).
Choose confirmation mode: close-through the trigger or intrabar wick break.
Enable or disable the short (CuC) side.
Control visual features (tail markers, sequence markers, pattern labels, and background shading on pattern bars).
Typical use:
Apply on intraday or swing timeframes.
Use tails and body behavior to read strength/weakness and potential exhaustion.
Treat CoC/CuC PRE labels as pattern formation, and GO labels as potential trade triggers above/below the pattern.
Combine with your own filters (trend, volume, higher-timeframe levels) rather than using it as a standalone signal generator.

cd_sfp_CxGeneral:
This indicator is designed to assist users who trade the Swing Failure Pattern ( SFP ).
In technical literature (various definitions exist), an SFP is a situation where the price violates a previous swing level but fails to close beyond that level.
• (Liquidity Sweep)
• (Buyer or seller dominance)
• (Stop hunt)
• (Turtle Soup)
The general strategy is built upon seeking trade opportunities after an SFP is formed and conviction is established that the market direction has changed.
Components used to gather confirmation:
• Determining Bias: Periodic SAR
• Obtaining Breakout/Reversal Confirmation: Change in State Delivery (CISD)
• Defining the Buyer/Seller Block (Supply/Demand Zones): Mitg Blocks (Mitigation Blocks), FVG (Fair Value Gaps), and Standard Deviation Projection
• Key Levels: Previous HTF (Higher Time Frame) levels
• Setting Targets: Standard Deviation Projection
• Trade Management: Anchored VWAP and opposing blocks
• Time-Based Context: Session Killzone times
• Notifications: An alarm/alert system will be utilized to stay informed.
________________________________________
Details:
Swing and Swing Failure Pattern:
Swing Sweep Types (Liquidity Sweep):
1. Single
2. Consecutive (The liquidity of the entity that swept the liquidity is being swept)
Bias Determination
We need to filter out the numerous SFPs that occur across all time frames. Our first strong filter will be the Bias. We will only look for trades aligned with our bias.
We will use Periodic SAR (Stop and Reverse) to determine the bias. We compare the price with the SAR value from a Higher Time Frame than the one we are trading on.
• Price > SAR => Bullish Bias
• Price < SAR => Bearish Bias
Depending on the pair, H1 SAR may be chosen for scalp trades, and Daily/Weekly SAR for intraday and swing trades.
Key Levels
Strategies looking for trades after a liquidity grab generally state that the sweep / stop hunt movement should occur at a significant price level.
The most fundamental Key Level levels are (User can customize):
• Previous Week High & Low
• Previous Day High & Low
• Previous H4 High & Low
• Previous H1 High & Low
• Asia Killzone High & Low
• London Killzone High & Low
• New York Killzone High & Low
• Monday Range High & Low values
We will prefer SFP formations that occur when these levels are swept. When Key Levels are violated, an information label appears on the screen.
Blocks / Zones
To strengthen our hand, we will use three types of blocks/zones, either with Key Levels or separately. When an SFP structure is formed in these areas (along with bias and breakout confirmation), our expectation is for the price to continue in our desired direction. These regions are:
1. Mitigation Blocks (Mtg)
o (Details can be found in the cd_VWAP_mtg_Cx indicator)
o In short: A second candle, following a bullish candle, crosses its high but fails to close above it. We call this a sweep / SFP. When the price, which was expected to go to the low, instead makes a new high/close, an Mtg block is formed. (Buyers are dominant)
2. FVGs (Fair Value Gaps)
o We use classic FVG structures.
3. Standard Deviation Projection Boxes
o When we get an SFP structure + breakout confirmation (CISD), we use the Standard Deviation Projection to determine our profit-taking and take-profit levels.
o Based on the idea that the price often respects the range between -2 and -2.5 of the projection values, we box this range and use it as our area of interest. (Our expectation is for the price to reverse after reaching this target).
o Let's mark it on the chart.
Confirmation
To summarize what has been explained so far: we look for the price to form an SFP structure in levels/zones we deem important, aligned with our bias, and for the breakout to be confirmed with a CISD.
No single component is strong on its own, but the success rate increases when they occur together.
We observe the following as additional confirmation along with the CISD: a new Mtg block forming in the direction of the breakout, high-volume movement (with FVG and a large body), and respect for VWAPs, the resistance/support line, and the defense block.
Additional Confirmations with Breakouts:
• Defence block, new mtg and VWAP
• Resistance / Support Line:
Indicator Signals
The indicator marks all formed sweeps, selected key levels, blocks, the projection, and CISD confirmations on the screen. The candle where the CISD confirmation occurs is indicated by an arrow.
• Arrows with double short lines signify a CISD that follows an SFP occurring at a Key Level.
• All other CISD candle indications are shown with single-line arrows.
Trade Management
When selecting profit targets in trades (preferably), the projection, opposing blocks, and structures that have formed are taken into account. Do not neglect to look at the structures that have formed against you when entering a trade.
Menu Settings:
• For Mtg blocks, the trading timeframe or a higher timeframe can be selected.
• FVGs formed in the current timeframe are displayed when the price creates an SFP (in "Fvg" option).
• Deviation boxes are displayed when the price creates an SFP (in box).
• The SAR HTF setting (H1) for scalp trades may vary depending on the pair. Users trying trades on higher timeframes should increase the HTF setting.
o Example: If you are looking for a trade with an SFP structure on H1, the SAR HTF setting should be H4 or higher.
• VWAP lines are refreshed starting from the candle that executed the sweep when the price forms an SFP. The only setting to adjust is the source selection setting (hlc3 is selected).
• Time frames and Killzone / Special Zone settings for Key Levels can be changed/should be checked.
Alarms / Alerts:
The conditions that will trigger an alert can be selected from the menu.
• To receive an alert aligned with the bias, the "Alignment with bias" checkbox must be selected.
• The alert should be set on the timeframe where you plan to enter the trade.
• The display options do not affect the alarm conditions. (Example: FVGs are monitored even when the menu selection is "off").
• If the necessary conditions are met, the alarm is triggered on the new candle that opens after the CISD confirmation.
• The alarm will not be triggered more than once at the same Key Level.
The user can preferably select alerts:
• Bias-aligned or Bias-independent
• Sweep (without waiting for CISD)
• Sweep + CISD (without looking for other conditions)
• Sweep + Key Level + CISD (the swept level is a Key Level)
• Sweep + Mtg / Fvg / Dev. + CISD (SFP formed in any of the blocks)
• Sweep + Mtg + CISD (SFP formed in the Mtg block)
• Sweep + Fvg + CISD (SFP formed inside the FVG)
• Sweep + Deviation Box + CISD (SFP formed inside the Dev. Box)
• Sweep + Key Level + Mtg / Fvg / Dev. + CISD (SFP formed simultaneously at a Key Level and any of the blocks)
Trade Example:
• Conditions: Bias-aligned + Sweep + Mtg/Fvg/Dev (at least one) + CISD
• Extra Confirmations: Respect for the Defense Block + Respect for VWAP
• Target (TP): Projection between -2 and -2.5
I welcome your thoughts and suggestions regarding my indicator, which I believe will be successful in the long run by adhering to uncompromising risk management and a strict trading plan.
Happy Trading!

Robust Scaled Dema | OquantOverview
The Robust Scaled DEMA indicator is a tool designed for traders seeking to identify potential trend directions in financial markets. It combines the smoothing capabilities of a Double Exponential Moving Average (DEMA) with a robust scaling mechanism to normalize the data, making it more resilient to outliers and extreme price movements. This scaling helps in generating long and short signals based on predefined thresholds, visualized through color-coded plots and bars. The indicator aims to provide a balanced view of market momentum, reducing the impact of noise while highlighting significant shifts in price behavior.
Key Factors/Components
DEMA (Double Exponential Moving Average): Serves as the core smoothing component, reducing lag compared to simple averages by emphasizing recent price action more effectively.
Robust Scaling Mechanism: Utilizes statistical measures like median and interquartile range to normalize the DEMA values, ensuring the indicator is less sensitive to extreme values or price spikes.
Thresholds: User-defined upper and lower levels that trigger long or short signals when the scaled DEMA crosses them.
Visual Elements: Includes plotted lines for the scaled DEMA and thresholds, plus color-coded candlestick bars for intuitive interpretation.
Alerts: Built-in conditions for notifying users of potential entry points for long or short positions.
How It Works
The indicator starts by applying a DEMA to the chosen price source to create a smoothed representation of the market's direction. This smoothed value is then scaled using a robust statistical approach that accounts for the distribution of recent DEMA values, centering it around a median and adjusting for variability to minimize the influence of outliers. The resulting scaled metric is compared against user-set upper and lower thresholds: crossing above the upper suggests a bullish momentum (long signal), while dipping below the lower indicates bearish conditions (short signal). A state variable tracks these conditions to color the chart accordingly, helping traders visualize regime changes. Optional alerts fire on transitions.
For Who Is Best/Recommended Use Cases
This indicator is ideal for traders who employ trend-following or momentum-based strategies and need tools that perform well in non-normal market conditions, such as during high volatility or in assets prone to spikes. Use cases include identifying entry/exit points in trending environments, confirming breakouts, or integrating into multi-indicator systems for added confirmation. Quantitative traders or those backtesting strategies will appreciate its customizable parameters for optimization.
Settings and Default Settings
Source: The price data input for calculations, such as close, open, high, or low. Default: close.
DEMA Length: Controls the period for the DEMA smoothing; shorter values increase responsiveness but may add noise, longer ones provide more lag but smoother signals. Default: 25.
Robust Scaling Length: Defines the lookback period for the scaling statistics; affects how adaptive the normalization is to recent data distributions. Default: 40.
Upper Threshold: The level above which a long signal is triggered; higher values make signals rarer but potentially more reliable. Default: 0.5.
Lower Threshold: The level below which a short signal is triggered; lower values allow for more aggressive bearish detection. Default: 0.
Conclusion
The Robust Scaled DEMA offers an outlier-resistant alternative to traditional moving average indicators, empowering traders to navigate volatile markets. By blending exponential smoothing with statistical robustness, it provides actionable insights into trend shifts while minimizing false positives from extreme events..
⚠️ Disclaimer: This indicator is intended for educational and informational purposes only. Trading/investing involves risk, and past performance does not guarantee future results. Always test and evaluate indicators/strategies before applying them in live markets. Use at your own risk.

Pulse RSI | Lyro RSPulse RSI | Lyro RS
The Pulse RSI is a momentum oscillator that enhances the traditional RSI by incorporating volume-weighted price and linear regression. It generates multiple trading signals, including trend shifts, overbought/oversold conditions, and custom threshold levels.
By integrating both price and volume into its calculation, Pulse RSI is more robust and responsive than the standard RSI. This helps you identify trends faster, spot potential reversals sooner, and set up custom alerts based on your own strategy.
Key Features
Four Signal Types:
Type 1 (Trend): Triggers when the indicator's current value crosses its previous value, highlighting short-term momentum shifts.
Type 2 (Midline Trend): The classic midline cross. A bullish bias is indicated above 50, while a bearish bias is indicated below 50.
Type 3 (Overbought/Oversold): Flags potential reversal zones, suggesting where buying or selling opportunities may emerge.
Type 4 (Custom Thresholds): This type lets you define your own threshold levels. Instead of following a trend, use it to mark your specific conditions for a reversal. For example, set a long reversal at a low level (e.g., 5) for an early buy signal, or a short reversal at a high level (e.g., 80) for an early sell signal.
Calculation Method:
The indicator uses a volume-weighted price (Close * High * Low) and applies linear regression to smooth the data. This creates a unique and more stable oscillator, avoiding the chaotic movement seen in others.
Color System:
Choose from multiple color themes like Classic, Mystic, Accented, and Royal, or create your own custom colors for bullish and bearish signals.
Visual Plotting:
Features a clear plot with a glow effect, a midline, adjustable threshold lines, and shapes/labels to mark long/short and overbought/oversold signals.
Alerts:
Instant alerts are available for every signal type, which you can quickly enable based on your trading conditions.
How It Works:
Core Calculation
The indicator calculates a volume-weighted price using (Close * High * Low) multiplied by the absolute volume. This value is then smoothed with linear regression and converted into an oscillator, normalized to a 0-100 scale.
Trading Logic:
Bullish Signals: Trigger when the main plot line crosses above a key level—be it the previous value, the 50 midline, or a custom threshold.
Bearish Signals: Trigger when the main plot line crosses below a key level.
Visual Logic:
The system displays a main plot line, colors candles, and plots signal shapes, all customizable through a variety of color schemes.
Practical Use
Trend Confirmation (Types 1 & 2): Use Type 1 for early momentum shifts and Type 2 to confirm the overall trend direction.
Reversals (Type 3): Consider long entries when oversold signals fire, suggesting an asset is undervalued. Look for exits at overbought signals, which suggest a potential downward reversal.
Custom Thresholds (Type 4): Set tight thresholds to catch early trends and reversals. Be aware that more sensitive settings may also increase false positives.
Customization:
Adjust the Length: A higher setting makes the indicator more suited for long-term trends, while a lower setting makes it more sensitive for short-term moves.
Enable/Disable Signals: Turn the four signal types on or off to match your trading style.
Set Your Levels: Fully adjustable thresholds for Type 4 long/short conditions.
Choose Your Colors: Select from a variety of color schemes for all bullish and bearish elements.
⚠️ Disclaimer
This indicator is a tool for technical analysis and does not guarantee results. It should be used alongside other analysis methods and solid risk management practices. The creators are not responsible for any financial decisions made based on its signals.

Volume Based Ranges (VBR) [SS]Here is the Volume Based Ranges or VBR indicator.
How it works
The indicator works by:
Sorting volume into buying and selling volume, then
Calculating 2 independent Z-Scores for buying and selling data, then
Identifying the high buying and selling nodes through the use of the Z-score threshold.
Tracks the average target/move based on buying and selling nodes over a designated lookforward horizon (i.e. if you want to see the average move a high selling node happens over 20 candles, you can modify the lookforward horizon to 20).
Calculates the composition from each volume node, displaying the composition information on each line (the % of buying and selling each node contains).
How to Use it
To use this indicator:
Select the Z-Score length of assessment: By default, z-score is 75 and this is usually fine to leave.
Identify the threshold trigger: This will need to be adjusted based on your timeframe. If you are using 1 minute, the data is noiser and you want more profound signals. Thresholds generally in this range should be between 5 - 7. For larger timeframes, you want to relax this threshold, to about 2 to 3. You can toggle in increments of 0.5 to find what works the best. Generally you want to see very rigorous volume node signals instead of tons of them.
Determine what you want to see: You can turn of the support and resistance lines and just have the node identification signals and the return boxes. Or, you can just have the support and resistance lines and turn off the return boxes. You can customize the information the indicator displays in the settings menu to suit what you are most interested in.
Let's look at some examples '
DIS on the hourly. We can see that the average up move from the high buying nodes has a target of 115.42, and in between there we can see the high selling and buying nodes and their compositions.
High buying (100% of the high buying volume) is around the 112.61. This means, you would expect this to be an area of retracement.
We can also see that high selling is just below that at 111.66, which can be a resistance area.
Here is a closer look at the levels specifically:
EPAM on the daily:
You can see a successful retrace back to a high volume node.
Concluding remarks
That's the indicator!
Its one that is best to get a feel for, play around and decide on the settings you like for your individual ticker.
I have included tooltip descriptions for the settings within the indicator as well.
I hope you enjoy it and find it helpful!
Thanks for reading/checking it out and as always, safe trades!

VWAP & Band Cross Strategy v6VWAP & Band Cross Strategy v6: Script Summary
This Pine Script implements a highly flexible, multi-layered trading strategy centered around the Volume Weighted Average Price (VWAP) and its associated Standard Deviation Bands.
The strategy is designed to test various entry/exit models based on how the price interacts with the central VWAP line and the upper/lower volatility bands, with extensive risk management and confirmation filters.
1. Core Mechanics (VWAP & Bands)
VWAP Calculation: Calculates the VWAP based on a user-defined source (default is the close price).
Standard Deviation Bands: Creates upper and lower bands by calculating the standard deviation of the price (over 20 periods by default) and multiplying it by a user-defined Multiplier (default is 2.0). These bands dynamically expand and contract with volatility.
Plotting: The script clearly plots the VWAP (purple), the Upper Band (green), and the Lower Band (red), with a colored fill between the bands.
2. Entry Triggers
The core entry logic is based on a single, user-selected cross event between the price and the VWAP/Bands. The user can choose from six predefined entry types:
Entry Type Category
Entry Trigger (Long)
Entry Trigger (Short)
Mean Reversion
Price crosses over the Lower Band.
Price crosses under the Upper Band.
Trend Following
Price crosses over the Upper Band (Breakout).
Price crosses under the Lower Band (Breakout).
VWAP Cross
Price crosses over the VWAP.
Price crosses under the VWAP.
3. Filters and Confirmation
Trades are only executed if they pass a series of optional filters, making the strategy highly customizable:
Technical Confirmation (Optional): Users can enable and configure up to three additional indicators that must align with the trade direction:
RSI: Price must be Oversold (for Long) or Overbought (for Short).
SMMA: Price must be above the SMMA (for Long) or below (for Short).
MACD: MACD line must cross the Signal line and the Histogram must be positive/negative.
Time and Day Filters: Trades are restricted to a defined Entry Start/End Hour/Minute window, and only execute on user-selected Trading Days of the week.
Trade Direction: Can be toggled to execute Long Only, Short Only, or Both.
4. Advanced Risk Management (Daily Limits)
The strategy incorporates robust daily limits that reset at a configured Daily Reset Hour/Minute:
Daily Profit/Loss Limits: If the running total of Realized PnL (closed trades) + Unrealized PnL (open position) exceeds a user-defined Daily Take Profit (in Ticks) or falls below the Daily Stop Loss (in Ticks), the strategy locks out new trades and immediately closes any open position.
Max Daily Trades: Prevents the strategy from entering more than a specified number of trades per day.
5. Exit Logic
The strategy exit is also highly configurable via the Exit Type setting:
Fixed Ticks / ATR / Capped ATR: If one of these is selected, the script calculates a static Stop Loss and Take Profit level upon entry, using either fixed tick values or dynamic values based on the Average True Range (ATR), which are then executed using Pine Script's strategy.exit function.
Cross Exits (VWAP/Bands): If selected, the position is closed when the price crosses the VWAP or a specific band in the opposite direction.
End-of-Day Close: An unconditional exit that closes all open positions at a user-defined Close All Hour/Minute, regardless of profit/loss or limit status, preventing positions from being held overnight.

BTC Confluence Score + Confirmed Signals (12m/1h)This script combines 7 different signals across multiple timeframes (12 min + 1 hour + BTC dominance), then only gives you a BUY or SELL when everything aligns.
It’s designed to filter out fake-outs and help you catch momentum reversals that stick.
WHAT IT’S DOING UNDER THE HOOD
Timeframes
12 min (fast) → short-term trigger (RSI, Stoch RSI, volatility)
1 hour (slow) → trend confirmation (EMA structure, RSI, MACD)
BTC Dominance (1 h) → strength/flow confirmation (is capital rotating into BTC or alts?)
This gives you a multi-timeframe confluence, which is what professional traders look for before entering a trade.
2. The 7 “Score” Ingredients
Each bar gets a “score” from –7 (super bearish) to +7 (super bullish) based on:
# Condition Bullish signal (+1) Bearish signal (–1)
1 RSI (12m) RSI > 50 RSI < 50
2 RSI (1h) RSI > 50 RSI < 50
3 MACD Histogram > 0 Histogram < 0
4 BTC Dominance level > 59.8 % < 59.8 %
5 BTC Dominance trend 3 EMA > 8 EMA 3 EMA < 8 EMA
6 1h EMAs trend 50 EMA > 200 EMA and price > 50 EMA 50 EMA < 200 EMA and price < 50 EMA
7 Volatility (ATR) Current ATR > average (momentum increasing) —
The Confluence Score bar at the bottom shows this numerically:
💚 +5 to +7 → Strong bullish conditions
❤️ –5 to –7 → Strong bearish conditions
🩶 Between –2 and +2 → Choppy / neutral
3️⃣ Confirmed Entry Logic (the clear triangles you see now)
You’ll now see only two real actionable markers:
✅ BUY (Green Triangle Up)
Triggered when:
Stoch RSI crosses upward on 12 min
RSI > 50 (momentum confirmation)
MACD histogram > 0 (trend shift)
Confluence score ≥ 4 (default threshold)
This means momentum + trend + structure + volume all agree on an upward move.
→ Ideal for going long or closing shorts.
🚨 SELL (Red Triangle Down)
Triggered when:
Stoch RSI crosses downward
RSI < 50
MACD histogram < 0
Confluence score ≥ 4 bearish
That’s your exit / short confirmation.
4️⃣ Color Bars (Score Strength)
At the bottom of the chart:
💚 Green Bars = full bullish confluence (+5 or more)
💛 Lime/Orange Bars = moderate bullish or early reversal
❤️ Red Bars = strong bearish confluence (–5 or less)
🩶 Gray Bars = chop/no edge
If you prefer visual simplicity, just use:
BUY = Green Triangle appears on green bars
SELL = Red Triangle appears on red bars
That’s your “double confirmation.”
🎯 HOW TO TRADE IT
⏱ Timeframes
Use 12 min for entries (fast scalps or 1–2 hr setups).
Confirm direction with the 1 hour timeframe — only trade in that direction.
💰 Entry Playbook
Signal What to Do
✅ Green Triangle appears Enter long or scale in. Set stop below recent swing low.
🚨 Red Triangle appears Exit long / enter short / scale out.
Bars gray or alternating Stay out — market is undecided.
🧮 Min Score Setting
Default = 4 (balanced).
Raise to 5 for cleaner, fewer signals.
Lower to 3 for more aggressive, frequent trades.
📲 Alerts
You can now create TradingView alerts using:
BUY Confirmed
SELL Confirmed
Set alert type:
“Once per bar close” — so you only get notified after confirmation, not mid-bar noise.
Y ou now have your own BTC AI Confluence System:
Filters all noise from RSI, MACD, EMAs, volatility, and BTC dominance
Waits for perfect alignment across multiple timeframes
Gives you one simple green (BUY) or red (SELL) signal
Lets you scalp 1–2 % moves safely or swing trade confirmations

4-Hour Range Scalping [v6.3]User Guide: 4-Hour Range Scalping Strategy
Hello! Here is the guide for the Pine Script strategy. Please read it carefully to get the best results.
📈 This script automates the "4-Hour Range Scalping Strategy" from the video.
The main idea is that the first four hours of a major trading day (like New York) set up a "trap zone." The strategy waits for the price to break out of this zone and then fail, giving us a signal that the breakout was false and the price is likely to reverse.
Here’s the simple logic:
Define the Range: It precisely calculates the highest high and lowest low during the first four hours of the selected trading session (e.g., 00:00 to 04:00 New York Time).
Wait for a Breakout: It then monitors the 5-minute chart for a price breakout where a candle fully closes outside of this established range.
Identify the Reversal: The trade trigger occurs when the price fails to continue its breakout and a subsequent 5-minute candle closes back inside the range. This signals a potential reversal or "failed breakout."
Execute the Trade:
]A Short (Sell) trade is triggered after a failed breakout above the range high.
A Long (Buy) trade is triggered after a failed breakout below the range low.
Manage the Risk: The Stop Loss is automatically placed at the peak (for shorts) or trough (for longs) of the breakout move, and the Take Profit is set to a default 2:1 Risk/Reward Ratio.
How to Use the Script (Step-by-Step) ⚙️
Follow these instructions to get it running perfectly.
1. Set Your Chart Timeframe This is the most important step. The strategy is designed to run on a 5-minute (5m) chart. Open your TradingView chart and make sure the timeframe is set to "5m".
2. Add the Script to Your Chart Open the Pine Editor tab at the bottom of TradingView, paste the entire script, and click the "Add to chart" button.
3. Configure the Settings On your chart, find the strategy's name (e.g., "4-Hour Range Scalping ") and click the gear icon ⚙️ to open its settings.
Trading Session: Choose the session for the range. New York is the default and the one from the video.
Risk/Reward Ratio: The default is 2.0, meaning your potential profit is twice your potential loss. You can adjust this to test other targets.
Backtesting Period: To see how the strategy performed on all historical data, go to the "Strategy Tester" panel, click its own gear icon ⚙️, and uncheck the boxes for "Start Date" and "End Date."
4. Understand the Visuals on Your Chart
Blue Background Area: This is the 4-hour calculation window. The script is identifying the day's high and low during this time. No trades will ever happen here.
Red Line (Range High): The highest price of the 4-hour window. This is the upper boundary of the "trap zone."
Green Line (Range Low): The lowest price of the 4-hour window. This is the lower boundary.
Green Triangle (▲): Shows where a Long (Buy) trade was entered.
Red Triangle (▼): Shows where a Short (Sell) trade was entered.
A Very Important Note on Timezones 🕒
This is critical for you in the Philippines (PHT).
The script is based on the New York session, which is 12 hours behind you. Your TradingView chart will still show your local time, but the script works on NY time in the background.
The New York "day" begins at 12:00 PM (Noon) your time.
The script's blue calculation window will be from 12:00 PM to 4:00 PM your local time.
The red and green range lines will appear on your chart only after 4:00 PM your time.
So, if you look at your chart in the morning or early afternoon, you will not see today's range yet. This is normal! The script is just waiting for the New York session to start.
How to Set Up Trade Alerts 🔔
You can have TradingView send you a notification whenever the script enters a trade.
Click the "Alert" button (looks like a clock) in the right-hand toolbar of TradingView.
In the "Condition" dropdown, select the name of the script (e.g., "4-Hour Range Scalping...").
You will then see two options: "Long Signal" and "Short Signal".
Select one (e.g., "Long Signal") and configure how you want to be notified (e.g., "Notify on app").
Click "Create". Repeat the process to create an alert for the other signal.
⚠️ Important Disclosure
For Educational and Research Purposes Only.
This script and all accompanying information are provided for educational and research purposes only. The strategy demonstrated is a technical concept and should not be misconstrued as financial, investment, legal, or tax advice.
Trading financial markets involves substantial risk and is not suitable for every investor. There is a possibility that you could sustain a loss of some or all of your initial investment. Therefore, you should not invest money that you cannot afford to lose.
Past performance is not indicative of future results. The backtesting results shown by this script are historical and do not guarantee future performance. Market conditions are constantly changing.
By using this script, you acknowledge that you are solely responsible for any and all trading decisions you make. You should conduct your own thorough research and, if necessary, seek advice from an independent financial advisor before making any investment decisions. The creators of this script assume no liability for any of your trading results.
