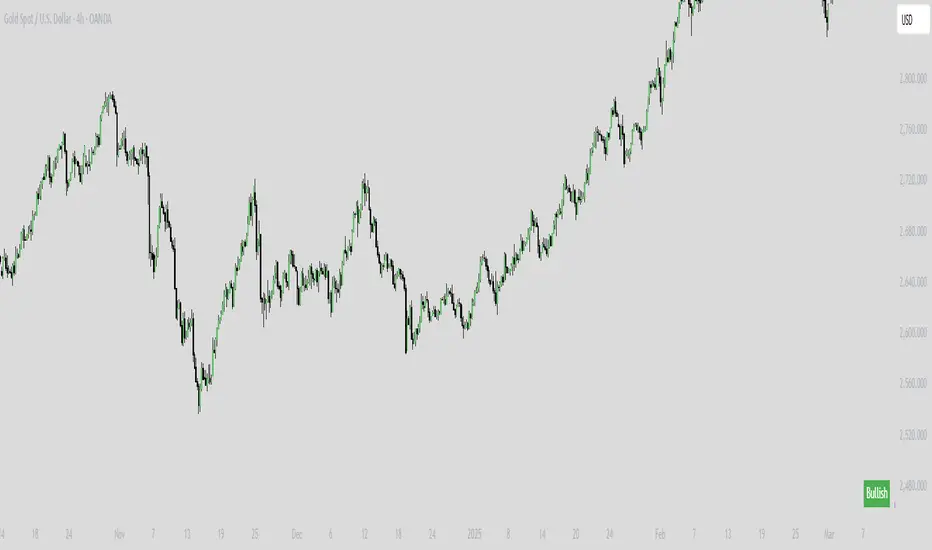
Trend detection for stocksThis Pine Script indicator combines exponential moving averages (EMA) with the Average Directional Index (ADX) to identify clear upward and downward trends. The chart colors the background according to the trend and optionally displays buy and sell signals as well as alerts.
Functionality in detail:
The Fast EMA (Standard 21) reacts quickly to price changes.
The Slow EMA (Standard 55) smooths the trend more.
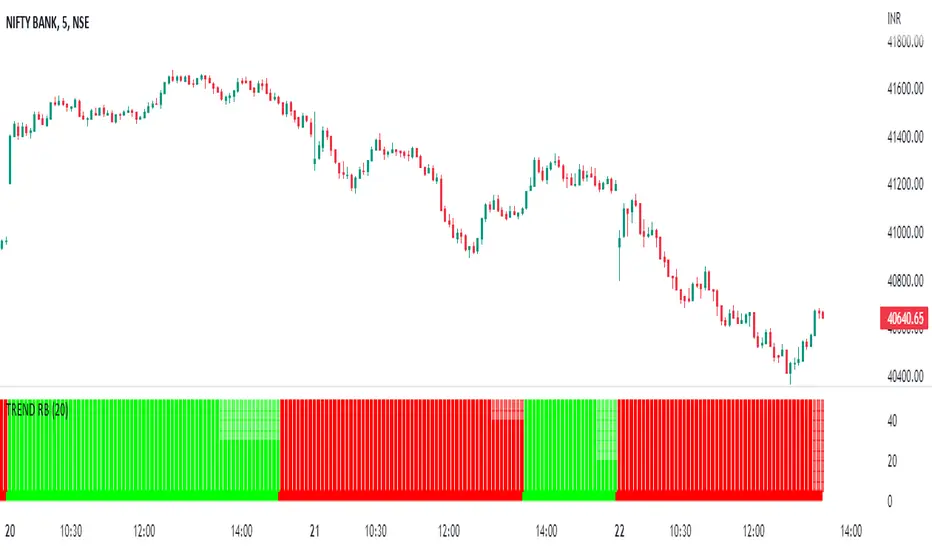
If the Fast EMA is above the Slow EMA and the ADX is above the defined threshold, the background turns green – indicating a clear upward trend.
Conversely, a red background signals a dominant downward trend.
Buy and sell arrows appear at the EMA crossover as soon as the ADX confirms that a trend is intact.
Pine Script® göstergesi