TRAILING STOP LOSS TO LONG AND SHORT##THIS SCRIPT IS ON GITHUB
This TradingView strategy it is designed to integrate with other strategies with indicators.
It performs a trailing stop loss from entry and exit conditions.
In this strategy you can add conditions for long and short positions.
The strategy will ride up your stop loss when price moviment 1%.
The strategy will close your operation when the market price crossed the stop loss.
Also is possible to select the period that strategy will execute the backtest.
The strategy has the following parameters:
+ **INITIAL STOP LOSS** - Where can isert the value to first stop.
+ **POSITION TYPE** - Where can to select trade position.
+ **BACKTEST PERIOD** - To select range.
## DISCLAIMER
1. I am not licensed financial advisors or broker dealers. I do not tell you when or what to buy or sell. I developed this software which enables you execute manual or automated trades multiple trades using TradingView. The software allows you to set the criteria you want for entering and exiting trades.
2. Do not trade with money you cannot afford to lose.
3. I do not guarantee consistent profits or that anyone can make money with no effort. And I am not selling the holy grail.
4. Every system can have winning and losing streaks.
5. Money management plays a large role in the results of your trading. For example: lot size, account size, broker leverage, and broker margin call rules all have an effect on results. Also, your Take Profit and Stop Loss settings for individual pair trades and for overall account equity have a major impact on results. If you are new to trading and do not understand these items, then I recommend you seek education materials to further your knowledge.
**YOU NEED TO FIND AND USE THE TRADING SYSTEM THAT WORKS BEST FOR YOU AND YOUR TRADING TOLERANCE.**
**I HAVE PROVIDED NOTHING MORE THAN A TOOL WITH OPTIONS FOR YOU TO TRADE WITH THIS PROGRAM ON TRADINGVIEW.**
## NOTE
I accept suggestions to improve the script.
If you encounter any problems I will be happy to share with me.
+ Authors: @exit490
+ Revision: v1.0.0
+ Date: 03-Aug-2019
+ Pinescript version: 4
## LICENSE
Copyright 2019 Mauricio Pimenta / exit490
Trailing Stop Loss script may be freely distributed under the MIT license .
"tradingview+金龙指数" için komut dosyalarını ara

Hilly's Advanced Crypto Scalping Strategy - 5 Min ChartTo determine the "best" input parameters for the Advanced Crypto Scalping Strategy on a 5-minute chart, we need to consider the goals of optimizing for profitability, minimizing false signals, and adapting to the volatile nature of cryptocurrencies. The default parameters in the script are a starting point, but the optimal values depend on the specific cryptocurrency pair, market conditions, and your risk tolerance. Below, I'll provide recommended input values based on common practices in crypto scalping, along with reasoning for each parameter. I’ll also suggest how to fine-tune them using TradingView’s backtesting and optimization tools.
Recommended Input Parameters
These values are tailored for a 5-minute chart for liquid cryptocurrencies like BTC/USD or ETH/USD on exchanges like Binance or Coinbase. They aim to balance signal frequency and accuracy for day trading.
Fast EMA Length (emaFastLen): 9
Reasoning: A 9-period EMA is commonly used in scalping to capture short-term price movements while remaining sensitive to recent price action. It reacts faster than the default 10, aligning with the 5-minute timeframe.
Slow EMA Length (emaSlowLen): 21
Reasoning: A 21-period EMA provides a good balance for identifying the broader trend on a 5-minute chart. It’s slightly longer than the default 20 to reduce noise while confirming the trend direction.
RSI Length (rsiLen): 14
Reasoning: The default 14-period RSI is a standard choice for momentum analysis. It works well for detecting overbought/oversold conditions without being too sensitive on short timeframes.
RSI Overbought (rsiOverbought): 75
Reasoning: Raising the overbought threshold to 75 (from 70) reduces false sell signals in strong bullish trends, which are common in crypto markets.
RSI Oversold (rsiOversold): 25
Reasoning: Lowering the oversold threshold to 25 (from 30) filters out weaker buy signals, ensuring entries occur during stronger reversals.
MACD Fast Length (macdFast): 12
Reasoning: The default 12-period fast EMA for MACD is effective for capturing short-term momentum shifts in crypto, aligning with scalping goals.
MACD Slow Length (macdSlow): 26
Reasoning: The default 26-period slow EMA is a standard setting that works well for confirming momentum trends without lagging too much.
MACD Signal Smoothing (macdSignal): 9
Reasoning: The default 9-period signal line is widely used and provides a good balance for smoothing MACD crossovers on a 5-minute chart.
Bollinger Bands Length (bbLen): 20
Reasoning: The default 20-period Bollinger Bands are effective for identifying volatility breakouts, which are key for scalping in crypto markets.
Bollinger Bands Multiplier (bbMult): 2.0
Reasoning: A 2.0 multiplier is standard and captures most price action within the bands. Increasing it to 2.5 could reduce signals but improve accuracy in highly volatile markets.
Stop Loss % (slPerc): 0.8%
Reasoning: A tighter stop loss of 0.8% (from 1.0%) suits the high volatility of crypto, helping to limit losses on false breakouts while keeping risk manageable.
Take Profit % (tpPerc): 1.5%
Reasoning: A 1.5% take-profit target (from 2.0%) aligns with scalping’s goal of capturing small, frequent gains. Crypto markets often see quick reversals, so a smaller target increases the likelihood of hitting profits.
Use Candlestick Patterns (useCandlePatterns): True
Reasoning: Enabling candlestick patterns (e.g., engulfing, hammer) adds confirmation to signals, reducing false entries in choppy markets.
Use Volume Filter (useVolumeFilter): True
Reasoning: The volume filter ensures signals occur during high-volume breakouts, which are more likely to sustain in crypto markets.
Signal Arrow Size (signalSize): 2.0
Reasoning: Increasing the arrow size to 2.0 (from 1.5) makes buy/sell signals more visible on the chart, especially on smaller screens or volatile price action.
Background Highlight Transparency (bgTransparency): 85
Reasoning: A slightly higher transparency (85 from 80) keeps the background highlights subtle but visible, avoiding chart clutter.
How to Apply These Parameters
Copy the Script: Use the Pine Script provided in the previous response.
Paste in TradingView: Open TradingView, go to the Pine Editor, paste the code, and click "Add to Chart."
Set Parameters: In the strategy settings, manually input the recommended values above or adjust them via the input fields.
Test on a 5-Minute Chart: Apply the strategy to a liquid crypto pair (e.g., BTC/USDT, ETH/USDT) on a 5-minute chart.
Fine-Tuning for Optimal Performance
To find the absolute best parameters for your specific trading pair and market conditions, use TradingView’s Strategy Tester and optimization features:
Backtesting:
Run the strategy on historical data for your chosen pair (e.g., BTC/USDT on Binance).
Check metrics like Net Profit, Profit Factor, Win Rate, and Max Drawdown in the Strategy Tester.
Focus on a sample period of at least 1–3 months to capture various market conditions (bull, bear, sideways).
Parameter Optimization:
In the Strategy Tester, click the settings gear next to the strategy name.
Enable optimization for key inputs like emaFastLen (test range: 7–12), emaSlowLen (15–25), slPerc (0.5–1.5), and tpPerc (1.0–3.0).
Run the optimization to find the combination with the highest net profit or best Sharpe ratio, but avoid over-optimization (curve-fitting) by testing on out-of-sample data.
Market-Specific Adjustments:
Volatile Pairs (e.g., DOGE/USDT): Use tighter stop losses (e.g., 0.5–0.7%) and smaller take-profit targets (e.g., 1.0–1.2%) to account for rapid price swings.
Stable Pairs (e.g., BTC/USDT): Slightly wider stop losses (e.g., 1.0–1.2%) and take-profit targets (e.g., 1.8–2.5%) may work better.
Trending Markets: Increase emaSlowLen (e.g., to 25–30) to follow stronger trends.
Choppy Markets: Tighten bbMult (e.g., to 1.8) and lower rsiOverbought/rsiOversold (e.g., to 70/30) to filter noise.
Forward Testing:
After backtesting, run the strategy in real-time on a demo account for 1–2 weeks to validate performance under current market conditions.
Important Notes
No Universal "Best" Numbers: Optimal parameters vary by crypto pair, exchange, and market conditions (e.g., bull vs. bear market). The suggested values are a starting point based on common scalping practices.
Risk Management: Never risk more than 1–2% of your account per trade. Adjust position sizing in TradingView’s strategy settings to align with your risk tolerance.
Market Volatility: Crypto markets are highly volatile. Test the strategy on your specific pair and adjust parameters if signals are too frequent or too rare.
Not Financial Advice: This is an educational tool. Backtest thoroughly and use a demo account before trading with real funds.
If you want me to generate a chart showing backtest performance for specific parameters or to tweak the script further (e.g., adding more indicators or adjusting signal logic), let me know!can you add clear buy ans sell signs above the candles in this codeTo add clear buy and sell signals above the candles in the provided Pine Script, I'll modify the existing code to include prominent text labels directly above (for sell signals) and below (for buy signals) the candles. These labels will be larger, color-coded, and positioned to avoid clutter, ensuring they are easily visible on the chart. The core strategy logic (EMA, RSI, MACD, Bollinger Bands, candlestick patterns, and volume filter) will remain unchanged, and I'll reuse the same artifact_id since this is an update to the previous script.AdvancedCryptoScalpingStrategy.pinex-pine

[blackcat] L1 Value Trend IndicatorOVERVIEW
The L1 Value Trend Indicator is a sophisticated technical analysis tool designed for TradingView users seeking advanced market trend identification and trading signals. This comprehensive indicator combines multiple analytical techniques to provide traders with a holistic view of market dynamics, helping identify potential entry and exit points through various signal mechanisms. 📈 It features a main Value Trend line along with a lagged version, golden cross and dead cross signals, and multiple technical indicators including RSI, Williams %R, Stochastic %K/D, and Relative Strength calculations. The indicator also includes reference levels for support and resistance analysis, making it a versatile tool for both short-term and long-term trading strategies. ✅
FEATURES
📈 Primary Value Trend Line: Calculates a smoothed value trend using a combination of SMA and custom smoothing techniques
🔍 Value Trend Lag: Implements a lagged version of the main trend line for cross-over analysis
🚀 Golden Cross & Dead Cross Signals: Identifies buy/sell opportunities when the main trend line crosses its lagged version
💸 Multi-Indicator Integration: Combines multiple technical analysis tools for comprehensive market view
📊 RSI Calculations: Includes 6-period, 7-period, and 13-period RSI calculations for momentum analysis
📈 Williams %R: Provides overbought/oversold conditions using the Williams %R formula
📉 Stochastic Oscillator: Implements both Stochastic %K and %D calculations for momentum confirmation
📋 Relative Strength: Calculates relative strength based on highest highs and current price
✅ Visual Labels: Displays BUY and SELL labels on chart when crossover conditions are met
📣 Alert Conditions: Provides automated alert conditions for golden cross and dead cross events
📌 Reference Levels: Plots entry (25) and exit (75) reference lines for support/resistance analysis
HOW TO USE
Copy the Script: Copy the complete Pine Script code from the original file
Open TradingView: Navigate to TradingView website or application
Access Pine Editor: Go to the Pine Script editor (usually found in the chart toolbar)
Paste Code: Paste the copied script into the editor
Save Script: Save the script with a descriptive name like " L1 Value Trend Indicator"
Select Chart: Choose the chart where you want to apply the indicator
Add Indicator: Apply the indicator to your chart
Configure Parameters: Adjust input parameters to customize behavior
Monitor Signals: Watch for golden cross (BUY) and dead cross (SELL) signals
Use Reference Levels: Monitor entry (25) and exit (75) lines for support/resistance levels
LIMITATIONS
⚠️ Potential Repainting: The script may repaint due to lookahead bias in some calculations
📉 Lookahead Bias: Some calculations may reference future values, potentially causing repainting issues
🔄 Parameter Sensitivity: Results may vary significantly with different parameter settings
📉 Computational Complexity: May impact chart performance with heavy calculations on large datasets
📊 Resource Usage: Requires significant processing power for multiple indicator calculations
🔄 Data Sensitivity: Results may be affected by data quality and market conditions
NOTES
📈 Signal Timing: Cross-over signals may lag behind actual price movements
📉 Parameter Optimization: Optimal parameters may vary by market conditions and asset type
📋 Market Conditions: Performance may vary significantly across different market environments
📈 Multi-Indicator: Combine signals with other technical indicators for confirmation
📉 Timeframe Analysis: Use multiple timeframes for enhanced signal accuracy
📋 Volume Analysis: Incorporate volume data for additional confirmation
📈 Strategy Integration: Consider using this indicator as part of a broader trading strategy
📉 Risk Management: Use signals as part of a comprehensive risk management approach
📋 Backtesting: Test parameter combinations with historical data before live trading
THANKS
🙏 Original Creator: blackcat1402 creates the L1 Value Trend Indicator
📚 Community Contributions: Recognition to TradingView community for continuous improvements and contributions
📈 Collaborative Development: Appreciation for collaborative efforts in enhancing technical analysis tools
📉 TradingView Community: Special thanks to TradingView community members for their ongoing support and feedback
📋 Educational Resources: Recognition of educational resources that helped in understanding technical analysis principles

Divergence Screener [Trendoscope®]🎲Overview
The Divergence Screener is a powerful TradingView indicator designed to detect and visualize bullish and bearish divergences, including hidden divergences, between price action and a user-selected oscillator. Built with flexibility in mind, it allows traders to customize the oscillator type, trend detection method, and other parameters to suit various trading strategies. The indicator is non-overlay, displaying divergence signals directly on the oscillator plot, with visual cues such as lines and labels on the chart for easy identification.
This indicator is ideal for traders seeking to identify potential reversal or continuation signals based on price-oscillator divergences. It supports multiple oscillators, trend detection methods, and alert configurations, making it versatile for different markets and timeframes.
🎲Features
🎯Customizable Oscillator Selection
Built-in Oscillators : Choose from a variety of oscillators including RSI, CCI, CMO, COG, MFI, ROC, Stochastic, and WPR.
External Oscillator Support : Users can input an external oscillator source, allowing integration with custom or third-party indicators.
Configurable Length : Adjust the oscillator’s period (e.g., 14 for RSI) to fine-tune sensitivity.
🎯Divergence Detection
The screener identifies four types of divergences:
Bullish Divergence : Price forms a lower low, but the oscillator forms a higher low, signaling potential upward reversal.
Bearish Divergence : Price forms a higher high, but the oscillator forms a lower high, indicating potential downward reversal.
Bullish Hidden Divergence : Price forms a higher low, but the oscillator forms a lower low, suggesting trend continuation in an uptrend.
Bearish Hidden Divergence : Price forms a lower high, but the oscillator forms a higher high, suggesting trend continuation in a downtrend.
🎯Flexible Trend Detection
The indicator offers three methods to determine the trend context for divergence detection:
Zigzag : Uses zigzag pivots to identify trends based on higher highs (HH), higher lows (HL), lower highs (LH), and lower lows (LL).
MA Difference : Calculates the trend based on the difference in a moving average (e.g., SMA, EMA) between divergence pivots.
External Trend Signal : Allows users to input an external trend signal (positive for uptrend, negative for downtrend) for custom trend analysis.
🎯Zigzag-Based Pivot Analysis
Customizable Zigzag Length : Adjust the zigzag length (default: 13) to control the sensitivity of pivot detection.
Repaint Option : Choose whether divergence lines repaint based on the latest data or wait for confirmed pivots, balancing responsiveness and reliability.
🎯Visual and Alert Features
Divergence Visualization : Divergence lines are drawn between price pivots and oscillator pivots, color-coded for easy identification:
Bullish Divergence : Green
Bearish Divergence : Red
Bullish Hidden Divergence : Lime
Bearish Hidden Divergence : Orange
Labels and Tooltips : Labels (e.g., “D” for divergence, “H” for hidden) appear on price and oscillator pivots, with tooltips providing detailed information such as price/oscillator values, ratios, and pivot directions.
Alerts : Configurable alerts for each divergence type (bullish, bearish, bullish hidden, bearish hidden) trigger on bar close, ensuring timely notifications.
🎲 How It Works
🎯Oscillator Calculation
The indicator calculates the selected oscillator (or uses an external source) and plots it on the chart.
Oscillator values are stored in a map for reference during divergence calculations.
🎯Pivot Detection
A zigzag algorithm identifies pivots in the oscillator data, with configurable length and repainting options.
Price and oscillator pivots are compared to detect divergences based on their direction and ratio.
🎯Divergence Identification
The indicator compares price and oscillator pivot directions (HH, HL, LH, LL) to identify divergences.
Trend context is determined using the selected method (Zigzag, MA Difference, or External).
Divergences are classified as bullish, bearish, bullish hidden, or bearish hidden based on price-oscillator relationships and trend direction.
🎯Visualization and Alerts
Valid divergences are drawn as lines connecting price and oscillator pivots, with corresponding labels.
Alerts are triggered for allowed divergence types, providing detailed information via tooltips.
🎯Validation
Divergence lines are validated to ensure no intermediate bars violate the divergence condition, enhancing signal reliability.
🎲 Usage Instructions as Indicator
🎯Add to Chart:
Add the “Divergence Screener ” to your TradingView chart.
The indicator appears in a separate pane below the price chart, plotting the oscillator and divergence signals.
🎯Configure Settings:
Adjust the oscillator type and length to match your trading style.
Select a trend detection method and configure related parameters (e.g., MA type/length or external signal).
Set the zigzag length and repainting preference.
Enable/disable alerts for specific divergence types.
I🎯nterpret Signals:
Bullish Divergence (Green) : Look for potential buy opportunities in a downtrend.
Bearish Divergence (Red) : Consider sell opportunities in an uptrend.
Bullish Hidden Divergence (Lime) : Confirm continuation in an uptrend.
Bearish Hidden Divergence (Orange): Confirm continuation in a downtrend.
Use tooltips on labels to review detailed pivot and divergence information.
🎯Set Alerts:
Create alerts for each divergence type to receive notifications via TradingView’s alert system.
Alerts include detailed text with price, oscillator, and divergence information.
🎲 Example Scenarios as Indicator
🎯 With External Oscillator (Use MACD Histogram as Oscillator)
In order to use MACD as an oscillator for divergence signal instead of the built in options, follow these steps.
Load MACD Indicator from Indicator library
From Indicator settings of Divergence Screener, set Use External Oscillator and select MACD Histograme from the dropdown
You can now see that the oscillator pane shows the data of selected MACD histogram and divergence signals are generated based on the external MACD histogram data.
🎯 With External Trend Signal (Supertrend Ladder ATR)
Now let's demonstrate how to use external direction signals using Supertrend Ladder ATR indicator. Please note that in order to use the indicator as trend source, the indicator should return positive integer for uptrend and negative integer for downtrend. Steps are as follows:
Load the desired trend indicator. In this example, we are using Supertrend Ladder ATR
From the settings of Divergence Screener, select "External" as Trend Detection Method
Select the trend detection plot Direction from the dropdown. You can now see that the divergence signals will rely on the new trend settings rather than the built in options.
🎲 Using the Script with Pine Screener
The primary purpose of the Divergence Screener is to enable traders to scan multiple instruments (e.g., stocks, ETFs, forex pairs) for divergence signals using TradingView’s Pine Screener, facilitating efficient comparison and identification of trading opportunities.
To use the Divergence Screener as a screener, follow these steps:
Add to Favorites : Add the Divergence Screener to your TradingView favorites to make it available in the Pine Screener.
Create a Watchlist : Build a watchlist containing the instruments (e.g., stocks, ETFs, or forex pairs) you want to scan for divergences.
Access Pine Screener : Navigate to the Pine Screener via TradingView’s main menu: Products -> Screeners -> Pine, or directly visit tradingview.com/pine-screener/.
Select Watchlist : Choose the watchlist you created from the Watchlist dropdown in the Pine Screener interface.
Choose Indicator : Select Divergence Screener from the Choose Indicator dropdown.
Configure Settings : Set the desired timeframe (e.g., 1 hour, 1 day) and adjust indicator settings such as oscillator type, zigzag length, or trend detection method as needed.
Select Filter Criteria : Select the condition on which the watchlist items needs to be filtered. Filtering can only be done on the plots defined in the script.
Run Scan : Press the Scan button to display divergence signals across the selected instruments. The screener will show which instruments exhibit bullish, bearish, bullish hidden, or bearish hidden divergences based on the configured settings.
🎲 Limitations and Possible Future Enhancements
Limitations are
Custom input for oscillator and trend detection cannot be used in pine screener.
Pine screener has max 500 bars available.
Repaint option is by default enabled. When in repaint mode expect the early signal but the signals are prone to repaint.
Possible future enhancements
Add more built-in options for oscillators and trend detection methods so that dependency on external indicators is limited
Multi level zigzag support

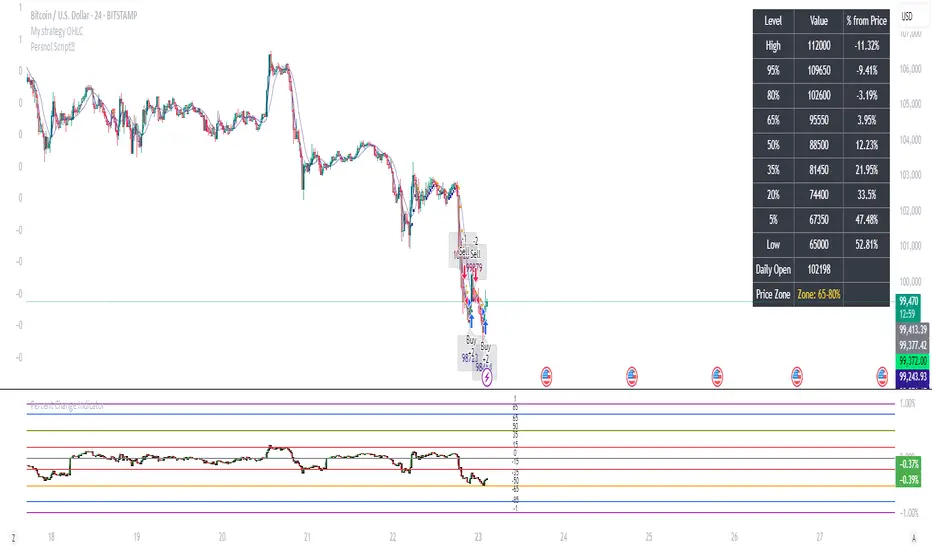
Percent Change IndicatorPercent Change Indicator Description
Overview:
The Percent Change Indicator is a Pine Script (version 6) indicator designed for TradingView to calculate and visualize the percentage change of the current close price relative to a user-selected reference price. It provides a customizable interface to display percentage changes as candlesticks or a line plot, with optional horizontal lines and labels for key levels. The indicator also includes visual signals and alerts for user-defined percentage thresholds, making it useful for identifying significant price movements.
Key Features:
1. Percentage Change Calculation:
- Computes the percentage change of the current close price compared to a reference price, scaled by a user-defined length parameter.
- Formula: percentChange = (close - refPrice) / refPrice * len
- The reference price is sourced from a user-selected timeframe (default: 1D) and price type (Open, High, Low, Close, HL2, HLC3, or HLCC4).
2. Visualization Options:
- Candlestick Plot: Displays percentage change as candlesticks, colored green for rising values and red for falling values.
- Line Plot: Plots the percentage change as a line, with the same color logic.
- Horizontal Lines: Optional horizontal lines at key percentage levels (0%, ±0.2%, ±0.5%, ±0.8%, ±1%) for reference.
- Labels: Optional labels for percentage levels (0, ±15%, ±35%, ±50%, ±65%, ±85%, ±100%) displayed at the chart's right edge.
- All visualizations are toggleable via input settings.
3. Signal and Alert System:
- Threshold-Based Signals: Plots green triangles below bars for long signals (percent change above a user-defined threshold) and red triangles above bars for short signals (percent change below the threshold).
- Alerts: Configurable alerts for long and short conditions, triggered when the percentage change crosses the user-defined threshold (default: 2%). Alert messages include the threshold value for clarity.
4. Customizable Inputs:
- Show Labels: Toggle visibility of percentage level labels (default: true).
- Show Percentage Change: Toggle the line plot of percentage change (default: true).
- Show HLines: Toggle visibility of horizontal reference lines (default: false).
- Show Candle Plot: Toggle the candlestick plot (default: true).
- Percent Change Length: Adjust the scaling factor for percentage change (default: 14).
- Plot Timeframe: Select the timeframe for the reference price (default: 1D).
- Price Type: Choose the reference price type (Open, High, Low, Close, HL2, HLC3, HLCC4; default: Open).
- Percentage Threshold: Set the threshold for long/short signals and alerts (default: 0.02 or 2%).
How It Works:
- The indicator fetches the reference price using request.security() based on the selected timeframe and price type.
- It calculates the percentage change and scales it by the user-defined length.
- Visuals (candlesticks, lines, labels, horizontal lines) are plotted based on user preferences.
- Long and short signals are generated when the percentage change exceeds or falls below the user-defined threshold, with corresponding triangles plotted and alerts triggered.
Use Cases:
- Trend Identification: Monitor significant price movements relative to a reference price.
- Signal Generation: Identify potential entry/exit points based on percentage change thresholds.
- Custom Analysis: Analyze price changes across different timeframes and price types for various trading strategies.
- Alert Notifications: Receive alerts for significant price movements to stay informed without constant chart monitoring.
Setup Instructions:
1. Add the indicator to a TradingView chart.
2. Adjust input settings (timeframe, price type, threshold, etc.) to suit your analysis.
3. Enable/disable visualization options (candlesticks, lines, labels, horizontal lines) as needed.
4. Set up alerts in TradingView:
- Go to the "Alerts" tab and select "Percent Change Indicator."
- Choose "Long Alert" or "Short Alert" to monitor threshold crossings.
- Configure alert frequency and notification method (e.g., email, webhook).
Notes:
- The indicator is non-overlay, displayed in a separate pane below the main chart.
- Alerts trigger on bar close by default; adjust TradingView alert settings for real-time notifications if needed.
- The indicator is released under the Mozilla Public License 2.0.
Author: Dshergill
This indicator is ideal for traders seeking a flexible tool to track percentage-based price movements with customizable visuals and alerts.
Money Risk Management with Trade Tracking
Overview
The Money Risk Management with Trade Tracking indicator is a powerful tool designed for traders on TradingView to simplify trade simulation and risk management. Unlike the TradingView Strategy Tester, which can be complex for beginners, this indicator provides an intuitive, beginner-friendly interface to evaluate trading strategies in a realistic manner, mirroring real-world trading conditions.
Built on the foundation of open-source contributions from LuxAlgo and TCP, this indicator integrates external indicator signals, overlays take-profit (TP) and stop-loss (SL) levels, and provides detailed money management analytics. It empowers traders to visualize potential profits, losses, and risk-reward ratios, making it easier to understand the financial outcomes of their strategies.
Key Features
Signal Integration: Seamlessly integrates with external long and short signals from other indicators, allowing traders to overlay TP/SL levels based on their preferred strategies.
Realistic Trade Simulation: Simulates trades as they would occur in real-world scenarios, accounting for initial capital, risk percentage, leverage, and compounding effects.
Money Management Dashboard: Displays critical metrics such as current capital, unrealized P&L, risk amount, potential profit, risk-reward ratio, and trade status in a customizable, beginner-friendly table.
TP/SL Visualization: Plots TP and SL levels on the chart with customizable styles (solid, dashed, dotted) and colors, along with optional labels for clarity.
Performance Tracking: Tracks total trades, win/loss counts, win rate, and profit factor, providing a clear overview of strategy performance.
Liquidation Risk Alerts: Warns traders if stop-loss levels risk liquidation based on leverage settings, enhancing risk awareness.
Benefits for Traders
Beginner-Friendly: Simplifies the complexities of the TradingView Strategy Tester, offering an intuitive interface for new traders to simulate and evaluate trades without confusion.
Real-World Insights: Helps traders understand the actual profit or loss potential of their strategies by factoring in capital, risk, and leverage, bridging the gap between theoretical backtesting and real-world execution.
Enhanced Decision-Making: Provides clear, real-time analytics on risk-reward ratios, unrealized P&L, and trade performance, enabling informed trading decisions.
Customizable and Flexible: Allows customization of TP/SL settings, table positions, colors, and sizes, catering to individual trader preferences.
Risk Management Focus: Encourages disciplined trading by highlighting risk amounts, potential profits, and liquidation risks, fostering better financial planning.
Why This Indicator Stands Out
Many traders struggle to translate backtested strategy results into real-world outcomes due to the abstract nature of percentage-based profitability metrics. This indicator addresses that challenge by providing a practical, user-friendly tool that simulates trades with real-world parameters like capital, leverage, and compounding. Its open-source nature ensures accessibility, while its integration with other indicators makes it versatile for various trading styles.
How to Use
Add to TradingView: Copy the Pine Script code into TradingView’s Pine Editor and add it to your chart.
Configure Inputs: Set your initial capital, risk percentage, leverage, and TP/SL values in the indicator settings. Select external long/short signal sources if integrating with other indicators.
Monitor Dashboards: Use the Money Management and Target Dashboard tables to track trade performance and risk metrics in real time.
Analyze Results: Review win rates, profit factors, and P&L to refine your trading strategy.
Credits
This indicator builds upon the open-source contributions of LuxAlgo and TCP , whose efforts in sharing their code have made this tool possible. Their dedication to the trading community is deeply appreciated.

Canuck Trading IndicatorOverview
The Canuck Trading Indicator is a versatile, overlay-based technical analysis tool designed to assist traders in identifying potential trading opportunities across various timeframes and market conditions. By combining multiple technical indicators—such as RSI, Bollinger Bands, EMAs, VWAP, MACD, Stochastic RSI, ADX, HMA, and candlestick patterns—the indicator provides clear visual signals for bullish and bearish entries, breakouts, long-term trends, and options strategies like cash-secured puts, straddles/strangles, iron condors, and short squeezes. It also incorporates 20-day and 200-day SMAs to detect Golden/Death Crosses and price positioning relative to these moving averages. A dynamic table displays key metrics, and customizable alerts help traders stay informed of market conditions.
Key Features
Multi-Timeframe Adaptability: Automatically adjusts parameters (e.g., ATR multiplier, ADX period, HMA length) based on the chart's timeframe (minute, hourly, daily, weekly, monthly) for optimal performance.
Comprehensive Signal Generation: Identifies short-term entries, breakouts, long-term bullish trends, and options strategies using a combination of momentum, trend, volatility, and candlestick patterns.
Candlestick Pattern Detection: Recognizes bullish/bearish engulfing, hammer, shooting star, doji, and strong candles for precise entry/exit signals.
Moving Average Analysis: Plots 20-day and 200-day SMAs, detects Golden/Death Crosses, and evaluates price position relative to these averages.
Dynamic Table: Displays real-time metrics, including zone status (bullish, bearish, neutral), RSI, MACD, Stochastic RSI, short/long-term trends, candlestick patterns, ADX, ROC, VWAP slope, and MA positioning.
Customizable Alerts: Over 20 alert conditions for entries, exits, overbought/oversold warnings, and MA crosses, with actionable messages including ticker, price, and suggested strategies.
Visual Clarity: Uses distinct shapes, colors, and sizes to plot signals (e.g., green triangles for bullish entries, red triangles for bearish entries) and overlays key levels like EMA, VWAP, Bollinger Bands, support/resistance, and HMA.
Options Strategy Signals: Suggests opportunities for selling cash-secured puts, straddles/strangles, iron condors, and capitalizing on short squeezes.
How to Use
Add to Chart: Apply the indicator to any TradingView chart by selecting "Canuck Trading Indicator" from the Pine Script library.
Interpret Signals:
Bullish Signals: Green triangles (short-term entry), lime diamonds (breakout), blue circles (long-term entry).
Bearish Signals: Red triangles (short-term entry), maroon diamonds (breakout).
Options Strategies: Purple squares (cash-secured puts), yellow circles (straddles/strangles), orange crosses (iron condors), white arrows (short squeezes).
Exits: X-cross shapes in corresponding colors indicate exit signals.
Monitor: Gray circles suggest holding cash or monitoring for setups.
Review Table: Check the top-right table for real-time metrics, including zone status, RSI, MACD, trends, and MA positioning.
Set Alerts: Configure alerts for specific signals (e.g., "Short-Term Bullish Entry" or "Golden Cross") to receive notifications via TradingView.
Adjust Inputs: Customize input parameters (e.g., RSI period, EMA length, ATR period) to suit your trading style or market conditions.
Input Parameters
The indicator offers a wide range of customizable inputs to fine-tune its behavior:
RSI Period (default: 14): Length for RSI calculation.
RSI Bullish Low/High (default: 35/70): RSI thresholds for bullish signals.
RSI Bearish High (default: 65): RSI threshold for bearish signals.
EMA Period (default: 15): Main EMA length (15 for day trading, 50 for swing).
Short/Long EMA Length (default: 3/20): For momentum oscillator.
T3 Smoothing Length (default: 5): Smooths momentum signals.
Long-Term EMA/RSI Length (default: 20/15): For long-term trend analysis.
Support/Resistance Lookback (default: 5): Periods for support/resistance levels.
MACD Fast/Slow/Signal (default: 12/26/9): MACD parameters.
Bollinger Bands Period/StdDev (default: 15/2): BB settings.
Stochastic RSI Period/Smoothing (default: 14/3/3): Stochastic RSI settings.
Uptrend/Short-Term/Long-Term Lookback (default: 2/2/5): Candles for trend detection.
ATR Period (default: 14): For volatility and price targets.
VWAP Sensitivity (default: 0.1%): Threshold for VWAP-based signals.
Volume Oscillator Period (default: 14): For volume surge detection.
Pattern Detection Threshold (default: 0.3%): Sensitivity for candlestick patterns.
ROC Period (default: 3): Rate of change for momentum.
VWAP Slope Period (default: 5): For VWAP trend analysis.
TradingView Publishing Compliance
Originality: The Canuck Trading Indicator is an original script, combining multiple technical indicators and custom logic to provide unique trading signals. It does not replicate existing public scripts.
No Guaranteed Profits: This indicator is a tool for technical analysis and does not guarantee profits. Trading involves risks, and users should conduct their own research and risk management.
Clear Instructions: The description and usage guide are detailed and accessible, ensuring users understand how to apply the indicator effectively.
No External Dependencies: The script uses only built-in Pine Script functions (e.g., ta.rsi, ta.ema, ta.vwap) and requires no external libraries or data sources.
Performance: The script is optimized for performance, using efficient calculations and adaptive parameters to minimize lag on various timeframes.
Visual Clarity: Signals are plotted with distinct shapes and colors, and the table provides a concise summary of market conditions, enhancing usability.
Limitations and Risks
Market Conditions: The indicator may generate false signals in choppy or low-liquidity markets. Always confirm signals with additional analysis.
Timeframe Sensitivity: Performance varies by timeframe; test settings on your preferred chart (e.g., 5-minute for day trading, daily for swing trading).
Risk Management: Use stop-losses and position sizing to manage risk, as suggested in alert messages (e.g., "Stop -20%").
Options Trading: Options strategies (e.g., straddles, iron condors) carry unique risks; consult a financial advisor before trading.
Feedback and Support
For questions, suggestions, or bug reports, please leave a comment on the TradingView script page or contact the author via TradingView. Your feedback helps improve the indicator for the community.
Disclaimer
The Canuck Trading Indicator is provided for educational and informational purposes only. It is not financial advice. Trading involves significant risks, and past performance is not indicative of future results. Always perform your own due diligence and consult a qualified financial advisor before making trading decisions.

Bullish and Bearish Breakout Alert for Gold Futures PullbackBelow is a Pine Script (version 6) for TradingView that includes both bullish and bearish breakout conditions for my intraday trading strategy on micro gold futures (MGC). The strategy focuses on scalping two-legged pullbacks to the 20 EMA or key levels with breakout confirmation, tailored for the Apex Trader Funding $300K challenge. The script accounts for the Daily Sentiment Index (DSI) at 87 (overbought, favoring pullbacks). It generates alerts for placing stop-limit orders for 175 MGC contracts, ensuring compliance with Apex’s rules ($7,500 trailing threshold, $20,000 profit target, 4:59 PM ET close).
Script Requirements
Version: Pine Script v6 (latest for TradingView, April 2025).
Purpose:
Bullish: Alert when price breaks above a rejection candle’s high after a two-legged pullback to the 20 EMA in a bullish trend (price above 20 EMA, VWAP, higher highs/lows).
Bearish: Alert when price breaks below a rejection candle’s low after a two-legged pullback to the 20 EMA in a bearish trend (price below 20 EMA, VWAP, lower highs/lows).
Context: 5-minute MGC chart, U.S. session (8:30 AM–12:00 PM ET), avoiding overbought breakouts above $3,450 (DSI 87).
Output: Alerts for stop-limit orders (e.g., “Buy: Stop=$3,377, Limit=$3,377.10” or “Sell: Stop=$3,447, Limit=$3,446.90”), quantity 175 MGC.
Apex Compliance: 175-contract limit, stop-losses, one-directional news trading, close by 4:59 PM ET.
How to Use the Script in TradingView
1. Add Script:
Open TradingView (tradingview.com).
Go to “Pine Editor” (bottom panel).
Copy the script from the content.
Click “Add to Chart” to apply to your MGC 5-minute chart .
2. Configure Chart:
Symbol: MGC (Micro Gold Futures, CME, via Tradovate/Apex data feed).
Timeframe: 5-minute (entries), 15-minute (trend confirmation, manually check).
Indicators: Script plots 20 EMA and VWAP; add RSI (14) and volume manually if needed .
3. Set Alerts:
Click the “Alert” icon (bell).
Add two alerts:
Bullish Breakout: Condition = “Bullish Breakout Alert for Gold Futures Pullback,” trigger = “Once Per Bar Close.”
Bearish Breakout: Condition = “Bearish Breakout Alert for Gold Futures Pullback,” trigger = “Once Per Bar Close.”
Customize messages (default provided) and set notifications (e.g., TradingView app, SMS).
Example: Bullish alert at $3,377 prompts “Stop=$3,377, Limit=$3,377.10, Quantity=175 MGC” .
4. Execute Orders:
Bullish:
Alert triggers (e.g., stop $3,377, limit $3,377.10).
In TradingView’s “Order Panel,” select “Stop-Limit,” set:
Stop Price: $3,377.
Limit Price: $3,377.10.
Quantity: 175 MGC.
Direction: Buy.
Confirm via Tradovate.
Add bracket order (OCO):
Stop-loss: Sell 175 at $3,376.20 (8 ticks, $1,400 risk).
Take-profit: Sell 87 at $3,378 (1:1), 88 at $3,379 (2:1) .
Bearish:
Alert triggers (e.g., stop $3,447, limit $3,446.90).
Select “Stop-Limit,” set:
Stop Price: $3,447.
Limit Price: $3,446.90.
Quantity: 175 MGC.
Direction: Sell.
Confirm via Tradovate.
Add bracket order:
Stop-loss: Buy 175 at $3,447.80 (8 ticks, $1,400 risk).
Take-profit: Buy 87 at $3,446 (1:1), 88 at $3,445 (2:1) .
5. Monitor:
Green triangles (bullish) or red triangles (bearish) confirm signals.
Avoid bullish entries above $3,450 (DSI 87, overbought) or bearish entries below $3,296 (support) .
Close trades by 4:59 PM ET (set 4:50 PM alert) .

Mogwai Method with RSI and EMA - BTCUSD 15mThis is a custom TradingView indicator designed for trading Bitcoin (BTCUSD) on a 15-minute timeframe. It’s based on the Mogwai Method—a mean-reversion strategy—enhanced with the Relative Strength Index (RSI) for momentum confirmation. The indicator generates buy and sell signals, visualized as green and red triangle arrows on the chart, to help identify potential entry and exit points in the volatile cryptocurrency market.
Components
Bollinger Bands (BB):
Purpose: Identifies overextended price movements, signaling potential reversions to the mean.
Parameters:
Length: 20 periods (standard for mean-reversion).
Multiplier: 2.2 (slightly wider than the default 2.0 to suit BTCUSD’s volatility).
Role:
Buy signal when price drops below the lower band (oversold).
Sell signal when price rises above the upper band (overbought).
Relative Strength Index (RSI):
Purpose: Confirms momentum to filter out false signals from Bollinger Bands.
Parameters:
Length: 14 periods (classic setting, effective for crypto).
Overbought Level: 70 (price may be overextended upward).
Oversold Level: 30 (price may be overextended downward).
Role:
Buy signal requires RSI < 30 (oversold).
Sell signal requires RSI > 70 (overbought).
Exponential Moving Averages (EMAs) (Plotted but not currently in signal logic):
Purpose: Provides trend context (included in the script for visualization, optional for signal filtering).
Parameters:
Fast EMA: 9 periods (short-term trend).
Slow EMA: 50 periods (longer-term trend).
Role: Can be re-added to filter signals (e.g., buy only when Fast EMA > Slow EMA).
Signals (Triangles):
Buy Signal: Green upward triangle below the bar when price is below the lower Bollinger Band and RSI is below 30.
Sell Signal: Red downward triangle above the bar when price is above the upper Bollinger Band and RSI is above 70.
How It Works
The indicator combines Bollinger Bands and RSI to spot mean-reversion opportunities:
Buy Condition: Price breaks below the lower Bollinger Band (indicating oversold conditions), and RSI confirms this with a reading below 30.
Sell Condition: Price breaks above the upper Bollinger Band (indicating overbought conditions), and RSI confirms this with a reading above 70.
The strategy assumes that extreme price movements in BTCUSD will often revert to the mean, especially in choppy or ranging markets.
Visual Elements
Green Upward Triangles: Appear below the candlestick to indicate a buy signal.
Red Downward Triangles: Appear above the candlestick to indicate a sell signal.
Bollinger Bands: Gray lines (upper, middle, lower) plotted for reference.
EMAs: Blue (Fast) and Orange (Slow) lines for trend visualization.
How to Use the Indicator
Setup
Open TradingView:
Log into TradingView and select a BTCUSD chart from a supported exchange (e.g., Binance, Coinbase, Bitfinex).
Set Timeframe:
Switch the chart to a 15-minute timeframe (15m).
Add the Indicator:
Open the Pine Editor (bottom panel in TradingView).
Copy and paste the script provided.
Click “Add to Chart” to apply it.
Verify Display:
You should see Bollinger Bands (gray), Fast EMA (blue), Slow EMA (orange), and buy/sell triangles when conditions are met.
Trading Guidelines
Buy Signal (Green Triangle Below Bar):
What It Means: Price is oversold, potentially ready to bounce back toward the Bollinger Band middle line.
Action:
Enter a long position (buy BTCUSD).
Set a take-profit near the middle Bollinger Band (bb_middle) or a resistance level.
Place a stop-loss 1-2% below the entry (or based on ATR, e.g., ta.atr(14) * 2).
Best Context: Works well in ranging markets; avoid during strong downtrends.
Sell Signal (Red Triangle Above Bar):
What It Means: Price is overbought, potentially ready to drop back toward the middle line.
Action:
Enter a short position (sell BTCUSD) or exit a long position.
Set a take-profit near the middle Bollinger Band or a support level.
Place a stop-loss 1-2% above the entry.
Best Context: Effective in ranging markets; avoid during strong uptrends.
Trend Filter (Optional):
To reduce false signals in trending markets, you can modify the script:
Add and ema_fast > ema_slow to the buy condition (only buy in uptrends).
Add and ema_fast < ema_slow to the sell condition (only sell in downtrends).
Check the Fast EMA (blue) vs. Slow EMA (orange) alignment visually.
Tips for BTCUSD on 15-Minute Charts
Volatility: BTCUSD can be erratic. If signals are too frequent, increase bb_mult (e.g., to 2.5) or adjust RSI levels (e.g., 75/25).
Confirmation: Use volume spikes or candlestick patterns (e.g., doji, engulfing) to confirm signals.
Time of Day: Mean-reversion works best during low-volume periods (e.g., Asian session in crypto).
Backtesting: Use TradingView’s Strategy Tester (convert to a strategy by adding entry/exit logic) to evaluate performance with historical BTCUSD data up to March 13, 2025.
Risk Management
Position Size: Risk no more than 1-2% of your account per trade.
Stop Losses: Always use stops to protect against BTCUSD’s sudden moves.
Avoid Overtrading: Wait for clear signals; don’t force trades in choppy or unclear conditions.
Example Scenario
Chart: BTCUSD, 15-minute timeframe.
Buy Signal: Price drops to $58,000, below the lower Bollinger Band, RSI at 28. A green triangle appears.
Action: Buy at $58,000, target $59,000 (middle BB), stop at $57,500.
Sell Signal: Price rises to $60,500, above the upper Bollinger Band, RSI at 72. A red triangle appears.
Action: Sell at $60,500, target $59,500 (middle BB), stop at $61,000.
This indicator is tailored for mean-reversion trading on BTCUSD. Let me know if you’d like to tweak it further (e.g., add filters, alerts, or alternative indicators)!

Gann & Fibonacci Analysis for MSTRYes! Below is a step-by-step guide to performing Gann Analysis on MSTR in TradingView for the last year.
Step 1: Set Up the Chart
Open TradingView and search for MSTR (MicroStrategy).
Select the 1-day (D) timeframe to analyze the past year.
Set your chart to logarithmic scale (⚙ Settings → Scale → Log).
Enable grid lines for alignment (⚙ Settings → Appearance → Grid Lines).
Step 2: Identify Key Highs and Lows (Last Year)
Find the 52-week high and 52-week low for MSTR.
As of now:
52-Week High: ~$999 (March 2024).
52-Week Low: ~$280 (October 2023).
Step 3: Plot Gann Angles
Using TradingView's Gann Fan Tool:
Select "Gann Fan" (Press / and type “Gann Fan” to find it).
Start at the 52-week low (~$280, October 2023) and drag upwards.
Adjust the angles to match key levels:
1x1 (45°) → Main trendline
2x1 (26.5°) → Strong uptrend
4x1 (15°) → Weak trendline
1x2 (63.75°) → Strong resistance
Repeat the process from the 52-week high (~$999, March 2024) downward to see bearish angles.
Step 4: Apply Fibonacci & Gann Retracement Levels
Using Fibonacci Retracement:
Select "Fibonacci Retracement" tool.
Draw from 52-week high ($999) to 52-week low ($280).
Enable key Fibonacci levels:
23.6% ($816)
38.2% ($678)
50% ($640)
61.8% ($550)
78.6% ($430)
Watch for price reactions near these levels.
Using Gann Retracement Levels:
Select "Gann Box" in TradingView.
Draw from 52-week high ($999) to low ($280).
Enable key Gann retracement levels:
12.5% ($912)
25% ($850)
37.5% ($768)
50% ($640)
62.5% ($550)
75% ($480)
87.5% ($350)
Identify confluences with Gann angles and Fibonacci levels.
Step 5: Identify Significant Dates & Time Cycles
Use "Date Range" Tool in TradingView.
Mark major turning points:
High → Low: ~180 days (Half-year cycle).
Low → High: ~90 days (Quarter cycle).
Use Square-Outs (Time = Price method):
Example: If MSTR hit $500, check 500 days from key events.
Mark key anniversaries of past highs/lows for possible reversals.
Step 6: Analyze and Trade Execution
✅ If MSTR is at a Gann angle + Fibonacci level + key date → Expect a reaction.
✅ Use RSI, MACD, and Volume for extra confirmation.
✅ Set Stop-Loss at nearest Gann support/resistance.

JK - Q SuiteThis indicator is primarily for identifying pauses in Stage 2 uptrends, modelled on Qullamaggie's style of trading, but fits well with many traders including William O' Neil. or Mark Minervini.
I built this for my own purposes, and have gradually added range of tools into a single suite. My goal has also to be as clean as possible, while providing clear, actionable information.
This suite includes all of the following:
Moving averages (10, 20, 50, 200)
Coloured bars showing tightening price (blue under 75% of ADR, orange under 50% of ADR)
A 'markets' dashboard (top-right), showing the major indexes. Red if 10<20MA, or price <20MA
A 'sectors' dashboard (top-right, below markets). Red if 5<10MA, or price <10MA - see note below
Strength / Weakness information - two cells at the top, bottom-right. See below
Stock information - glanceable stock info as quick filters. The thresholds for ADR, Average volume, and Dollar Volume can be customised.
NOTE - if the 'tightening coloured candles' are not showing, the indicator needs to be at the top of the stack. Click the triple squares at the very bottom-right of the TradingView interface, and drag the indicator to the top, should work then!
=============
Sectors
These are based on the 11 official Sectors, tracked using index funds (XLY, XLK etc). HOWEVER, TradingView does NOT use the official 11 sectors - therefore I've done my best to match TradingViews ones to the official ones, but doesn't always work... e.g. 'Electronic Technology' is typically semiconductors, which are classes as 'Industrials', but Apple is the same sector in TV, but classed as 'Technology' using the official 11 Sectors.
If TradingView move to use the official 11 I'll update this, but for now it's a best guess and will sometimes be wrong, sorry!
Strength / Weakness information
This was an experiment in trying not to give too much back to the market! Typically the strategy would be to sell if price closes below 10MA (Weakness), however there may be large pops that can be advantageous to sell into.
The 'Strength' information (top cell, bottom-right), checks how far the price is extended above 10MA - this is customisable as a multiple of ADR. You may find that in weak markets (like now), it can be best to take profits quickly - in good markets, you could increase this as stocks make bigger or more sustained moves.
=============
While I'm not the best coder - and I've hacked and tried and changed different things - this has been a labour of love and essential for me.
If you have any suggestions, while I may or may not be able to implement them, I'm certainly open to ideas!

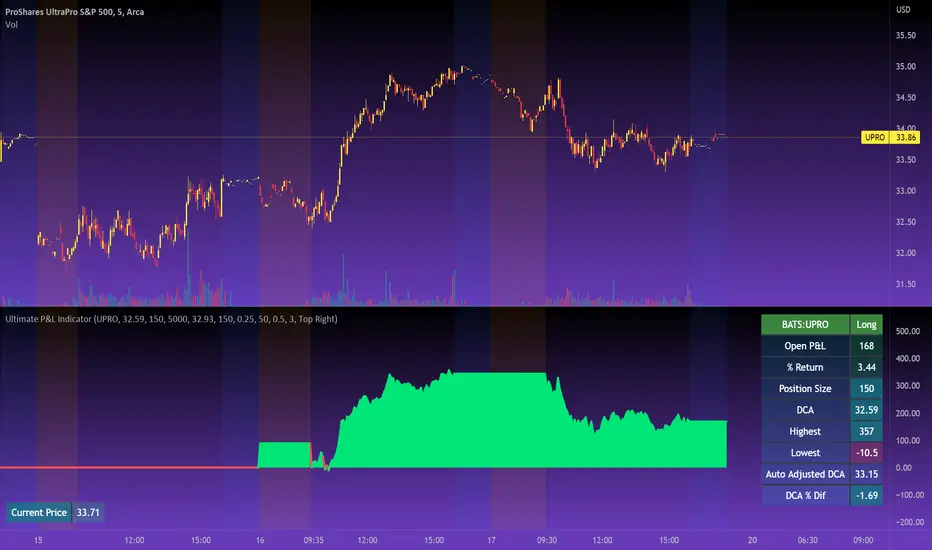
Ultimate P&L IndicatorHello everyone,
Excited to release this P&L Indicator! Read below for more details.
What it does:
This is an indicator that permits you to track your active P&L live on Tradingview. As well, it provides some insight into DCAing your position by giving you live estimates of your revised DCA if you were to add to your position at various targets/price points.
Who is it for:
I developed it because I trade 100% off of Tradingview but my broker does not support Tradingview integration. So I wanted a way to track my position live on the Tradingview platform without having to constantly reference my broker. I also wanted to be able to set position specific alerts right on Tradingview.
How does it work:
It works by the user manually inputting their trade information, including their DCA, position size and the date and time of position entry. The indicator can provide real time and live DCA adjusted estimates if you were to add to your position at the current stock price, or you can manually calculcate your revised DCA at a specific price target.
The indicator also displays your current and past performance on your position for the duration of the position period:
Elements:
Capabilities:
The indicator is compatible with both futures and share trading.
Option trading is not directly available, however, you can get an idea for your option position P&L by following the 1 option contract = 100 share rule.
So if you have 5 option contracts that you bought at a ticker price of, say, 38$, your average cost or DCA would be 38 and your position size would be 500. This will not be 100% accurate, but will be close enough to give you a feel for your active P&L.
If you are trading futures, you will need to select "Futures Trading" and specify the TIck and Index costs. A cheat sheet has been provided in the tool tip for ES, Oil and MNQ. The default is set for ES1! mini futures at 0.25 ticks per 50$.
Important tips:
1. Select the date and time of your position (optional): This is optional but will provide you with the clearest and most accurate review of how your position has performed, including the highest and lowest (drawdown).
2. Select whether it is a share position or a futures position (this is required).
3. Select whether it is a long or short position (this is required).
4. Input your DCA and position size (this is required).
5. Most importantly, select the ticker your position is based in!
I have also prepared a quick start video which is linked below:
As always, please let me know your comments/questions and feedback for the indicator.
Thanks for checking it out and safe trades everyone!
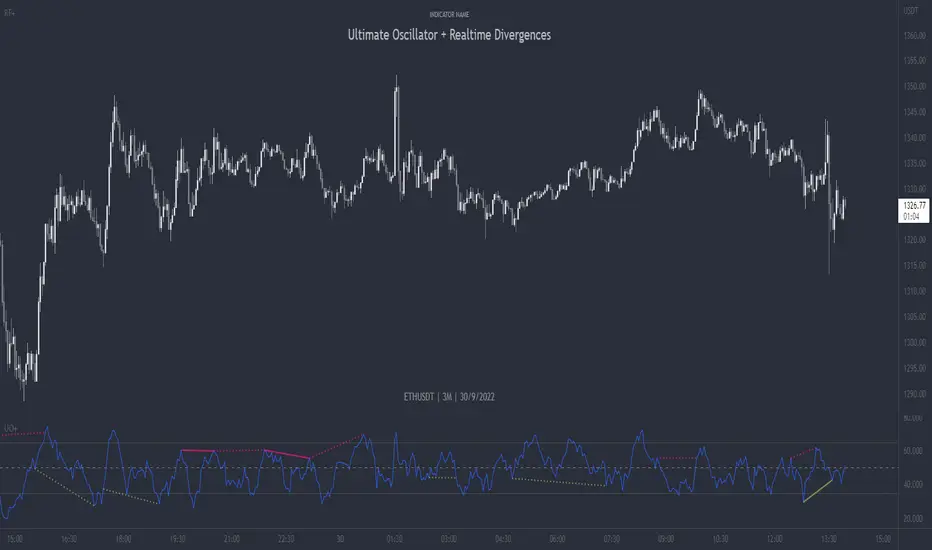
Ultimate Oscillator + Realtime DivergencesUltimate Oscillator (UO) + Realtime Divergences + Alerts + Lookback periods.
This version of the Ultimate Oscillator adds the following 5 additional features to the stock UO by Tradingview:
- Optional divergence lines drawn directly onto the oscillator in realtime
- Configurable alerts to notify you when divergences occur, as well as centerline crossovers.
- Configurable lookback periods to fine tune the divergences drawn in order to suit different trading styles and timeframes.
- Background colouring option to indicate when the UO has crossed the centerline, or optionally when both the UO and an external oscillator, which can be linked via the settings, have both crossed their centerlines.
- Alternate timeframe feature allows you to configure the oscillator to use data from a different timeframe than the chart it is loaded on.
This indicator adds additional features onto the stock Ultimate Oscillator by Tradingview, whose core calculations remain unchanged. Namely the configurable option to automatically and clearly draw divergence lines onto the oscillator for you as they occur in realtime. It also has the addition of unique alerts, so you can be notified as divergences occur without spending all day watching the charts. Furthermore, this version of the Ultimate Oscillator comes with configurable lookback periods, which can be configured in order to adjust the length of the divergences, in order to suit shorter or higher timeframe trading approaches.
The Ultimate Oscillator
Tradingview describes the Ultimate Oscillator as follows:
“The Ultimate Oscillator indicator (UO) indicator is a technical analysis tool used to measure momentum across three varying timeframes. The problem with many momentum oscillators is that after a rapid advance or decline in price, they can form false divergence trading signals. For example, after a rapid rise in price, a bearish divergence signal may present itself, however price continues to rise. The ultimate Oscillator attempts to correct this by using multiple timeframes in its calculation as opposed to just one timeframe which is what is used in most other momentum oscillators.”
More information on the history, use cases and calculations of the Ultimate Oscillator can be found here: www.tradingview.com
What are divergences?
Divergence is when the price of an asset is moving in the opposite direction of a technical indicator, such as an oscillator, or is moving contrary to other data. Divergence warns that the current price trend may be weakening, and in some cases may lead to the price changing direction.
There are 4 main types of divergence, which are split into 2 categories;
regular divergences and hidden divergences. Regular divergences indicate possible trend reversals, and hidden divergences indicate possible trend continuation.
Regular bullish divergence: An indication of a potential trend reversal, from the current downtrend, to an uptrend.
Regular bearish divergence: An indication of a potential trend reversal, from the current uptrend, to a downtrend.
Hidden bullish divergence: An indication of a potential uptrend continuation.
Hidden bearish divergence: An indication of a potential downtrend continuation.
Setting alerts.
With this indicator you can set alerts to notify you when any/all of the above types of divergences occur, on any chart timeframe you choose.
Configurable lookback values.
You can adjust the default lookback values to suit your prefered trading style and timeframe. If you like to trade a shorter time frame, lowering the default lookback values will make the divergences drawn more sensitive to short term price action.
How do traders use divergences in their trading?
A divergence is considered a leading indicator in technical analysis , meaning it has the ability to indicate a potential price move in the short term future.
Hidden bullish and hidden bearish divergences, which indicate a potential continuation of the current trend are sometimes considered a good place for traders to begin, since trend continuation occurs more frequently than reversals, or trend changes.
When trading regular bullish divergences and regular bearish divergences, which are indications of a trend reversal, the probability of it doing so may increase when these occur at a strong support or resistance level . A common mistake new traders make is to get into a regular divergence trade too early, assuming it will immediately reverse, but these can continue to form for some time before the trend eventually changes, by using forms of support or resistance as an added confluence, such as when price reaches a moving average, the success rate when trading these patterns may increase.
Typically, traders will manually draw lines across the swing highs and swing lows of both the price chart and the oscillator to see whether they appear to present a divergence, this indicator will draw them for you, quickly and clearly, and can notify you when they occur.
Disclaimer: This script includes code from the stock UO by Tradingview as well as the Divergence for Many Indicators v4 by LonesomeTheBlue.
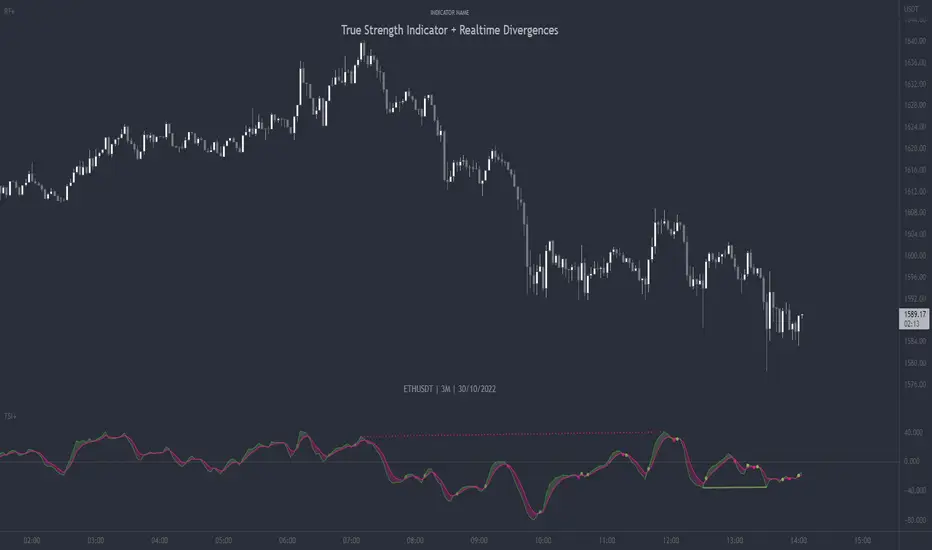
True Strength Indicator + Realtime DivergencesTrue Strength Indicator (TSI) + Realtime Divergences + Alerts + Lookback periods.
This version of the True Strength Indicator adds the following 5 additional features to the stock TSI by Tradingview:
- Optional divergence lines drawn directly onto the oscillator in realtime.
- Configurable alerts to notify you when divergences occur, as well as when the TSI and lagline bands crossover one another, when the oscillator begins heading up, or heading down.
- Configurable lookback periods to fine tune the divergences drawn in order to suit different trading styles and timeframes.
- Background colouring option to indicate when the two TSI bands, the TSI line and the TSI lagline, have crossed one another, either moving upwards or downwards, or optionally when the two TSI bands have crossed upwards and an external oscillator, which can be linked via the settings, has crossed above its centerline, and the TSI bands have crossed downwards and the external oscillator has crossed below its centerline.
- Alternate timeframe feature allows you to configure the oscillator to use data from a different timeframe than the chart it is loaded on.
This indicator adds additional features onto the stock TSI by Tradingview, whose core calculations remain unchanged, although this version has different settings as default to suit a shorter time period (it uses 6, 13, 4 by default, whereas the stock TSI typically ships with higher values, e.g. 25, 13, 13). Namely the configurable option to automatically, quickly and clearly draw divergence lines onto the oscillator for you as they occur in realtime. It also has the addition of unique alerts, so you can be notified when divergences occur without spending all day watching the charts. Furthermore, this version of the TSI comes with configurable lookback periods, which can be configured in order to adjust the sensitivity of the divergences, in order to suit shorter or higher timeframe trading approaches.
The True Strength Indicator
Tradingview describes the True Strength Indicator as follows:
“The True Strength Index (TSI) is a momentum oscillator that ranges between limits of -100 and +100 and has a base value of 0. Momentum is positive when the oscillator is positive (pointing to a bullish market bias) and vice versa. It was developed by William Blau and consists of 2 lines: the index line and an exponential moving average of the TSI, called the signal line. Traders may look for any of the following 5 types of conditions: overbought, oversold, centerline crossover, divergence and signal line crossover. The indicator is often used in combination with other signals..”
What are divergences?
Divergence is when the price of an asset is moving in the opposite direction of a technical indicator, such as an oscillator, or is moving contrary to other data. Divergence warns that the current price trend may be weakening, and in some cases may lead to the price changing direction.
There are 4 main types of divergence, which are split into 2 categories;
regular divergences and hidden divergences. Regular divergences indicate possible trend reversals, and hidden divergences indicate possible trend continuation.
Regular bullish divergence: An indication of a potential trend reversal, from the current downtrend, to an uptrend.
Regular bearish divergence: An indication of a potential trend reversal, from the current uptrend, to a downtrend.
Hidden bullish divergence: An indication of a potential uptrend continuation.
Hidden bearish divergence: An indication of a potential downtrend continuation.
Setting alerts.
With this indicator you can set alerts to notify you when any/all of the above types of divergences occur, on any chart timeframe you choose.
Configurable lookback values.
You can adjust the default lookback values to suit your prefered trading style and timeframe. If you like to trade a shorter time frame, lowering the default lookback values will make the divergences drawn more sensitive to short term price action.
How do traders use divergences in their trading?
A divergence is considered a leading indicator in technical analysis , meaning it has the ability to indicate a potential price move in the short term future.
Hidden bullish and hidden bearish divergences, which indicate a potential continuation of the current trend are sometimes considered a good place for traders to begin, since trend continuation occurs more frequently than reversals, or trend changes.
When trading regular bullish divergences and regular bearish divergences, which are indications of a trend reversal, the probability of it doing so may increase when these occur at a strong support or resistance level . A common mistake new traders make is to get into a regular divergence trade too early, assuming it will immediately reverse, but these can continue to form for some time before the trend eventually changes, by using forms of support or resistance as an added confluence, such as when price reaches a moving average, the success rate when trading these patterns may increase.
Typically, traders will manually draw lines across the swing highs and swing lows of both the price chart and the oscillator to see whether they appear to present a divergence, this indicator will draw them for you, quickly and clearly, and can notify you when they occur.
Disclaimer: This script includes code from the stock TSI by Tradingview as well as the Divergence for Many Indicators v4 by LonesomeTheBlue
TSI + DivergencesTrue Strength Indicator (TSI) + Divergences + Alerts + Lookback periods.
This version of the True Strength Indicator adds the following 3 additional features to the stock TSI by Tradingview:
- Optional divergence lines drawn directly onto the oscillator.
- Configurable alerts to notify you when divergences occur.
- Configurable lookback periods to fine tune the divergences drawn in order to suit different trading styles and timeframes.
This indicator adds additional features onto the stock TSI by Tradingview, whose core calculations remain unchanged. Namely the configurable option to automatically, quickly and clearly draw divergence lines onto the oscillator for you as they occur, with minimal delay. It also has the addition of unique alerts, so you can be notified when divergences occur without spending all day watching the charts. Furthermore, this version of the TSI comes with configurable lookback periods, which can be configured in order to adjust the sensitivity of the divergences, in order to suit shorter or higher timeframe trading approaches.
The True Strength Indicator
Tradingview describes the True Strength Indicator as follows:
“The True Strength Index (TSI) is a momentum oscillator that ranges between limits of -100 and +100 and has a base value of 0. Momentum is positive when the oscillator is positive (pointing to a bullish market bias) and vice versa. It was developed by William Blau and consists of 2 lines: the index line and an exponential moving average of the TSI, called the signal line. Traders may look for any of the following 5 types of conditions: overbought, oversold, centerline crossover, divergence and signal line crossover. The indicator is often used in combination with other signals..”
What are divergences?
Divergence is when the price of an asset is moving in the opposite direction of a technical indicator, such as an oscillator, or is moving contrary to other data. Divergence warns that the current price trend may be weakening, and in some cases may lead to the price changing direction.
There are 4 main types of divergence, which are split into 2 categories;
regular divergences and hidden divergences. Regular divergences indicate possible trend reversals, and hidden divergences indicate possible trend continuation.
Regular bullish divergence: An indication of a potential trend reversal, from the current downtrend, to an uptrend.
Regular bearish divergence: An indication of a potential trend reversal, from the current uptrend, to a downtrend.
Hidden bullish divergence: An indication of a potential uptrend continuation.
Hidden bearish divergence: An indication of a potential downtrend continuation.
Setting alerts.
With this indicator you can set alerts to notify you when any/all of the above types of divergences occur, on any chart timeframe you choose.
Configurable lookback values.
You can adjust the default lookback values to suit your prefered trading style and timeframe. If you like to trade a shorter time frame, lowering the default lookback values will make the divergences drawn more sensitive to short term price action.
How do traders use divergences in their trading?
A divergence is considered a leading indicator in technical analysis, meaning it has the ability to indicate a potential price move in the short term future.
Hidden bullish and hidden bearish divergences, which indicate a potential continuation of the current trend are sometimes considered a good place for traders to begin, since trend continuation occurs more frequently than reversals, or trend changes.
When trading regular bullish divergences and regular bearish divergences, which are indications of a trend reversal, the probability of it doing so may increase when these occur at a strong support or resistance level. A common mistake new traders make is to get into a regular divergence trade too early, assuming it will immediately reverse, but these can continue to form for some time before the trend eventually changes, by using forms of support or resistance as an added confluence, such as when price reaches a moving average, the success rate when trading these patterns may increase.
Typically, traders will manually draw lines across the swing highs and swing lows of both the price chart and the oscillator to see whether they appear to present a divergence, this indicator will draw them for you, quickly and clearly, and can notify you when they occur.
Disclaimer : This script includes code from the stock TSI by Tradingview as well as the RSI divergence indicator.

Ultimate Oscillator + DivergencesUltimate Oscillator (UO) + Divergences + Alerts + Lookback periods.
This version of the Ultimate Oscillator adds the following 3 additional features to the stock UO by Tradingview:
- Optional divergence lines drawn directly onto the oscillator.
- Configurable alerts to notify you when divergences occur.
- Configurable lookback periods to fine tune the divergences drawn in order to suit different trading styles and timeframes.
This indicator adds additional features onto the stock Ultimate Oscillator by Tradingview, whose core calculations remain unchanged. Namely the configurable option to automatically, quickly and clearly draw divergence lines onto the oscillator for you as they occur, with minimal delay. It also has the addition of unique alerts, so you can be notified when divergences occur without spending all day watching the charts. Furthermore, this version of the Ultimate Oscillator comes with configurable lookback periods, which can be configured in order to adjust the sensitivity of the divergences, in order to suit shorter or higher timeframe trading approaches.
The Ultimate Oscillator
Tradingview describes the Ultimate Oscillator as follows:
“The Ultimate Oscillator indicator (UO) indicator is a technical analysis tool used to measure momentum across three varying timeframes. The problem with many momentum oscillators is that after a rapid advance or decline in price, they can form false divergence trading signals. For example, after a rapid rise in price, a bearish divergence signal may present itself, however price continues to rise. The ultimate Oscillator attempts to correct this by using multiple timeframes in its calculation as opposed to just one timeframe which is what is used in most other momentum oscillators.”
More information on the history, use cases and calculations of the Ultimate Oscillator can be found here: www.tradingview.com
What are divergences?
Divergence is when the price of an asset is moving in the opposite direction of a technical indicator, such as an oscillator, or is moving contrary to other data. Divergence warns that the current price trend may be weakening, and in some cases may lead to the price changing direction.
There are 4 main types of divergence, which are split into 2 categories;
regular divergences and hidden divergences . Regular divergences indicate possible trend reversals, and hidden divergences indicate possible trend continuation.
Regular bullish divergence: An indication of a potential trend reversal, from the current downtrend, to an uptrend.
Regular bearish divergence: An indication of a potential trend reversal, from the current uptrend, to a downtrend.
Hidden bullish divergence: An indication of a potential uptrend continuation.
Hidden bearish divergence: An indication of a potential downtrend continuation.
Setting alerts.
With this indicator you can set alerts to notify you when any/all of the above types of divergences occur, on any chart timeframe you choose.
Configurable lookback values.
You can adjust the default lookback values to suit your prefered trading style and timeframe. If you like to trade a shorter time frame, lowering the default lookback values will make the divergences drawn more sensitive to short term price action.
How do traders use divergences in their trading?
A divergence is considered a leading indicator in technical analysis, meaning it has the ability to indicate a potential price move in the short term future.
Hidden bullish and hidden bearish divergences, which indicate a potential continuation of the current trend are sometimes considered a good place for traders to begin, since trend continuation occurs more frequently than reversals, or trend changes.
When trading regular bullish divergences and regular bearish divergences, which are indications of a trend reversal, the probability of it doing so may increase when these occur at a strong support or resistance level. A common mistake new traders make is to get into a regular divergence trade too early, assuming it will immediately reverse, but these can continue to form for some time before the trend eventually changes, by using forms of support or resistance as an added confluence, such as when price reaches a moving average, the success rate when trading these patterns may increase.
Typically, traders will manually draw lines across the swing highs and swing lows of both the price chart and the oscillator to see whether they appear to present a divergence, this indicator will draw them for you, quickly and clearly, and can notify you when they occur.
Disclaimer : This script includes code from the stock UO by Tradingview as well as the RSI divergence indicator.
Silen's Financials P/E & P/S[x10] RatesThis script aims to give a better visualization of P/E and P/S rates compared to the build-in "Price to earnings ratio" and "Price to sales ratio" in the "Financials" Section of Tradingview. For those of you don't know, those rates compare earnings and sales with your share price in regard to market cap and outstanding shares.
The scripts differs to the build-in versions in the following points:
- P/E & P/S rates are combined in one indicator
- Negative P/E rates are displayed better: Positive P/E rates are green, Negative P/E rates are red
- For visualization reasons, the indicator will cap positive and negative P/E rates at 100. (P/E rates above those levels are not siginificant either way)
- P/E & P/S rate are directly displayed on the graph
- Both P/E and P/S rates are combined on one left scale
- For visualization reasons, P/S rate is showing 10x the actual P/S rate. Using the standard P/S rate would result in hard-to-recognize changes of the P/S line.
To sum up:
- Positive P/E rates are green
- Negative P/E rate are red
- P/S rates are multiplied by 1 0
- P/S rates are yellow
How to use P/E and P/S rates:
The US market average for P/E rates is roughly ~18 in the US right now (10/2022) while the market average for P/S rates is roughly ~3 in the US. Note that average P/E and P/S can change when the market situation changes.
P/E and P/S rates help you value your stock better and help you decide whether your stock is undervalued or overvalued compared to the market or the industry when it comes to earnings and sales. If you compare to Market averages, a positive P/E of less than 18 means that your stock is likely unvervalued. A P/S rate below 3 (30 in the chart!) means that your stock is likely undervalued as well. If your stock shows rates above those, it is likely that it is overvalued compared to market averages.
Please note that P/E and P/S rates are not the only factors that make up a stock valuation. Valuations are complex and subjective.
A positive P/E rate also means that your company is profitable.
A Negative P/E rate means that your company is unprofitable.
If you have any questions or feedback let me know!
Disclaimer: This script doesn't show the actual P/S rate. It shows the P/S rate multiplied by 10, due to visualization issues. Positive P/E Rates above 100 are displayed as 100. Positive P/E rates are green, Negative P/E rates are red and multiplied by -1.
Disclaimer2: @Tradingview_Team: I couldn't find the right category for this script but categories are mandatory. I assume that "Breadth Indicators" is still the closest there is. Please let me know if you want me to change the category.
Disclaimer3: For visualization, the opacity of the displayed image is 70%. The standard opacity for the P/E and P/S lines is 50% and can be changed in the indicator settings. I found this setting more useful when working together with other indicators on the same chart
Disclaimer4: Earnings Per Share, Total Revenue used are TTM. Total Shares Outstanding used are FQ.

Line breakI decided to help TradingView programmers and wrote code that converts a standard candles / bars to a line break chart. The built-in linebreak() and security() functions for constructing a Linear Break chart are bad, the chart is not built correctly, and does not correspond to the Line Breakout chart built into TradingView. I’m talking about simulating the Linear Break lines using the plotcandle() annotation, because these are the same candles without shadows. When you try to use the market simulator, when the gaps are turned on in the security() function, nothing is added to the chart, and when turned off, a completely different line break chart is drawn. Do not try to write strategies based on the built-in linebreak() function! The developers write in the manual: "Please note that you cannot plot Line Break boxes from Pine script exactly as they look. You can only get a series of numbers similar to OHLC values for Line Break charts and use them in your algorithms." However, it is possible to build a “Linear Breakthrough” chart exactly like the “Linear Breakthrough" chart built into TradingView. Personally, I had enough Pine Script functionality.
For a complete understanding of how such a graph is built, you can refer to Steve Nison's book “BEYOND JAPANESE CANDLES” and see the instructions for creating a “Three-Line Breakthrough” chart (the number of lines for a breakthrough is three):
Rule 1: if today's price is above the base price (closing the first candle), draw a white line from the base price to the new maximum price (before closing).
or Rule 2: if today's price is below the base price, draw a black line from the base price to the new low of prices (before closing).
Rule 3: if today's price is no different from the base, do not draw any line.
Rule 4: if today's price rises above the maximum of the first line, shift to the column to the right and draw a new white line from the previous maximum to the new maximum of prices.
Rule 5: if the price is below the low of the first line, move one column to the right and draw a new black line down from the previous low to the new low of prices.
Rule 6: if the price is kept in the range of the first line, nothing is applied to the chart.
Rule 7: if the market reaches a new maximum, surpassing the maximum of previous lines, move to the column to the right and draw a new white line up to a new maximum.
Rule 8: if today's price is below the low of previous lines (i.e. there is a new low), move to the right column and draw a new black line down to a new low.
Rule 9: if the price is in the range of the first two lines, nothing is applied to the chart.
Rule 10: if there is a series of three white lines, a new white line is drawn when a new maximum is reached (even if it is only one tick higher than the old one). Under the same conditions, for drawing a black reversal line, the price should fall below the minimum of the series of the last three white lines. Such a black line is called a black reversal line. It runs from the base of the highest white line to a new low of price.
Rule 11: if there is a series of three black lines, a new black line is drawn when a new minimum is reached. Under the same conditions, for drawing a white line, called a white reversal line, the price must exceed the maximum of the previous three black lines. This line is drawn from the top of the lowest black line to a new high of the price.
So, the script was not small, but the idea is extremely simple: if you need to break n lines to build a line, then among these n lines (or less, if this is the beginning of the chart), the maximum or minimum of closures and openings will be searched. If the current candles closed above or below these highs or lows, then a new line is added to the chart on the current candles (trend or breakout). According to my observations, this script draws a chart that is completely identical to the Line Breakout chart built into TradingView, but of course with gaps, as there is time in the candles / bar chart. I stuffed all the logic into a wrapper in the form of the get_linebreak() function, which returns a tuple of OHLC values. And these series with the help of the plotcandle() annotation can be converted to the "Linear Breakthrough" chart. I also want to note that with a large number of candles on the chart, outrages about the buffer size uncertainty are heard from the TradingView black box. Because of this, in the annotation study() set the value to the max_bars_back parameter.
In general, use it (for example, to write strategies)!
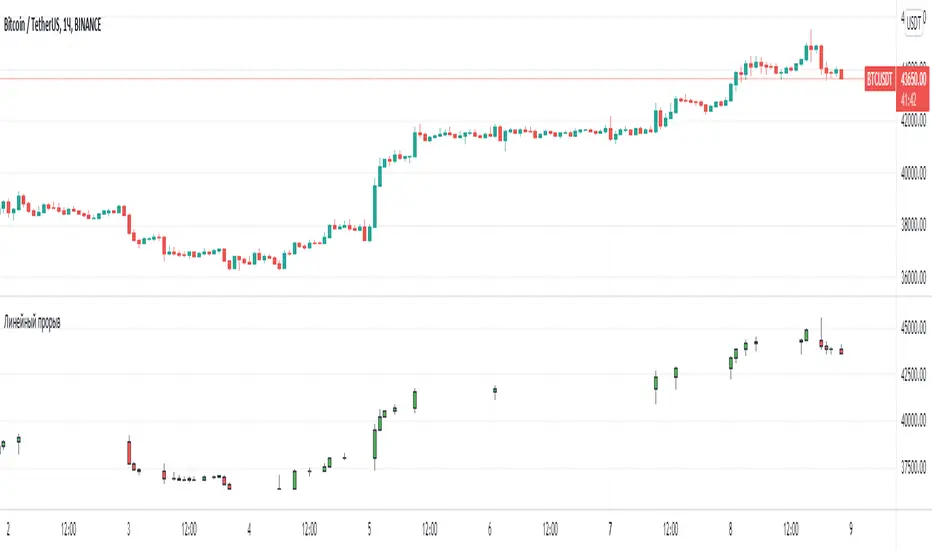
Smart Margin Zone
SMART MARGIN ZONE - CME-BASED SUPPORT & RESISTANCE INDICATOR
TITLE FOR PUBLICATION:
Smart Margin Zone - CME Margin-Based Support and Resistance
CATEGORY:
Support and Resistance
SHORT DESCRIPTION (for preview):
Automatically plots margin zones based on CME Group requirements. These zones represent critical price levels where leveraged traders face margin calls, creating natural support and resistance through forced liquidations.
═══════════════════════════════════════════════════════════════
FULL DESCRIPTION FOR TRADINGVIEW:
═══════════════════════════════════════════════════════════════
📊 Smart Margin Zone - Professional Trading Zones Based on CME Data
This indicator automatically calculates and displays margin zones derived from official CME Group margin requirements. These zones represent critical price levels where traders using leverage receive margin calls, triggering forced position closures that create natural support and resistance levels.
═══════════════════════════════════════════════════════════════
🎯 CORE CONCEPT
═══════════════════════════════════════════════════════════════
When price reaches calculated margin zones, traders using 2:1 or 4:1 leverage on CME futures receive margin calls. Brokers automatically liquidate these positions, creating waves of buying or selling pressure that form strong support and resistance levels.
This is not theoretical - it's based on actual margin requirements from CME Group, the world's largest derivatives marketplace.
═══════════════════════════════════════════════════════════════
📐 CALCULATION METHODOLOGY
═══════════════════════════════════════════════════════════════
The indicator uses the following formula to calculate zone sizes:
Zone Size = (Margin Requirement / Tick Value) × Tick Size × 1.10
Where:
• Margin Requirement = Official CME initial margin (updated November 2024)
• Tick Value = Dollar value of minimum price movement
• Tick Size = Minimum price increment
• 1.10 = 10% buffer for realistic zone width
SUPPORTED INSTRUMENTS WITH CME DATA:
Currency Pairs:
• EURUSD: $2,100 margin → 0.0168 zone size
• GBPUSD: $1,800 margin → 0.0144 zone size
• AUDUSD: $1,300 margin → 0.0065 zone size
• NZDUSD: $1,100 margin → 0.0055 zone size
• USDJPY: $3,200 margin → custom calculation
• USDCAD: $950 margin → calculated
• USDCHF: $1,650 margin → calculated
Commodities:
• Gold (XAUUSD): $8,000 margin → 80 points zone size
• Silver (XAGUSD): $6,500 margin → calculated
• WTI Crude Oil: $4,500 margin → calculated
═══════════════════════════════════════════════════════════════
🔍 HOW IT WORKS
═══════════════════════════════════════════════════════════════
1. SWING POINT DETECTION
The indicator automatically identifies swing highs and swing lows using a configurable lookback period (default 10 bars). These become anchor points for zone calculations.
2. FIVE ZONE LEVELS
From each swing point, five zone levels are calculated:
• Zone 1/4 (25%) - First correction level
• Zone 1/2 (50%) - KEY ZONE for trend determination
• Zone 3/4 (75%) - Intermediate level
• Zone 1/1 (100%) - Full margin zone (strongest level)
• Zone 5/4 (125%) - Extended zone
3. TREND IDENTIFICATION
• Close above Zone 1/2 resistance = Bullish trend
• Close below Zone 1/2 support = Bearish trend
• Between zones = Range/consolidation
4. HISTORICAL CONTEXT
Current zones are displayed prominently with fills and labels. Historical zones appear as thin, semi-transparent lines for context without cluttering the chart.
═══════════════════════════════════════════════════════════════
⚙️ FEATURES
═══════════════════════════════════════════════════════════════
AUTOMATED CALCULATION:
✅ Auto-detection of swing highs and lows
✅ Real-time zone updates as new swings form
✅ CME margin data built-in for major instruments
✅ Manual override option for custom calculations
VISUAL CLARITY:
✅ Color-coded zones (red=resistance, green=support)
✅ Adjustable transparency for fills and lines
✅ Current zones bold with fills and price labels
✅ Historical zones thin and transparent
✅ Swing point markers show calculation origins
CUSTOMIZATION:
✅ Show/hide individual zone levels (1/4, 1/2, 3/4, 1/1, 5/4)
✅ Toggle historical zones on/off
✅ Adjustable lookback period (5-50 bars)
✅ Customizable colors for all elements
✅ Line width and transparency controls
✅ Zone extension options (none/right/both)
TREND ANALYSIS:
✅ Optional trend background coloring
✅ Customizable trend colors and transparency
✅ Real-time trend identification display
STATISTICS:
✅ Live statistics table showing:
- Current instrument
- Active zone size
- Calculation mode
- Current trend direction
- Number of zones displayed
ALERTS:
✅ Zone 1/2 breakout (up/down)
✅ Full margin zone 1/1 reached
✅ Customizable alert messages
═══════════════════════════════════════════════════════════════
📈 TRADING APPLICATIONS
═══════════════════════════════════════════════════════════════
ENTRY SIGNALS:
• Bounces from zone levels = potential entry points
• Zone 1/2 breakouts = trend continuation entries
• Zone rejections = reversal opportunities
RISK MANAGEMENT:
• Zone levels = logical stop-loss placement
• Zone 1/1 = maximum risk level
• Zone spacing = position sizing guide
PROFIT TARGETS:
• Next zone level = first target
• Zone 1/1 = full profit target
• Zone breakouts = extended targets
TREND CONFIRMATION:
• Price above Zone 1/2 resistance = confirmed uptrend
• Price below Zone 1/2 support = confirmed downtrend
• Consolidation between zones = wait for breakout
═══════════════════════════════════════════════════════════════
📚 USAGE INSTRUCTIONS
═══════════════════════════════════════════════════════════════
GETTING STARTED:
1. Add indicator to chart of any supported instrument
2. Zones automatically calculate and display
3. Adjust swing detection period if needed (default 10 works well)
4. Customize colors and visibility to your preference
OPTIMAL SETTINGS:
• Best timeframes: H1, H4, Daily, Weekly
• Default swing length (10) suitable for most markets
• Show 2-3 historical zones for context
• Enable swing point markers to see calculation origins
INTERPRETATION:
• Watch for price reactions at zone boundaries
• Strong bounces = respect for margin level
• Clean breaks = momentum continuation
• Multiple touches = zone strength confirmation
SET ALERTS:
• Zone 1/2 breakouts for trend entries
• Zone 1/1 reaches for profit-taking
• Custom alerts for your specific strategy
═══════════════════════════════════════════════════════════════
⚠️ IMPORTANT NOTES
═══════════════════════════════════════════════════════════════
DATA ACCURACY:
• CME margin requirements updated November 2024
• Margins change periodically - check CME Group website
• Manual mode available for latest margin data
• Indicator provides analysis tool, not financial advice
STATISTICAL PERFORMANCE:
• Historical data shows >60% probability of continued movement after Zone 1/2 breakout
• Zone effectiveness varies by market conditions
• Best results in trending markets with clear swings
LIMITATIONS:
• Margin requirements change - monitor CME updates
• Works best on liquid instruments with clear swings
• Not a standalone trading system
• Should be combined with additional analysis
═══════════════════════════════════════════════════════════════
🔧 METHODOLOGY CREDIT
═══════════════════════════════════════════════════════════════
This indicator is based on the margin zones concept developed by Alexander Bazylev (BTrade indicator for MetaTrader platforms).
The TradingView implementation has been completely rewritten with original enhancements:
• Multiple zone levels instead of single level
• Automatic swing point detection algorithm
• Direct CME data integration
• Historical zone visualization
• Advanced customization options
• Comprehensive statistics and alerts
All code is original and specifically designed for TradingView's Pine Script v5 environment.
═══════════════════════════════════════════════════════════════
💡 BEST PRACTICES
═══════════════════════════════════════════════════════════════
COMBINE WITH:
• Volume analysis for confirmation
• Trend indicators for direction bias
• Price action patterns at zones
• Higher timeframe analysis
AVOID:
• Trading against strong trends at minor zones
• Over-leveraging based solely on zone placement
• Ignoring broader market context
• Expecting perfect bounces every time
OPTIMIZE:
• Adjust swing length for different timeframes
• Shorter period (5-7) for intraday trading
• Longer period (15-20) for swing trading
• Test historical effectiveness on your instruments
═══════════════════════════════════════════════════════════════
📖 EDUCATIONAL VALUE
═══════════════════════════════════════════════════════════════
This indicator helps traders understand:
• How institutional margin requirements affect price
• Where forced liquidations create pressure
• Natural support and resistance formation
• Relationship between leverage and price levels
• Market structure and key technical levels
═══════════════════════════════════════════════════════════════
🔄 VERSION HISTORY
═══════════════════════════════════════════════════════════════
Version 1.0 (Initial Release):
• CME-based zone calculation for 10 instruments
• Automatic swing high/low detection
• 5 zone levels with customizable display
• Historical zones with transparency control
• Swing point markers
• Trend background indicator
• Live statistics table
• Multiple alert conditions
• Fully customizable colors and styles
• English language interface
═══════════════════════════════════════════════════════════════
📞 SUPPORT & FEEDBACK
═══════════════════════════════════════════════════════════════
Questions or suggestions? Leave a comment below!
If you find this indicator useful:
⭐ Please leave a like
💬 Share your experience in comments
🔔 Follow for updates and new indicators
═══════════════════════════════════════════════════════════════
⚖️ DISCLAIMER
═══════════════════════════════════════════════════════════════
This indicator is provided for educational and analytical purposes only. It is not financial advice and should not be the sole basis for trading decisions.
• Past performance does not guarantee future results
• Trading involves substantial risk of loss
• CME margin requirements subject to change
• Always do your own research and risk management
• Consult a financial advisor for investment advice
The creator is not responsible for any trading losses incurred through use of this indicator.

Range Oscillator Strategy + Stoch Confirm🔹 Short summary
This is a free, educational long-only strategy built on top of the public “Range Oscillator” by Zeiierman (used under CC BY-NC-SA 4.0), combined with a Stochastic timing filter, an EMA-based exit filter and an optional risk-management layer (SL/TP and R-multiple exits). It is NOT financial advice and it is NOT a magic money machine. It’s a structured framework to study how range-expansion + momentum + trend slope can be combined into one rule-based system, often with intentionally RARE trades.
────────────────────────
0. Legal / risk disclaimer
────────────────────────
• This script is FREE and public. I do not charge any fee for it.
• It is for EDUCATIONAL PURPOSES ONLY.
• It is NOT financial advice and does NOT guarantee profits.
• Backtest results can be very different from live results.
• Markets change over time; past performance is NOT indicative of future performance.
• You are fully responsible for your own trades and risk.
Please DO NOT use this script with money you cannot afford to lose. Always start in a demo / paper trading environment and make sure you understand what the logic does before you risk any capital.
────────────────────────
1. About default settings and risk (very important)
────────────────────────
The script is configured with the following defaults in the `strategy()` declaration:
• `initial_capital = 10000`
→ This is only an EXAMPLE account size.
• `default_qty_type = strategy.percent_of_equity`
• `default_qty_value = 100`
→ This means 100% of equity per trade in the default properties.
→ This is AGGRESSIVE and should be treated as a STRESS TEST of the logic, not as a realistic way to trade.
TradingView’s House Rules recommend risking only a small part of equity per trade (often 1–2%, max 5–10% in most cases). To align with these recommendations and to get more realistic backtest results, I STRONGLY RECOMMEND you to:
1. Open **Strategy Settings → Properties**.
2. Set:
• Order size: **Percent of equity**
• Order size (percent): e.g. **1–2%** per trade
3. Make sure **commission** and **slippage** match your own broker conditions.
• By default this script uses `commission_value = 0.1` (0.1%) and `slippage = 3`, which are reasonable example values for many crypto markets.
If you choose to run the strategy with 100% of equity per trade, please treat it ONLY as a stress-test of the logic. It is NOT a sustainable risk model for live trading.
────────────────────────
2. What this strategy tries to do (conceptual overview)
────────────────────────
This is a LONG-ONLY strategy designed to explore the combination of:
1. **Range Oscillator (Zeiierman-based)**
- Measures how far price has moved away from an adaptive mean.
- Uses an ATR-based range to normalize deviation.
- High positive oscillator values indicate strong price expansion away from the mean in a bullish direction.
2. **Stochastic as a timing filter**
- A classic Stochastic (%K and %D) is used.
- The logic requires %K to be below a user-defined level and then crossing above %D.
- This is intended to catch moments when momentum turns up again, rather than chasing every extreme.
3. **EMA Exit Filter (trend slope)**
- An EMA with configurable length (default 70) is calculated.
- The slope of the EMA is monitored: when the slope turns negative while in a long position, and the filter is enabled, it triggers an exit condition.
- This acts as a trend-protection exit: if the medium-term trend starts to weaken, the strategy exits even if the oscillator has not yet fully reverted.
4. **Optional risk-management layer**
- Percentage-based Stop Loss and Take Profit (SL/TP).
- Risk/Reward (R-multiple) exit based on the distance from entry to SL.
- Implemented as OCO orders that work *on top* of the logical exits.
The goal is not to create a “holy grail” system but to serve as a transparent, configurable framework for studying how these concepts behave together on different markets and timeframes.
────────────────────────
3. Components and how they work together
────────────────────────
(1) Range Oscillator (based on “Range Oscillator (Zeiierman)”)
• The script computes a weighted mean price and then measures how far price deviates from that mean.
• Deviation is normalized by an ATR-based range and expressed as an oscillator.
• When the oscillator is above the **entry threshold** (default 100), it signals a strong move away from the mean in the bullish direction.
• When it later drops below the **exit threshold** (default 30), it can trigger an exit (if enabled).
(2) Stochastic confirmation
• Classic Stochastic (%K and %D) is calculated.
• An entry requires:
- %K to be below a user-defined “Cross Level”, and
- then %K to cross above %D.
• This is a momentum confirmation: the strategy tries to enter when momentum turns up from a pullback rather than at any random point.
(3) EMA Exit Filter
• The EMA length is configurable via `emaLength` (default 70).
• The script monitors the EMA slope: it computes the relative change between the current EMA and the previous EMA.
• If the slope turns negative while the strategy holds a long position and the filter is enabled, it triggers an exit condition.
• This is meant to help protect profits or cut losses when the medium-term trend starts to roll over, even if the oscillator conditions are not (yet) signalling exit.
(4) Risk management (optional)
• Stop Loss (SL) and Take Profit (TP):
- Defined as percentages relative to average entry price.
- Both are disabled by default, but you can enable them in the Inputs.
• Risk/Reward Exit:
- Uses the distance from entry to SL to project a profit target at a configurable R-multiple.
- Also optional and disabled by default.
These exits are implemented as `strategy.exit()` OCO orders and can close trades independently of oscillator/EMA conditions if hit first.
────────────────────────
4. Entry & Exit logic (high level)
────────────────────────
A) Time filter
• You can choose a **Start Year** in the Inputs.
• Only candles between the selected start date and 31 Dec 2069 are used for backtesting (`timeCondition`).
• This prevents accidental use of tiny cherry-picked windows and makes tests more honest.
B) Entry condition (long-only)
A long entry is allowed when ALL the following are true:
1. `timeCondition` is true (inside the backtest window).
2. If `useOscEntry` is true:
- Range Oscillator value must be above `entryLevel`.
3. If `useStochEntry` is true:
- Stochastic condition (`stochCondition`) must be true:
- %K < `crossLevel`, then %K crosses above %D.
If these filters agree, the strategy calls `strategy.entry("Long", strategy.long)`.
C) Exit condition (logical exits)
A position can be closed when:
1. `timeCondition` is true AND a long position is open, AND
2. At least one of the following is true:
- If `useOscExit` is true: Oscillator is below `exitLevel`.
- If `useMagicExit` (EMA Exit Filter) is true: EMA slope is negative (`isDown = true`).
In that case, `strategy.close("Long")` is called.
D) Risk-management exits
While a position is open:
• If SL or TP is enabled:
- `strategy.exit("Long Risk", ...)` places an OCO stop/limit order based on the SL/TP percentages.
• If Risk/Reward exit is enabled:
- `strategy.exit("RR Exit", ...)` places an OCO order using a projected R-multiple (`rrMult`) of the SL distance.
These risk-based exits can trigger before the logical oscillator/EMA exits if price hits those levels.
────────────────────────
5. Recommended backtest configuration (to avoid misleading results)
────────────────────────
To align with TradingView House Rules and avoid misleading backtests:
1. **Initial capital**
- 10 000 (or any value you personally want to work with).
2. **Order size**
- Type: **Percent of equity**
- Size: **1–2%** per trade is a reasonable starting point.
- Avoid risking more than 5–10% per trade if you want results that could be sustainable in practice.
3. **Commission & slippage**
- Commission: around 0.1% if that matches your broker.
- Slippage: a few ticks (e.g. 3) to account for real fills.
4. **Timeframe & markets**
- Volatile symbols (e.g. crypto like BTCUSDT, or major indices).
- Timeframes: 1H / 4H / **1D (Daily)** are typical starting points.
- I strongly recommend trying the strategy on **different timeframes**, for example 1D, to see how the behaviour changes between intraday and higher timeframes.
5. **No “caution warning”**
- Make sure your chosen symbol + timeframe + settings do not trigger TradingView’s caution messages.
- If you see warnings (e.g. “too few trades”), adjust timeframe/symbol or the backtest period.
────────────────────────
5a. About low trade count and rare signals
────────────────────────
This strategy is intentionally designed to trade RARELY:
• It is **long-only**.
• It uses strict filters (Range Oscillator threshold + Stochastic confirmation + optional EMA Exit Filter).
• On higher timeframes (especially **1D / Daily**) this can result in a **low total number of trades**, sometimes WELL BELOW 100 trades over the whole backtest.
TradingView’s House Rules mention 100+ trades as a guideline for more robust statistics. In this specific case:
• The **low trade count is a conscious design choice**, not an attempt to cherry-pick a tiny, ultra-profitable window.
• The goal is to study a **small number of high-conviction long entries** on higher timeframes, not to generate frequent intraday signals.
• Because of the low trade count, results should NOT be interpreted as statistically strong or “proven” – they are only one sample of how this logic would have behaved on past data.
Please keep this in mind when you look at the equity curve and performance metrics. A beautiful curve with only a handful of trades is still just a small sample.
────────────────────────
6. How to use this strategy (step-by-step)
────────────────────────
1. Add the script to your chart.
2. Open the **Inputs** tab:
- Set the backtest start year.
- Decide whether to use Oscillator-based entry/exit, Stochastic confirmation, and EMA Exit Filter.
- Optionally enable SL, TP, and Risk/Reward exits.
3. Open the **Properties** tab:
- Set a realistic account size if you want.
- Set order size to a realistic % of equity (e.g. 1–2%).
- Confirm that commission and slippage are realistic for your broker.
4. Run the backtest:
- Look at Net Profit, Max Drawdown, number of trades, and equity curve.
- Remember that a low trade count means the statistics are not very strong.
5. Experiment:
- Tweak thresholds (`entryLevel`, `exitLevel`), Stochastic settings, EMA length, and risk params.
- See how the metrics and trade frequency change.
6. Forward-test:
- Before using any idea in live trading, forward-test on a demo account and observe behaviour in real time.
────────────────────────
7. Originality and usefulness (why this is more than a mashup)
────────────────────────
This script is not intended to be a random visual mashup of indicators. It is designed as a coherent, testable strategy with clear roles for each component:
• Range Oscillator:
- Handles mean vs. range-expansion states via an adaptive, ATR-normalized metric.
• Stochastic:
- Acts as a timing filter to avoid entering purely on extremes and instead waits for momentum to turn.
• EMA Exit Filter:
- Trend-slope-based safety net to exit when the medium-term direction changes against the position.
• Risk module:
- Provides practical, rule-based exits: SL, TP, and R-multiple exit, which are useful for structuring risk even if you modify the core logic.
It aims to give traders a ready-made **framework to study and modify**, not a black box or “signals” product.
────────────────────────
8. Limitations and good practices
────────────────────────
• No single strategy works on all markets or in all regimes.
• This script is long-only; it does not short the market.
• Performance can degrade when market structure changes.
• Overfitting (curve fitting) is a real risk if you endlessly tweak parameters to maximise historical profit.
Good practices:
- Test on multiple symbols and timeframes.
- Focus on stability and drawdown, not only on how high the profit line goes.
- View this as a learning tool and a basis for your own research.
────────────────────────
9. Licensing and credits
────────────────────────
• Core oscillator idea & base code:
- “Range Oscillator (Zeiierman)”
- © Zeiierman, licensed under CC BY-NC-SA 4.0.
• Strategy logic, Stochastic confirmation, EMA Exit Filter, and risk-management layer:
- Modifications by jokiniemi.
Please respect both the original license and TradingView House Rules if you fork or republish any part of this script.
────────────────────────
10. No payments / no vendor pitch
────────────────────────
• This script is completely FREE to use on TradingView.
• There is no paid subscription, no external payment link, and no private signals group attached to it.
• If you have questions, please use TradingView’s comment system or private messages instead of expecting financial advice.
Use this script as a tool to learn, experiment, and build your own understanding of markets.
────────────────────────
11. Example backtest settings used in screenshots
────────────────────────
To avoid any confusion about how the results shown in screenshots were produced, here is one concrete example configuration:
• Symbol: BTCUSDT (or similar major BTC pair)
• Timeframe: 1D (Daily)
• Backtest period: from 2018 to the most recent data
• Initial capital: 10 000
• Order size type: Percent of equity
• Order size: 2% per trade
• Commission: 0.1%
• Slippage: 3 ticks
• Risk settings: Stop Loss and Take Profit disabled by default, Risk/Reward exit disabled by default
• Filters: Range Oscillator entry/exit enabled, Stochastic confirmation enabled, EMA Exit Filter enabled
If you change any of these settings (symbol, timeframe, risk per trade, commission, slippage, filters, etc.), your results will look different. Please always adapt the configuration to your own risk tolerance, market, and trading style.

WASDE DatesOverview
WASDE Dates — a small, focused event indicator that displays confirmed USDA WASDE release dates for 2025 on the chart and marks each release day. The indicator is designed to be a lightweight timing tool for traders who want clean visual reminders and optional alerts around USDA WASDE publications.
Features
• Shows official WASDE release dates for 2025 in a compact chart table.
• Draws on-chart markers and a dotted vertical line on WASDE release days.
• Two alert conditions you can enable in TradingView: "WASDE Day Alert" and "WASDE 24h Reminder".
• Simple table position control (Top/Bottom, Left/Right) in the indicator settings.
• Minimal, self-contained code — no external data feeds or permissions required.
How to use
1. Apply the indicator to any chart and timeframe.
2. Use the indicator settings to choose table position.
3. Enable Alerts (if desired) via TradingView Alerts → choose “WASDE Day Alert” or “WASDE 24h Reminder”.
4. This version contains 2025 confirmed dates only — verify dates for live trading and enable alerts as needed.
Design & rationale
This indicator is intentionally not a technical trading signal. It is an event scheduler focused on clarity and low overhead: combine it with your existing setup to avoid being surprised by WASDE publications and to quickly inspect price action around these event dates.
Limitations & disclaimer
• This script shows **confirmed 2025** WASDE dates only. It does not provide trading advice or entry/exit signals. Use at your own risk.
• Double-check official USDA publishing times before executing trades.
• No external links or contact information are included in this description to comply with TradingView publishing rules.
Feature outlook (V2)
Planned V2 (future release): enhanced countdown (days → hours/minutes), optional inclusion of estimated 2026 dates marked as (TBC), and an invite-only/protected advanced version with reaction overlays (T+1/T+3) and extended alert options. V2 will be announced on this script page when ready.
Changelog
v1 — public release: 2025 confirmed dates, release markers, alerts, table position control.
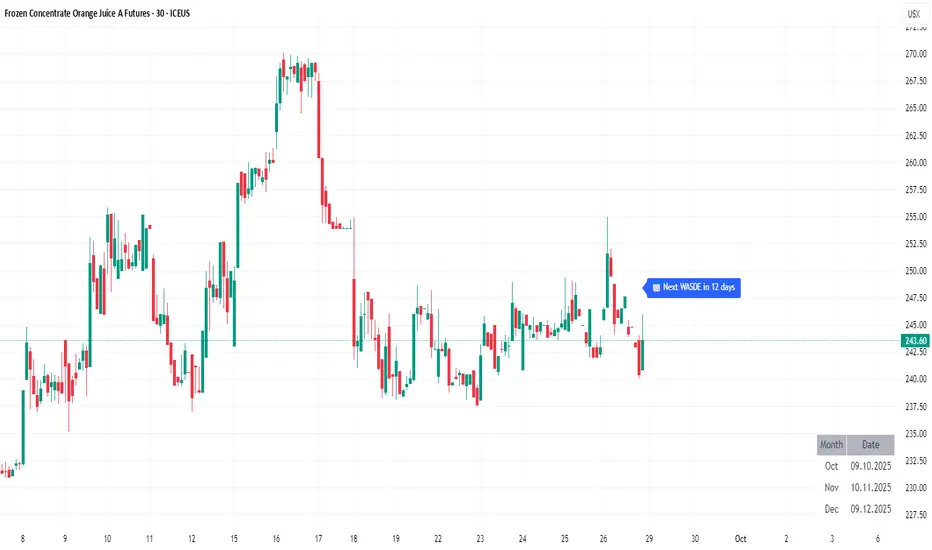
Hilly 3.0 Advanced Crypto Scalping Strategy - 1 & 5 Min ChartsHow to Use
Copy the Code: Copy the script above.
Paste in TradingView: Open TradingView, go to the Pine Editor (bottom of the chart), paste the code, and click “Add to Chart.”
Check for Errors: Verify no errors appear in the Pine Editor console. The script uses Pine Script v5 (@version=5).
Select Timeframe:
1-Minute Chart: Use defaults (emaFastLen=7, emaSlowLen=14, rsiLen=10, rsiOverbought=80, rsiOversold=20, slPerc=0.5, tpPerc=1.0, useCandlePatterns=false, patternLookback=10).
5-Minute Chart: Adjust to emaFastLen=9, emaSlowLen=21, rsiLen=14, rsiOverbought=75, rsiOversold=25, slPerc=0.8, tpPerc=1.5, useCandlePatterns=true, patternLookback=10.
Apply to Chart: Use a liquid crypto pair (e.g., BTC/USDT, ETH/USDT on Binance or Coinbase).
Verify Signals:
Green “BUY” or “EMA BUY” labels and triangle-up arrows below candles for bullish signals (EMA crossovers, bullish engulfing, hammer, doji, morning star, three white soldiers, double bottom).
Red “SELL” or “EMA SELL” labels and triangle-down arrows above candles for bearish signals (EMA crossovers, bearish engulfing, shooting star, doji, evening star, three black crows, double top).
Green/red background highlights for signal candles.
Backtest: Use TradingView’s Strategy Tester to evaluate performance over 1–3 months, checking Net Profit, Win Rate, and Drawdown.
Demo Test: Run on a demo account to confirm signal visibility and performance before trading with real funds.

Hilly 2.0 Advanced Crypto Scalping Strategy - 1 & 5 Min ChartsHow to Use
Copy the Code: Copy the script above.
Paste in TradingView: Open TradingView, go to the Pine Editor (bottom of the chart), paste the code, and click “Add to Chart.”
Check for Errors: Verify no errors appear in the Pine Editor console. The script uses Pine Script v5 (@version=5).
Select Timeframe:
1-Minute Chart: Use defaults (emaFastLen=7, emaSlowLen=14, rsiLen=10, rsiOverbought=80, rsiOversold=20, slPerc=0.5, tpPerc=1.0, useCandlePatterns=false).
5-Minute Chart: Adjust to emaFastLen=9, emaSlowLen=21, rsiLen=14, rsiOverbought=75, rsiOversold=25, slPerc=0.8, tpPerc=1.5, useCandlePatterns=true.
Apply to Chart: Use a liquid crypto pair (e.g., BTC/USDT, ETH/USDT on Binance or Coinbase).
Verify Signals:
Green “BUY” or “EMA BUY” labels and triangle-up arrows below candles.
Red “SELL” or “EMA SELL” labels and triangle-down arrows above candles.
Green/red background highlights for signal candles.
Arrows use size.normal for consistent visibility.
Backtest: Use TradingView’s Strategy Tester to evaluate performance over 1–3 months, checking Net Profit, Win Rate, and Drawdown.
Demo Test: Run on a demo account to confirm signal visibility and performance before trading with real funds.
