ADX for BTC [PineIndicators]The ADX Strategy for BTC is a trend-following system that uses the Average Directional Index (ADX) to determine market strength and momentum shifts. Designed for Bitcoin trading, this strategy applies a customizable ADX threshold to confirm trend signals and optionally filters entries using a Simple Moving Average (SMA). The system features automated entry and exit conditions, dynamic trade visualization, and built-in trade tracking for historical performance analysis.
⚙️ Core Strategy Components
1️⃣ Average Directional Index (ADX) Calculation
The ADX indicator measures trend strength without indicating direction. It is derived from the Positive Directional Movement (+DI) and Negative Directional Movement (-DI):
+DI (Positive Directional Index): Measures upward price movement.
-DI (Negative Directional Index): Measures downward price movement.
ADX Value: Higher values indicate stronger trends, regardless of direction.
This strategy uses a default ADX length of 14 to smooth out short-term fluctuations while detecting sustainable trends.
2️⃣ SMA Filter (Optional Trend Confirmation)
The strategy includes a 200-period SMA filter to validate trend direction before entering trades. If enabled:
✅ Long Entry is only allowed when price is above a long-term SMA multiplier (5x the standard SMA length).
✅ If disabled, the strategy only considers the ADX crossover threshold for trade entries.
This filter helps reduce entries in sideways or weak-trend conditions, improving signal reliability.
📌 Trade Logic & Conditions
🔹 Long Entry Conditions
A buy signal is triggered when:
✅ ADX crosses above the threshold (default = 14), indicating a strengthening trend.
✅ (If SMA filter is enabled) Price is above the long-term SMA multiplier.
🔻 Exit Conditions
A position is closed when:
✅ ADX crosses below the stop threshold (default = 45), signaling trend weakening.
By adjusting the entry and exit ADX levels, traders can fine-tune sensitivity to trend changes.
📏 Trade Visualization & Tracking
Trade Markers
"Buy" label (▲) appears when a long position is opened.
"Close" label (▼) appears when a position is exited.
Trade History Boxes
Green if a trade is profitable.
Red if a trade closes at a loss.
Trend Tracking Lines
Horizontal lines mark entry and exit prices.
A filled trade box visually represents trade duration and profitability.
These elements provide clear visual insights into trade execution and performance.
⚡ How to Use This Strategy
1️⃣ Apply the script to a BTC chart in TradingView.
2️⃣ Adjust ADX entry/exit levels based on trend sensitivity.
3️⃣ Enable or disable the SMA filter for trend confirmation.
4️⃣ Backtest performance to analyze historical trade execution.
5️⃣ Monitor trade markers and history boxes for real-time trend insights.
This strategy is designed for trend traders looking to capture high-momentum market conditions while filtering out weak trends.
"tradingview+筹码结构" için komut dosyalarını ara

MACD Volume Strategy for XAUUSD (15m) [PineIndicators]The MACD Volume Strategy is a momentum-based trading system designed for XAUUSD on the 15-minute timeframe. It integrates two key market indicators: the Moving Average Convergence Divergence (MACD) and a volume-based oscillator to identify strong trend shifts and confirm trade opportunities. This strategy uses dynamic position sizing, incorporates leverage customization, and applies structured entry and exit conditions to improve risk management.
⚙️ Core Strategy Components
1️⃣ Volume-Based Momentum Calculation
The strategy includes a custom volume oscillator to filter trade signals based on market activity. The oscillator is derived from the difference between short-term and long-term volume trends using Exponential Moving Averages (EMAs)
Short EMA (default = 5) represents recent volume activity.
Long EMA (default = 8) captures broader volume trends.
Positive values indicate rising volume, supporting momentum-based trades.
Negative values suggest weak market activity, reducing signal reliability.
By requiring positive oscillator values, the strategy ensures momentum confirmation before entering trades.
2️⃣ MACD Trend Confirmation
The strategy uses the MACD indicator as a trend filter. The MACD is calculated as:
Fast EMA (16-period) detects short-term price trends.
Slow EMA (26-period) smooths out price fluctuations to define the overall trend.
Signal Line (9-period EMA) helps identify crossovers, signaling potential trend shifts.
Histogram (MACD – Signal) visualizes trend strength.
The system generates trade signals based on MACD crossovers around the zero line, confirming bullish or bearish trend shifts.
📌 Trade Logic & Conditions
🔹 Long Entry Conditions
A buy signal is triggered when all the following conditions are met:
✅ MACD crosses above 0, signaling bullish momentum.
✅ Volume oscillator is positive, confirming increased trading activity.
✅ Current volume is at least 50% of the previous candle’s volume, ensuring market participation.
🔻 Short Entry Conditions
A sell signal is generated when:
✅ MACD crosses below 0, indicating bearish momentum.
✅ Volume oscillator is positive, ensuring market activity is sufficient.
✅ Current volume is less than 50% of the previous candle’s volume, showing decreasing participation.
This multi-factor approach filters out weak or false signals, ensuring that trades align with both momentum and volume dynamics.
📏 Position Sizing & Leverage
Dynamic Position Calculation:
Qty = strategy.equity × leverage / close price
Leverage: Customizable (default = 1x), allowing traders to adjust risk exposure.
Adaptive Sizing: The strategy scales position sizes based on account equity and market price.
Slippage & Commission: Built-in slippage (2 points) and commission (0.01%) settings provide realistic backtesting results.
This ensures efficient capital allocation, preventing overexposure in volatile conditions.
🎯 Trade Management & Exits
Take Profit & Stop Loss Mechanism
Each position includes predefined profit and loss targets:
Take Profit: +10% of risk amount.
Stop Loss: Fixed at 10,100 points.
The risk-reward ratio remains balanced, aiming for controlled drawdowns while maximizing trade potential.
Visual Trade Tracking
To improve trade analysis, the strategy includes:
📌 Trade Markers:
"Buy" label when a long position opens.
"Close" label when a position exits.
📌 Trade History Boxes:
Green for profitable trades.
Red for losing trades.
📌 Horizontal Trade Lines:
Shows entry and exit prices.
Helps identify trend movements over multiple trades.
This structured visualization allows traders to analyze past performance directly on the chart.
⚡ How to Use This Strategy
1️⃣ Apply the script to a XAUUSD (Gold) 15m chart in TradingView.
2️⃣ Adjust leverage settings as needed.
3️⃣ Enable backtesting to assess past performance.
4️⃣ Monitor volume and MACD conditions to understand trade triggers.
5️⃣ Use the visual trade markers to review historical performance.
The MACD Volume Strategy is designed for short-term trading, aiming to capture momentum-driven opportunities while filtering out weak signals using volume confirmation.

Balance of Power for US30 4H [PineIndicators]The Balance of Power (BoP) Strategy is a momentum-based trading system for the US30 index on a 4-hour timeframe. It measures the strength of buyers versus sellers in each candle using the Balance of Power (BoP) indicator and executes trades based on predefined threshold crossovers. The strategy includes dynamic position sizing, adjustable leverage, and visual trade tracking.
⚙️ Core Strategy Mechanics
Positive values indicate buying strength.
Negative values indicate selling strength.
Values close to 1 suggest strong bullish momentum.
Values close to -1 indicate strong bearish pressure.
The strategy uses fixed threshold crossovers to determine trade entries and exits.
📌 Trade Logic
Entry Conditions
Long Entry: When BoP crosses above 0.8, signaling strong buying pressure.
Exit Conditions
Position Close: When BoP crosses below -0.8, indicating a shift to selling pressure.
This threshold-based system filters out low-confidence signals and focuses on high-momentum shifts.
📏 Position Sizing & Leverage
Leverage: Adjustable by the user (default = 5x).
Risk Management: Position size adapts dynamically based on equity fluctuations.
📊 Trade Visualization & History Tracking
Trade Markers:
"Buy" labels appear when a long position is opened.
"Close" labels appear when a position is exited.
Trade History Boxes:
Green for profitable trades.
Red for losing trades.
These elements provide clear visual tracking of past trade execution.
⚡ Usage & Customization
1️⃣ Apply the script to a US30 4H chart in TradingView.
2️⃣ Adjust leverage settings as needed.
3️⃣ Review trade signals and historical performance with visual markers.
4️⃣ Enable backtesting to evaluate past performance.
This strategy is designed for momentum-based trading and is best suited for volatile market conditions.

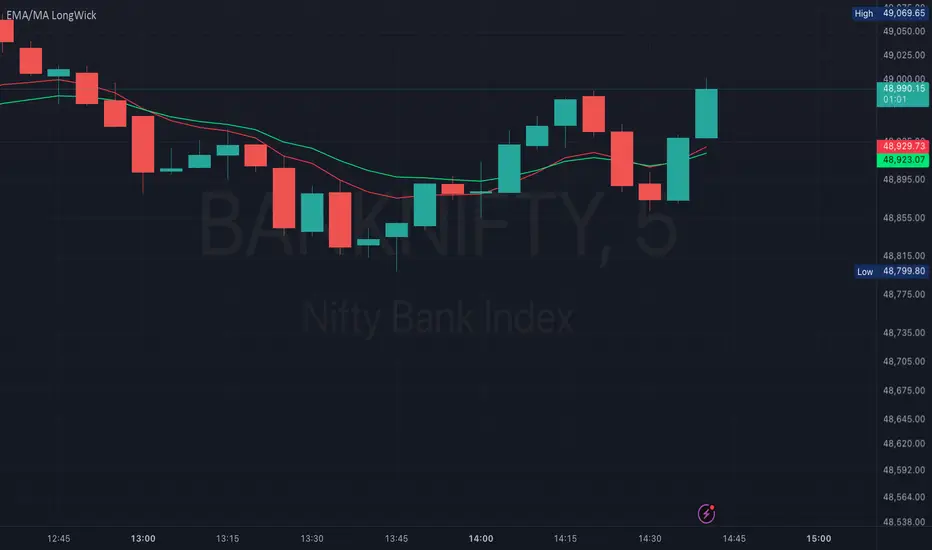
EMA/MA with OHCL Candle and Long Wick – A Comprehensive Trading
Dear Traders,
I am excited to introduce EMA/MA with OHCL Candle and Long Wick, a powerful trading indicator designed to enhance market analysis by combining Exponential Moving Averages (EMA), Simple Moving Averages (MA), OHCL candle patterns, and long wick detection into a single tool.
Key Features:
✅ Customizable Wick Size & Timeframe – Adapt the indicator to different market conditions by adjusting wick size and analyzing price action over any timeframe.
✅ EMA & MA for Trend Analysis – Includes multiple EMAs and MAs (5, 9, 15, 20, 50, 100, 200) to help identify trends and potential reversals.
✅ Long Wick Signal Detection – Identifies strong Buy and Sell opportunities based on wick size, signaling potential market turning points.
✅ OHCL Candle Analysis – Highlights OHCL patterns to provide additional insights into price action.
✅ User-Friendly & Lightweight – Efficiently coded for seamless performance on TradingView.
This indicator is perfect for traders looking to refine their entry and exit strategies by leveraging price action and moving averages. Whether you're a scalper, day trader, or swing trader, this tool provides valuable insights to enhance your decision-making.
Give it a try, and let me know your feedback! 🚀
Best regards,
Purnendu Singh
WalidTrader2025This is a Pine Script (version 5) code for a custom technical analysis indicator called "Market Structure Fibonacci Indicator" designed for use in TradingView. The indicator appears to combine market structure analysis with Fibonacci levels to help traders identify key price levels and market conditions.
Key features of the indicator include:
Fibonacci-based "breaker zones" that help identify potential support and resistance areas
A dynamic equilibrium price level that determines bullish/bearish market conditions
Buy-side and sell-side liquidity levels tracking
A status table displaying the current market trend (Bullish/Bearish) and market condition (Premium/Discount/Neutral)
Customizable visual elements including colors, line widths, and transparency levels
The indicator overlays on the price chart and uses the period's open, high, and low prices to calculate various Fibonacci projections at the 0.375 and 0.625 levels. It then creates zones ("breaker zones") that could indicate potential areas where price might react.

RG - Volume Spike DetectorRG - Volume Spike Detector is a comprehensive volume analysis tool designed to help traders identify significant volume activity across different tickers on TradingView. This indicator not only detects overall volume spikes and percentage changes but also approximates and analyzes buying and selling volume separately, providing valuable insights into market dynamics. With customizable parameters, visual cues, and built-in alerts, it's suitable for traders of all levels looking to monitor volume-based market movements.
Features
Volume Spike Detection:
Identifies when total volume exceeds a user-defined multiple of its moving average (default: 2x).
Separate detection for buying and selling volume spikes based on their respective moving averages.
Volume Change Analysis:
Calculates and displays the percentage change in total volume from the previous bar.
Highlights significant increases (>50%) or decreases (<-50%) with alert options.
Buy/Sell Volume Approximation:
Estimates buying and selling volume using price movement and range:
Up bars: Buying volume ≈ volume * (close - low)/(high - low)
Down bars: Selling volume ≈ volume * (close - low)/(high - low)
Handles edge cases (e.g., high = low) to ensure accurate calculations.
Ideal For
Day traders monitoring sudden volume surges
Swing traders analyzing volume trends
Market analysts studying buying vs. selling pressure
This indicator empowers traders with a robust tool to track volume dynamics, offering both visual clarity and actionable alerts for informed decision-making.

Float Turnover Signal
The *Float Turnover Signal* indicator helps traders analyze the relationship between price changes and trading volume relative to the stock's free float. It generates signals based on turnover ratios, providing insights into liquidity-driven price movements.
**How It Works**
- The indicator calculates the **percentage change** in closing price from two days ago to the previous day.
- It retrieves the **free float** (the number of publicly available shares) from TradingView.
- It then calculates the **turnover percentage**, which represents the previous day's trading volume as a percentage of the free float.
- The **turnover ratio** is derived by dividing the price change percentage by the turnover percentage.
- Based on this ratio, the indicator generates **color-coded signals**:
- 🟢 **Green Signal** – Indicates a balanced turnover ratio (0.8 to 1.2), suggesting a stable price-volume relationship.
- 🟡 **Yellow Signal** – Indicates a near-optimal but not perfect ratio (0.6-0.8 or 1.2-1.5), suggesting caution.
**Customization & Features**
✅ **Adjustable Signal Display** – Users can choose how many recent bars will display signals using the `"Number of Bars to Display Signal"` setting.
✅ **Works on Any Timeframe** – The indicator adapts to different chart resolutions.
✅ **Helps Identify Volume-Driven Moves** – Ideal for spotting potential breakouts, liquidity shifts, and confirming price action validity.

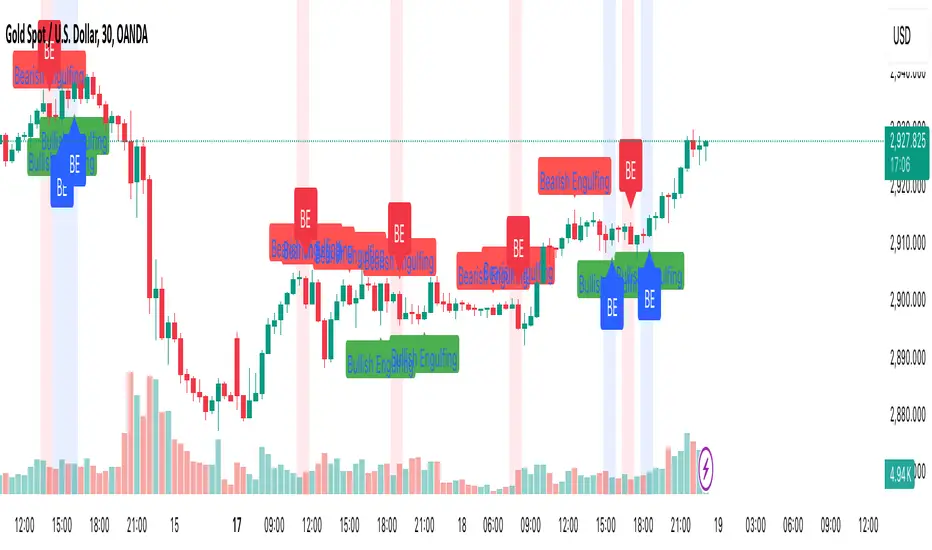
Engulfing Candle PatternIndicator Overview
This indicator identifies Bullish and Bearish Engulfing candlestick patterns on a price chart. These patterns are reversal signals:
Bullish Engulfing: Occurs during a downtrend, where a bullish candle fully engulfs the body of the previous bearish candle.
Bearish Engulfing: Occurs during an uptrend, where a bearish candle fully engulfs the body of the previous bullish candle.
Key Features
1. Pattern Detection:
Detects Bullish Engulfing and Bearish Engulfing patterns based on candle body comparisons.
Uses the current and previous candle's open/close prices to determine engulfing conditions.
2. Visualization:
Plots labels on the chart:
" Bullish Engulfing " below the candle for bullish patterns.
" Bearish Engulfing " above the candle for bearish patterns.
3. Alerts:
Triggers alerts when either pattern is detected, allowing traders to take action.
How It Works
Bullish Engulfing Condition:
Current candle is bullish (close > open).
Previous candle is bearish (close < open).
Current candle's body fully engulfs the previous candle's body.
Bearish Engulfing Condition:
- Current candle is bearish (close < open).
- Previous candle is bullish (close > open).
- Current candle's body fully engulfs the previous candle's body.
Usage
- Apply the script to any chart in TradingView.
- Look for " Bullish Engulfing " or " Bearish Engulfing " labels on the chart.
- Set up alerts to get notified when these patterns form.
This indicator is a simple yet effective tool for identifying potential trend reversals using engulfing candlestick patterns.
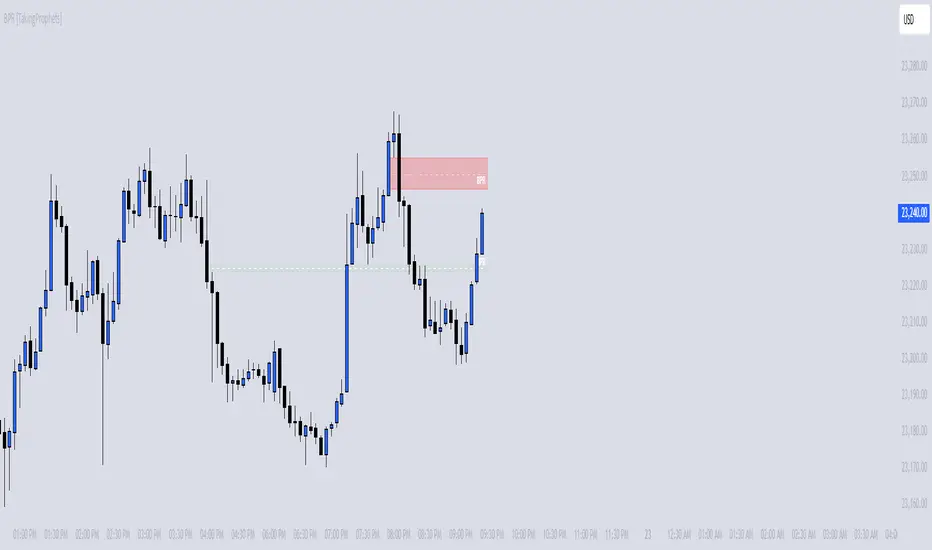
BPR [TakingProphets]The BPR (Balanced Price Range) Indicator by Taking Prophets is built for traders who follow ICT (Inner Circle Trader) concepts and smart money strategies. In ICT methodology, a Balanced Price Range (BPR) occurs when price rapidly moves in one direction, creating an imbalance that often gets revisited before price continues its trend. These areas represent inefficiencies in the market where liquidity was not properly distributed, making them key zones for potential retracements and trade setups.
How the Indicator Works:
🔹 Automatically Detects BPRs – No need to manually mark imbalances; the indicator highlights them for you.
🔹 Helps Identify Smart Money Footprints – Spot areas where price is likely to retrace and rebalance liquidity.
🔹 Customizable Sensitivity – Adjust detection parameters based on your preferred trading style.
🔹 Works Across All Markets – Apply it to Forex, Futures, Crypto, and Stocks on TradingView.
🔹 Clean and Intuitive Interface – Designed to be simple yet powerful for both new and experienced traders.
Multi-Indicator Signals with Selectable Options by DiGetMulti-Indicator Signals with Selectable Options
Script Overview
This Pine Script is a multi-indicator trading strategy designed to generate buy/sell signals based on combinations of popular technical indicators: RSI (Relative Strength Index) , CCI (Commodity Channel Index) , and Stochastic Oscillator . The script allows you to select which combination of signals to display, making it highly customizable and adaptable to different trading styles.
The primary goal of this script is to provide clear and actionable entry/exit points by visualizing buy/sell signals with arrows , labels , and vertical lines directly on the chart. It also includes input validation, dynamic signal plotting, and clutter-free line management to ensure a clean and professional user experience.
Key Features
1. Customizable Signal Types
You can choose from five signal types:
RSI & CCI : Combines RSI and CCI signals for confirmation.
RSI & Stochastic : Combines RSI and Stochastic signals.
CCI & Stochastic : Combines CCI and Stochastic signals.
RSI & CCI & Stochastic : Requires all three indicators to align for a signal.
All Signals : Displays individual signals from each indicator separately.
This flexibility allows you to test and use the combination that works best for your trading strategy.
2. Clear Buy/Sell Indicators
Arrows : Buy signals are marked with upward arrows (green/lime/yellow) below the candles, while sell signals are marked with downward arrows (red/fuchsia/gray) above the candles.
Labels : Each signal is accompanied by a label ("BUY" or "SELL") near the arrow for clarity.
Vertical Lines : A vertical line is drawn at the exact bar where the signal occurs, extending from the low to the high of the candle. This ensures you can pinpoint the exact entry point without ambiguity.
3. Dynamic Overbought/Oversold Levels
You can customize the overbought and oversold levels for each indicator:
RSI: Default values are 70 (overbought) and 30 (oversold).
CCI: Default values are +100 (overbought) and -100 (oversold).
Stochastic: Default values are 80 (overbought) and 20 (oversold).
These levels can be adjusted to suit your trading preferences or market conditions.
4. Input Validation
The script includes built-in validation to ensure that oversold levels are always lower than overbought levels for each indicator. If the inputs are invalid, an error message will appear, preventing incorrect configurations.
5. Clean Chart Design
To avoid clutter, the script dynamically manages vertical lines:
Only the most recent 50 buy/sell lines are displayed. Older lines are automatically deleted to keep the chart clean.
Labels and arrows are placed strategically to avoid overlapping with candles.
6. ATR-Based Offset
The vertical lines and labels are offset using the Average True Range (ATR) to ensure they don’t overlap with the price action. This makes the signals easier to see, especially during volatile market conditions.
7. Scalable and Professional
The script uses arrays to manage multiple vertical lines, ensuring scalability and performance even when many signals are generated.
It adheres to Pine Script v6 standards, ensuring compatibility and reliability.
How It Works
Indicator Calculations :
The script calculates the values of RSI, CCI, and Stochastic Oscillator based on user-defined lengths and smoothing parameters.
It then checks for crossover/crossunder conditions relative to the overbought/oversold levels to generate individual signals.
Combined Signals :
Depending on the selected signal type, the script combines the individual signals logically:
For example, a "RSI & CCI" buy signal requires both RSI and CCI to cross into their respective oversold zones simultaneously.
Signal Plotting :
When a signal is generated, the script:
Plots an arrow (upward for buy, downward for sell) at the corresponding bar.
Adds a label ("BUY" or "SELL") near the arrow for clarity.
Draws a vertical line extending from the low to the high of the candle to mark the exact entry point.
Line Management :
To prevent clutter, the script stores up to 50 vertical lines in arrays (buy_lines and sell_lines). Older lines are automatically deleted when the limit is exceeded.
Why Use This Script?
Versatility : Whether you're a scalper, swing trader, or long-term investor, this script can be tailored to your needs by selecting the appropriate signal type and adjusting the indicator parameters.
Clarity : The combination of arrows, labels, and vertical lines ensures that signals are easy to spot and interpret, even in fast-moving markets.
Customization : With adjustable overbought/oversold levels and multiple signal options, you can fine-tune the script to match your trading strategy.
Professional Design : The script avoids clutter by limiting the number of lines displayed and using ATR-based offsets for better visibility.
How to Use This Script
Add the Script to Your Chart :
Copy and paste the script into the Pine Editor in TradingView.
Save and add it to your chart.
Select Signal Type :
Use the "Signal Type" dropdown menu to choose the combination of indicators you want to use.
Adjust Parameters :
Customize the lengths of RSI, CCI, and Stochastic, as well as their overbought/oversold levels, to match your trading preferences.
Interpret Signals :
Look for green arrows and "BUY" labels for buy signals, and red arrows and "SELL" labels for sell signals.
Vertical lines will help you identify the exact bar where the signal occurred.
Tips for Traders
Backtest Thoroughly : Before using this script in live trading, backtest it on historical data to ensure it aligns with your strategy.
Combine with Other Tools : While this script provides reliable signals, consider combining it with other tools like support/resistance levels or volume analysis for additional confirmation.
Avoid Overloading the Chart : If you notice too many signals, try tightening the overbought/oversold levels or switching to a combined signal type (e.g., "RSI & CCI & Stochastic") for fewer but higher-confidence signals.

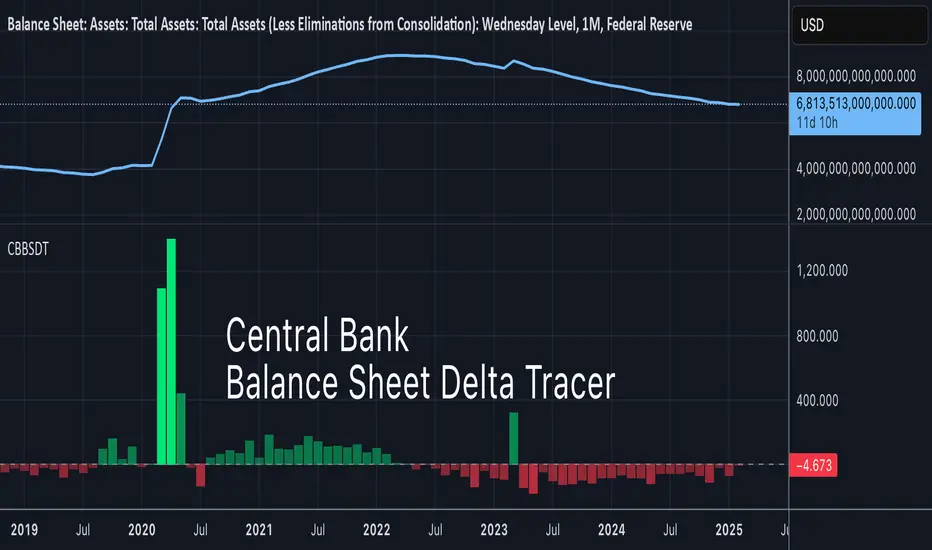
Central Bank BS Delta TracerCentral Bank BS Delta Tracer is a new way of looking at liquidity on TradingView.
CBBSDT (for short) shows bars for popular central bank balance sheets. The default is the US, but other countries can be viewed or compared as well.
You can combine multiple central bank balances, and all are calculated in USD using currency pairs so that the units match up. Combining can also show differentials, such as if the ECB did more QT than the US in a given time frame.
Warning: Time frames lower than a month may be inaccurate. Many central banks do not report their BS on a frequent basis, so do know ahead of time that data is usually outdated by a variable amount depending on the data source. Check with the particular sources of central bank BS before making assumptions about deltas using this indicator.
Debt is the dark energy of the economy. Therefore we must know how much of it is pumping or draining.
Pure Price Action Breakout with 1:5 RR
Description of the Price Action Trading Script (Pine Script v6)
Overview
This script is a pure price action-based breakout strategy designed for TradingView. It identifies key breakout levels and executes long and short trades based on market structure. The strategy ensures a minimum risk-to-reward ratio (RR) of 1:5, aiming for high profitability with well-defined stop-loss and take-profit levels.
How the Script Works
1️⃣ Breakout Identification
The script uses a lookback period to find the highest high and lowest low over the last n bars.
A bullish breakout occurs when the price closes above the previous highest high.
A bearish breakout happens when the price closes below the previous lowest low.
2️⃣ Entry & Exit Strategy
Long Entry: If a bullish breakout is detected, the script enters a long position.
Short Entry: If a bearish breakout is detected, the script enters a short position.
The stop-loss is placed at the recent swing low (for long trades) or recent swing high (for short trades).
The target price is calculated based on a risk-to-reward ratio of 1:5, ensuring profitable trades.
3️⃣ Risk Management
The stop-loss prevents excessive losses by exiting trades when the market moves unfavorably.
The strategy ensures that each trade has a reward potential at least 5 times the risk.
Positions are executed based on price action only, without indicators like moving averages or RSI.
4️⃣ Visual Representation
The script plots breakout levels to help traders visualize potential trade setups.
Entry points, stop-loss, and take-profit levels are labeled on the chart for easy tracking.
Key Features & Benefits
✔ Pure Price Action – No lagging indicators, only real-time price movements.
✔ High Risk-to-Reward Ratio (1:5) – Ensures high-profit potential trades.
✔ Real-time Entry & Exit Signals – Provides accurate trade setups.
✔ Dynamic Stop-loss Calculation – Adjusts based on recent market structure.
✔ Customizable Parameters – Lookback periods and risk ratios can be modified.

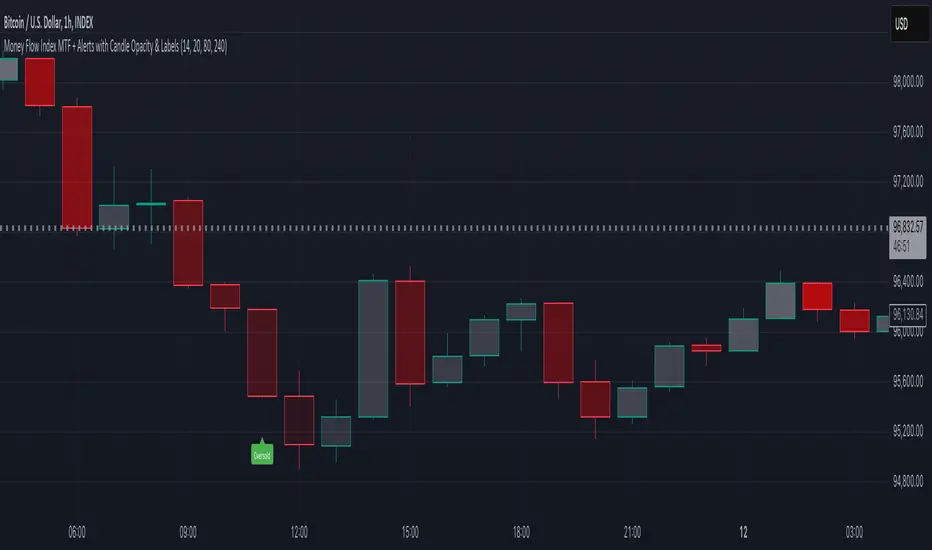
Money Flow Index MTF + Alerts with Candle Opacity & LabelsHow to Use the Money Flow Index MTF + Alerts with Candle Opacity & Labels Indicator
Overview:
This indicator is designed to help you gauge the buying and selling pressure in a market by using the Money Flow Index (MFI). Unlike many momentum oscillators, the MFI incorporates both price and volume, providing a unique perspective on market activity. It is particularly useful when you want to visually assess potential overbought or oversold conditions.
Indicator Components:
Money Flow Index (MFI) Calculation:
The indicator computes the MFI using a user-defined look-back period (default is 14 bars). The MFI is scaled between 0 and 100, where values above 80 typically indicate overbought conditions and values below 20 suggest oversold conditions.
Multi-Timeframe (MTF) Capability:
You can choose to calculate the MFI using either the current chart’s timeframe or a custom timeframe (for example, a 4-hour chart). This flexibility allows you to compare longer-term money flow trends against your primary trading timeframe.
Candle Opacity Based on MFI:
The opacity of the candles on your chart is dynamically adjusted based on the current MFI reading. When the MFI is high (near 100), candles become more opaque; when the MFI is low (near 0), candles appear more transparent. This visual cue can help you quickly spot changes in market momentum.
Visual Labels for Overbought/Oversold Conditions:
When the MFI crosses into the overbought territory, a red label reading “Overbought” is displayed above the high of the bar. Similarly, when it crosses into the oversold territory, a green label reading “Oversold” is placed below the low of the bar. These labels provide an immediate visual alert to potential reversal points or areas of caution.
Alert Conditions:
The script also includes alert conditions for both overbought and oversold signals. You can set up TradingView alerts so that you are notified in real time when the indicator detects these conditions.
Theory Behind the Money Flow Index (MFI):
The Money Flow Index is a momentum oscillator that uses both price and volume to signal the strength behind price moves.
Overbought Conditions: When the MFI is above 80, it suggests that buying pressure is very strong and the asset might be due for a pullback or consolidation.
Oversold Conditions: Conversely, when the MFI falls below 20, selling pressure is high and the asset might be oversold, potentially priming it for a bounce.
Keep in mind that in strong trending markets, overbought or oversold readings can persist for extended periods, so the MFI should be used in conjunction with other technical analysis tools.
Position Management Guidance:
While the indicator is useful for spotting potential overbought and oversold conditions, it is not designed to serve as an automatic signal to completely close a position. Instead, you might consider using it as a guide for pyramiding—gradually adding to your position over several days rather than exiting all at once. This approach allows you to better manage risk by:
Scaling In or Out Gradually: Instead of making one large position change, you can add or reduce your position in increments as market conditions evolve.
Diversifying Risk: Pyramiding helps you avoid the pitfalls of trying to time the market perfectly on a single trade exit or entry.
How to Get Started:
Apply the Indicator:
Add the indicator to your TradingView chart. Adjust the input settings (length, oversold/overbought levels, and resolution) as needed for your trading style and the market you’re analyzing.
Watch the Candles:
Observe the dynamic opacity of your candles. A sudden change in opacity can be a sign that the underlying money flow is shifting.
Monitor the Labels:
Pay attention to the “Overbought” or “Oversold” labels that appear. Use these cues in combination with your broader analysis to decide if it might be a good time to add to or gradually exit your position.
Set Up Alerts:
Configure TradingView alerts based on the indicator’s alert conditions so that you are notified when the MFI reaches extreme levels.
Use as Part of a Broader Strategy:
Remember, no single indicator should dictate your entire trading decision. Combine MFI signals with other technical analysis, risk management rules, and market insights to guide your trades.
Bollinger Bands with Narrow ConsolidationThe indicator is based on the standard Bollinger Bands indicator in TradingView. Its main difference is the ability to display narrow consolidation zones (with an adjustable percentage) and generate signals in these zones.
Narrow consolidation zones can be considered as a signal before the start of a strong trend, whether upward or downward.
Индикатор построен на стандартном индикаторе полос боллинджера в трейдинг вью. Его отличие заключается в том, что здесь есть возможность отображения зон узкой консолидации (процент настраивается) и генерации сигналов на этих зонах.
Зоны узкой консолидации можно рассматривать как сигнал перед началом сильного треда как восходящего, так и нисходящего.

OAT Multiple Alert ConditionsOverview:
The OAT Multiple Alert Conditions indicator is designed to enhance TradingView’s alert functionality by allowing users to set multiple conditions for webhook-based alerts. This script enables traders to define up to four independent conditions using different event types (e.g., crossing, greater than, rising, etc.), making it ideal for automated trading strategies and webhook integrations.
Features:
✅ Supports up to 4 independent conditions.
✅ Multiple event types: Crossing, Crossing Up, Crossing Down, Greater Than, Less Than, Rising, Falling.
✅ Choose between value-based or source-based conditions.
✅ Custom timeframes for each condition.
✅ Optional session filtering and expiration settings.
✅ Visual markers for triggered conditions.
✅ Alerts for individual conditions or all conditions being met.
How It Works:
Configure each condition by selecting the event type and input values.
Define whether the alert should trigger on bar close or real-time.
Enable session filtering to limit alerts to specific trading hours.
Set an expiration date for alerts if needed.
Alerts can be sent via TradingView’s webhook feature for automated execution.
Intended Use:
This script is a utility tool for traders using automated strategies with the Options Auto Trader. It does not generate trading signals or provide financial advice. It is designed to enhance alert flexibility and efficiency for trading through webhooks.
License & Compliance:
This script is published under the Mozilla Public License 2.0 and follows TradingView’s guidelines. It does not execute trades but simply provides an enhanced alerting mechanism.

Ultimate Volatility Scanner by NHBprod - Requested by Client!Hey Everyone!
I created another script to add to my growing library of strategies and indicators that I use for automated crypto and stock trading! This strategy is for BITCOIN but can be used on any stock or crypto. This was requested by a client so I thought I should create it and hopefully build off of it and build variants!
This script gets and compares the 14-day volatility using the ATR percentage for a list of cryptocurrencies and stocks. Cryptocurrencies are preloaded into the script, and the script will show you the TOP 5 coins in terms of volatility, and then compares it to the Bitcoin volatility as a reference. It updates these values once per day using daily timeframe data from TradingView. The coins are then sorted in descending order by their volatility.
If you don't want to use the preloaded set of coins, you have the option of inputting your own coins AND/OR stocks!
Let me know your thoughts.

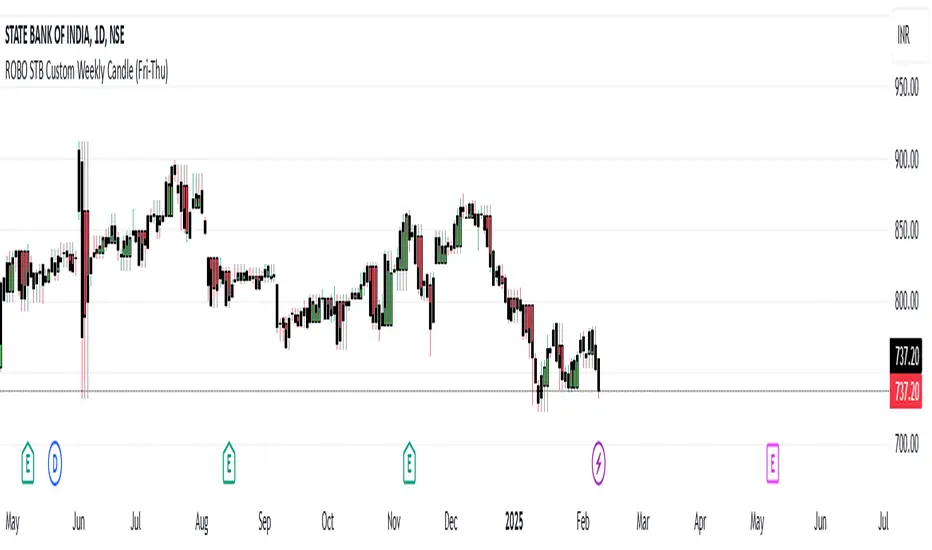
ROBO STB Custom Weekly Candle (Fri-Thu)Description:
This indicator creates custom weekly candles that start on Friday and end on Thursday, instead of the standard Monday–Friday weekly structure in TradingView. It aggregates the open, high, low, and close (OHLC) values from Friday to Thursday and displays them as candlesticks on the chart.
Features:
✅ Custom weekly candles from Friday to Thursday
✅ Dynamic calculation of open, high, low, and close
✅ Works on any timeframe
✅ Helps traders analyze market structure differently
How It Works:
Identifies the custom weekly session based on Friday's start and Thursday's end.
Aggregates OHLC values within this time range.
Resets the values when a new custom week begins.
Plots the calculated weekly candles on the chart.
Use Case:
This indicator is useful for traders who prefer to analyze weekly price movements based on a non-standard start and end day, especially those focusing on forex, crypto, or commodities where trading hours differ.
Notes:
This script does not modify existing candles but overlays new custom weekly candles on the chart.
It does not repaint and updates in real-time.
If you find this useful, like and share! 🚀
Walk Forward PatternsINTRO
In Euclidean geometry, every mathematical output has a planar projection. 'Walk Forward Patterns' can be considered a practical example of this concept. On the other hand, this indicator might also be viewed as an experiment in 'how playing with Lego as a child contributes to time series analysis' :)
OVERVIEW
This script dynamically generates the necessary optimization and testing ranges for Walk Forward Analysis based on user-defined bar count and length inputs. It performs automatic calculations for each step, offers 8 different window options depending on the inputs, and visualizes the results dynamically. I should also note that most of the window models consist of original patterns I have created.
ADDITIONAL INFO : WHAT IS WALK FORWARD ANALYSIS?
Although it is not the main focus of this indicator, providing a brief definition of Walk Forward Analysis can be helpful in correctly interpreting the results it generates. Walk Forward Analysis (WFA) is a systematic method for optimizing parameters and validating trading strategies. It involves dividing historical data into variable segments, where a strategy is first optimized on an in-sample period and then tested on an out-of-sample period. This process repeats by shifting the windows forward, ensuring that each test evaluates the strategy on unseen data, helping to assess its robustness and adaptability in real market conditions.
ORIGINALITY
There are very few studies on Walk Forward Analysis in TradingView. Even worse, there are no any open-source studies available. Someone has to start somewhere, I suppose. And in my personal opinion, determining the optimization and backtest intervals is the most challenging part of WFA. These intervals serve as a prerequisite for automated parameter optimization. I felt the need to publish this pattern module, which I use in my own WFA models, partly due to this gap on community scripts.
INDICATOR MECHANICS
To use the indicator effectively, you only need to perform four simple tasks:
Specify the total number of bars in your chart in the 'Bar Index' parameter.
Define the optimization (In-Sample Test) length.
Define the testing (Out-Of-Sample Test) length.
Finally, select the window type.
The indicator automatically models everything else (including the number of steps) based on your inputs. And the result; you now have a clear idea of which bars to use for your Walk Forward tests!
A COMMONLY USED WINDOW SELECTION METHOD: ROLLING
A more concrete definition of Walk Forward Analysis, specifically for the widely used Rolling method, can be described as follows:
Parameters that have performed well over a certain period are identified (Optimization: In-Sample).
These parameters are then tested on a shorter, subsequent period (Backtest: Out-of-Sample).
The process is repeated forward in time (At each step, the optimization and backtest periods are shifted by the backtest length).
If the cumulative percentage profit obtained from the backtest results is greater than half of the historical optimization profit, the strategy is considered "successful."
If the strategy is successful, the most recent (untested) optimization values are used for live trading.
OTHER WINDOW OPTIONS
ANCHORED: That's a pattern based on progressively expanding optimization ranges at each step. Backtest ranges move forward in a staircase-like manner.
STATIC: Optimization ranges remain fixed, while backtest ranges are shifted forward.
BLOCKED: Optimization ranges are shifted forward in groups of three blocks. Backtest ranges are also shifted in a staircase manner, even at the cost of creating gaps from the optimization end bars.
TRIANGULAR: Optimization ranges are shifted forward in triangular regions, while backtest ranges move in a staircase pattern.
RATIO: The optimization length increases by 25% of the initial step’s fixed length at each step. In other words, the length grows by 25% of the first step's length incrementally. Backtest ranges always start from the bar where the optimization ends.
FIBONACCI: A variation of the Ratio method, where the optimization shift factor is set to 0.618
RANDOM WALK
Unlike the window models explained above, we can also generate optimization and backtest ranges completely randomly—offering almost unlimited variations! When you select the "Random" option in the "Window" parameter on the indicator interface, random intervals are generated based on various trigonometric calculations. By changing the numerical value in the '🐒' parameter, you can create entirely unique patterns.
WHY THE 🐒 EMOJI?
Two reasons.
First, I think that as humanity, we are a species of tailless primates who become happy when we understand things :). At least evolutionarily. The entire history of civilization is built on the effort to express the universe in a scale we can comprehend. 'Knowledge' is an invention born from this effort, which is why we feel happiness when we 'understand'. Second, I can't think of a better metaphor for randomness than a monkey sitting at a keyboard. See: Monkey Test.
Anyway, I’m rambling :)
NOTES
The indicator generates results for up to 100 steps. As the number of steps increases, the table may extend beyond the screen—don’t forget to zoom out!
FINAL WORDS
I haven’t published a Walk Forward script yet . However, there seem to be examples that can perform parameter optimization in the true sense of the word, producing more realistic results without falling into overfitting in my library. Hopefully, I’ll have the chance to publish one in the coming weeks. Sincerely thanks to Kıvanç Özbilgiç, Robert Pardo, Kevin Davey, Ernest P. Chan for their inspiring publishments.
DISCLAIMER
That's just a script, nothing more. I hope it helps everyone. Do not forget to manage your risk. And trade as safely as possible. Best of luck!
© dg_factor

Scalping Tool with Dynamic Take Profit & Stop Loss### **Scalping Indicator: Summary and User Guide**
The **Scalping Indicator** is a powerful tool designed for traders who focus on short-term price movements. It combines **Exponential Moving Averages (EMA)** for trend identification and **Average True Range (ATR)** for dynamic stop loss and take profit levels. The indicator is highly customizable, allowing traders to adapt it to their specific trading style and risk tolerance.
---
### **Key Features**
1. **Trend Identification**:
- Uses two EMAs (Fast and Slow) to identify trend direction.
- Generates **Buy Signals** when the Fast EMA crosses above the Slow EMA.
- Generates **Sell Signals** when the Fast EMA crosses below the Slow EMA.
2. **Dynamic Take Profit (TP) and Stop Loss (SL)**:
- **Take Profit (TP)**:
- TP levels are calculated as a percentage above (for long trades) or below (for short trades) the entry price.
- TP levels are **dynamically recalculated** when the price reaches the initial target, allowing for multiple TP levels during a single trade.
- **Stop Loss (SL)**:
- SL levels are calculated using the ATR multiplier, providing a volatility-based buffer to protect against adverse price movements.
3. **Separate Settings for Long and Short Trades**:
- Users can independently enable/disable and configure TP and SL for **Buy** and **Sell** orders.
- This flexibility ensures that the indicator can be tailored to different market conditions and trading strategies.
4. **Visual Signals and Levels**:
- **Buy/Sell Signals**: Clearly marked on the chart with labels ("BUY" or "SELL").
- **TP and SL Levels**: Plotted on the chart for both long and short trades, making it easy to visualize risk and reward.
---
### **How to Use the Scalping Indicator**
#### **1. Setting Up the Indicator**
- Apply the indicator to your chart in TradingView.
- Configure the input parameters based on your trading preferences:
- **Fast Length**: The period for the Fast EMA (default: 5).
- **Slow Length**: The period for the Slow EMA (default: 13).
- **ATR Length**: The period for the ATR calculation (default: 14).
- **Buy/Sell TP and SL**: Enable/disable and set the percentage or ATR multiplier for TP and SL levels.
#### **2. Interpreting the Signals**
- **Buy Signal**:
- When the Fast EMA crosses above the Slow EMA, a "BUY" label appears below the price bar.
- The TP and SL levels for the long trade are plotted on the chart.
- **Sell Signal**:
- When the Fast EMA crosses below the Slow EMA, a "SELL" label appears above the price bar.
- The TP and SL levels for the short trade are plotted on the chart.
#### **3. Managing Trades**
- **Take Profit (TP)**:
- When the price reaches the initial TP level, the indicator automatically recalculates the next TP level based on the new close price.
- This allows traders to capture additional profits as the trend continues.
- **Stop Loss (SL)**:
- The SL level is based on the ATR multiplier, providing a dynamic buffer against market volatility.
- If the price hits the SL level, the trade is considered closed, and the indicator resets.
#### **4. Customization**
- Adjust the **Fast Length** and **Slow Length** to suit your trading timeframe (e.g., shorter lengths for scalping, longer lengths for swing trading).
- Modify the **ATR Multiplier** and **TP Percentage** to align with your risk-reward ratio.
- Enable/disable TP and SL for long and short trades based on your trading strategy.
---
### **Tips for Getting the Best Results**
1. **Combine with Price Action**:
- Use the Scalping Indicator in conjunction with support/resistance levels, candlestick patterns, or other technical analysis tools to confirm signals.
2. **Optimize for Your Timeframe**:
- For **scalping**, use shorter EMA lengths (e.g., Fast: 5, Slow: 13).
- For **swing trading**, use longer EMA lengths (e.g., Fast: 10, Slow: 20).
3. **Adjust Risk Management**:
- Use a smaller **ATR Multiplier** for tighter stop losses in low-volatility markets.
- Increase the **TP Percentage** to allow for larger price movements in high-volatility markets.
4. **Backtest and Practice**:
- Test the indicator on historical data to understand its performance in different market conditions.
- Use a demo account to practice trading with the indicator before applying it to live trading.
---
### **Conclusion**
The **Scalping Indicator** is a versatile and user-friendly tool for traders who want to capitalize on short-term price movements. By combining trend-following EMAs with dynamic TP and SL levels, it provides a clear and systematic approach to trading. Whether you're a scalper or a swing trader, this indicator can help you identify high-probability setups and manage risk effectively. Customize it to fit your strategy, and always remember to combine it with sound risk management principles for the best results.

Combined SmartComment & Dynamic S/R LevelsDescription:
The Combined SmartComment & Dynamic S/R Levels script is designed to provide valuable insights for traders using TradingView. It integrates dynamic support and resistance levels with a powerful Intelligent Comment system to enhance decision-making. The Intelligent Comment feature generates market commentary based on key technical indicators, delivering real-time actionable feedback that helps optimize trading strategies.
Intelligent Comment Feature:
The Intelligent Comment function continuously analyzes market conditions and offers relevant insights based on combinations of various technical indicators such as RSI, ATR, MACD, WMA, and others. These comments help traders identify potential price movements, highlighting opportunities to buy, sell, or wait.
Examples of the insights provided by the system include:
RSI in overbought/oversold and price near resistance/support: Indicates potential price reversal points.
Price above VAH and volume increasing: Suggests a strengthening uptrend.
Price near dynamic support/resistance: Alerts when price approaches critical support or resistance zones.
MACD crossovers and RSI movements: Provide signals for potential trend shifts or continuations.
Indicators Used:
RSI (Relative Strength Index)
ATR (Average True Range)
MACD (Moving Average Convergence Divergence)
WMA (Weighted Moving Average)
POC (Point of Control)
Bollinger Bands
SuperSignal
Volume
EMA (Exponential Moving Average)
Dynamic Support/Resistance Levels
How It Works:
The script performs real-time market analysis, assessing multiple technical indicators to generate Intelligent Comments. These comments provide traders with timely guidance on potential market movements, assisting with decision-making in a dynamic market environment. The script also integrates dynamic support and resistance levels to further enhance trading accuracy.

Hammer Detector### Hammer Pattern Detector
The Hammer Pattern Detector is a specialized technical analysis tool designed to identify high-probability hammer candlestick patterns. This indicator uses precise mathematical calculations to detect hammer patterns that meet specific criteria, helping traders identify potential market reversals.
#### Key Features
- Precise detection of hammer patterns based on shadow-to-body ratios
- Customizable parameters for fine-tuning pattern recognition
- Visual alerts with markers above qualifying candles
- Built-in alert functionality for real-time notifications
#### Parameters
1. **Shadow Length Multiplier (min)**: Controls how many times longer the lower shadow must be compared to the candle body (default: 2.0)
2. **Maximum Upper Shadow (%)**: Sets the maximum allowed length for the upper shadow as a percentage of total candle length (default: 10%)
3. **Minimum Body to High Distance (%)**: Defines how close the body must be to the high of the candle (default: 90%)
#### Detection Criteria
The indicator identifies hammer patterns based on three main conditions:
- Lower shadow must be at least twice the length of the body (adjustable)
- Upper shadow must be minimal (max 10% of total candle length by default)
- Candle body must be positioned near the high of the candle
#### Use Cases
- Identifying potential trend reversals
- Finding entry points in oversold conditions
- Confirming support levels
- Part of a broader reversal strategy
#### Tips for Best Results
- Use in conjunction with support/resistance levels
- Combine with volume analysis for confirmation
- Consider overall market context and trend
- Adjust parameters based on your trading timeframe
#### Installation
1. Add the indicator to your chart
2. Adjust the parameters according to your trading style
3. Optional: Set up alerts for real-time notifications
#### About
Created by WK
Version: 1.0
All rights reserved ©WK
For questions or suggestions, please reach out through TradingView.

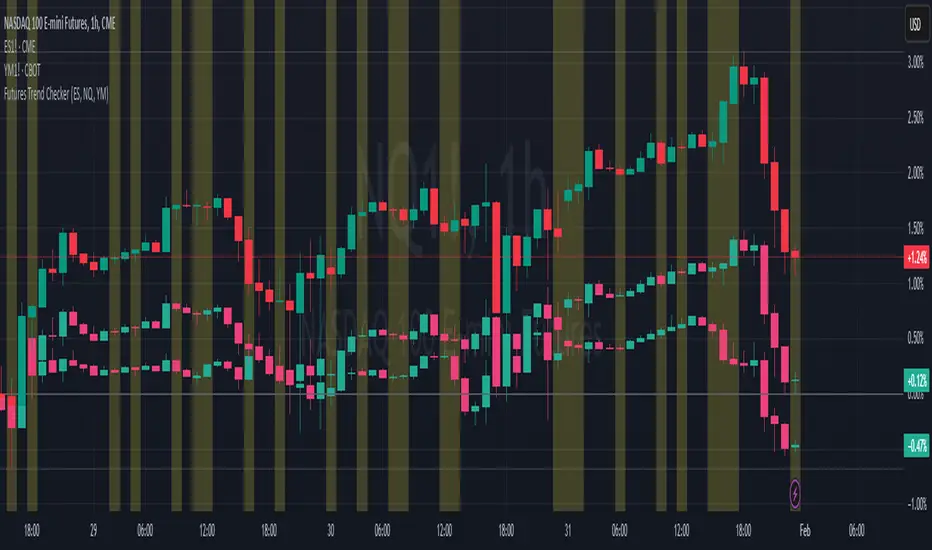
ELHAI Futures Trend Checker (ES, NQ, YM)The ELHAI Futures Trend Checker is a powerful TradingView indicator designed for futures traders who want to monitor the trend synchronization of the three major U.S. futures indices:
✅ E-mini S&P 500 (ES1!)
✅ E-mini Nasdaq 100 (NQ1!)
✅ E-mini Dow Jones (YM1!)
This indicator checks whether all three futures indices are bullish or bearish during each candle formation. If one of them is out of sync (e.g., two indices are bullish while one is bearish), the indicator triggers an alert and highlights the background in red, helping traders identify potential market indecision or divergence.
Key Features
📌 Designed for Futures Traders – Focuses on ES, NQ, and YM futures contracts.
📌 Live Market Monitoring – Works in real-time and updates dynamically with each tick.
📌 Bullish/Bearish Trend Confirmation – Detects when all three indices are in sync.
📌 Mismatch Detection – Alerts you when at least one index is out of trend.
📌 Custom Alerts – Set up TradingView alerts to be notified instantly when a trend mismatch occurs.
📌 Visual Background Highlight – A red background warns of a market divergence.
How It Works
The script retrieves open and close prices for ES, NQ, and YM.
Determines whether each futures index is bullish (close > open) or bearish (close < open).
If all three indices are bullish or all are bearish, it remains neutral.
If one index is different, an alert is triggered and the background turns red.
How to Use
Apply the indicator to your TradingView chart.
Choose any timeframe – Works well on intraday, daily, or higher timeframes.
Enable alerts: Go to Alerts → Create Alert, select "Futures Trend Mismatch", and set your preferred alert frequency.
Use alongside other indicators like moving averages, RSI, or MACD for better trade confirmation.
Best Use Cases
✔ Day traders & scalpers – Quickly spot market divergence in live trading.
✔ Swing traders – Identify when futures markets lose synchronization.
✔ Trend followers – Confirm if all major futures markets are aligned before making a move.
Final Notes
This indicator was built for Elhai to provide real-time trend analysis across major U.S. futures indices. Use it as a confirmation tool to improve market timing and decision-making.
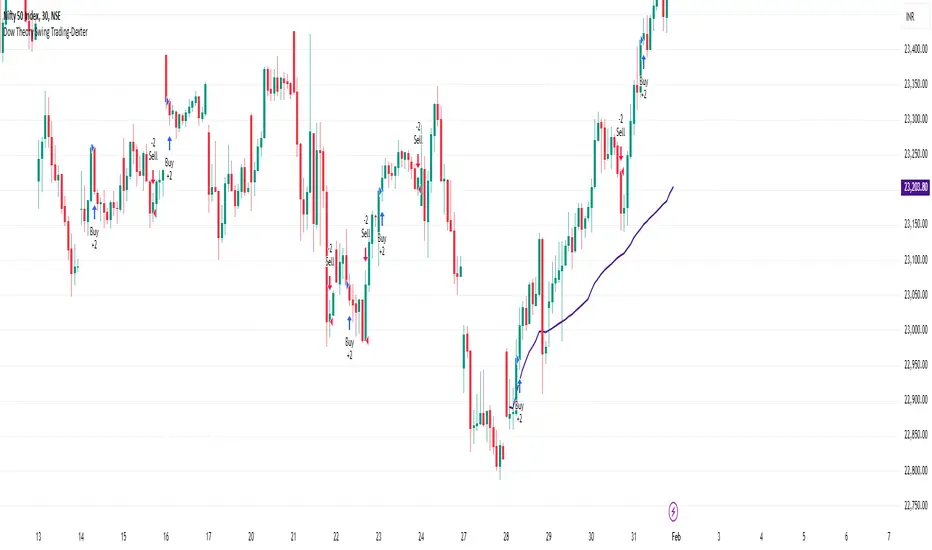
Dow Theory Swing Trading-DexterThis Pine Script strategy that implements a basic price action-based trading system inspired by Dow Theory, focusing on swing highs and swing lows. This strategy will generate buy and sell signals based on the formation of higher highs (HH) and higher lows (HL) for an uptrend, and lower highs (LH) and lower lows (LL) for a downtrend.
Swing Highs and Swing Lows:
The script identifies swing highs and swing lows using the ta.highest and ta.lowest functions over a specified lookback period.
A swing high is identified when the high of the current bar is the highest high over the lookback period.
A swing low is identified when the low of the current bar is the lowest low over the lookback period.
Trend Detection:
An uptrend is detected when the current low is higher than the last identified swing low.
A downtrend is detected when the current high is lower than the last identified swing high.
Buy and Sell Signals:
A buy signal is generated when the price closes above the last swing high during an uptrend.
A sell signal is generated when the price closes below the last swing low during a downtrend.
Plotting:
Swing highs and swing lows are plotted on the chart using plotshape.
Buy and sell signals are also plotted on the chart for visual reference.
How to Use:
Copy and paste the script into the Pine Script editor in TradingView.
Adjust the lookback period as needed to suit your trading style and timeframe.
Apply the script to your chart and it will generate buy and sell signals based on the price action.
NOTE: Please uncheck the all the unwanted symbol from chart for clear view .