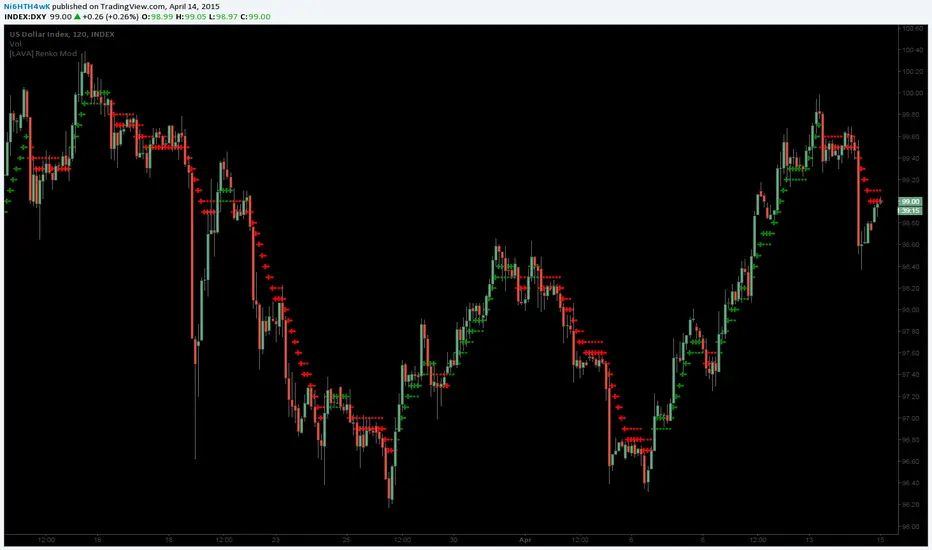
[LAVA] Renko ModTradingview.com Pinescript @author Ni6HTH4wK (LAVA) with assistance from @zmm20
Original code by Richard Santos, (RS)Renko Mod
(RS) www.tradingview.com
(LAVA) 19P7bkzqSAwSm6X7tXmRVkx6AuBXEUZioo
Traditional cross and circles view displayed here, but my favorite look is small linebreak and circles.
Different views available...
Type 2 -
Type 1 -
Without barcoloring -
**EDIT**
pastebin.com - Fixes missed bottoms / tops (April 15th, 2015)
pastebin.com - Fixes slow recognition of steep movements (April 25th, 2015)
"tradingview+金龙指数" için komut dosyalarını ara
Trend Bars with Counter Table# TradingView Trend Bar Indicator Explained
## Indicator Overview
This is a TradingView indicator designed to identify and count **Trend Bars**. It not only visually marks strong bullish and bearish bars on the chart but also displays a data table in the upper right corner that tracks the distribution of trend bars across different periods, helping traders quickly assess market bias.
## Core Concept: What is a Trend Bar?
The indicator defines two types of trend bars:
### Bull Trend Bar
- **Condition**: Close > Open (bullish candle)
- **Strength Requirement**: Body size ≥ 75% of total candle range
```
Body Length = |Close - Open|
Total Candle Range = High - Low
Criteria: Body Length ≥ 0.75 × Total Candle Range
```
This means both upper and lower wicks are very short, representing a very strong bullish candle.
### Bear Trend Bar
- **Condition**: Close < Open (bearish candle)
- **Strength Requirement**: Body size ≥ 75% of total candle range
Similarly, this represents a strong bearish candle with minimal wicks and a full body.
## Visual Markers
The indicator marks qualifying candles with:
- **Green upward arrow**: Bull trend bar, appears below the candle
- **Red downward arrow**: Bear trend bar, appears above the candle
## Statistical Function
The indicator uses a **rolling array** (storing up to 1000 trend bars) to track historical data, then counts trend bar distribution across 5 different periods:
| Period | Statistical Range |
|--------|------------------|
| Group 1 | Last 7 trend bars |
| Group 2 | Last 15 trend bars |
| Group 3 | Last 21 trend bars |
| Group 4 | Last 29 trend bars |
| Group 5 | Last 35 trend bars |
**Note**: This counts "the last N trend bars," not "the last N candles." Only candles meeting the trend bar criteria are included.
## Data Table Interpretation
The table in the upper right corner contains 5 columns:
1. **Last N**: The set statistical range (7, 15, 21, 29, 35)
2. **Total**: Actual number of trend bars counted (may be less than target initially)
3. **Bull**: Number of bull trend bars (displayed in green)
4. **Bear**: Number of bear trend bars (displayed in red)
5. **Bias**: Market bias
- "bull" (green): More bull trend bars
- "bear" (red): More bear trend bars
## Practical Applications
### 1. Assess Short-term Momentum
Check the distribution of the last 7 trend bars. If bull trend bars dominate (e.g., 5:2), it indicates strong short-term buying pressure.
### 2. Identify Trend Strength
If multiple periods show the same Bias direction, the trend is very clear. For example, all 5 periods showing "bull" is a strong upward signal.
### 3. Spot Trend Reversals
When short-term bias (7 bars) opposes long-term bias (35 bars), it may signal a trend change in progress.
### 4. Combine with Other Indicators
Use this indicator alongside moving averages, support/resistance levels, and other tools to improve trading decision accuracy.
## Technical Highlights
- **Dynamic Array Management**: Uses `array.unshift()` to add new data at the array's beginning, ensuring the latest trend bars are always first
- **Efficient Statistics**: Quickly calculates bull/bear distribution through loop iteration over specified array ranges
- **Adaptive Display**: Shows actual available count when historical data is insufficient
- **Real-time Updates**: Only updates the table on the last bar to avoid unnecessary calculations
## Conclusion
The core value of this indicator lies in **quantifying price action**. By identifying strong candles with full bodies and clear direction, then tracking their distribution, traders can quickly grasp the balance of market forces and make more informed trading decisions. Whether for intraday trading or swing trading, this tool provides valuable reference information.

Market Opening Time### TradingView Pine Script "Market Opening Time" Explanation
This Pine Script (`@version=5`) is an indicator that visually highlights market trading sessions (Sydney, London, New York, etc.) by changing the chart's background color. It adjusts for U.S. and Australian Daylight Saving Time (DST).
---
#### **1. Overview**
- **Purpose**: Changes the chart's background color based on UTC time zones to highlight market sessions.
- **Features**:
- Automatically adjusts for U.S. DST (2nd Sunday of March to 1st Sunday of November) and Australian DST (1st Sunday of October to 1st Sunday of April).
- Assigns colors to four time zones (00:00, 06:30, 14:00, 21:00).
- **Use Case**: Helps forex/stock traders identify active market sessions.
---
#### **2. Key Logic**
- **DST Detection**:
- `f_isUSDst`: Checks U.S. DST status.
- `f_isAustraliaDst`: Checks Australian DST status.
- **Time Adjustment** (`f_getAdjustedTime`):
- U.S. DST off: Shifts `time3` (14:00) forward by 1 hour.
- Australian DST off: Shifts `time4` (21:00) forward by 1 hour.
- **Time Conversion** (`f_timeToMinutes`): Converts time (e.g., "14:00") to minutes (e.g., 840).
- **Current Time** (`f_currentTimeInMinutes`): Gets UTC time in minutes.
- **Background Color** (`f_getBackgroundColor`):
- Applies colors based on time ranges:
- 00:00–06:30: Orange (Asia)
- 06:30–14:00: Purple (London)
- 14:00–21:00: Blue (New York, DST-adjusted)
- 21:00–00:00: Red (Sydney, DST-adjusted)
- Outside ranges: Gray
---
#### **3. Settings**
- **Time Zones**:
- `time1` = 00:00 (Orange)
- `time2` = 06:30 (Purple)
- `time3` = 14:00 (Blue, DST-adjusted)
- `time4` = 21:00 (Red, DST-adjusted)
- **Colors**: Transparency set to 90 for visibility.
---
#### **4. Example**
- **September 5, 2025, 10:25 PM JST (13:25 UTC)**:
- U.S. DST active, Australian DST inactive.
- 13:25 UTC falls between `time2` (06:30) and `time3` (14:00) → Background is **Purple** (London session).
- **Effect**: Background color changes dynamically to reflect active sessions.
---
#### **5. Customization**
- Modify `time1`–`time4` or colors for different sessions.
- Add time zones for other markets (e.g., Tokyo).
---
#### **6. Notes**
- Uses UTC; ensure chart is set to UTC.
- DST rules are U.S./Australia-specific; verify for other regions.
A simple, visual tool for tracking market sessions.
----
### TradingView Pine Script「Market Opening Time」解説
このPine Script(`@version=5`)は、市場の取引時間帯(シドニー、ロンドン、ニューヨークなど)を背景色で視覚化するインジケーターです。米国とオーストラリアの夏時間(DST)を考慮し、時間帯を調整します。
---
#### **1. 概要**
- **目的**: UTC基準の時間帯に基づき、チャートの背景色を変更して市場セッションを強調。
- **機能**:
- 米国DST(3月第2日曜~11月第1日曜)とオーストラリアDST(10月第1日曜~4月第1日曜)を自動調整。
- 4つの時間帯(00:00、06:30、14:00、21:00)に色を割り当て。
- **用途**: FXや株式トレーダーが市場のアクティブ時間を把握。
---
#### **2. 主要ロジック**
- **DST判定**:
- `f_isUSDst`: 米国DSTを判定。
- `f_isAustraliaDst`: オーストラリアDSTを判定。
- **時間調整** (`f_getAdjustedTime`):
- 米国DST非適用時: `time3`(14:00)を1時間遅延。
- オーストラリアDST非適用時: `time4`(21:00)を1時間遅延。
- **時間変換** (`f_timeToMinutes`): 時間(例: "14:00")を分単位(840)に変換。
- **現在時刻** (`f_currentTimeInMinutes`): UTCの現在時刻を分単位で取得。
- **背景色** (`f_getBackgroundColor`):
- 時間帯に応じた色を適用:
- 00:00~06:30: オレンジ(アジア)
- 06:30~14:00: 紫(ロンドン)
- 14:00~21:00: 青(ニューヨーク、DST調整)
- 21:00~00:00: 赤(シドニー、DST調整)
- 時間外: グレー
---
#### **3. 設定**
- **時間帯**:
- `time1` = 00:00(オレンジ)
- `time2` = 06:30(紫)
- `time3` = 14:00(青、DST調整)
- `time4` = 21:00(赤、DST調整)
- **色**: 透明度90で視認性確保。
---
#### **4. 使用例**
- **2025年9月5日22:25 JST(13:25 UTC)**:
- 米国DST適用、豪DST非適用。
- 13:25は`time2`(06:30)~`time3`(14:00)の間 → 背景色は**紫**(ロンドン)。
- **効果**: 時間帯に応じて背景色が変化し、市場セッションを直感的に把握。
---
#### **5. カスタマイズ**
- 時間帯(`time1`~`time4`)や色を変更可能。
- 他の市場(例: 東京)に対応する時間帯を追加可能。
---
#### **6. 注意点**
- UTC基準のため、チャート設定をUTCに。
- DSTルールは米国・オーストラリア準拠。他地域では要確認。
シンプルで視覚的な市場時間インジケーターです。

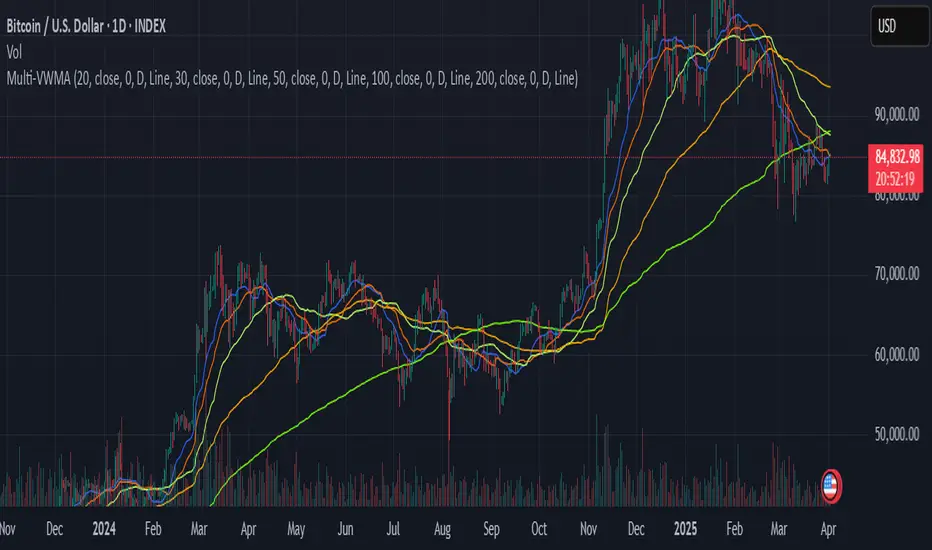
Multiple VWMATradingView Indicator: Multiple VWMA
This TradingView indicator allows you to display up to five separate Volume Weighted Moving Averages (VWMAs) directly on your price chart.
What it does:
Plots 5 VWMAs: It calculates and draws five distinct VWMA lines (or other styles) on the chart.
Volume Weighting: Unlike simple moving averages, a VWMA gives more weight to prices where trading volume was higher, potentially offering a clearer picture of the trend strength confirmed by volume.
Highly Customizable: Each of the five VWMAs can be configured independently through the indicator's settings panel. For each one, you can set:
Length: The lookback period (number of bars) used for the calculation.
Source: The price data to use (e.g., close, open, high, low, hl2, etc.).
Timeframe: You can calculate each VWMA based on a different timeframe than the one currently displayed on your chart (e.g., view daily VWMAs on an hourly chart). Leave blank to use the chart's timeframe.
Offset: Shift the VWMA line forwards or backwards on the chart by a specific number of bars.
Style: Choose how each VWMA is displayed (Line, Histogram, or Cross).
Overlay: The VWMAs are plotted directly over the price bars for easy comparison.
Purpose:
This indicator is useful for traders who want to analyze trends using multiple volume-weighted perspectives simultaneously. By comparing VWMAs of different lengths or based on different timeframes, you can gain insights into short-term vs. long-term trends, potential support/resistance levels, and the significance of price movements based on accompanying volume.
MM Labelled AVWAPTradingView provides a tool to show anchored VWAP plots on your screen, but there is no way to label the plots to add additional context to the level. Instead, users are forced to use the plot style (color, line style, line thickness, etc) to indicate what the plots are for and then they have to remember that meaning when looking at different charts. It also means that for key market-wide moments, users will need to add the plot for every symbol.
Now, for the first time on TradingView, you can create anchored VWAP plots with labels on them so you can understand the meaning behind the key moments you care about and don't need to remember what they mean by using styles like color or thickness. You can use this indicator to track key moments like the 2022 market bottom, or the Aug 9, 2024 "Carry Trade Unwind" bottom. The labelled AVWAP plots are visible on every chart by default. If you have an AVWAP moment that is only relevant to a small number of symbols, you can configure the indicator to only appear on those symbols.

Intrabar Polarity DivergencesTradingview Pinescript just introduced a new exciting ability to get intrabars candle information from a higher time frame chart!
This indicator is based on Tradingview example but with enhanced capabilities to show the percentage of intrabars opposite bars with the ability to display the mid-day candle close price drawn by a blue line.
This indicator can show you that in some cases a GREEN candle on the daily chart, for example, can have more red candles in a lower time frame. which may or may not indicate on a change of direction :)
This is an ongoing experiment and I plan to release more indicators based on these new pinescript capabilities.
Like if you like and Follow to stay updated!

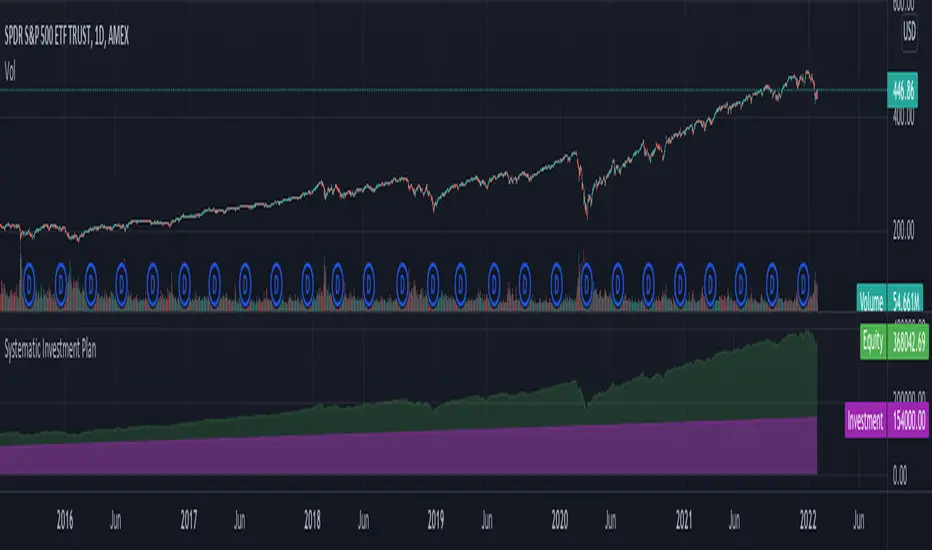
Systematic Investment PlanTradingview default strategy tester has few limitations. To name some:
Tradingview default strategy tester does not have option for periodic investment.
Does not allow reduce and refill kind of operations.
Comparison to buy and hold equity does not take into consideration on number of days invested
Hence, I created this as base for my further experiments with respect to strategies involving market timing.
Settings are quite simple and self explanatory.
Multi Oscillator Divergence IndicatorTradingview Built-in Divergence Indicator with RSI is extended for Price Divergence with
- RSI
- MACD
- Sochastic
- Money Flow
- Demand Index
- Chaikin Money Flow
Thanks to tradingview for providing this unique indicator.

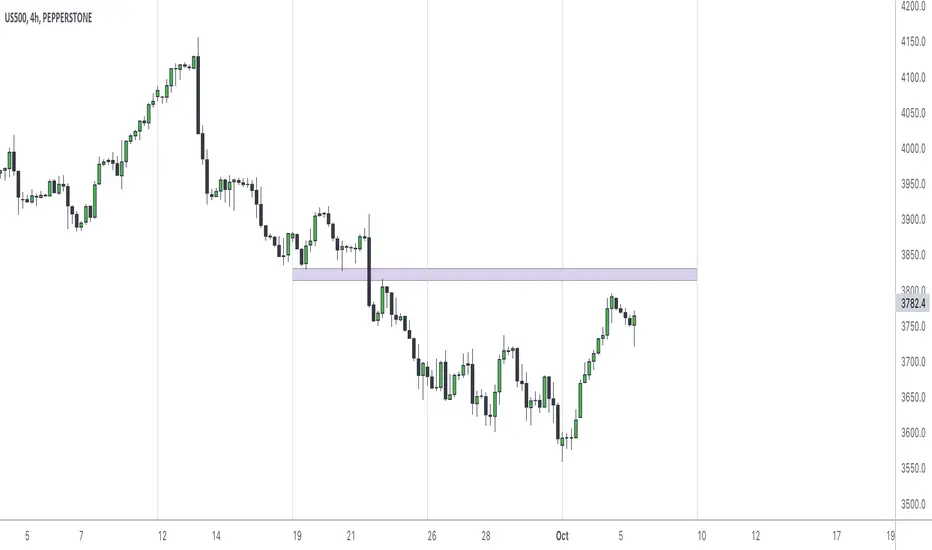
ASTER Key Levels & Alerts (Improved)TradingView Script Description
Title: ASTER Key Levels & Alerts (Improved)
Description:
Enhance your trading strategy with the "ASTER Key Levels & Alerts" indicator, designed for precision and decision-making on the Aster chart (e.g., ASTS). This Pine Script v6 tool overlays customizable key levels and zones to identify optimal entry, exit, and stop-loss points, complete with real-time alerts.Key Features:
Customizable Levels: Adjust add zones (Light & Main), breakout, stop, and take-profit (TP1-TP3

OPEN = LOW + VWAP + Volume SurgeTradingView Pine Script that scans for OPEN = LOW, confirms VWAP support, and checks for volume surge — tailored for your intraday breakout strategy

Synthetic VX3! & VX4! continuous /VX futuresTradingView is missing continuous 3rd and 4th month VIX (/VX) futures, so I decided to try to make a synthetic one that emulates what continuous maturity futures would look like. This is useful for backtesting/historical purposes as it enables traders to see how their further out VX contracts would've performed vs the front month contract.
The indicator pulls actual realtime data (if you subscribe to the CBOE data package) or 15 minute delayed data for the VIX spot (the actual non-tradeable VIX index), the continuous front month (VX1!), and the continuous second month (VX2!) continually rolled contracts. Then the indicator's script applies a formula to fairly closely estimate how 3rd and 4th month continuous contracts would've moved.
It uses an exponential mean‑reversion to a long‑run level formula using:
σ(T) = θ+(σ0−θ)e−kT
You can expect it to be off by ~5% or so (in times of backwardation it might be less accurate).

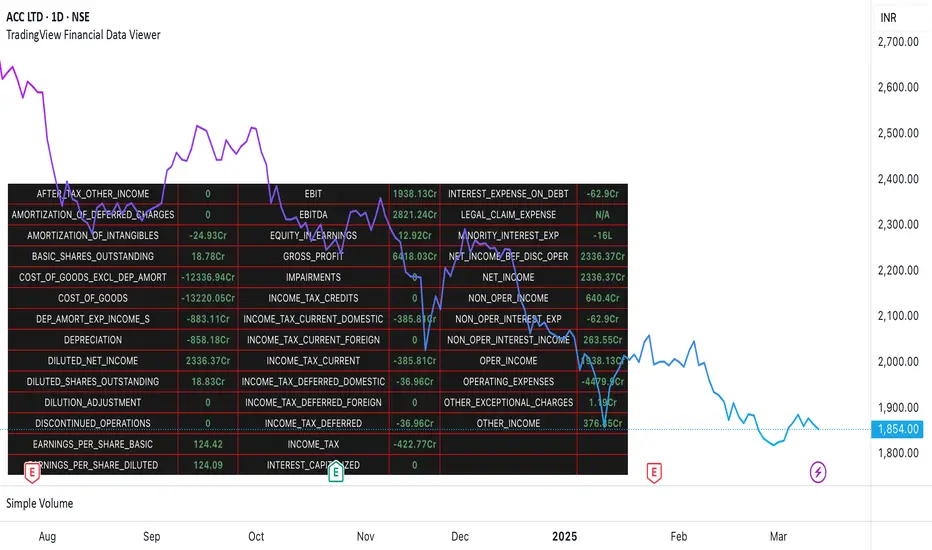
TradingView Financial Data ViewerTrading view provides request.security function to view the financial information of a script. The available sets of data is documented on below link
www.tradingview.com
The problem is there is no easy way to view this data as there are limitations to the # of unique requests that can be made. The limit is 40 for general paid accounts. So its makes it impossible to view the data in case you are looking to build a plugin related to some financial analysis.
So I came up with this trading view plugin which based on the documentation bifurcates the values available in the FQ, TTM and FY periods. Then you can select which period you would like to see. How many values you want to see at a time. And then next set of data can be viewed by increasing the Set # from 1 to which ever number keeps giving you the data.
Notes:
This is a data view only indicator and it will only display the latest data available for which quarter was there.
In case you want to view past data then you should go to replay mode and cut to the relative earning tags where you want to view the data
This is again for educational or study purpose only and is majorly helpful for those who want to create indicators based on Trading view supported financials and want to view what values are given for specific financial ids
The documentation reference and source of the plugin can be checked
S&P 500 Quandl Data & RatiosTradingView has a little-known integration that allows you to pull in 3rd party data-sets from Nasdaq Data Link, also known as Quandl. Today, I am open-sourcing for the community an indicator that uses the Quandl integration to pull in historical data and ratios on the S&P500. I originally coded this to study macro P/E ratios during peaks and troughs of boom/bust cycles.
The indicator pulls in each of the following datasets, as defined and provided by Quandl. The user can select which datasets to pull in using the indicator settings:
Dividend Yield : S&P 500 dividend yield (12 month dividend per share)/price. Yields following June 2022 (including the current yield) are estimated based on 12 month dividends through June 2022, as reported by S&P. Sources: Standard & Poor's for current S&P 500 Dividend Yield. Robert Shiller and his book Irrational Exuberance for historic S&P 500 Dividend Yields.
Price Earning Ratio : Price to earnings ratio, based on trailing twelve month as reported earnings. Current PE is estimated from latest reported earnings and current market price. Source: Robert Shiller and his book Irrational Exuberance for historic S&P 500 PE Ratio.
CAPE/Shiller PE Ratio : Shiller PE ratio for the S&P 500. Price earnings ratio is based on average inflation-adjusted earnings from the previous 10 years, known as the Cyclically Adjusted PE Ratio (CAPE Ratio), Shiller PE Ratio, or PE 10 FAQ. Data courtesy of Robert Shiller from his book, Irrational Exuberance.
Earnings Yield : S&P 500 Earnings Yield. Earnings Yield = trailing 12 month earnings divided by index price (or inverse PE) Yields following March, 2022 (including current yield) are estimated based on 12 month earnings through March, 2022 the latest reported by S&P. Source: Standard & Poor's
Price Book Ratio : S&P 500 price to book value ratio. Current price to book ratio is estimated based on current market price and S&P 500 book value as of March, 2022 the latest reported by S&P. Source: Standard & Poor's
Price Sales Ratio : S&P 500 Price to Sales Ratio (P/S or Price to Revenue). Current price to sales ratio is estimated based on current market price and 12 month sales ending March, 2022 the latest reported by S&P. Source: Standard & Poor's
Inflation Adjusted SP500 : Inflation adjusted SP500. Other than the current price, all prices are monthly average closing prices. Sources: Standard & Poor's Robert Shiller and his book Irrational Exuberance for historic S&P 500 prices, and historic CPIs.
Revenue Per Share : Trailing twelve month S&P 500 Sales Per Share (S&P 500 Revenue Per Share) non-inflation adjusted current dollars. Source: Standard & Poor's
Earnings Per Share : S&P 500 Earnings Per Share. 12-month real earnings per share inflation adjusted, constant August, 2022 dollars. Sources: Standard & Poor's for current S&P 500 Earnings. Robert Shiller and his book Irrational Exuberance for historic S&P 500 Earnings.
Disclaimer: This is not financial advice. Open-source scripts I publish in the community are largely meant to spark ideas that can be used as building blocks for part of a more robust trade management strategy. If you would like to implement a version of any script, I would recommend making significant additions/modifications to the strategy & risk management functions. If you don’t know how to program in Pine, then hire a Pine-coder. We can help!

Candle Close ConfirmationTradingview doesn't provide a way to prevent unclosed candles from displaying in real time.
This script helps to reduce errors that span from reading unconfirmed candles by preventing the unconfirmed candle from displaying across all timeframes.
Ideal for traders with strategies that rely on candle confirmation signals.
NOTE: It works by drawing new candles based on the normal candles and stops just before the current unconfirmed candle, so you need to disable regular bar chart candles for this to work properly.
How to do that -
Chart Settings >
Symbols >
Candles >
Disable (Body, Borders, Wick)
Timed AlertTradingView doesn't offer a way easily set timed alerts. This script solves that problem and also allows you to set variables in the script similar to other alerts.
The variables can be found here .

McDonald's Pattern [LuxAlgo]Tradingview asked, we delivered. This script fits a cubic Bezier curve using tops/bottoms in order to approximate a McDonalds pattern, a popular meme pattern in the crypto trading community.
Traditionally the McDonalds pattern is described by an M pattern with deep retracement (> 50%), forming a McDonalds logo.
Please note that this indicator is a meme & should not be taken seriously. Some aspects of this indicator are not real-time and meant for descriptive analysis alongside other components of this script, in this case, for entertainment purposes. We suggest looking through our other open-source scripts if you’re looking for more serious tools.
🔶 USAGE
The script fits Bezier curves using specific tops/bottoms as control points. When the distance between tops and bottoms values is relatively small, the user can more easily identify the pattern.
A score is shown on the top right of the chart, aiming to return how close the returned pattern is to the original logo.
A regular Mcdonalds pattern would return a red background, while an inverted pattern would return a green one.
🔶 SETTINGS
Length: Sensitivity of tops/bottoms detection. The method does not make use of pivot points, using rolling maximums/minimums instead.
Use First Bar As Vertex: Use the price and bar index of the last bar as vertex.

[cache_that_pass] 1m 15m Function - Weighted Standard DeviationTradingview Community,
As I progress through my journey, I have come to the realization that it is time to give back. This script isn't a life changer, but it has the building blocks for a motivated individual to optimize the parameters and have a production script ready to go.
Credit for the indicator is due to @rumpypumpydumpy
I adapted this indicator to a strategy for crypto markets. 15 minute time frame has worked best for me.
It is a standard deviation script that has 3 important user configured parameters. These 3 things are what the end user should tweak for optimum returns. They are....
1) Lookback Length - I have had luck with it set to 20, but any value from 1-1000 it will accept.
2) stopPer - Stop Loss percentage of each trade
3) takePer - Take Profit percentage of each trade
2 and 3 above are where you will see significant changes in returns by altering them and trying different percentages. An experienced pinescript programmer can take this and build on it even more. If you do, I ask that you please share the script with the community in an open-source fashion.
It also already accounts for the commission percentage of 0.075% that Binance.US uses for people who pay fees with BNB.
How it works...
It calculates a weighted standard deviation of the price for the lookback period set (so 20 candles is default). It recalculates each time a new candle is printed. It trades when price lows crossunder the bottom of that deviation channel, and sells when price highs crossover the top of that deviation channel. It works best in mid to long term sideways channels / Wyckoff accumulation periods.

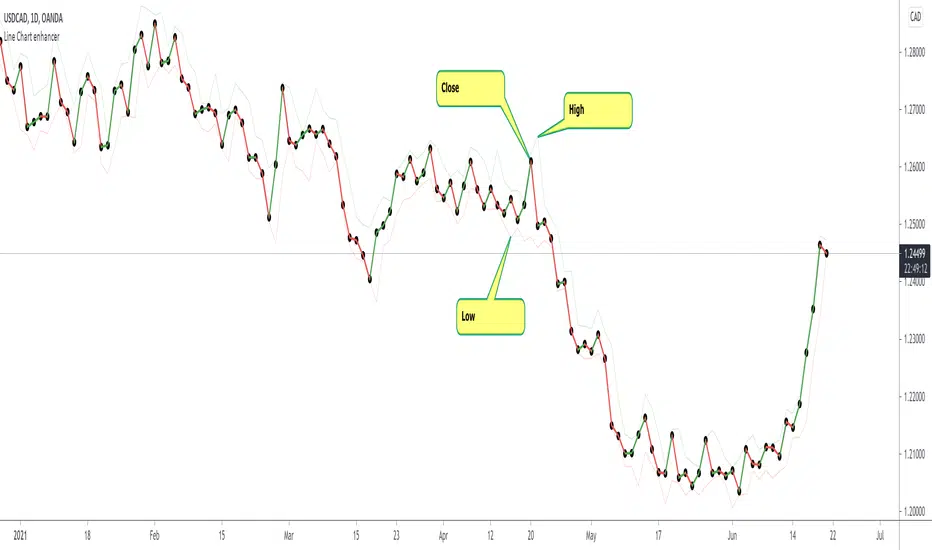
Line Chart Enhancer by makuchakuTradingview has a good line chart, but I wanted to make it even more awesome.
Some shortcomings which this line chart enhancer script fixes
Colors up move as green, down move as red (you can change them as you like)
Plots high and low - so that one can be aware about what the price is doing
To achieve the look with markers as shown above
Goto Symbol settings > Type > Select "With Markers"
Feedback welcome!
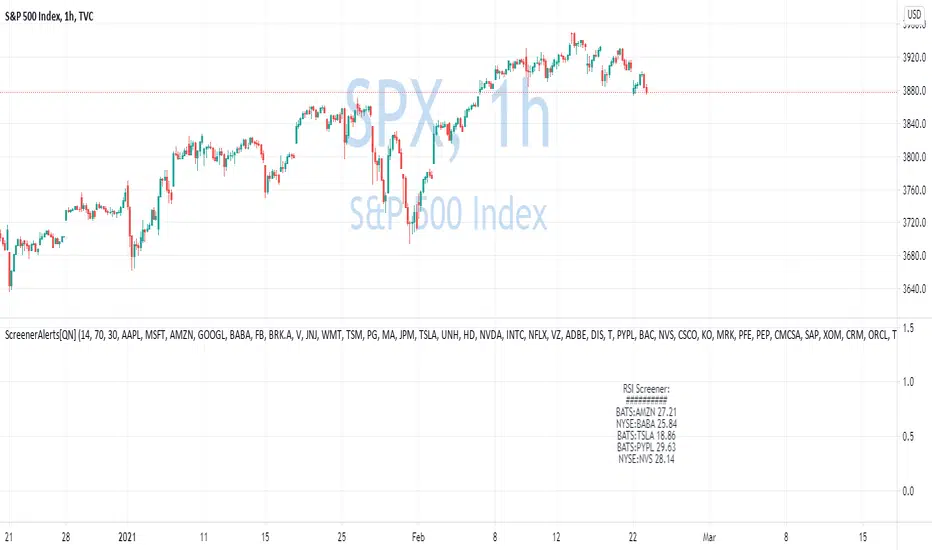
Custom Screener with Alerts V2 [QuantNomad]TradingView just recently announced the alert() function that allows you to create dynamic alerts from both strategies and studies.
So I decided to update custom screener I published before. It was based on alerts from orders in strategies, that was the only way to create dynamic alerts in PineScript at that point.
With the alert() function code become cleaner and more readable.
It works for up to 40 symbols at the same time.
You can create an alert from it easily by selecting screener name from the list and then selecting "Any alert() function call".
No additional configuration is required, message and alert on close I set up in the code.
I created as an example a screener that tracks both overbought (RSI > 70) and oversold stocks (RSI < 30).
To create your own screener you have to change only screenerFunc().
By design it should output 2 values:
cond - True/False Boolean variable. Should this instrument be displayed in the screener?
value - Additional numeric value you can display in your screener. I display RSI level for selected stocks for example.
Link to the old screener:
Disclaimer
Please remember that past performance may not be indicative of future results.
Due to various factors, including changing market conditions, the strategy may no longer perform as good as in historical backtesting.
This post and the script don’t provide any financial advice.
COVID-19 Country CodesTradingView's available country COVID-19 data. "TOTAL" refers to all cases of COVID-19. Let me know if I am missing some. I cannot find Taiwan.
Options to show: confirmed, deaths, recovered, and a delta of the total.
Option to transform data to show daily change.
There are much more comprehensive tools with more utility than mine; ideally this would be helpful towards another indicator.
Will add syminfo.description in the future for easier use.

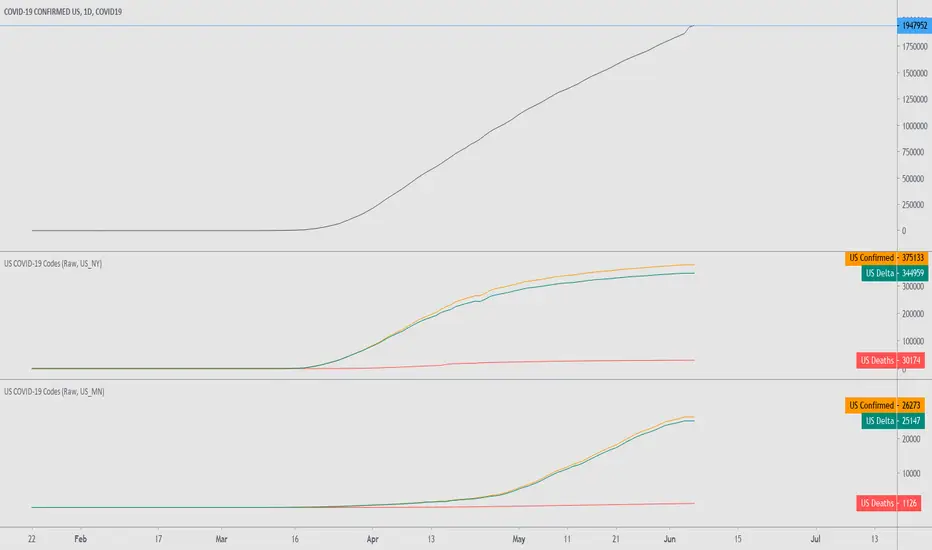
US COVID-19 CodesTradingView's available state, province, and the two ships Diamond Princess and Grand Princess COVID-19 data.
Options to show: confirmed, deaths, recovered, and a delta of the total. There seems to be missing data for the recovered cases.
Option to transform data to show daily change.
ChimichangasTradingView has released fractional contracts for cryptocurrencies. Very cool, very swag. This script is to see how it works, and to test the efficiency of position sizing.
(I would like to see % based stops or take profits instead of ticks added too)

Elder's Force Index Function (with source)TradingView has built in functions for RSI, Momentum, and many other oscillators. Why the source isn't available for Elder's Force Index is beyond me. To me it's one of the Holy Grail indicators. This is EFI indicator with a simple function inside the source code. You're can easily copy this function into any study(indicator) or strategy that uses built-in oscillators, as a replacement.
Example using EFI instead of RSI in built-in Divergence Indicator:
gyazo.com
//Discord: Sheldon#7775
//Server: discord.gg
