Gradient Trend Filter STRATEGY [ChartPrime/PineIndicators]This strategy is based on the Gradient Trend Filter indicator developed by ChartPrime. Full credit for the concept and indicator goes to ChartPrime.
The Gradient Trend Filter Strategy is designed to execute trades based on the trend analysis and filtering system provided by the Gradient Trend Filter indicator. It integrates a noise-filtered trend detection system with a color-gradient visualization, helping traders identify trend strength, momentum shifts, and potential reversals.
How the Gradient Trend Filter Strategy Works
1. Noise Filtering for Smoother Trends
To reduce false signals caused by market noise, the strategy applies a three-stage smoothing function to the source price. This function ensures that trend shifts are detected more accurately, minimizing unnecessary trade entries and exits.
The filter is based on an Exponential Moving Average (EMA)-style smoothing technique.
It processes price data in three successive passes, refining the trend signal before generating trade entries.
This filtering technique helps eliminate minor fluctuations and highlights the true underlying trend.
2. Multi-Layered Trend Bands & Color-Based Trend Visualization
The Gradient Trend Filter constructs multiple trend bands around the filtered trend line, acting as dynamic support and resistance zones.
The mid-line changes color based on the trend direction:
Green for uptrends
Red for downtrends
A gradient cloud is formed around the trend line, dynamically shifting colors to provide early warning signals of trend reversals.
The outer bands function as potential support and resistance, helping traders determine stop-loss and take-profit zones.
Visualization elements used in this strategy:
Trend Filter Line → Changes color between green (bullish) and red (bearish).
Trend Cloud → Dynamically adjusts color based on trend strength.
Orange Markers → Appear when a trend shift is confirmed.
Trade Entry & Exit Conditions
This strategy automatically enters trades based on confirmed trend shifts detected by the Gradient Trend Filter.
1. Trade Entry Rules
Long Entry:
A bullish trend shift is detected (trend direction changes to green).
The filtered trend value crosses above zero, confirming upward momentum.
The strategy enters a long position.
Short Entry:
A bearish trend shift is detected (trend direction changes to red).
The filtered trend value crosses below zero, confirming downward momentum.
The strategy enters a short position.
2. Trade Exit Rules
Closing a Long Position:
If a bearish trend shift occurs, the strategy closes the long position.
Closing a Short Position:
If a bullish trend shift occurs, the strategy closes the short position.
The trend shift markers (orange diamonds) act as a confirmation signal, reinforcing the validity of trade entries and exits.
Customization Options
This strategy allows traders to adjust key parameters for flexibility in different market conditions:
Trade Direction: Choose between Long Only, Short Only, or Long & Short .
Trend Length: Modify the length of the smoothing function to adapt to different timeframes.
Line Width & Colors: Customize the visual appearance of trend lines and cloud colors.
Performance Table: Enable or disable the equity performance table that tracks historical trade results.
Performance Tracking & Reporting
A built-in performance table is included to monitor monthly and yearly trading performance.
The table calculates monthly percentage returns, displaying them in a structured format.
Color-coded values highlight profitable months (blue) and losing months (red).
Tracks yearly cumulative performance to assess long-term strategy effectiveness.
Traders can use this feature to evaluate historical performance trends and optimize their strategy settings accordingly.
How to Use This Strategy
Identify Trend Strength & Reversals:
Use the trend line and cloud color changes to assess trend strength and detect potential reversals.
Monitor Momentum Shifts:
Pay attention to gradient cloud color shifts, as they often appear before the trend line changes color.
This can indicate early momentum weakening or strengthening.
Act on Trend Shift Markers:
Use orange diamonds as confirmation signals for trend shifts and trade entry/exit points.
Utilize Cloud Bands as Support/Resistance:
The outer bands of the cloud serve as dynamic support and resistance, helping with stop-loss and take-profit placement.
Considerations & Limitations
Trend Lag: Since the strategy applies a smoothing function, entries may be slightly delayed compared to raw price action.
Volatile Market Conditions: In high-volatility markets, trend shifts may occur more frequently, leading to higher trade frequency.
Optimized for Trend Trading: This strategy is best suited for trending markets and may produce false signals in sideways (ranging) conditions.
Conclusion
The Gradient Trend Filter Strategy is a trend-following system based on the Gradient Trend Filter indicator by ChartPrime. It integrates noise filtering, trend visualization, and gradient-based color shifts to help traders identify strong market trends and potential reversals.
By combining trend filtering with a multi-layered cloud system, the strategy provides clear trade signals while minimizing noise. Traders can use this strategy for long-term trend trading, momentum shifts, and support/resistance-based decision-making.
This strategy is a fully automated system that allows traders to execute long, short, or both directions, with customizable settings to adapt to different market conditions.
Credit for the original concept and indicator goes to ChartPrime.
"track" için komut dosyalarını ara

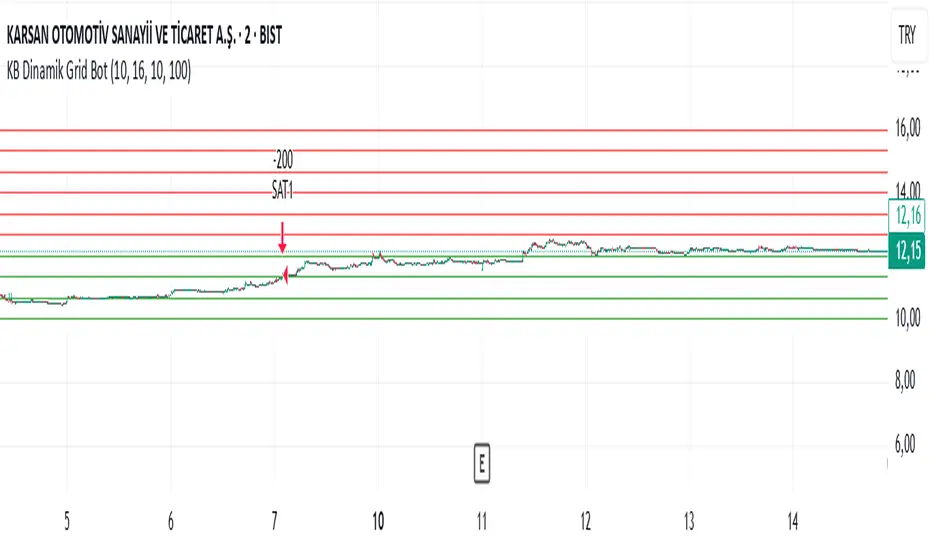
KB Dinamik Grid Bot V8 TrailingThis Pine Script code aims to create a "Dynamic Grid Trading Bot" and perform automatic trading between price ranges. Let's break it down into sections to better understand its functions:
1. Settings and User Inputs
The user can specify the following parameters for the bot:
Lower and Upper Price Limit: Determines the price range where the grid levels are defined.
Number of Grid Lines: Defines how many levels the grid will consist of.
Transaction Amount: Specifies the trading volume for each trading transaction.
Start Date: The date when the bot will start trading.
Price Step (priceStep): Specifies specific steps after the comma to adjust the grid levels more precisely.
Trailing: A feature that activates dynamic selling by following price movements.
2. Calculating Grid Levels
Grid levels: Divides the specified price range into user-defined levels and rounds each level with priceStep.
Lines and labels: Lines and labels are created to visually represent grid levels.
3. Buying and Selling Logic
Buying Transaction: When the price approaches a lower grid level (as much as the offset) and the position is empty, a purchase is made.
Trailing Selling: If Trailing is active, a sale is made when the price passes the specified "trailing step" level.
Normal Selling: If Trailing is not active, a sale is made when the price approaches an upper grid level.
4. Profit and Statistics Tracking
The bot tracks the profit-loss status per transaction and in total.
The number of purchases and sales and net profit information are calculated from the start date.
5. Table Display
The bot places statistical data in a table:
Number of purchases and sales.
Starting date.
Total number of transactions.
Net profit.
Amount of open positions.
6. Drawing and Tracking
Each price movement is updated and the color of the grid lines (green or red) is changed depending on the price's status relative to the level.
This code is a strategy that aims to make a profit by continuously buying and selling in the event of price fluctuations within a range. The "Trailing" feature allows you to keep your profits when the price moves upwards. Net profit, open positions and other statistics are displayed in the table.
Butterworth LPF Flip + AutoTune (PF)Butterworth LPF Flip + AutoTune (PF)
This strategy trades price trend flips using two Butterworth low-pass filters (a FAST filter and a SLOW filter). A trade is taken when the FAST filter crosses the SLOW filter. Optionally, the script can auto-tune the filter lengths by simulating many Fast/Slow combinations and selecting the pair with the best Profit Factor (PF).
What the Script Does
- Computes two 2‑pole Butterworth low‑pass filters on price.
- Enters LONG when FAST crosses above SLOW.
- Enters SHORT when FAST crosses below SLOW.
- Optionally simulates many Fast/Slow length combinations internally.
- Chooses the Fast/Slow pair with the highest Profit Factor.
- Trades only the selected best pair.
Manual Mode (Default)
1. Leave Auto‑Tune OFF.
2. Set:
- FAST cutoff period (bars)
- SLOW cutoff period (bars)
3. The strategy will trade using only these values.
Use this mode for normal trading or live deployment.
Auto‑Tune Mode
1. Enable Auto‑Tune.
2. Define Fast and Slow ranges:
- FAST min / max / step
- SLOW min / max / step
3. The script simulates ALL Fast × Slow combinations bar‑by‑bar.
4. Each combination tracks:
- Gross Profit
- Gross Loss
- Closed trades
- Profit Factor (PF = GP / GL)
5. At the end of the chart, the best PF pair is selected and used for trading.
Interpreting the End Box
The status label at the end of the chart reports:
- Whether Auto‑Tune is enabled
- Number of candidate pairs tested
- Best FAST period
- Best SLOW period
- Profit Factor of the best pair
- Win Rate (wins ÷ closed trades)
If PF is near 1.0 or trades are very low, expand the range or length of the test.
Best Practices
- Use Auto‑Tune ONLY for research and optimization.
- After finding good parameters, disable Auto‑Tune and trade manually.
- Keep Fast < Slow (logical separation).
- Longer charts produce more reliable PF results.
- Avoid very small step sizes (performance + noise).
Known Limitations
- Pine Script runs bar‑by‑bar; tuning is approximate, not vectorized.
- Large grids increase execution time.
- Results are historical and NOT predictive.
- Not suitable for live auto‑optimization.
Summary
This script is best viewed as a *research tool first, strategy second*. Use it to discover stable Fast/Slow regimes, then lock them in for simple, repeatable trading.

Session Opening Range Breakout (ORBO)This strategy automates a classic Opening Range Breakout (ORBO) approach: it builds a price range for the first minutes after the market opens, then looks for strong breakouts above or below that range to catch early directional moves.
Concept
The idea behind ORBO is simple:
The first minutes after the session open are often highly informative.
Price forms an “opening range” that acts as a mini support/resistance zone.
A clean breakout beyond this zone can lead to high-momentum moves.
This script turns that logic into a fully backtestable strategy in TradingView.
How the strategy works
Opening Range Session
Default session: 09:30–09:50 (exchange time)
During this window, the script tracks:
orHigh → highest high within the session
orLow → lowest low within the session
This forms your Opening Range for the day.
Breakout Logic (after the window ends)
Once the defined session ends:
Long Entry:
If the close crosses above the Opening Range High (orHigh),
→ strategy.entry("OR Long", strategy.long) is triggered.
Short Entry:
If the close crosses below the Opening Range Low (orLow),
→ strategy.entry("OR Short", strategy.short) is triggered.
Only one opening range per day is considered, which keeps the logic clean and easy to interpret.
Daily Reset
At the start of a new trading day, the script resets:
orHigh := na
orLow := na
A fresh Opening Range is then built using the next session’s 09:30–09:50 candles.
This ensures entries are always based on today’s structure, not yesterday’s.
Visuals & Inputs
Inputs:
Opening range session → default: "0930-0950"
Show OR levels → toggle visibility of OR High / Low lines
Fill range body → optional shaded zone between OR High and OR Low
Chart visuals:
A green line marks the Opening Range High.
A red line marks the Opening Range Low.
Optional yellow fill highlights the entire OR zone.
Background shading during the session shows when the range is currently being built.
These visuals make it easy to see:
Where the OR sits relative to current price
How clean / noisy the breakout was
How often price respects or rejects the opening zone
Backtesting & Optimization
Because this is written as a strategy():
You can use TradingView’s Strategy Tester to view:
Win rate
Net profit
Drawdown
Profit factor
Equity curve
Ideas to experiment with:
Change the session window (e.g., 09:15–09:45, 10:00–10:30)
Apply to different:
Markets: indices, FX, crypto, stocks
Timeframes: 1m / 5m / 15m
Add your own:
Stop Loss & Take Profit levels
Time filters (only trade certain days / times)
Volatility filters (e.g., ATR, range size thresholds)
Higher-timeframe trend filter (e.g., only take longs above 200 EMA)

Liquidity Sweep & FVG StrategyThis strategy combines higher-timeframe liquidity levels, stop-hunt (sweep) logic, Fair Value Gaps (FVGs) and structure-based take-profits into a single execution engine.
It is not a simple mash-up of indicators: every module (HTF levels, sweeps, FVGs, ZigZag, sessions) feeds the same entry/exit logic.
1. Core Idea
The script looks for situations where price:
Sweeps a higher-timeframe high/low (takes liquidity around obvious levels),
Then forms a displacement candle with a gap (FVG) in the opposite direction,
Then uses the edge of that FVG as a limit entry,
And manages exits using unswept structural levels (ZigZag swings or HTF levels) as targets.
The intent is to systematically trade failed breakouts / stop hunts with a defined structure and risk model.
It is a backtesting / study tool, not a signal service.
2. How the Logic Works (Conceptual)
a) Higher-Timeframe Liquidity Engine
Daily, Weekly and Monthly highs/lows are pulled via request.security() and stored as HTF liquidity levels.
Each level is drawn as a line with optional label (1D/1W/1M High/Low).
A level is marked as “swept” once price trades through it; swept levels may be removed or shortened depending on settings.
b) Sweep & Manipulation Filter
A low sweep occurs when the current low trades through a stored HTF low.
A high sweep occurs when the current high trades through a stored HTF high.
If both a high and a low are swept in the same bar, the script flags this as “manipulation” and blocks new entries around that noise.
The script also tracks the sweep wick, bar index and HTF timeframe for later use in SL placement and labels.
c) FVG Detection & Management
FVGs are defined using a 3-candle displacement model:
Bullish FVG: high < low
Bearish FVG: low > high
Only gaps larger than a minimum size (ATR-based if no manual value is set) are kept.
FVGs are stored in arrays as boxes with: top, bottom, mid (CE), direction, and state (filled / reclaimed).
Boxes are auto-extended and visually faded when price is far away, or deleted when filled.
d) Entry Conditions (Sweep + FVG)
For each recent sweep window:
After a low sweep, the script searches for the nearest bullish FVG below price and uses its top edge as a long limit entry.
After a high sweep, it searches for the nearest bearish FVG above price and uses its bottom edge as a short limit entry.
A “knife protection” check blocks trades where price is already trading through the proposed stop.
Only one entry per sweep is allowed; entries are only placed inside the configured NY trading sessions and only if no manipulation flag is active and EOD protection allows it.
e) Stop-Loss Placement (“Tick-Free” SL)
The stop is not placed directly on the HTF level; instead, the script scans a window around the sweep bar to find a local extreme:
Longs: lowest low in a configurable bar window around the sweep.
Shorts: highest high in that window.
This produces a structure-based SL that is generally outside the main sweep wick.
f) Take-Profit Logic (ZigZag + HTF Levels)
A lightweight ZigZag engine tracks swing highs/lows and removes levels that have already been broken.
For intraday timeframes (< 1h), TP candidates come from unswept ZigZag swings above/below the entry.
For higher timeframes (≥ 1h), TP candidates fall back to unswept HTF liquidity levels.
The script picks up to two targets:
TP1: nearest valid target in the trade direction (or a 2R fallback if none exists),
TP2: second target (or a 4R fallback if none exists).
A multi-TP model is used: typically 50% at TP1, remainder managed towards TP2 with breakeven plus offset once TP1 is hit.
g) Session & End-of-Day Filters
Three predefined NY sessions (Early, Open, Afternoon) are available; entries are only allowed inside active sessions.
An End-of-Day filter checks a user-defined NY close time and:
Blocks new entries close to the end of the day,
Optionally forces flat before the close.
3. Inputs Overview (Conceptual)
Liquidity settings: which HTF levels to track (1D/1W/1M), how many to show, and sweep priority (highest TF vs nearest vs any).
FVG settings: visibility radius, search window after a sweep, minimum FVG size.
ZigZag settings: swing length used for TP discovery.
Execution & protection: limit order timeout, breakeven offset, EOD protection.
Visuals: labels, sweep markers, manipulation warning, session highlighting, TP lines, etc.
For exact meaning of each input, please refer to the inline comments in the open-source code.
4. Strategy Properties & Backtesting Notes
Default strategy properties in this script:
Initial capital: 100,000
Order size: 10% of equity (strategy.percent_of_equity)
Commission: 0.01% per trade (adjust as needed for your broker/asset)
Slippage: must be set manually in the Strategy Tester (recommended: at least a few ticks on fast markets).
Even though the order size is 10% of equity, actual risk per trade depends on the SL distance and is typically much lower than 10% of the account. You should still adjust these values to keep risk within what you personally consider sustainable (e.g. somewhere in the 1–2% range per trade).
For more meaningful results:
Test on liquid instruments (e.g. major indices, FX, or liquid futures).
Use enough history to reach 100+ closed trades on your market/timeframe.
Always include realistic commission and slippage.
Do not assume that past performance will continue.
5. How to Use
Apply the strategy to your preferred symbol and timeframe.
Set broker-like commission and slippage in the Strategy Tester.
Adjust:
HTF levels (1D/1W/1M),
Sessions (NY windows),
FVG search window and minimum size,
ZigZag length and EOD filter.
Observe how entries only appear:
After a HTF sweep,
In the configured session,
At a FVG edge,
With TP lines anchored at unswept structure / liquidity.
Use this primarily as a research and backtesting tool to study how your own ICT / SMC ideas behave over a large sample of trades.
6. Disclaimer
This script is for educational and research purposes only.
It does not constitute financial advice, and it does not guarantee profitability. Always validate results with realistic assumptions and use your own judgment before trading live.

Futures Fighter MO: Multi-Confluence Day Trading System ADX/SMI👋 Strategy Overview: The Multi-Confluence Mashup
The Futures Fighter MO is a comprehensive, multi-layered day trading strategy designed for experienced traders focusing on high-liquidity futures contracts (e.g., NQ, ES, R2K).
This strategy is a sophisticated mashup that uses the 1-minute chart for surgical entries while enforcing strict environmental filtering through higher-timeframe data. We aim to capture high-conviction moves only when multiple, uncorrelated signals align.
🧠 How the Logic Works (Concepts & Confluence)
Our logic is built on four pillars, which must align for a trade to be executed:
Primary Trend Filter
Indicators :
ADX/DMI (15-Minute Lookback)
Role :
Price action is filtered to ensure the ADX (17/14) is above 25, confirming a strong, prevailing market trend (Bullish or Bearish). Trades are strictly rejected during "Flat" (sideways) market regimes.
Entry Signal Types
The system uses multiple entry types:
- 🟢 Trend Long/Short: A breakout/rejection near the 200-Period EMA is confirmed by the primary ADX trend.
- 🔴 Engulfing Rejection: A strong signal when a Bullish/Bearish Engulfing or Doji prints near the long-term 500-Period EMA (emaGOD) while the Stochastic Momentum Index (SMI on 30M) is in an extreme overbought/oversold state (below $-40$ or above $40$).
Volatility & Volume Confirmation
Indicators: Average True Range (ATR) and 20-Period SMA of Volume
Role: Every entry requires a volume spike (Current Volume $> 1.5 \times$ SMA Volume) to confirm that the move is supported by significant liquidity. Volatility is tracked via ATR to define bar range and stop boundaries.
Structural Guardrails
Indicators: Daily Pivot Points (PP, S1-S3, R1-R3)
Role: Trades are disabled if the current bar's price range intersects with a Daily Pivot Point. This is a critical filter to avoid high-chop consolidation zones near key structural levels.
📊 Strategy Results & Required Disclosures
I strive to publish backtesting results that are transparent and realistic for the retail futures trader.
- Initial Capital: $50,000 - A realistic base for Mini/Micro futures contracts.
- Order Size: 1 Contract (Pyramiding up to 3) - Conservative risk relative to the account size.
- Commission: $0.11 USD per order - Represents realistic costs for low-cost brokers.
- Slippage: 2 Ticks - Accounts for expected market friction.
⚠️ Risk Management & Deviations
Stop-Loss: The strategy uses a dynamic stop-loss system where positions are closed upon a reversal (e.g., breaking the 50-Period EMA or failure to hold a Pivot Point), rather than a fixed tick-based stop. This is suited for experienced traders using a low relative risk (single Micro-contract entry) on a larger account. Users must confirm that the first entry's maximum potential loss remains below $10\%$ of their capital for compliance.
Trade Sample Size: Due to data limitations of the TradingView Essential plan (showing $\approx 50$ trades over 2 weeks), the sample size is under the ideal $100+$ target. Justification: This system is designed to generate signals across a portfolio of correlated futures markets (NQ, ES, R2K, Gold, Crude), meaning the real sample size for a user tracking the portfolio is significantly higher.
Drawdown Control: This strategy is designed for manual management. It requires the user to turn the script/alerts OFF after a significant drawdown and only reactivate it once a recovery trend is established externally.
The strategy uses a combination of dynamic trailing stops, structural support/resistance zones, and a fixed profit target to manage open positions.
🛑 Strategy Exit Logic
1. General Stop-Loss (Dynamic Trailing Stop)
These conditions act as the primary dynamic stop, closing the position if the market reverses past a key Moving Average (MA):
- Long Positions Closed When: The current bar's close crosses under the 50-Period EMA (emaLong).
- Short Positions Closed When: The current bar's close crosses above the 50-Period EMA (emaLong).
2. Profit Target (Fixed Percentage)
The script includes a general exit based on a user-defined profit percentage:
Take Profit Trigger: The position is closed when the currentProfitPercent meets or exceeds the input Profit Target (%) (default is 1.0% of the entry price).
3. Structural Exits (Daily Pivot Points)
These exits are high-priority, "close all" orders that trigger when the price fails to hold or reclaims a recent Daily Pivot Point, suggesting a failure of the current move.
- VR Close All - Long ($\sym{size} > 0$) - Price crosses under a Daily Resistance Level (R1, R2, or R3) minus 1 ATR within the last 10 bars. This indicates the current momentum failed to hold Resistance as support.
- VS Close All - Short ($\sym{size} < 0$) - Price crosses above a Daily Support Level (S1, S2, or S3) plus 1 ATR within the last 10 bars. This indicates the current momentum failed to hold Support as resistance.
4. Trend Failure Exit (Trend-Following Signals Only)
This exit protects against holding a position when the primary high-timeframe trend used for the entry has failed:
- Long Positions Closed When: The primary trend is no longer "bullish" for more than 2 consecutive bars (i.e., it turned "bearish" or "flat").
- Short Positions Closed When: The primary trend is no longer "bearish" for more than 2 consecutive bars (i.e., it turned "bullish" or "flat").
5. End of Day (EOD) Session Control
The final hard exits based on time:
- End of Session (EoS): At 11:30 AM, new trades are disabled (TradingDay := false). Open positions are kept.
- End of Day (EoD): At 1:30 PM, all remaining open positions are closed (strategy.close_all).
🤝 Development & Disclaimer
This script and description were created with assistance from Gemini and GitHub Copilot. My focus is on helping fellow real estate investors and day traders develop mechanically sound systems.
Disclaimer: This is for educational purposes only and does not constitute financial advice. Always abide by the Realtor Code and manage your own risk.

Intra Bullish Strategy - Profit Ping v4.0ProfitPing 4.0 is a high-precision intraday swing trading strategy designed for global equity markets, including the US, South Africa, and Australia. The system identifies high-probability BUY and EXIT signals using a confluence of technical indicators and real-time volume dynamics.
🧠 Key Features:
Dual EMA Crossover (7 & 14) for short-term trend confirmation
Volume Spike Detection based on 20-period moving average
RSI Momentum Filter (ideal zone: 55–65) to avoid overbought entries
MACD Histogram & Signal Line Sync for trend momentum validation
Candlestick Pattern Filtering (e.g. bullish engulfing, flags, breakout candles)
Multi-Timeframe Confirmation (optional) for intraday trend alignment
Dynamic Risk-to-Reward Logic built into alert framework
Webhook-compatible JSON alerts for automation to Google Sheets, Power BI, and IBKR
🛠️ Alert System:
BUY alert triggers when all bullish conditions align
EXIT alert triggers only if a previous BUY exists for that ticker
Trade status is updated live in Google Sheets and integrated with Power BI dashboards
Orphaned EXITs (no matched BUY) are tracked separately for accuracy review
🔄 Ideal For:
Traders seeking 1:2 to 1:5 risk/reward setups
Automation-focused workflows (via TradingView → Google Sheets → Power BI)
Swing traders wanting clean visual logs, automated P&L tracking, and optional IBKR execution

G-Bot v3Overview:
G-Bot is an invite-only Pine Script tailored for traders seeking a precise, automated breakout strategy. This closed-source script integrates with 3Commas via API to execute trades seamlessly, combining classic indicators with proprietary logic to identify high-probability breakouts. G-Bot stands out by filtering market noise through a unique confluence of signals, offering adaptive risk management, and employing advanced alert deduplication to ensure reliable automation. Its purpose-built design delivers actionable signals for traders prioritizing consistency and efficiency in trending markets.
What It Does and How It Works:
G-Bot generates trade signals by evaluating four key market dimensions—trend, price action, momentum, and volume—on each 60-minute bar. The script’s core components and their roles are:
Trend Detection (EMAs): Confirms trend direction by checking if the 5-period EMA is above (bullish) or below (bearish) the 6-period EMA, with the price positioned accordingly (above the 5-period EMA for longs, below for shorts). The tight EMA pairing is optimized for the 60-minute timeframe to capture sustained trends while minimizing lag.
Price Action Trigger (Swing Highs/Lows): Identifies breakouts when the price crosses above the previous swing high (for longs) or below the previous swing low (for shorts), using a period lookback to focus on recent price pivots. This ensures entries align with significant market moves.
Momentum Filter (RSI): Validates breakouts by requiring RSI to fall within moderated ranges. These ranges avoid overbought/oversold extremes, prioritizing entries with balanced momentum to enhance trade reliability.
Volume Confirmation (3-period SMA): Requires volume to exceed its 3-period SMA, confirming that breakouts are driven by strong market participation, reducing the risk of false moves.
Risk Management (14-period ATR): Calculates stop-loss distances (ATR) and trailing stops (ATR and ATR-point offset) to align trades with current volatility, protecting capital and locking in profits.
These components work together to create a disciplined system: the EMAs establish trend context, swing breaks confirm price momentum, RSI filters for optimal entry timing, and volume ensures market conviction. This confluence minimizes false signals, a critical advantage for hourly breakout trading.
Why It’s Original and Valuable:
G-Bot’s value lies in its meticulous integration of standard indicators into a non-standard, automation-focused system. Its unique features include:
Curated Signal Confluence: Unlike generic breakout scripts that rely on single-indicator triggers (e.g., EMA crossovers), G-Bot requires simultaneous alignment of trend, price action, momentum, and volume. This multi-layered approach, reduces noise and prioritizes high-conviction setups, addressing a common flaw in simpler strategies.
Proprietary Alert Deduplication: G-Bot employs a custom mechanism to prevent redundant alerts, using a 1-second minimum gap and bar-index tracking. This ensures signals are actionable and compatible with 3Commas’ high-frequency automation, a feature not found in typical Pine Scripts.
Adaptive Position Sizing: The script calculates trade sizes based on user inputs (1-5% equity risk, max USD cap, equity threshold) and ATR-derived stop distances, ensuring positions reflect both account size and market conditions. This dynamic approach enhances risk control beyond static sizing methods.
3Commas API Optimization: G-Bot generates JSON-formatted alerts with precise position sizing and exit instructions, enabling seamless integration with 3Commas bots. This level of automation, paired with detailed Telegram alerts for monitoring, streamlines the trading process.
Visual Clarity: On-chart visuals—green triangles for long entries, red triangles for shorts, orange/teal lines for swing levels, yellow circles for price crosses—provide immediate insight into signal triggers, allowing traders to validate setups without accessing the code.
G-Bot is not a repackaging of public code but a specialized tool that transforms familiar indicators into a robust, automated breakout system. Its originality lies in the synergy of its components, proprietary alert handling, and trader-centric automation, justifying its invite-only status.
How to Use:
Setup: Apply G-Bot to BITGET’s BTCUSDT.P chart on a 60-minute timeframe.
3Commas Configuration: Enter your 3Commas API Secret Key and Bot UUID in the script’s input settings to enable webhook integration.
Risk Parameters: Adjust Risk % (1-5%), Max Risk ($), and Equity Threshold ($) to align position sizing with your account and risk tolerance.
Webhook Setup: Configure 3Commas to receive JSON alerts for automated trade execution. Optionally, connect Telegram for detailed signal notifications.
Monitoring: Use on-chart visuals to track signals:
Green triangles (below bars) mark long entries; red triangles (above bars) mark shorts.
Orange lines show swing highs; teal lines show swing lows.
Yellow circles indicate price crosses; purple crosses highlight volume confirmation.
Testing: Backtest G-Bot in a demo environment to validate performance and ensure compatibility with your trading strategy.
Setup Notes : G-Bot is a single, self-contained script for BTCUSDT.P on 60-minute charts, with all features accessible via user inputs. No additional scripts or passwords are required, ensuring compliance with TradingView’s single-publication rule.
Disclaimer: Trading involves significant risks, and past performance is not indicative of future results. Thoroughly test G-Bot in a demo environment before deploying it in live markets.
Full setup support will be provided

Adaptive Signal OracleAdaptive Signal Oracle – Precision Forecasting with Weighted KNN & HMA Trend Logic
🔍 Overview
Adaptive Signal Oracle is a forward-looking trend prediction strategy that merges non-repainting technical analysis with a machine-learning-inspired forecasting model. Built from scratch, it is not a mashup of off-the-shelf indicators. Instead, it uses a handcrafted K-Nearest Neighbors (KNN)-style prediction engine combined with a classic HMA (Hull Moving Average) trend filter to deliver actionable, high-confidence entries.
📈 Core Components Explained
🔸 1. KNN-Weighted Future Predictor (Custom Engine)
Simulates a machine learning process using historical price behavior.
Compares current conditions to a rolling dataset of past feature/label pairs.
Assigns weights based on distance, forming a probabilistic directional bias.
Generates:
Prediction Probability (% confidence)
Expected Price Movement Magnitude
Dynamic Trade Targets (TP1/TP2)
🔸 2. HMA Trend Filter (Hull Moving Average)
Used for real-time trend confirmation.
Prevents entry during whipsaws by enforcing directional alignment.
Non-repainting and adaptive to volatility swings.
🔸 3. Risk-Managed Execution Logic
Built-in 2-level take-profit system:
TP1: Partial exit (50%)
TP2: Full exit (remaining 100%)
Hard-coded stop-loss at a configurable percentage (default: 2%)
Includes cooldown logic to prevent same-bar entries and exits
🔸 4. Integrated Visual Dashboard
Tracks:
Trade status
Entry price
TP/SL hits
Trend direction
Real-time PnL
Dashboard is resizable and repositionable for user control
🔸 5. Clean Bar Coloring
Highlights predicted direction with green (bullish) and red (bearish) candles
Enhances signal visibility without interfering with price action
⚠️ Important Notes
This script does not repaint.
All calculations are based on confirmed historical data, using bar-closed logic only.
Ideal for crypto, forex, and trending asset classes, especially on the 1H+ timeframes.
Not intended for use as financial advice or automated investment decision-making.
🧠 How to Use
Set desired TP/SL levels in the strategy inputs.
Adjust k-value and lookback for best fit with your instrument.
Monitor the dashboard and colored bars for trade entries.
Use as part of a broader system with structure, support/resistance, or volume confirmation if needed.
🛡️ Disclaimer
This script is for educational and informational purposes only. It does not constitute financial advice. Past performance does not guarantee future results. Always test on historical data and demo environments before applying to live trading. The author is not liable for any financial decisions made based on this script.

Shockwave⚡️ Shockwave – Precision Momentum Strategy
🔹 Purpose
Shockwave is a precision-engineered trend and momentum strategy designed for aggressive, high-conviction trades. Built for volatile markets like crypto, this system enters only when trend, volume, and momentum are fully aligned — then exits intelligently using layered profit targets and trend weakening logic.
It filters out false breakouts, traps, and low-quality setups using advanced multi-factor confirmation. Ideal for trend-following traders who want cleaner signals, no repainting, and adaptive position handling.
🔹 Indicator Breakdown
1️⃣ ZLEMA + Gradient Filter (Trend Core)
Defines the trend using a Zero Lag EMA (ZLEMA) for responsiveness.
Gradient slope confirms acceleration or weakening in trend direction.
Uptrend: ZLEMA is rising and slope > 0.
Downtrend: ZLEMA is falling and slope < 0.
2️⃣ Smoothed CCI (Momentum Confirmation)
Uses ZLEMA as the source for CCI to avoid noise.
Bullish momentum: CCI rising above 0.
Bearish momentum: CCI falling below 0.
Filters out chop and premature entries.
3️⃣ Volume Spike Filter
Median-based filter confirms breakout volume integrity.
Requires volume > 1.5x median of previous candles.
Avoids low-volume whipsaws.
4️⃣ Vortex Indicator (Trend Strength Confirmation)
Confirms directional conviction by comparing VI+ vs VI–.
Long: VI+ > VI– and threshold difference is met.
Short: VI– > VI+ and trend strength is validated.
5️⃣ Wick Trap Filter (Reversal Trap Detection)
Blocks entries on manipulative upper/lower wick patterns.
Longs rejected if upper wick > 1.5× body and close is weak.
Shorts rejected if lower wick > 1.5× body and close is strong.
🔹 Strategy Logic & Trade Execution
✅ Entry Conditions
A trade is entered only when all the following align:
ZLEMA trend direction is confirmed.
CCI momentum matches the trend.
Volume spike confirms participation.
Vortex difference meets strength threshold.
No wick trap is present.
✅ Exit Conditions
TP1: 50% of the position is closed at the first profit level.
TP2: Remaining 50% is closed at the second target.
Weak Trend Exit: If ZLEMA slope flips against the trade, the position is closed early.
A 1-bar cooldown delay is enforced after closing to prevent same-bar reentry.
🔹 Take-Profit System
TP1: 50% close at +2% for longs / –2% for shorts
TP2: Full close at +4% for longs / –4% for shorts
Limit orders are used for precise profit-taking
TP1/TP2 status is tracked and displayed in the live dashboard
🔹 Risk Management (Important)
🚫 This strategy does not include a stop-loss by default.
Trades are exited using trend reversal detection or TP targets.
💡 Suggested risk controls:
Add a manual stop-loss based on recent swing high/low
Use appropriate position sizing based on volatility
Apply the strategy in strong trending environments
🔹 Default Backtest Settings
Initial Capital: $1,000
Position Size: 10% of equity per trade
Commission: 0.05%
Slippage: 1
Strategy Date Filter: Adjustable (default: 2023–2029)
🔹 How to Use Shockwave
Apply to any chart (best results on 1H or higher).
Review backtest performance.
Adjust take-profit percentages or thresholds as needed.
Use in strongly trending markets — avoid sideways ranges.
Add your own stop-loss if desired.
⚠️ Disclaimer
This strategy is for educational and informational purposes only. It is not financial advice. Trading involves risk, and past performance does not guarantee future results. Always test thoroughly and manage your own risk.
🚀 Why Use Shockwave?
✔ Multi-layer confirmation for high-quality entries
✔ Non-repainting logic for backtest/live consistency
✔ Adaptive trend/momentum filtering
✔ Dual profit targets for smart trade management
✔ Visual dashboard with live tracking

Dskyz (DAFE) Quantum Sentiment Flux - Beginners Dskyz (DAFE) Quantum Sentiment Flux - Beginners:
Welcome to the Dskyz (DAFE) Quantum Sentiment Flux - Beginners , a strategy and concept that’s your ultimate wingman for trading futures like MNQ, NQ, MES, and ES. This gem combines lightning-fast momentum signals, market sentiment smarts, and bulletproof risk management into a system so intuitive, even newbies can trade like pros. With clean DAFE visuals, preset modes for every vibe, and a revamped dashboard that’s basically a market GPS, this strategy makes futures trading feel like a high-octane sci-fi mission.
Built on the Dskyz (DAFE) legacy of Aurora Divergence, the Quantum Sentiment Flux is designed to empower beginners while giving seasoned traders a lean, sentiment-driven edge. It uses fast/slow EMA crossovers for entries, filters trades with VIX, SPX trends, and sector breadth, and keeps your account safe with adaptive stops and cooldowns. Tuned for more action with faster signals and a slick bottom-left dashboard, this updated version is ready to light up your charts and outsmart institutional traps. Let’s dive into why this strat’s a must-have and break down its brilliance.
Why Traders Need This Strategy
Futures markets are a wild ride—fast moves, volatility spikes (like the April 28, 2025 NQ 1k-point drop), and institutional games that can wreck unprepared traders. Beginners often get lost in complex systems or burned by impulsive trades. The Quantum Sentiment Flux is the antidote, offering:
Dead-Simple Setup: Preset modes (Aggressive, Balanced, Conservative) auto-tune signals, risk, and sizing, so you can trade without a quant degree.
Sentiment Superpower: VIX filter, SPX trend, and sector breadth visuals keep you aligned with market health, dodging chop and riding trends.
Ironclad Safety: Tighter ATR-based stops, 2:1 take-profits, and preset cooldowns protect your capital, even in chaotic sessions.
Next-Level Visuals: Green/red entry triangles, vibrant EMAs, a sector breadth background, and a beefed-up dashboard make signals and context pop.
DAFE Swagger: The clean aesthetics, sleek dashboard—ties it to Dskyz’s elite brand, making your charts a work of art.
Traders need this because it’s a plug-and-play system that blends beginner-friendly simplicity with pro-level market awareness. Whether you’re just starting or scalping 5min MNQ, this strat’s your key to trading with confidence and style.
Strategy Components
1. Core Signal Logic (High-Speed Momentum)
The strategy’s engine is a momentum-based system using fast and slow Exponential Moving Averages (EMAs), now tuned for faster, more frequent trades.
How It Works:
Fast/Slow EMAs: Fast EMA (Aggressive: 5, Balanced: 7, Conservative: 9 bars) and slow EMA (12/14/18 bars) track short-term vs. longer-term momentum.
Crossover Signals:
Buy: Fast EMA crosses above slow EMA, and trend_dir = 1 (fast EMA > slow EMA + ATR * strength threshold).
Sell: Fast EMA crosses below slow EMA, and trend_dir = -1 (fast EMA < slow EMA - ATR * strength threshold).
Strength Filter: ma_strength = fast EMA - slow EMA must exceed an ATR-scaled threshold (Aggressive: 0.15, Balanced: 0.18, Conservative: 0.25) for robust signals.
Trend Direction: trend_dir confirms momentum, filtering out weak crossovers in choppy markets.
Evolution:
Faster EMAs (down from 7–10/21–50) catch short-term trends, perfect for active futures markets.
Lower strength thresholds (0.15–0.25 vs. 0.3–0.5) make signals more sensitive, boosting trade frequency without sacrificing quality.
Preset tuning ensures beginners get optimized settings, while pros can tweak via mode selection.
2. Market Sentiment Filters
The strategy leans hard into market sentiment with a VIX filter, SPX trend analysis, and sector breadth visuals, keeping trades aligned with the big picture.
VIX Filter:
Logic: Blocks long entries if VIX > threshold (default: 20, can_long = vix_close < vix_limit). Shorts are always allowed (can_short = true).
Impact: Prevents longs during high-fear markets (e.g., VIX spikes in crashes), while allowing shorts to capitalize on downturns.
SPX Trend Filter:
Logic: Compares S&P 500 (SPX) close to its SMA (Aggressive: 5, Balanced: 8, Conservative: 12 bars). spx_trend = 1 (UP) if close > SMA, -1 (DOWN) if < SMA, 0 (FLAT) if neutral.
Impact: Provides dashboard context, encouraging trades that align with market direction (e.g., longs in UP trend).
Sector Breadth (Visual):
Logic: Tracks 10 sector ETFs (XLK, XLF, XLE, etc.) vs. their SMAs (same lengths as SPX). Each sector scores +1 (bullish), -1 (bearish), or 0 (neutral), summed as breadth (-10 to +10).
Display: Green background if breadth > 4, red if breadth < -4, else neutral. Dashboard shows sector trends (↑/↓/-).
Impact: Faster SMA lengths make breadth more responsive, reflecting sector rotations (e.g., tech surging, energy lagging).
Why It’s Brilliant:
- VIX filter adds pro-level volatility awareness, saving beginners from panic-driven losses.
- SPX and sector breadth give a 360° view of market health, boosting signal confidence (e.g., green BG + buy signal = high-probability trade).
- Shorter SMAs make sentiment visuals react faster, perfect for 5min charts.
3. Risk Management
The risk controls are a fortress, now tighter and more dynamic to support frequent trading while keeping accounts safe.
Preset-Based Risk:
Aggressive: Fast EMAs (5/12), tight stops (1.1x ATR), 1-bar cooldown. High trade frequency, higher risk.
Balanced: EMAs (7/14), 1.2x ATR stops, 1-bar cooldown. Versatile for most traders.
Conservative: EMAs (9/18), 1.3x ATR stops, 2-bar cooldown. Safer, fewer trades.
Impact: Auto-scales risk to match style, making it foolproof for beginners.
Adaptive Stops and Take-Profits:
Logic: Stops = entry ± ATR * atr_mult (1.1–1.3x, down from 1.2–2.0x). Take-profits = entry ± ATR * take_mult (2x stop distance, 2:1 reward/risk). Longs: stop below entry, TP above; shorts: vice versa.
Impact: Tighter stops increase trade turnover while maintaining solid risk/reward, adapting to volatility.
Trade Cooldown:
Logic: Preset-driven (Aggressive/Balanced: 1 bar, Conservative: 2 bars vs. old user-input 2). Ensures bar_index - last_trade_bar >= cooldown.
Impact: Faster cooldowns (especially Aggressive/Balanced) allow more trades, balanced by VIX and strength filters.
Contract Sizing:
Logic: User sets contracts (default: 1, max: 10), no preset cap (unlike old 7/5/3 suggestion).
Impact: Flexible but risks over-leverage; beginners should stick to low contracts.
Built To Be Reliable and Consistent:
- Tighter stops and faster cooldowns make it a high-octane system without blowing up accounts.
- Preset-driven risk removes guesswork, letting newbies trade confidently.
- 2:1 TPs ensure profitable trades outweigh losses, even in volatile sessions like April 27, 2025 ES slippage.
4. Trade Entry and Exit Logic
The entry/exit rules are simple yet razor-sharp, now with VIX filtering and faster signals:
Entry Conditions:
Long Entry: buy_signal (fast EMA crosses above slow EMA, trend_dir = 1), no position (strategy.position_size = 0), cooldown passed (can_trade), and VIX < 20 (can_long). Enters with user-defined contracts.
Short Entry: sell_signal (fast EMA crosses below slow EMA, trend_dir = -1), no position, cooldown passed, can_short (always true).
Logic: Tracks last_entry_bar for visuals, last_trade_bar for cooldowns.
Exit Conditions:
Stop-Loss/Take-Profit: ATR-based stops (1.1–1.3x) and TPs (2x stop distance). Longs exit if price hits stop (below) or TP (above); shorts vice versa.
No Other Exits: Keeps it straightforward, relying on stops/TPs.
5. DAFE Visuals
The visuals are pure DAFE magic, blending clean function with informative metrics utilized by professionals, now enhanced by faster signals and a responsive breadth background:
EMA Plots:
Display: Fast EMA (blue, 2px), slow EMA (orange, 2px), using faster lengths (5–9/12–18).
Purpose: Highlights momentum shifts, with crossovers signaling entries.
Sector Breadth Background:
Display: Green (90% transparent) if breadth > 4, red (90%) if breadth < -4, else neutral.
Purpose: Faster breadth_sma_len (5–12 vs. 10–50) reflects sector shifts in real-time, reinforcing signal strength.
- Visuals are intuitive, turning complex signals into clear buy/sell cues.
- Faster breadth background reacts to market rotations (e.g., tech vs. energy), giving a pro-level edge.
6. Sector Breadth Dashboard
The new bottom-left dashboard is a game-changer, a 3x16 table (black/gray theme) that’s your market command center:
Metrics:
VIX: Current VIX (red if > 20, gray if not).
SPX: Trend as “UP” (green), “DOWN” (red), or “FLAT” (gray).
Trade Longs: “OK” (green) if VIX < 20, “BLOCK” (red) if not.
Sector Breadth: 10 sectors (Tech, Financial, etc.) with trend arrows (↑ green, ↓ red, - gray).
Placeholder Row: Empty for future metrics (e.g., ATR, breadth score).
Purpose: Consolidates regime, volatility, market trend, and sector data, making decisions a breeze.
- VIX and SPX metrics add context, helping beginners avoid bad trades (e.g., no longs if “BLOCK”).
Sector arrows show market health at a glance, like a cheat code for sentiment.
Key Features
Beginner-Ready: Preset modes and clear visuals make futures trading a breeze.
Sentiment-Driven: VIX filter, SPX trend, and sector breadth keep you in sync with the market.
High-Frequency: Faster EMAs, tighter stops, and short cooldowns boost trade volume.
Safe and Smart: Adaptive stops/TPs and cooldowns protect capital while maximizing wins.
Visual Mastery: DAFE’s clean flair, EMAs, dashboard—makes trading fun and clear.
Backtestable: Lean code and fixed qty ensure accurate historical testing.
How to Use
Add to Chart: Load on a 5min MNQ/ES chart in TradingView.
Pick Preset: Aggressive (scalping), Balanced (versatile), or Conservative (safe). Balanced is default.
Set Contracts: Default 1, max 10. Stick low for safety.
Check Dashboard: Bottom-left shows preset, VIX, SPX, and sectors. “OK” + green breadth = strong buy.
Backtest: Run in strategy tester to compare modes.
Live Trade: Connect to Tradovate or similar. Watch for slippage (e.g., April 27, 2025 ES issues).
Replay Test: Try April 28, 2025 NQ drop to see VIX filter and stops in action.
Why It’s Brilliant
The Dskyz (DAFE) Quantum Sentiment Flux - Beginners is a masterpiece of simplicity and power. It takes pro-level tools—momentum, VIX, sector breadth—and wraps them in a system anyone can run. Faster signals and tighter stops make it a trading machine, while the VIX filter and dashboard keep you ahead of market chaos. The DAFE visuals and bottom-left command center turn your chart into a futuristic cockpit, guiding you through every trade. For beginners, it’s a safe entry to futures; for pros, it’s a scalping beast with sentiment smarts. This strat doesn’t just trade—it transforms how you see the market.
Final Notes
This is more than a strategy—it’s your launchpad to mastering futures with Dskyz (DAFE) flair. The Quantum Sentiment Flux blends accessibility, speed, and market savvy to help you outsmart the game. Load it, watch those triangles glow, and let’s make the markets your canvas!
Official Statement from Pine Script Team
(see TradingView help docs and forums):
"This warning may appear when you call functions such as ta.sma inside a request.security in a loop. There is no runtime impact. If you need to loop through a dynamic list of tickers, this cannot be avoided in the present version... Values will still be correct. Ignore this warning in such contexts."
(This publishing will most likely be taken down do to some miscellaneous rule about properly displaying charting symbols, or whatever. Once I've identified what part of the publishing they want to pick on, I'll adjust and repost.)
Use it with discipline. Use it with clarity. Trade smarter.
**I will continue to release incredible strategies and indicators until I turn this into a brand or until someone offers me a contract.
Created by Dskyz, powered by DAFE Trading Systems. Trade fast, trade bold.

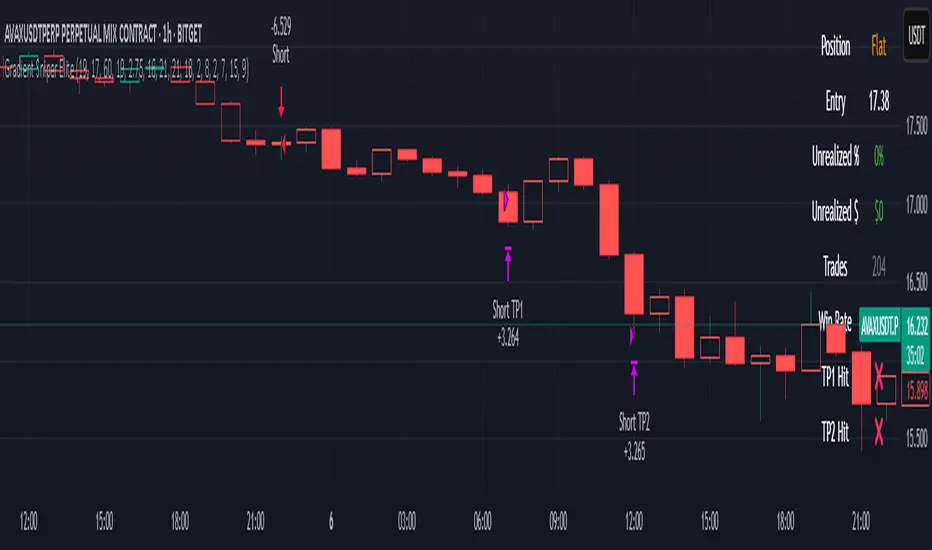
Gradient Sniper Elite🧠 Gradient Sniper Elite — Precision Trend Detection and Tactical Trade Execution for Crypto
Gradient Sniper Elite is a high-performance crypto trend strategy engineered for accuracy, adaptability, and smart execution on the 1-hour timeframe. This script is not just a mashup — it's a purpose-built system that combines trend, momentum, and volume filters in a structured and non-repainting framework designed for optimal entry and exit timing.
🔍 What Makes It Original?
This strategy combines several proven concepts into a unified, precision-calibrated trade engine:
✅ ZLEMA Gradient Filter: A slope-based trend filter that captures the direction and strength of momentum shifts without repainting.
✅ TEMA Confirmation: Triple EMA logic confirms trend acceleration or exhaustion by analyzing layered EMA cross-smoothing.
✅ RMI-Based Trend Direction: Replaces traditional RSI with a Relative Momentum Index (RMI), which smooths price momentum and avoids lag.
✅ ROC & Smoothed CCI: Dual momentum filters ensure that trades align with both velocity and structure of price moves.
✅ Volume Spike Filter: Filters out false breakouts and manipulation by confirming entries only during statistically significant volume surges.
✅ TP1/TP2 Split Take Profit Logic: 50% partial exit at TP1 and full exit at TP2. Ensures flexible profit-taking while maximizing trend continuation gains.
✅ Trend Weakness Exit: Trades are exited cleanly when the trend begins to weaken (as confirmed by RMI flip), preventing overstay and drawdown.
✅ 1-Bar Reversal Delay: The system enforces a 1-bar delay between a trade closure and any potential reversal entry, ensuring clean trend reversals and realistic live trading behavior.
✅ No Stop Loss: This strategy does not use a stop loss. Instead, it exits trades based on trend weakness or TP2 being hit. This avoids premature exits in volatile crypto environments, while maintaining controlled and dynamic trade management logic.
⚙️ How It Works
This strategy uses multi-layered confirmation:
Trend Structure
ZLEMA Gradient: Captures the slope of price action.
White Line + Fast/Slow Tether Lines: Define macro trend structure and act as dynamic S/R filters.
Momentum Alignment
Rate of Change (ROC): Measures directional velocity.
Smoothed CCI: Refines entry timing within the trend.
TEMA: Adds second-layer trend confirmation.
Volume Confirmation
Entry signals are validated by detecting relative volume spikes compared to a moving average baseline, avoiding entries on low-volume or fake breakouts.
Trade Management
Dynamic take-profits (TP1/TP2).
Immediate exit on trend weakening.
No same-bar entry/exit — reversal entries are delayed until after full exit confirmation.
No stop loss — trade management is handled via trend logic and take profit levels.
📊 Dashboard Overview
Gradient Sniper Elite includes a built-in dashboard in the top-right corner of the chart. It dynamically updates on each bar and shows:
📍 Position: Displays "Long", "Short", or "Flat" depending on the active trade
💰 Entry Price: The exact price where the trade was entered
📈 Unrealized %: Current profit/loss as a percentage
💵 Unrealized $: Estimated PnL in dollars, scaled to your backtest capital
📊 Trades / Win Rate: Live counter for total trades, win/loss count, and win rate
🎯 TP1 Hit / TP2 Hit: Shows ✅ or ❌ depending on whether each target level was reached during the current trade
This dashboard helps you monitor trade status, track live performance, and validate signal behavior in real time — all without repainting or relying on external tools.
📈 How to Use
Timeframe: Optimized for the 1-hour timeframe, but adaptable.
Asset Class: Primarily built for crypto markets, especially fast-moving alts like AVAX, LINK, QNT, etc.
Trade Mode: Supports long and short trades with clean reversal logic.
Dashboard: Live stats including position status, TP1/TP2 hit, win rate, and real-time PnL tracking.
Backtest Ready: Built with full compliance to TradingView backtest engine — results are realistic and match live-bar behavior.
⚠️ No Repainting — No Guesswork
Every element in this script is designed to work with confirmed bar data only. There is zero forward-looking logic. This makes Gradient Sniper Elite fully compatible with both backtesting and live algo execution.
🧩 Why This Isn’t Just a Mashup
Each indicator in this strategy has a specific role:
ZLEMA: Core trend slope engine.
TEMA: Trend reinforcement.
RMI: Directional decision layer.
CCI & ROC: Entry timing refinement.
Volume Filter: Risk filtering.
They’re not merged randomly, but combined in sequence to eliminate noise and optimize entries.
📌 Disclaimer
This script is for informational and educational purposes only. It does not constitute financial advice or a recommendation to buy or sell any asset. Always do your own research and use appropriate risk management when trading. Past performance does not guarantee future results.
Trade Entry Detector, Wick to Body Ratio Trade Entry Detector: Wick-to-Body Ratio Strategy with Bollinger Bands
Overview
The Trade Entry Detector is a custom strategy for TradingView that leverages the Bollinger Bands and a unique wick-to-body ratio approach to capture precise entry opportunities. This indicator is designed for traders who want to pinpoint high-probability reversal points when price interacts with Bollinger Bands, all while offering flexible entry fill options.
The strategy performs primary analysis on the daily time frame, regardless of your current chart setting, allowing you to view daily Bollinger Band levels and entry signals even on lower time frames. This approach is suitable for swing traders and short-term traders looking to align intraday moves with higher time frame signals.
How the Strategy Works
1. Bollinger Band Analysis on the Daily Time Frame
Bollinger Bands are calculated using a 20-period simple moving average (SMA) and a standard deviation multiplier (default is 2). These bands dynamically expand and contract based on market volatility, making them ideal for identifying overbought and oversold conditions:
* Upper Band: Indicates potential overbought levels.
* Lower Band: Indicates potential oversold levels.
2. Wick-to-Body Ratio Condition
This strategy places significant emphasis on candle wicks relative to the candle body. Here’s why:
* A large upper wick relative to the body signals potential selling pressure after testing the upper Bollinger Band.
* A large lower wick relative to the body indicates buying support after testing the lower Bollinger Band.
* Ratio Threshold: You can set a minimum wick-to-body ratio (default is 1.0), meaning that the wick must be at least equal in size to the body. This ensures only candles with significant reversals are considered for entry.
3. Flexible Entry Timing
To adapt to various trading styles, the indicator allows you to choose the entry fill timing:
* Daily Close: Enter at the close of the daily candle.
* Daily Open: Enter at the open of the following daily candle.
* HOD (High of Day): Set entry at the daily high, for those who want confirmation of upward momentum.
* LOD (Low of Day): Set entry at the daily low, ideal for confirming downward movement.
4. Position Sizing and Risk Management
The strategy calculates position size based on a fixed risk percentage of your account balance (default is 1%). This approach dynamically adjusts position sizes based on stop-loss distance:
* Stop Loss: Placed at the nearest swing high (for shorts) or swing low (for longs).
* Take Profit: Exits are triggered when the price reaches the opposite Bollinger Band.
5. Order Expiration
Each pending order (long or short) expires after two days if unfilled, allowing for new setups on subsequent candles if conditions are met again.
Using the Trade Entry Detector
Step-by-Step Guide
1. Set the Primary Time Frame
The core calculations run on the daily time frame, but the strategy can be applied to intraday charts (e.g., 65-minute or 15-minute) for deeper insights.
2. Adjust Bollinger Band Settings
* Length: Default is 20, which determines the period for calculating the moving average.
* Standard Deviation Multiplier: Default is 2.0, which sets the width of the bands. Adjusting this can help you capture broader or tighter volatility ranges.
3. Define the Wick-to-Body Ratio
Set the minimum ratio between wick and body (default 1.0). Higher values filter out candles with less wick-to-body contrast, focusing on stronger rejection moves.
4. Choose Entry Fill Timing
Select your preferred fill condition:
* Daily Close: Confirms the trade at the end of the daily session.
* Daily Open: Executes the entry at the open of the next day.
* HOD/LOD: Uses the daily high or low as an additional confirmation for upward or downward moves.
5. Position Sizing and Risk Management
* Set your account balance and risk percentage. The strategy automatically calculates position sizes based on the stop distance to manage risk efficiently.
* Stop Loss and Take Profit points are automatically set based on swing highs/lows and opposing Bollinger Bands, respectively.
Practical Example
Let’s say SPY (S&P 500 ETF) tests the lower Bollinger Band on the daily time frame, with a lower wick that is twice the size of the body (meeting the 1.0 ratio threshold). Here’s how the strategy might proceed:
1. Signal: The lower wick on SPY suggests buying interest at the lower Bollinger Band.
2. Entry Fill Timing: If you’ve selected "Daily Open," the entry order will be placed at the next day's open price.
3. Stop Loss: Positioned at the nearest daily swing low to minimize risk.
4. Take Profit: If SPY price moves up and reaches the upper Bollinger Band, the position is automatically closed.
Indicator Features and Benefits
* Multi-Time Frame Compatibility: Perform daily analysis while tracking signals on any intraday chart.
* Automatic Position Sizing: Tailor risk per trade based on account balance and desired risk percentage.
* Flexible Entry Options: Choose from close, open, HOD, or LOD for optimal timing.
* Effective Trend Reversal Identification: Uses wick-to-body ratio and Bollinger Band interaction to pinpoint potential reversals.
* Dynamic Visualization: Bollinger Bands are displayed on your chosen time frame, allowing seamless intraday tracking.
Summary
The Trade Entry Detector provides a unique, data-driven way to spot reversal points with customizable entry options. By combining Bollinger Bands with wick-to-body ratio conditions, it identifies potential trade setups where price has tested extremes and shown reversal signals. With its flexible entry timing, risk management features, and multi-time frame compatibility, this indicator is ideal for traders looking to blend daily market context with shorter-term execution.
Tips for Usage:
* For swing trading, consider the Daily Open or Close entry options.
* For momentum entries, HOD or LOD may offer better alignment with the direction of the wick.
* Backtest on different assets to find optimal Bollinger Band and wick-to-body settings for your market.
Use this indicator to enhance your understanding of price behavior at key levels and improve the precision of your entry points. Happy trading!

[astropark] Trend Skywalker V2 [strategy]Dear Followers,
today I'm glad to present you Trend Skywalker V2 , the evolution of Trend Skywalker V1 indicator that you can see here below:
This indicator works on every timeframe and market, it's quite responsive to market movements, so it's especially good on volatile markets.
In this new version you have 3 trend clouds available :
a short-term one (yellow)
a mid-term one (green)
a long-term one (blue)
You can also enable an option to show all trend clouds as one, the result will be similar to a special bollinger bands tool.
Of course you can edit trend clouds analysis period and color, also you can turn on or off the cloud that you prefer.
The indicator can run 4 different kinds of strategy : one for each trend cloud individually or a mixed one.
Also the indicator tracks for you a peak profit from entry: this tracker is a suggestion for you to take profits while price goes up!
All red-green circles you see in the chart is a reminder that a peak profit label was there in the past: what does this tell you?
if price starts losing the short-term trend and you had a lot of TP suggestions, maybe trend ended and you should start consider closing your trade before you give back all your profit.
On backtesting you can you test long and short setups individually or both, as well as performance in a specific time window.
This is a premium indicator , so send me a private message in order to get access to this script.

Self-Optimising MACD (Experimental)Hi guys, just thought I'd share a small part of an idea i've been working on.
One of the biggest problems with algo trading is optimisation and finding a way to constantly adapt to the market conditions as time unfolds.
First of all... You should NEVER EVER trade just using a MACD, including this study, and I only produced this script in a small amount of time, so make sure you backtest it properly before using it. When backtesting, it is my advice that your sample size should be at least 5000 trades, but I recommend 10000 in order to get sufficient statistical significance.
Also, I am not a financial advisor, and any trading based decisions are your sole responsibility.
Anyways...
This script is simple... it simply uses 4 different MACD's and tracks their profit/loss and automatically uses the one with the most historical profit at any given time to execute a trade. The type of MACD will obviously change as market states fluctuate.
Included are : Hull MACD, Ema MACD, Sma MACD and VWMA Macd.
You can adjust all four of their settings to your desire.
The trade execution is simple and definitely flawed... it simply tracks the MACD when it has a crossover for long, and then the opposite for short.
The green line represents the performance of the top MACD for Longs at any given time. This line refreshes once a year, and where it is in relation to price, reflects how profitable it has been I.e - the higher it is the better.
The Red line represents the performance on the Short side, and again, it reflects profit/loss, but this time the LOWER the line is in relation to price the better.
There is no exit strategy in place! This is why I do NOT recommend trading off this script alone, but to use it as a tool to help optimise your choice of MACD.
However, your exit strategy could change your optimal choice of MACD, so keep that in mind.
The lookback period represents how far the script will track the performance at any given time. This will change your results. The longer the period, the more it will show long term success and vice versa.
This optimisation process could be done with different indicators, moving averages, or even multiple strategies to find the most statistically viable option at any given time... if you wish to have this process coded into your strategies or indicators, message me.
Enjoy.

Tactical FlowTactical Flow – Altcoin Swing Strategy with Trend Logic & Dynamic TP System
(Built for 1H timeframe altcoin trading)
🎯 Purpose
Tactical Flow is a swing trading strategy purpose-built for altcoins on the 1-hour timeframe. It targets clean trend continuation setups by combining non-repainting filters for direction, momentum, and volume with a real-time execution engine that strictly avoids same-bar reversals. It includes a dynamic take-profit system with real-time trade tracking and an integrated visual dashboard.
⚙️ Strategy Core Components
Each module was chosen for precision, trend clarity, and altcoin-specific price behavior.
🔹 1. White Line Bias
Defines market structure using the midpoint of recent high/low range.
→ Keeps you trading with the dominant structure.
🔹 2. Tether Trend Engine
Two mid-range bands (Fast & Slow Tether) act like a dynamic trend cloud.
→ Ensures trend direction is confirmed with structural layering.
🔹 3. ZLEMA Gradient Filter
A Zero Lag EMA of price that’s compared to its previous value for momentum slope.
→ Confirms the trend has actual energy behind it.
🔹 4. TEMA Micro-Flow
A smoothed directional signal to confirm price is accelerating, not just trending.
→ Filters out late or fading entries.
🔹 5. Volume Spike Filter
Confirms that breakouts are real by requiring volume > 1.5× median of previous candles.
→ Designed for altcoins to avoid fakeouts during random volatility.
🔹 6. RMI Trend Memory
Keeps track of the trend state over time, allowing for smoother transitions and fewer whipsaws.
→ Helps the strategy stay in trend longer and only reverse when confirmation is strong.
🔹 7. Reversal Cooldown Logic
Exits a trade, then waits 1 full bar before taking a reversal entry.
→ Avoids common backtest false positives where entries and exits occur on the same candle.
💸 Trade Management – TP1/TP2 Logic
TP1 = 50% closed when price hits target 1
TP2 = full exit
Exits early if trend weakens
Supports dynamic reentry after TP2 if trend resumes
→ Keeps risk controlled while allowing position scaling in volatile altcoin swings.
📊 Strategy Dashboard
Visual interface shows:
Current Position (Long / Short / Flat)
Entry Price
TP1 and TP2 hit status
Bars since entry
Real-time Win Rate
Profit Factor
🧪 Backtesting & Execution Compliance
✅ Fully non-repainting
✅ Compatible with TradingView's deep backtesting
✅ Uses strategy.exit with limit logic for accurate TP tracking
✅ No stop-loss — closes trades on trend weakening only
🔥 Best Use Case
Altcoin swing trades on 1H chart
Works well during trending periods with volume
Not designed for choppy or sideways conditions
Pairs well with watchlist scanners and heatmaps

FlexiSuperTrend - Strategy [presentTrading]█ Introduction and How it is Different
The "FlexiSuperTrend - Strategy" by PresentTrading is a cutting-edge trading strategy that redefines market analysis through the integration of the SuperTrend indicator and advanced variance tracking.
BTC 6H L/S
This strategy stands apart from conventional methods by its dynamic adaptability, capturing market trends and momentum shifts with increased sensitivity. It's designed for traders seeking a more responsive tool to navigate complex market movements.
Local
█ Strategy, How It Works: Detailed Explanation
The "FlexiSuperTrend - Strategy" employs a multifaceted approach, combining the adaptability of the SuperTrend indicator with variance tracking. The strategy's core lies in its unique formulation and application of these components:
🔶 SuperTrend Polyfactor Oscillator:
- Basic Concept: The oscillator is a series of SuperTrend calculations with varying ATR lengths and multipliers. This approach provides a broader and more nuanced perspective of market trends.
- Calculation:
- For each iteration, `i`, the SuperTrend is calculated using:
- `ATR Length = indicatorLength * (startingFactor + i * incrementFactor)`.
- `Multiplier = dynamically adjusted based on market conditions`.
- The SuperTrend output for each iteration is compared with the indicator source (like hlc3), and the deviation is recorded.
SuperTrend Calculation:
- `Upper Band (UB) = hl2 + (ATR Length * Multiplier)`
- `Lower Band (LB) = hl2 - (ATR Length * Multiplier)`
- Where `hl2` is the average of high and low prices.
Deviation Calculation:
- `Deviation = indicatorSource - SuperTrend Value`
- This value is calculated for each SuperTrend setting in the oscillator series.
🔶 Indicator Source (`hlc3`):
- **Usage:** The strategy uses the average of high, low, and close prices, providing a balanced representation of market activity.
🔶 Adaptive ATR Lengths and Factors:
- Dynamic Adjustment: The strategy adjusts the ATR length and multiplier based on the `startingFactor` and `incrementFactor`. This adaptability is key in responding to changing market volatilities.
- Equation: ATR Length at each iteration `i` is given by `len = indicatorLength * (startingFactor + i * incrementFactor)`.
incrementFactor - 1
incrementFactor - 2
🔶 Normalization Methods:
Purpose: To standardize the deviations for comparability.
- Methods:
- 'Max-Min': Scales the deviation based on the range of values.
- 'Absolute Sum': Uses the sum of absolute deviations for normalization.
Normalization 'Absolute Sum'
- For 'Max-Min': `Normalized Deviation = (Deviation - Min(Deviations)) / (Max(Deviations) - Min(Deviations))`
- For 'Absolute Sum': `Normalized Deviation = Deviation / Sum(Absolute(Deviations))`
🔶 Trading Logic:
The strategy integrates the SuperTrend indicator, renowned for its effectiveness in identifying trend direction and reversals. The SuperTrend's incorporation enhances the strategy's ability to filter out false signals and confirm genuine market trends. * The SuperTrend Toolkit is made by @QuantiLuxe
- Long Entry Conditions: A buy signal is generated when the current trend, as indicated by the SuperTrend Polyfactor Oscillator, turns positive.
- Short Entry Conditions: A sell signal is triggered when the current trend turns negative.
- Entry and Exit Strategy: The strategy opens or closes positions based on these signals, aligning with the selected trade direction (long, short, or both).
█ Trade Direction
The strategy is versatile, allowing traders to choose their preferred trading direction: long, short, or both. This flexibility enables traders to tailor their strategies to their market outlook and risk appetite.
█ Usage
The FlexiSuperTrend strategy is suitable for various market conditions and can be adapted to different asset classes and time frames. Traders should set the strategy parameters according to their risk tolerance and trading goals. It's particularly useful for capturing long-term movements, ideal for swing traders, yet adaptable for short-term trading strategies.
█ Default Settings
1. Trading Direction: Choose from "Long", "Short", or "Both" to define the trade type.
2. Indicator Source (HLC3): Utilizes the HLC3 as the primary price reference.
3. Indicator Length (Default: 10): Influences the moving average calculation and trend sensitivity.
4. Starting Factor (0.618): Initiates the ATR length, influenced by Fibonacci ratios.
5. Increment Factor (0.382): Adjusts the ATR length incrementally for dynamic trend tracking.
6. Normalization Method: Options include "None", "Max-Min", and "Absolute Sum" for scaling deviations.
7. SuperTrend Settings: Varied ATR lengths and multipliers tailor the indicator's responsiveness.
8. Additional Settings: Features mesh style plotting and customizable colors for visual distinction.
The default settings provide a balanced approach, but users are encouraged to adjust them based on their individual trading style and market analysis.

Big Whale Purchases and SalesBig Whale Purchases and Sales - plots big whale transactions on your chart!
People that hold more than 1% of a crypto currencies circulating supply are considered whales and have a huge influence on price, not just because they can move the market with their huge transactions, but also because other traders often track their wallets and follow their example. Taking a look at whale holdings, one can see why whale worship is so common in crypto: While Bitcoin has a relatively low whale concentration, many of the Top 100 Cryptocurrencies have whales control 60% or more of their circulating supply.
Integrating IntoTheBlock data, this script plots the transactions of these whales and, in strategy mode, copy trades them.
Features:
Strategy Mode: Switches the script between an indicator and a strategy.
Standard Deviations: The number of Standard Deviations that a transaction needs to surpass to be considered worth plotting. Setting this to 0 will show all whale transactions, higher settings will only show the biggest transactions.
Blockchain: The Chain on which Whale activity is tracked.

[astropark] DMI/ADX strategy [strategy]Dear Followers,
today I'm happy to share with you my DMI / ADX Strategy .
It provides directional trend information, so if a bullish or a bearish trend is going to start. Statistically it works better on lower timeframes (from 5 minutes to 1 hour).
It is both a Swing and Scalping Strategy indicator , based on a simple trend following theory , good for trading FOREX, Indexes, Stocks, Commodities and Cryptocurrencies.
To help in Taking Profits, the strategy integrates 2 special other than bull/bear signals:
Overbought and Oversold RSI Signals , which appear both as darker background (the darker the color, the more the price is in overbought/oversold) and green "ob"-"tp" / red "os"-"tp" labels (they optionally pop up only on a configurable stronger overbought/oversold condition) (you can enable/disable it optionally)
Peak Profit Tracker , which resets every time a new trade starts and keeps track of price fluctuation during the trade: the message is don't be too greedy and take profits or lock them with a stoploss in profit (you can enable/disable it optionally)
You can edit many options in order to
have more/less bull/bear signals
enable/disable showing bull/bear signals
enable/disable showing RSI TP signals (you can edit RSI length, overbought (OB) and oversold (OS) levels)
enable/disable showing peak profits on each trade
The user who wants to use this strategy, especially via an automated bot, must always set a stoploss (example 150$ from entry on bitcoin ) or use a proper risk management strategy .
This is not the "Holy Grail", so use it with caution. It's highly suggested to use a proper money management .
This script will let you backtest performance of the indicator based on bear/bull signals.
You can find the alarms version by searching for my DMI / ADX Strategy and choosing the "alarms" named.
Here there are some examples how this DMI / ADX strategy works on many markets:
LTC/USDT 15m
BTC/USD 15m
BNB/BTC 15m
ETH/USD 15m
GOLD (XAU/USD) 15m
GOLD (XAU/USD) 1h
FB 15m
AAPL 15m
TSLA 1h
BANKNIFTY Index 5m
NIFTY 50 Index 5m
This is a premium indicator , so send me a private message in order to get access to this script .

BEST Engulfing + Breakout StrategyHello traders
This is a simple algorithm for a Tradingview strategy tracking a convergence of 2 unrelated indicators.
Convergence is the solution to my trading problems.
It's a puzzle with infinite possibilities and only a few working combinations.
Here's one that I like
- Engulfing pattern
- Price vs Moving average for detecting a breakout
Definition
Take out the notebooks :) and some coffee (good for focus). I'm bullish in coffee
The engulfing pattern is a two-candle reversal pattern.
The second candle completely ‘engulfs’ the real body of the first one, without regard to the length of the tail shadows.
The bullish Engulfing pattern appears in a downtrend and is a combination of one red candle followed by a larger green candle
The bearish Engulfing pattern appears in a downtrend and is a combination of one green candle followed by a larger red candle
Example: imgur.com
We're bored sir... what's the point of all this?
In summary, an engulfing is a pattern to track reversals. (the whole TradingView audience stands up now giving a standing ovation)
Adding the Price vs Moving average filters allows to track reversals with momentums (half of the audience collapsed because this is too awesome)
Ok sir... you picked up my interest
I included some cool backtest filters:
- date range filtering
- flexible take profit in USD value (plotted in blue)
- flexible stop loss in USD value (plotted in red)
All the best
Dave

AI ALGO [Ganesh]Core Strategy Components\
1. EMA (Exponential Moving Average) SystemThe strategy uses three EMAs to identify trend direction:
EMA 48 (longer-term trend)
EMA 2 (short-term momentum)
EMA 21 (medium-term trend)
How it works:
Bullish trend: When price is above EMA 21 (green cloud)
Bearish trend: When price is below EMA 21 (red cloud)
EMA Cloud: The area between EMA 2 and EMA 48/21 provides visual trend confirmation
Optional higher timeframe (HTF) analysis for multi-timeframe confirmation
2. DEMA ATR (Double EMA + Average True Range)
This is a dynamic support/resistance indicator that adapts to volatility:Components:
DEMA (Double Exponential Moving Average): Smooths price action with less lag
ATR Bands: Creates upper and lower bands based on volatility (ATR × 1.7 factor)
Signal Generation:
Green line: Uptrend (DEMA ATR rising)
Red line: Downtrend (DEMA ATR falling)
Acts as a trailing stop-loss level that adjusts with market volatility
3. Smart Trail System (Fibonacci-Based)
An advanced trailing stop system using modified true range calculations:Key Features:
Calculates true range using Wilder's smoothing method
Creates Fibonacci retracement levels (61.8%, 78.6%, 88.6%) from the trail line
Adaptive stop-loss: Adjusts based on ATR factor (4.2) and smoothing (4)
Trend Detection:
Bullish: Price > Trailing line (blue zones)
Bearish: Price < Trailing line (red zones)
The Fibonacci zones show potential support/resistance areas
4. ZigZag Indicator Identifies significant swing highs and lows:
Length parameter: 13 (sensitivity control)
Labels: Higher Highs (HH), Lower Lows (LL), etc.
Helps identify trend reversals and key pivot points
5. Support & Resistance Levels
Strength-based S/R: Identifies horizontal support/resistance zones
Zone width: Adjustable percentage-based zones
High/Low zones: Marks significant price levels
Trading LogicEntry Conditions (Implied)The strategy likely enters trades when:Long Entry:
Price crosses above DEMA ATR (green)
Price is above EMA 21 (bullish EMA cloud)
Smart Trail confirms uptrend
Price bounces from Fibonacci support levels
Short Entry:
Price crosses below DEMA ATR (red)
Price is below EMA 21 (bearish EMA cloud)
Smart Trail confirms downtrend
Price rejects from Fibonacci resistance levels
Exit/Stop-Loss Strategy
Trailing stops: Using Smart Trail Fibonacci levels
Dynamic stops: DEMA ATR line acts as a moving stop-loss
Risk management: Position sizing at 50% of equity per trade
Dashboard Features1. Weekly Performance Table
Tracks trades per day of the week
Shows win/loss statistics
Calculates win rate percentage
2. Monthly Performance Table
Monthly P&L breakdown
Yearly performance summary
Color-coded returns (green = profit, red = loss)
Strategy Parameters
Initial Capital: $5,000
Commission: 0.02% per trade
Position Size: 50% of equity
Pyramiding: Disabled (no adding to positions)
Calculation: On bar close (not tick-by-tick)
Visual Elements
EMA clouds: Green (bullish) / Red (bearish)
DEMA ATR line: Dynamic support/resistance
Smart Trail zones: Fibonacci-based colored bands
ZigZag lines: Swing high/low connections
S/R zones: Horizontal support/resistance areas
Strategy Philosophy
This is a trend-following strategy with dynamic risk management that:
Uses multiple timeframes for confirmation
Adapts to volatility through ATR-based indicators
Provides clear visual cues for trend direction
Includes comprehensive performance tracking
Combines momentum (EMAs) with volatility (ATR) for robust signals
The strategy works best in trending markets and uses the Fibonacci trail system to maximize profits while protecting against reversals with adaptive stop-losses.

Hyper Insight MA Strategy [Universal]Hyper Insight MA Strategy ** is a comprehensive trend-following engine designed for traders who require precision and flexibility. Unlike standard indicators that lock you into a single calculation method, this strategy serves as a "Universal Adapter," allowing you to **Mix & Match 13 different Moving Average types** for both the Fast and Slow trend lines independently.
Whether you need the smoothness of T3, the responsiveness of HMA, or the classic reliability of SMA, this script enables you to backtest thousands of combinations to find the perfect edge for your specific asset class.
---
🔬 Deep Dive: Calculation Logic of Included MAs
This strategy includes 13 distinct calculation methods. Understanding the math behind them will help you choose the right tool for your specific market conditions.
#### 1. Standard Averages
* **SMA (Simple Moving Average):** The unweighted mean of the previous $n$ data points.
* *Logic:* Treats every price point in the period with equal importance. Good for identifying long-term macro trends but reacts slowly to recent volatility.
* **WMA (Weighted Moving Average):** A linear weighted average.
* *Logic:* Assigns heavier weight to current data linearly (e.g., $1, 2, 3... n$). It reacts faster than SMA but is still relatively smooth.
* **SWMA (Symmetrically Weighted Moving Average):**
* *Logic:* Uses a fixed-length window (usually 4 bars) with symmetrical weights $ $. It prioritizes the center of the recent data window.
#### 2. Exponential & Lag-Reducing Averages
* **EMA (Exponential Moving Average):**
* *Logic:* Applies an exponential decay weighting factor. Recent prices have significantly more impact on the average than older prices, reducing lag compared to SMA.
* **RMA (Running Moving Average):** Also known as Wilder's Smoothing (used in RSI).
* *Logic:* It is essentially an EMA but with a slower alpha weight of $1/length$. It provides a very smooth, stable line that filters out noise effectively.
* **DEMA (Double Exponential Moving Average):**
* *Logic:* Calculated as $2 \times EMA - EMA(EMA)$. By subtracting the "lag" (the smoothed EMA) from the original EMA, DEMA provides a much faster reaction to price changes with less noise than a standard EMA.
* **TEMA (Triple Exponential Moving Average):**
* *Logic:* Calculated as $3 \times EMA - 3 \times EMA(EMA) + EMA(EMA(EMA))$. This effectively eliminates the lag inherent in single and double EMAs, making it an extremely fast-tracking indicator for scalping.
#### 3. Advanced & Adaptive Averages
* **HMA (Hull Moving Average):**
* *Logic:* A composite formula involving Weighted Moving Averages: ASX:WMA (2 \times Integer(n/2)) - WMA(n)$. The result is then smoothed by a $\sqrt{n}$ WMA.
* *Effect:* It eliminates lag almost entirely while managing to improve curve smoothness, solving the traditional trade-off between speed and noise.
* **ZLEMA (Zero Lag Exponential Moving Average):**
* *Logic:* This calculation attempts to remove lag by modifying the data source before smoothing. It calculates a "lag" value $(length-1)/2$ and applies an EMA to the data: $Source + (Source - Source )$. This creates a projection effect that tracks price tightly.
* **T3 (Tillson T3 Moving Average):**
* *Logic:* A complex smoothing technique that runs an EMA through a filter multiple times using a "Volume Factor" (set to 0.7 in this script).
* *Effect:* It produces a curve that is incredibly smooth and free of "overshoot," making it excellent for filtering out market chop.
* **ALMA (Arnaud Legoux Moving Average):**
* *Logic:* Uses a Gaussian distribution (bell curve) to assign weights. It allows the user to offset the moving average (moving the peak of the weight) to align it perfectly with the price, balancing smoothness and responsiveness.
* **LSMA (Least Squares Moving Average):**
* *Logic:* Calculates the endpoint of a Linear Regression line for the lookback period. It essentially guesses where the price "should" be based on the best-fit line of the recent trend.
* **VWMA (Volume Weighted Moving Average):**
* *Logic:* Weights the closing price by the volume of that bar.
* *Effect:* Prices on high volume days pull the MA harder than prices on low volume days. This is excellent for validating true trend strength (i.e., a breakout on high volume will move the VWMA significantly).
---
### 🛠 Features & Settings
* **Universal Switching:** Change the `Fast MA` and `Slow MA` types instantly via the settings menu.
* **Trend Cloud:** A dynamic background fill (Green/Red) highlights the crossover zone for immediate visual trend identification.
* **Strategy Mode:** Built-in Backtesting logic triggers `LONG` entries when Fast MA crosses over Slow MA, and `EXIT` when Fast MA crosses under.
### ⚠️ Disclaimer
This script is intended for educational and research purposes. The wide variety of MA combinations can produce vastly different results. Past performance is not indicative of future results. Please use proper risk management.

Superior-Range Bound Renko - Strategy - 11-29-25 - SignalLynxSuperior-Range Bound Renko Strategy with Advanced Risk Management Template
Signal Lynx | Free Scripts supporting Automation for the Night-Shift Nation 🌙
1. Overview
Welcome to Superior-Range Bound Renko (RBR) — a volatility-aware, structure-respecting swing-trading system built on top of a full Risk Management (RM) Template from Signal Lynx.
Instead of relying on static lookbacks (like “14-period RSI”) or plain MA crosses, Superior RBR:
Adapts its range definition to market volatility in real time
Emulates Renko Bricks on a standard, time-based chart (no Renko chart type required)
Uses a stack of Laguerre Filters to detect genuine impulse vs. noise
Adds an Adaptive SuperTrend powered by a small k-means-style clustering routine on volatility
Under the hood, this script also includes the full Signal Lynx Risk Management Engine:
A state machine that separates “Signal” from “Execution”
Layered exit tools: Stop Loss, Trailing Stop, Staged Take Profit, Advanced Adaptive Trailing Stop (AATS), and an RSI-style stop (RSIS)
Designed for non-repainting behavior on closed candles by basing execution-critical logic on previous-bar data
We are publishing this as an open-source template so traders and developers can leverage a professional-grade RM engine while integrating their own signal logic if they wish.
2. Quick Action Guide (TL;DR)
Best Timeframe:
4 Hours (H4) and above. This is a high-conviction swing-trading system, not a scalper.
Best Assets:
Volatile instruments that still respect market structure:
Bitcoin, Ethereum, Gold (XAUUSD), high-volatility Forex pairs (e.g., GBPJPY), indices with clean ranges.
Strategy Type:
Volatility-Adaptive Trend Following + Impulse Detection.
It hunts for genuine expansion out of ranges, not tiny mean-reversion nibbles.
Key Feature:
Renko Emulation on time-based candles.
We mathematically model Renko Bricks and overlay them on your standard chart to define:
“Equilibrium” zones (inside the brick structure)
“Breakout / impulse” zones (when price AND the impulse line depart from the bricks)
Repainting:
Designed to be non-repainting on closed candles.
All RM execution logic uses confirmed historical data (no future bars, no security() lookahead). Intrabar flicker during formation is allowed, but once a bar closes the engine’s decisions are stable.
Core Toggles & Filters:
Enable Longs and Shorts independently
Optional Weekend filter (block trades on Saturday/Sunday)
Per-module toggles: Stop Loss, Trailing Stop, Staged Take Profits, AATS, RSIS
3. Detailed Report: How It Works
A. The Strategy Logic: Superior RBR
Superior RBR builds its entry signal from multiple mathematical layers working together.
1) Adaptive Lookback (Volatility Normalization)
Instead of a fixed 100-bar or 200-bar range, the script:
Computes ATR-based volatility over a user-defined period.
Normalizes that volatility relative to its recent min/max.
Maps the normalized value into a dynamic lookback window between a minimum and maximum (e.g., 4 to 100 bars).
High Volatility:
The lookback shrinks, so the system reacts faster to explosive moves.
Low Volatility:
The lookback expands, so the system sees a “bigger picture” and filters out chop.
All the core “Range High/Low” and “Range Close High/Low” boundaries are built on top of this adaptive window.
2) Range Construction & Quick Ranges
The engine constructs several nested ranges:
Outer Range:
rangeHighFinal – dynamic highest high
rangeLowFinal – dynamic lowest low
Inner Close Range:
rangeCloseHighFinal – highest close
rangeCloseLowFinal – lowest close
Quick Ranges:
“Half-length” variants of those, used to detect more responsive changes in structure and volatility.
These ranges define:
The macro box price is trading inside
Shorter-term “pressure zones” where price is coiling before expansion
3) Renko Emulation (The Bricks)
Rather than using the Renko chart type (which discards time), this script emulates Renko behavior on your normal candles:
A “brick size” is defined either:
As a standard percentage move, or
As a volatility-driven (ATR) brick, optionally inhibited by a minimum standard size
The engine tracks a base value and derives:
brickUpper – top of the emulated brick
brickLower – bottom of the emulated brick
When price moves sufficiently beyond those levels, the brick “shifts”, and the directional memory (renkoDir) updates:
renkoDir = +2 when bricks are advancing upward
renkoDir = -2 when bricks are stepping downward
You can think of this as a synthetic Renko tape overlaid on time-based candles:
Inside the brick: equilibrium / consolidation
Breaking away from the brick: momentum / expansion
4) Impulse Tracking with Laguerre Filters
The script uses multiple Laguerre Filters to smooth price and brick-derived data without traditional lag.
Key filters include:
LagF_1 / LagF_W: Based on brick upper/lower baselines
LagF_Q: Based on HLCC4 (high + low + 2×close)/4
LagF_Y / LagF_P: Complex averages combining brick structures and range averages
LagF_V (Primary Impulse Line):
A smooth, high-level impulse line derived from a blend of the above plus the outer ranges
Conceptually:
When the impulse line pushes away from the brick structure and continues in one direction, an impulse move is underway.
When its direction flips and begins to roll over, the impulse is fading, hinting at mean reversion back into the range.
5) Fib-Based Structure & Swaps
The system also layers in Fib levels derived from the adaptive ranges:
Standard levels (12%, 23.6%, 38.2%, 50%, 61%, 76.8%, 88%) from the main range
A secondary “swap” set derived from close-range dynamics (fib12Swap, fib23Swap, etc.)
These Fibs are used to:
Bucket price into structural zones (below 12, between 23–38, etc.)
Detect breakouts when price and Laguerre move beyond key Fib thresholds
Drive zSwap logic (where a secondary Fib set becomes the active structure once certain conditions are met)
6) Adaptive SuperTrend with K-Means-Style Volatility Clustering
Under the hood, the script uses a small k-means-style clustering routine on ATR:
ATR is measured over a fixed period
The range of ATR values is split into Low, Medium, High volatility centroids
Current ATR is assigned to the nearest centroid (cluster)
From that, a SuperTrend variant (STK) is computed with dynamic sensitivity:
In quiet markets, SuperTrend can afford to be tighter
In wild markets, it widens appropriately to avoid constant whipsaw
This SuperTrend-based oscillator (LagF_K and its signals) is then combined with the brick and Laguerre stack to confirm valid trend regimes.
7) Final Baseline Signals (+2 / -2)
The “brain” of Superior RBR lives in the Baseline & Signal Generation block:
Two composite signals are built: B1 and B2:
They combine:
Fib breakouts
Renko direction (renkoDir)
Expansion direction (expansionQuickDir)
Multiple Laguerre alignments (LagF_Q, LagF_W, LagF_Y, LagF_Z, LagF_P, LagF_V)
They also factor in whether Fib structures are expanding or contracting.
A user toggle selects the “Baseline” signal:
finalSig = B2 (default) or B1 (alternate baseline)
finalSig is then filtered through the RM state machine and only when everything aligns, we emit:
+2 = Long / Buy signal
-2 = Short / Sell signal
0 = No new trade
Those +2 / -2 values are what feed the Risk Management Engine.
B. The Risk Management (RM) Engine
This script features the Signal Lynx Risk Management Engine, a proprietary state machine built to separate Signal from Execution.
Instead of firing orders directly on indicator conditions, we:
Convert the raw signal into a clean integer (Fin = +2 / -2 / 0)
Feed it into a Trade State Machine that understands:
Are we flat?
Are we in a long or short?
Are we in a closing sequence?
Should we permit re-entry now or wait?
Logic Injection / Template Concept:
The RM engine expects a simple integer:
+2 → Buy
-2 → Sell
Everything else (0) is “no new trade”
This makes the script a template:
You can remove the Superior RBR block
Drop in your own logic (RSI, MACD, price action, etc.)
As long as you output +2 or -2 into the same signal channel, the RM engine can drive all exits and state transitions.
Aggressive vs Conservative Modes:
The input AgressiveRM (Aggressive RM) governs how we interpret signals:
Conservative Mode (Aggressive RM = false):
Uses a more filtered internal signal (AF) to open trades
Effectively waits for a clean trend flip / confirmation before new entries
Minimizes whipsaw at the cost of fewer trades
Aggressive Mode (Aggressive RM = true):
Reacts directly to the fresh alert (AO) pulses
Allows faster re-entries in the same direction after RM-based exits
Still respects your pyramiding setting; this script ships with pyramiding = 0 by default, so it will not stack multiple positions unless you change that parameter in the strategy() call.
The state machine enforces discipline on top of your signal logic, reducing double-fires and signal spam.
C. Advanced Exit Protocols (Layered Defense)
The exit side is where this template really shines. Instead of a single “take profit or stop loss,” it uses multiple, cooperating layers.
1) Hard Stop Loss
A classic percentage-based Stop Loss (SL) relative to the entry price.
Acts as a final “catastrophic protection” layer for unexpected moves.
2) Standard Trailing Stop
A percentage-based Trailing Stop (TS) that:
Activates only after price has moved a certain percentage in your favor (tsActivation)
Then trails price by a configurable percentage (ts)
This is a straightforward, battle-tested trailing mechanism.
3) Staged Take Profits (Three Levels)
The script supports three staged Take Profit levels (TP1, TP2, TP3):
Each stage has:
Activation percentage (how far price must move in your favor)
Trailing amount for that stage
Position percentage to close
Example setup:
TP1:
Activate at +10%
Trailing 5%
Close 10% of the position
TP2:
Activate at +20%
Trailing 10%
Close another 10%
TP3:
Activate at +30%
Trailing 5%
Close the remaining 80% (“runner”)
You can tailor these quantities for partial scaling out vs. letting a core position ride.
4) Advanced Adaptive Trailing Stop (AATS)
AATS is a sophisticated volatility- and structure-aware stop:
Uses Hirashima Sugita style levels (HSRS) to model “floors” and “ceilings” of price:
Dungeon → Lower floors → Mid → Upper floors → Penthouse
These levels classify where current price sits within a long-term distribution.
Combines HSRS with Bollinger-style envelopes and EMAs to determine:
Is price extended far into the upper structure?
Is it compressed near the lower ranges?
From this, it computes an adaptive factor that controls how tight or loose the trailing level (aATS / bATS) should be:
High Volatility / Penthouse areas:
Stop loosens to avoid getting wicked out by inevitable spikes.
Low Volatility / compressed structure:
Stop tightens to lock in and protect profit.
AATS is designed to be the “smart last line” that responds to context instead of a single fixed percentage.
5) RSI-Style Stop (RSIS)
On top of AATS, the script includes a RSI-like regime filter:
A McGinley Dynamic mean of price plus ATR bands creates a dynamic channel.
Crosses above the top band and below the lower band change a directional state.
When enabled (UseRSIS):
RSIS can confirm or veto AATS closes:
For longs: A shift to bearish RSIS can force exits sooner.
For shorts: A shift to bullish RSIS can do the same.
This extra layer helps avoid over-reactive stops in strong trends while still respecting a regime change when it happens.
D. Repainting Protection
Many strategies look incredible in the Strategy Tester but fail in live trading because they rely on intrabar values or future-knowledge functions.
This template is built with closed-candle realism in mind:
The Risk Management logic explicitly uses previous bar data (open , high , low , close ) for the key decisions on:
Trailing stop updates
TP triggers
SL hits
RM state transitions
No security() lookahead or future-bar access is used.
This means:
Backtest behavior is designed to match what you can actually get with TradingView alerts and live automation.
Signals may “flicker” intrabar while the candle is forming (as with any strategy), but on closed candles, the RM decisions are stable and non-repainting.
4. For Developers & Modders
We strongly encourage you to mod this script.
To plug your own strategy into the RM engine:
Look for the section titled:
// BASELINE & SIGNAL GENERATION
You will see composite logic building B1 and B2, and then selecting:
baseSig = B2
altSig = B1
finalSig = sigSwap ? baseSig : altSig
You can replace the content used to generate baseSig / altSig with your own logic, for example:
RSI crosses
MACD histogram flips
Candle pattern detectors
External condition flags
Requirements are simple:
Your final logic must output:
2 → Buy signal
-2 → Sell signal
0 → No new trade
That output flows into the RM engine via finalSig → AlertOpen → state machine → Fin.
Once you wire your signals into finalSig, the entire Risk Management system (Stops, TPs, AATS, RSIS, re-entry logic, weekend filters, long/short toggles) becomes available for your custom strategy without re-inventing the wheel.
This makes Superior RBR not just a strategy, but a reference architecture for serious Pine dev work.
5. About Signal Lynx
Automation for the Night-Shift Nation 🌙
Signal Lynx focuses on helping traders and developers bridge the gap between indicator logic and real-world automation. The same RM engine you see here powers multiple internal systems and templates, including other public scripts like the Super-AO Strategy with Advanced Risk Management.
We provide this code open source under the Mozilla Public License 2.0 (MPL-2.0) to:
Demonstrate how Adaptive Logic and structured Risk Management can outperform static, one-layer indicators
Give Pine Script users a battle-tested RM backbone they can reuse, remix, and extend
If you are looking to automate your TradingView strategies, route signals to exchanges, or simply want safer, smarter strategy structures, please keep Signal Lynx in your search.
License: Mozilla Public License 2.0 (Open Source).
If you make beneficial modifications, please consider releasing them back to the community so everyone can benefit.
