Advanced OutSide with HMA and Klinger Forex Swing strategyThis is a swing forex strategy, adapted for big timeframes, such as 4h+.
For this example I adapted the strategy to EUR USD main forex pair.
Its components are:
Outside condition
Klinger Oscillator
Hull moving average
Rules for entry
For long: if current high is bigger than previous high and current is smaller than previous low and klinger is positive, close of the candle is above lsma and we have a bull candle.
For short: if current high is smaller than previous high and current is bigger than previous low and klinger is negative, close of the candle is below lsma and we have a bear candle.
Rules for exit
We exit when we have a reverse condition
We exit in case we hit the tp/sl based on % movement of the price.
If you have any questions, let me know !
"tp" için komut dosyalarını ara

Full Swing Gold Vwap Macd SMO StrategyThis is a full strategy designed for gold market using 12h timeframe chart.
Its components are:
VWAP monthly
SMO oscillator
MACD histogram
Rules for entry:
For long: when enter when close of the candle is above vwap monthly, current histogram is higher than the previous one and SMO oscillator is above 0
For long: when enter when close of the candle is below vwap monthly, current histogram is lower than the previous one and SMO oscillator is below 0
Rules for exit:
We exit the trade if we get a reverse condition.
We also exit the trade based on a risk management system, both for SL and TP using % movements.
If you have any questions let me know !

Full Crypto Swing Strategy ALMA Cross with MACDThis is a full crypto swing strategy designed.
From my testing it looks like it perform the best on timeframes 4h +.
The below example has been adapted to BNB/USDT, using the entire period since 2017 until present day, with a comission of 0.03% ( which is the comission for the futures on binance).
Its components are :
ALMA Fast
ALMA Slow
MACD Histogram
Rules for entry
For long, we have a crossover of the fast alma with the slow one and the histogram is ascending.
For short, we have a crossunder of the fast alma with the slow one and the histogram is descending.
Rules for exit
We exit based on a risk management system for TP and SL, or when we receive an opposite condition than the initial one.
Regarding risk management
0.05 = 5% movement
2 = 200% movement
0.001 = 0.1% movement
If you have any questions, let me know !

High/Low Channel Multi averages Crypto Swing strategyThis is a swing strategy designed for trending markets such as crypto and stock, with big timeframes , like 8h.
For this strategy we take SMA, EMA, VWMA, ALMA, SMMA, LSMA and VWMA and make an apply them all to both HIGH and LOW separately and make 2 averages, 1 applied to high and the other applied to low.
With them we make a channel.
Rules for entry
For long: close of a candle is above avg applied to high.
For short: close of a candle is below avg applied to low.
Rules for exit
We exit when we either hit TP or SL or when we receive a different condition than the entry one.(long- > short and viceversa)
If you have any questions, let me know !

Swing/Scalper HULL + T3 avg Crypto StrategyThis is a both a swing and a scalper strategy(depends on the timeframe that you use), that works with all timeframes, however I noticed that with swing 3h works the best on most crypto pairs, such as ETH, BTC and so on.
Its main components are:
Hull moving average
T3 moving average
Risk management
With them I make an average and use it as the main moving average.
Rules for entry
For long: Average moving average is bigger than previous average moving average value.
For short:Average moving average is lower than previous average moving average value.
Rules for exit
We exit when either the TP/SL has been hit, or when we get a different condition than previous one(both for long and short).
If you have any questions, let me know !

Aggresive Scalper/Swing Crypto StrategyThis is a simple yet very efficient scalper long strategy adapted for low timeframes for crypto. Can also be used with bigger timeframes as a swinger.
Its main components are:
Price oscillator swing
Vortex
Risk management for TP/SL
Rules for entry
We calculate the difference between the oscillator from the lowest low and the highest high. If the difference is positive, its a long potential. If its negative we exit from the long trade.
At the same time we check that the we have a crossover between the VIP vortex with the VIM vortex part.
Lastly we check that the current candle is bigger the second previous high.
Rules for exit
If we reach the take profit or the stop loss.
If we have a negative difference betwee LL and HH and VIP vortex crossunder with VIM vortex .
In this example I aimed for a 1:10 risk reward ratio, meaing that for every dollar lost, we will gain 10 when we win. Thus having a 10% minimum win rate will give us a profit over many trades.
If you have any questions, let me know !

Hull Crossover Strategy no TP or SLWhat is it?
A simple yet effective strategy ran on the 30m chart.
This is a basic idea that can be expanded on using different indicator to either add signals or filter out certain bad signals!
The strategy consists of 1 fast moving average and 1 slow moving average.
Both of these moving averages are the Hull Moving Average
What is the Hull Moving Average?
The Hull Moving Average ( HMA ) is a directional trend indicator.
It captures the current market conditions and uses recent price action to determine if conditions are bullish or bearish relative to historical data.
The Hull is different from traditional trend indicators like the EMA and the SMA .
It is designed to reduce the lag often associated with other MAs by providing a faster signal on a smoother visual plane.
How it works?
When the fast HMA crosses over the slow HMA , we initiate a long signal, and
when the fast HMA crosses under the slow HMA , we initiate a short signal.
Conclusion
The power of simplicity is what makes this such a great core to use to build onto making something even better!
The results were optimised to suit the most common market conditions seen today.
******** Not financial advice! ********

Bollinger Bands + Moving Average (BBMA Oma Ally)Found this strategy in babypips forums.babypips.com
This strategy using BB and MA
BBMA Oma Ally Trading Technique
I’m just sharing this Forex Technique that helping me making positive result.
In BBMA, BB (Bollinger Bands) act as Dynamic Support and Resistance.
SETTING OF BBMA - BOLLINGER BANDS
Period : 20
Deviations : 2
Shift : 0
Apply to : Close
Style : Dodge Blue
MA (Moving Average) are used to detect potential entry point.
SETTING OF BBMA - MOVING AVERAGE
Ma5 Hi
Period : 5
Ma Method : Linear Weighted
Apply to : High
Style : Red
Ma10 Hi
Period : 10
Ma Method : Linear Weighted
Apply to : High
Style : Yellow
Ma5 Low
Period : 5
Ma Method : Linear Weighted
Apply to : Low
Style : Magenta
Ma10 Low
Period : 10
Ma Method : Linear Weighted
Apply to : Low
Style : White
Ma50
Period : 50
Ma Method : Exponential
Apply to : Close
Style : Lime
.
EXTREM (SIGNAL)
Extrem is an early signal to say the Market journey is beginning to end - but not yet confirmed
Will only confirm when there is a reversal candle.
Extrem is not valid when there is a CS momentum, although Ma outside BB.
CHARACTERISTICS OF EXTREM
Ma out of Top / Low BB (will not valid if there is cs momentum, although Ma is outside BB)
Reverse candle must exist, as it indicates the journey of a Market is ending (not necessarily 1 or 2 cs)
Retest candle (entry point)
Entry at Highest or Lowest volume
Entry retest candle at Ma5 or body candle
MHV (LOSS VOLUME MARKET) (SETUP)
It is a setup for the beginning of long distance Market journey
This setup gives a validation for the Extrem signal earlier
It is to show the loss of strength for the market.
MHV is valid once CSA (direction candle) appear
***If the candle close NOT above or below Top / Low BB after the first Reentry, after MHV there is a directional candlestick, then there will be a reentry and after the reentry there is no momentum “COMPULSORY TP”
CHARACTERISTICS OF MHV :
Candle CANNOT close above or below Top / Low BB
Must have reverse candle, because reverse candle is confirming the end of the journey (Marking at candle body)
Retest candle (entry point) at Ma5 or highest volume / lowest at that current time
Must happen after Extrem
TYPES OF MHV
5 types but i can only post 1 photo. So sorry i cant give more on this.
RE-ENTRY
CHARACTERISTICS OF REENTRY
Candle close can not pass Ma5 / Ma10
It will be strong when the candle close does not pass Ma5 / Ma10 and also Mid BB
Candle close did not come in. He found Ma5 / Ma10 and mid BB at that Time would make the re-entry stronger
If there is a re-entry in Ma5 / Ma10 and mid BB, the minimum of 3 drops of candles or increments (follow TF) re-entry will be strong
Following market trend, then just search for re-entry and entry
Wait for the second candle, because the first candle validates the reentry and the second candle is for entry

Full Forex scalper StrategyTHis is a FOREX scalping system that can be optimized with almost all majors and crosses pairs.
Its made of multiple elements such as :
MACD
Stochastic RSI
Fast VW moving average
Slow VW moving average
Time management( forex sessions as inputs)
Rules for entry
Long
Last 2 MACD values were ascending, fast moving average is below moving average and stochastic RSI is below 30 level. At the same time we are either into London or NY session.
Short
Last 2 MACD values were descending, fast moving average is above moving average and stochastic RSI is above 70 level. At the same time we are either into London or NY
Rules for exit
WE have 2 exit possibilities: we can exit either at the end of NY/London Session or based on a TP/SL risk management calculating % in movement.
If you have any questions let me know !

Forex scalper 2xEMA + SRSI + MACDThis is a forex scalping strategy designed for the most liquid pairs, like major forex pairs.
Its made of
1 EMA 50
1 EMA 100
Stochastic RSI
MACD
Rules
For long :close of the candle is above moving average 50, moving average 50> moving average 100, macd histogram is positive and cross over of stochastic rsi with the oversold level.
For short :close of the candle is below moving average 50, moving average 50 < moving average 100, macd histogram is negative and cross under of stochastic rsi with the overbought level.
Exit
For exit we have take profit and stop loss using fixed pip points.
For this example on EURUSD we use 20 pips for both tp and sl
IF you have any questions let me know !

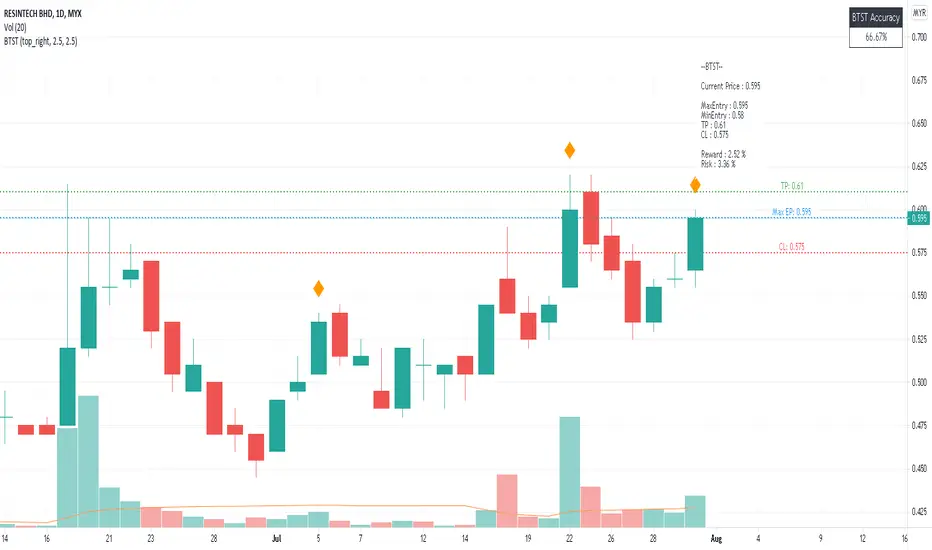
BTST Risk & Reward- BTST stands for Buy Today Sell Tomorrow which is trading is done on high momentum stock and selling is done on next day.
- Max Entry is one bid below intraday highest price
- TP is 2.5% above Max Entry and CL is one bid below 2.5% from Max Entry
Kifier's MFI/STOCH Hidden Divergence/Trend BeaterMFI/STOCH Hidden Divergence/Trend Beater
General Idea:
My premise around this strategy was to make a general strategy for crypto that would help out with finding entry positions for when you’re bullish on a crypto and want to hold on for a while, and at the same time avoiding massive drops. Essentially a way to mix long term/ swing trading; I somewhat achieved my goal however it still requires a lot of logic tuning of the trend averages.
I’m a huge proponent of volume indicators and coupled with average closing price, I think this gives a really good idea of what is happening with the market. It gives an idea on the market and retail investor sentiment. This generally gives you logical entry positions (Although I don’t know how amazing that will work with all cryptos, there’s a fine line between a good strategy and one that just rides bubble market conditions, some would argue that’s still a success and others not)
How it works:
There are many components to the strategy that try to do different things:
First of all there are two types of entries, a MFI hidden divergence with a STOCH check, essentially it will only fire when a divergence is detected while STOCH is above 50%, however this might be changed in the future as due to the volatile nature of cryptos, the STOCH is not too effective. The second entry is a simple MFI/STOCH trend, if STOCH is above 50% and the trend is detected to be in a trending long, once a MFI crossover over the 50% line is detected an entry is placed, this is designed to get out profit where the divergence would otherwise be less accurate during strongly trending conditions.
-MFI is a great indicator, as a volume weighted momentum indicator I find it the most accurate of all, the STOCH however is a great indicator to get a general picture of simple market conditions and can filter out the emotional noise of retail investors.
-VWMA and an SMA (The bottom oscillator) gives an idea of the trend tacking into account of the volume, this serves as a more short term filter of the trend for filters.
-OBV checks are done between the OBV and an EMA of the OBV, to get the idea of a volume weighted long trend, which is important for crypto as there are massive rallies to go up due to retail greed, it’s great to jump onto it at the beginning, and get off before the stack of cards fall apart.
-ATR is used to detect when the market is relatively just ranging or moving sideways, which is where the hidden divergence entries are done, during predictable and profitable market conditions.
- Stop loss is based on the closest support of the entry, this is a nice medium of room to breath but also an actual stop loss.
Future plans and improvements:
Currently there’s a lot I want to improve, mostly the divergence detection and the overall sharpe ratio could be much better, but the current value of 0.5 gives me hope that the strategy is onto something. I also want to change TP from a percentage stop to something more dynamic but that might be too optimistic. The current plan is to paper trade test this either by manual or by a python bot, to see how it performs with some user input as well.

Newton theory (Bollinger Band Breakout)Initial capital 1000 USD
Order size 10%
Commission 0.3% with slippage
Timeframe 4h
This is Simple Bollinger Band Trend find out strategy.
I'm using the usual trailing offset as an exit for this strategy.
using 1x leverage to go long short within 3years backtest result more then 200% for all usd pair.
in next version i will try to find out more optimize sma,std,sl,tp parameter by using freqtrade hyperparameter optimization.
Happy Trading :)

TREX
TREX or TPA indicator by SOTTI
// The basic version and start of this indicator was set by my good friend Mr Shayan Karimi and we have room to learn from him and this text is here to make this happen.
//This indicator is taken from Master Saeed khakestar indicator
//Trigger price action -- True Range Exchange -- TPA - TRex
how to use this indicator:
this indicator for price action system and use full for student of master saeed khakestar
you can use tp1 for stop loss and tp3,7,15 for target you finde a flag limit on this area and set your tp or target
and use th or tr for price how much can be run and live use for price how much runned
TP1 = ATR time
PI.SL = TP1 + ENG.sl = pivot stop loss
ENG.sl = 0.25* TP1 = triger price actions stop loss
TP3 = 3*TP1
TP7 = 7*TP1
TP15 = 15*TP1
TH -> tavan harkati
TR -> True range average
LIVE -> live range candel
TP1 = توان حرکتی تایم که در ان هستیم
PI.SL = توان حرکتی تایم + میزانی که از نفوذ هار در امان باشیم
ENG.sl = یک چهارم ای تی ار تایم
TP3 =سه برابر تارگت اول
TP7 = هفت برابر تارگت اول
TP15 = پانزده برابر تارگت اول
TH -> توان حرکتی
TR -> میانگین توان حرکتی
LIVE -> میران حرکت کندل لایو
TH.long = گام بلند حرکتی
TH.small = گام کوتاه حرکتی

[Sidders] MACDEMASAR IndicatorCame across a cool idea for a strategy that couldn't find in the indicator database, so decided to code it up myself for your pleasure.
Indicators consists of 3 indicators: EMA(200) to determine the overall trend, and the MACD & Parabolic SAR to determine entries (and exits).
Long entry contains 4 conditions and is generated when price is above the 200EMA (1), the MACD crosses above the signal line (2), while they are both below 0 line (3) and when the parabolic SAR is below the closing price of the bar (4).
Short entry is build up the same but in reverse: price is below the 200EMA(1), signal line crosses below the MACD line (2), while they are both above the 0 line (3) and when the parabolic SAR is above the closing price of the bar (4).
Place the stoploss on the parabolic SAR dot below/above the candle that created the signal. Profit target 1:1 risk:reward ratio, but can ofcourse be changed according to your risk apetite. Might add automatically drawn SL/TPs in a later update.
Concept behind the strategy should work on all timeframes, but will require proper backtesting. I think with additional filters the strategy can also be way more finetuned and profitable, personally haven't had the time yet to dive into that.
Have also added alerts for your convenience.
Enjoy!

Simple MACD strategy Simple macd strategy
Rules:
if MACD bullish crosses below 0 and above 200 EMA a buy signal is created
if MACD bearish crosses above 0 and below 200 EMA a sell signal is created
best settings for winrate and profit :
1. is taking 1:1 trades so with a tp of 2% and sl of 2% winrate is around 62%

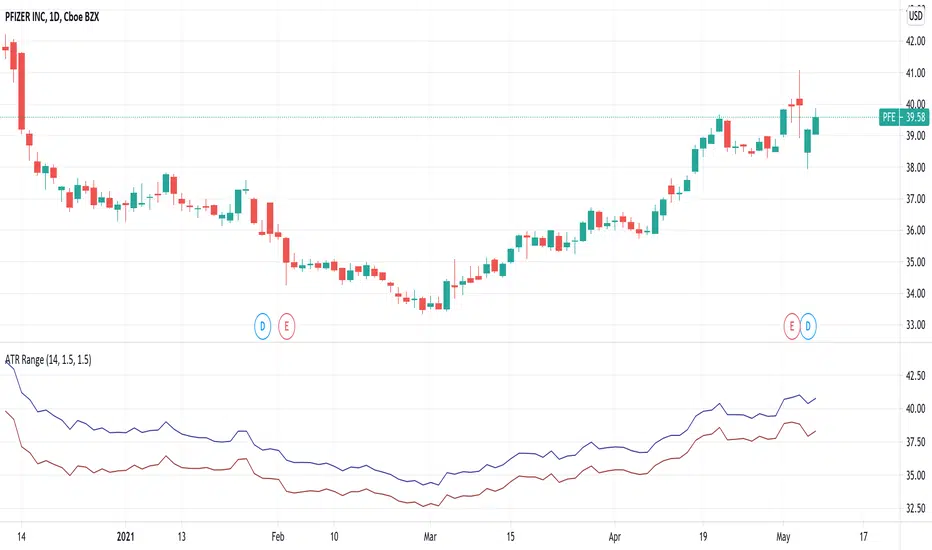
ATR RangeUseful in case you use Average True Range to determine Shows Stop Loss and Take Profit price levels.
For example, if you want to put Stop Loss with a distance of 1.5xATR and Take Profit 2xATR for a long trade, put 1.5 as Lower Factor and 2 as Upper Factor. Lower and Upper prices will show price levels for SL and TP respectively.
3 EMA Stochastik RSI ATR SL TP only LONGHey there!
Here i will show you the 3 EMA RSI Stochastic Crossover strategy with an ATR SL and TP.
The strategy works as follows:
For long positions, the EMA's must be in the following order:
The 8 E M A must be above the 14 E M A and the 14 E M A must be above the 50 E M A.
The buy signal is given to us by the Stochastic RSI indicators.
The K line must cross the D line above. The following candle must then close above all E M A's.
The stop loss is determined by three times the value of the ATR.
The take profit is determined by two times the value of the ATR.
In this strategy only long positions are traded.

Rudimentary Grid bot ideaUsing Eulerian principles yet again, this is the beginning of my first grid bot script. Use as static S&R when trading manually. Good for SL and TP setting too.

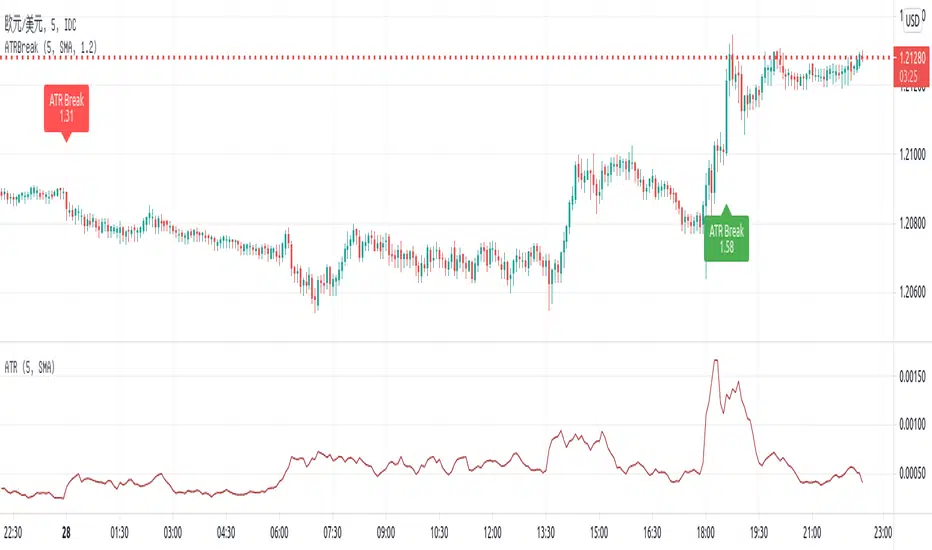
ATR Break on chartThis script is putting one of my old trading method, ATR Break, on chart.
It used to win many times in Dukascopy strategy contest a few years ago.
Pine script is quite easy to learn and very powerful. So I coded it to have a quick view for ATR break on chart.
The rule is simple:
- Current close - open / Previous ATR(5) > alertlevel (1.2), long signal
- Current open - close / Previous ATR(5) > alertlevel (1.2), short signal
The script will display label on the chart with the value of abs(close - open) / Previous ATR(5) to feel the strength.
I used to use the method on 5-min even 1-min chart. SL for 200 points and TP for 5-10 points
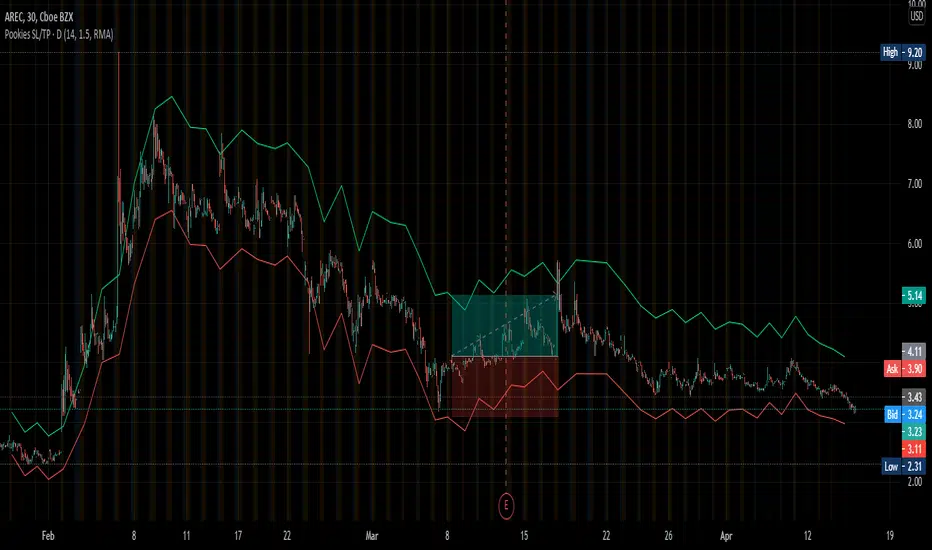
Pookies SL/TP LinesThis indicator calculates Stop-loss and Take-profit limits and plots them on the chart based on the daily ATR value for a given instrument.
The Stop-loss is calculated at the current close price minus 1x ATR and is plotted as a red line by default.
The Take-profit is calculated at the current close price plus 1.5x ATR and is plotted as a green line by default.
The colors for each line can be changed, as well as the default ATR values (length, smoothing).
To use:
When you see a long or short signal (your own preference), enter your position and set your take-profit and stop-loss limits at the current red/green lines, based on whatever Risk-Reward you've set it to.
This is also helpful in determining whether or not a trade offers enough potential to risk prior to entering the trade.
When the lines are far apart, the ATR is high. When the lines are close together, the ATR is low. This can be used to determine volatility and allow traders to buy during consolidation and sell into strength.
Thank you.
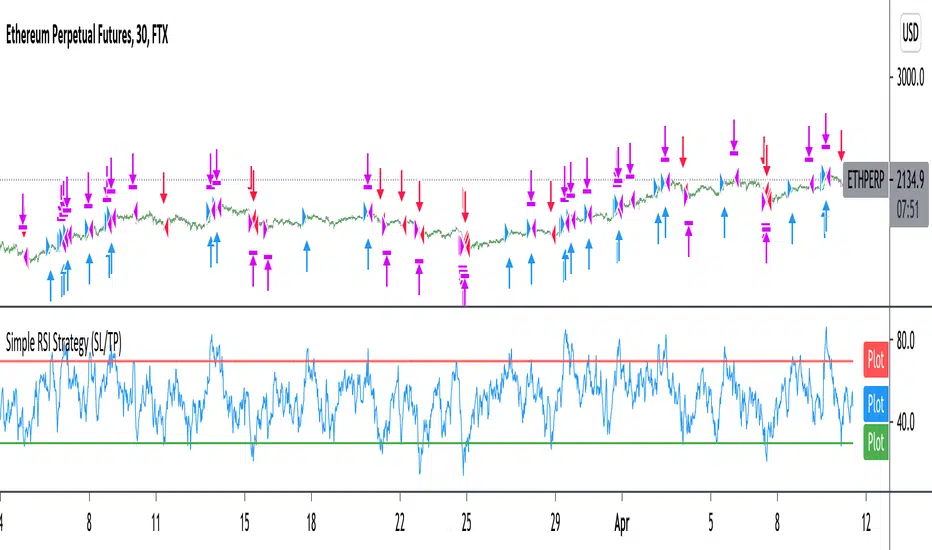
Improved simple RSI Buy/Sell at a level (SL/TP)Improved Simple Strategy based on RSI, using overbought or oversold levels.
Backtest: ETHPERP (FTX) - 30m
Set STOP LOSS and GET PROFIT as a percentage (2% and 10% by default).
If strategy.position_size != 0 algorithm convert percentages into points and set stop loss and take profit limit orders.