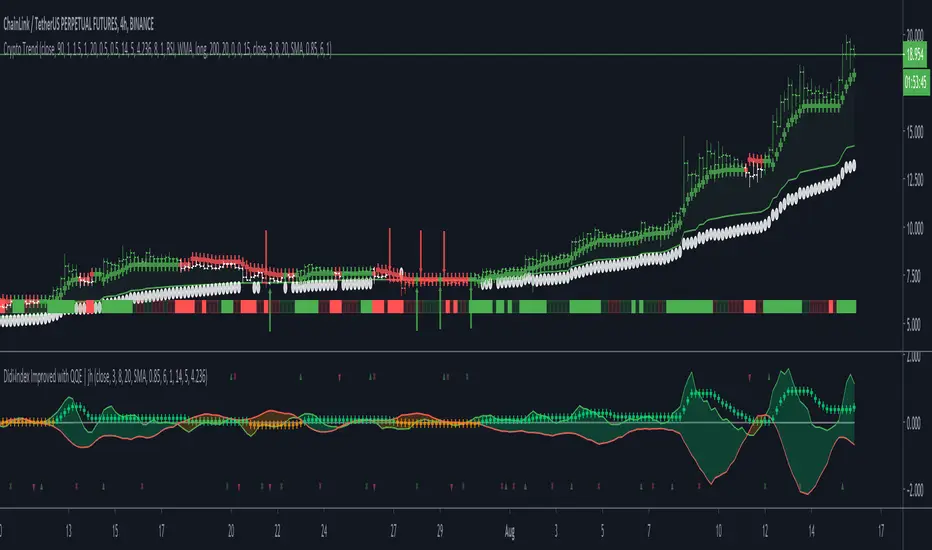
Crypto TrendThis indicator is based off of the Trend Follower system put together by jiehonglim:
This is a trend following system that combines 3 indicators which provide different functionalities, also a concept conceived by VP's No Nonsense FX / NNFX method. I’m primarily modifying this system for Crypto trading (mostly leveraged Crypto Futures). Suggestions/requests welcome.
New Features:
Added position inputs that will generate position labels
For leverage trading, position inputs will calculate your percentage-based stop loss given your entry, leverage and liquidation price
Added optional horizontal line plots for entry, stop loss, 50% take profit and 100% profit levels.
Added non-plotted Didi calculations for alert condition triggers
Added long and short alerts
These alerts will trigger for any of the 3 following conditions:
Baseline cross with volume confirmation
Didi two line cross with volume confirmation
Didi continuation with volume confirmation
1. Baseline
The main baseline filter is an indicator called Modular Filter created by Alex Grover
- www.tradingview.com
- Alex Grover - Modular Filter
-------
That's the moving average like baseline following price, filtering long and short trends and providing entry signals when the price crosses the baseline.
Entry signal indicated with arrows.
2. Volume / Volatility , I will called it Trend Strength
The next indicator is commonly known as ASH, Absolute Strength Histogram.
This indicator was shared by VP as a two line cross trend confirmation indicator, however I discovered an interesting property when I modified the calculation of the histogram.
- Alex Grover Absolute Strength
-------
My modification and other info here
- Absolute Strength Histogram v2
-------
I simplified the display of the trend strength by plotting squares at the bottom of the chart.
- Lighted Squares shows strength
- Dimmed Squares shows weakness
3. Second Confirmation / Exits / Trailing Stop
Finally the last indicator is my usage of QQE (Qualitative Quantitative Estimation), demonstrated in my QQE Trailing Line Indicator
- QQE Trailing Line for Trailing Stop
-------
Three usages of this amazing indicator, serving as :
- Second trend confirmation
- Exit signal when price crosses the trailing line
- Trailing stop when you scaled out the second trade
This indicator is plotted with crosses.
4. Position Calculator
For non-leveraged trades, set leverage to 1 and liquidation to 0
Fill out the rest of the position field to get labels that will tell you:
Your stop loss given your acceptable percentage of loss for your risk. So, for example if your actual investment is $200 and you’re trading on 20X leverage, you’d like to know what price would have to drop to for you to lose 15% of your $200 risk. This is what the position calculator is doing for you.
Your 50% take profit point
Your 100% take profit point
Check the “Show Position Lines” to plot horizontal lines for entry, stop loss, 50% TP and 100%TP
Alerts
You just get a Long Alert or Short Alert option. This was for two reasons, the first and most important was to reduce the number of alerts needed for this system to get maximum coverage. The second was just to keep things simple. Get an alert for your desired direction for any interesting signal and then check the chart manually to determine if a viable entry has presented itself. The three alert conditions are:
Main trend indicator, baseline cross with volume confirmation
Didi two line cross entry with volume confirmation
Didi continuation signal with volume confirmation
Additional plots and information
Bar Color
- Green for longs, Red for shorts, White when the baseline direction conflicts with the QQE trailing line direction
- When it's white, it's usually ranging and not trending, ASH will also keep you off ranging periods.
-------
ATR Filter
- White circles along the baseline, they will show up if the price has moved more than one ATR from the baseline
- The default allowance is 1 ATR.
-------
The previous and current ATR value
- Label on the right side of the chart showing the previous and current value of ATR
"tp" için komut dosyalarını ara
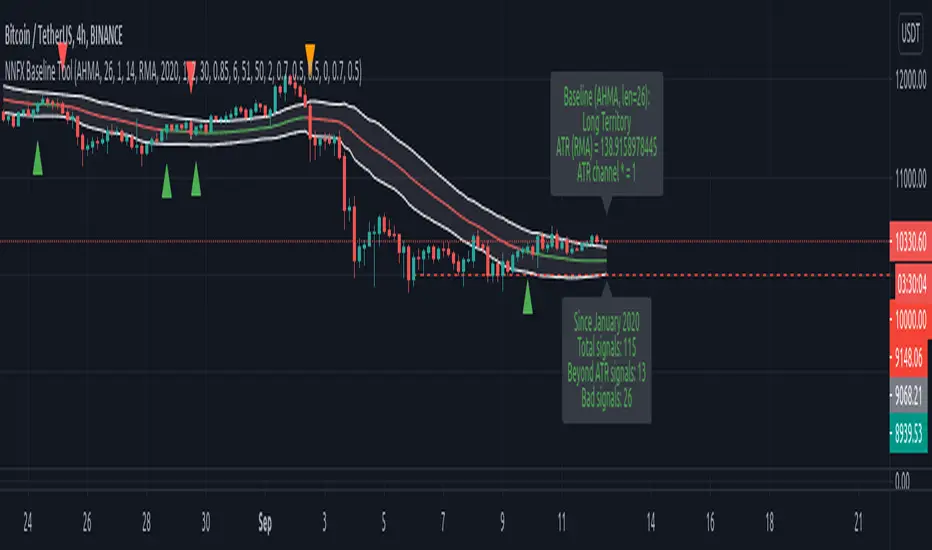
NNFX Baseline ToolNNFX All-in-One Baseline display / test tool.
This is usefull (hopefully) for the NNFX way of trading only. It's not intended to be used as a standalone tool.
Basically, this script displays and tests many types of Moving Averages as baselines.
It displays baseline signals, based on the NNFX ATR-related rule for baseline entries.
It can be used as a backtest tool, or plugged into the whole nnfx algo.
If signal display option is enabled, signals are displayed on chart : green for long, red for short, orange for crossovers beyond the ATR channel :
Many baselines available : SMA , EMA , WMA , VWMA , ALMA , AMA, SMMA , DEMA , FRAMA , HULL, KAMA , KIJUN, JURIK, LAGUERRE, MCGINLEY , TMA1, TMA2, VIDYA , MODULAR FILTER, VAMA , ZLEMA , T3, LSMA, etc.
Additional options :
- multiplying the ATR channel (and subsequent rule) by a factor (default = 1)
- plot the ATR channel (def = yes)
- fill it (def = yes)
- display signals (def = yes)
- option for add color to the baseline, for long/short territory (2 different options : baseline is colored, background is colored)
- darkmode / lightmode color option. (def = dark)
We also display panels, with general information and some test results. Tests are done within the test period.
I tried to test all the different MAs included in the script but some bugs might still be present, so use it at ur own risk.
If you'd like a new MA option added, please let me know in comments.
I included a "bad" signal detection, it can help for tweaking the settings. Signals are defined as "bad" when they are immediately followed by another signal.
When there is 2 or more bad signals next to another, you spotted a chopiness zone (a chopiness zone is defined as a zone where BL get eaten alive).
Example :
to do :
- plug it with the c1/c2 backtest tool (it's the whole point)
- add alerts,
- add more ma types
- stop to use the operator, it's not convenient at all
- add wr% calculation as a standalone feature (with TP / SL)
- add a way to measure chopiness in the test (dont know how yet)
- detect & display chopiness zones
I asked other users when I used their ideas (for some particular types of MAs). They all agreed.
Trend trader StrategyFirst I would like to thank to @JustUncleL since this strategy started from one of his scalper strategies
This strategy can be adapted to all time charts .
First it has the session where we want to trade, for this example I choosed the EURUSD so I only take in consideration london/neywork session.
Its made from 3 EMA :
normal
slow
ultra slow
It has has the capacity to use HA candles into consideration if its needed.
At the same time we have a price channel made from faster MAs, that act like a bollinger band .
Together with all of them, we establish which trend we have if its uptrend or downtrend
Then we check the candles if they are below or above the MA , and based on the condition if they crossed recently we can suggest if its a buy or a long condition
At the same time we have 2 options of stop conditions:
Through a trailing stop made from ATR or % based
And second, a SL/TP made from pip points or % based.
For this example I used % based.
Let me know what you think about it, and if you found some nice settings for it. So far I only adapted to EURUSD 1 min time.

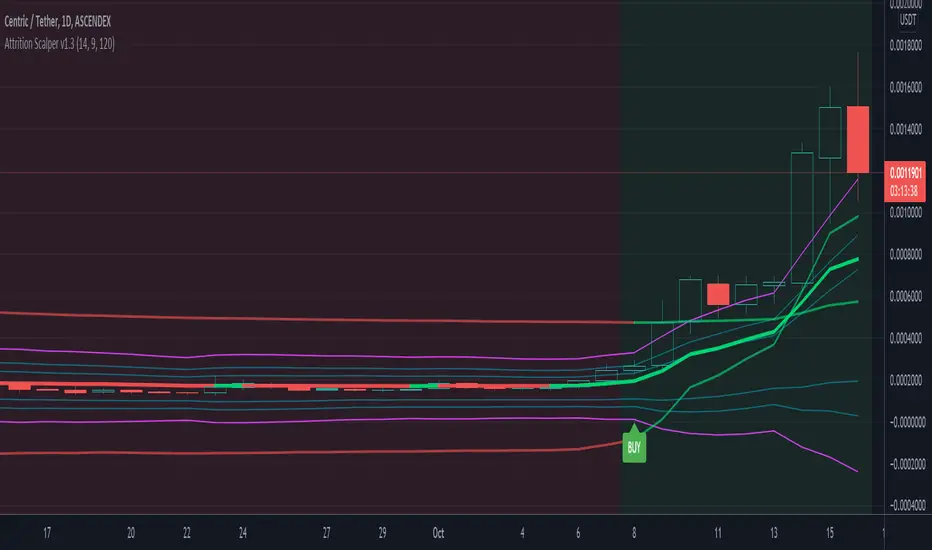
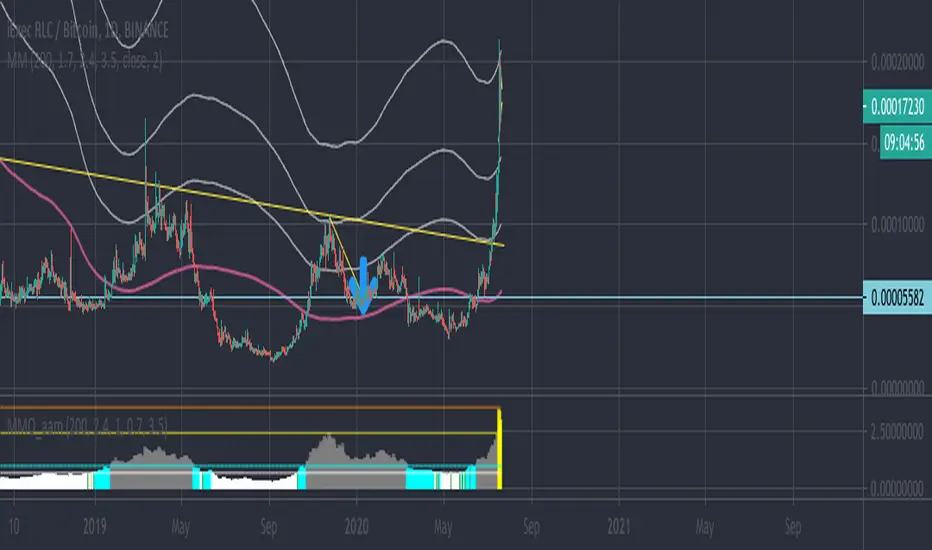
Attrition Scalper v1.0A weird indicator to catch tops/bottoms and scalp with the signals. You should buy/sell with the signals but you should also analyze the chart manually before jumping straight into the trade. One of the most important thing is the middle VIDYA line. It is a very strong support/resistance and if you've taken a long/short from top/bottom, you might want to target there to exit as the indicator will not give you a sell signal there probably.
You should also after trying the indicator for a bit. Make a proper SL/TP strategy for it.
By default the indicator will only load with charts up to 30 minute frame. If you want to load on higher timeframe charts you have to increase the Timeframe to Lookback and the Timeframe options in it's settings.
I really recommend lower timeframes though, the default settings with 5 minute chart is most likely the best.
Each of the lines you see are pretty strong support/resistance and pivot points . So if you've taken an entry for a quick scalp you should most likely start partially closing the position on each line.
I wouldn't really recommend a tight stop as we're most likely entering at or near the bottom and the price really can't stay that overextended unless it's a major/flash dump, at that point no indicator is safe anyways. So finding the sweet spot is up to you.
If more lines are on top of each other, be careful of that spot too as it's a great confluence of support/resistance . For example if the top VIDYA line is near the upper purple 4.236 line. That is a major resistance and if price is above it, it will almost certainly test it back or fall back inside the channel.
Another strategy is to not use the buy/sell signals but use the channel/lines yourself on higher timeframe for swing trading or just putting orders at the other extreme ends/lines in the channel to catch a nice entry in flash/major dumps/pumps.
Price will most likely retrace to the middle VIDYA line after touching or overextending from the top VIDYA and upper purple 4.236 line. Same also applies for the opposite side too. Any close above/below the VIDYA might mean continuation but that's better seen and confirmed on much higher timeframes, not 5 minutes probably.
Special thanks to: www.tradingview.com i got inspired from some of his indicators and even used some snippets of code which he allowed me to do.
In the near future i'm thinking of implementing new logic with Weis Waves and few other indicators to increase the signal count as i think it's currently very low. But overtrading might be bad anyways.
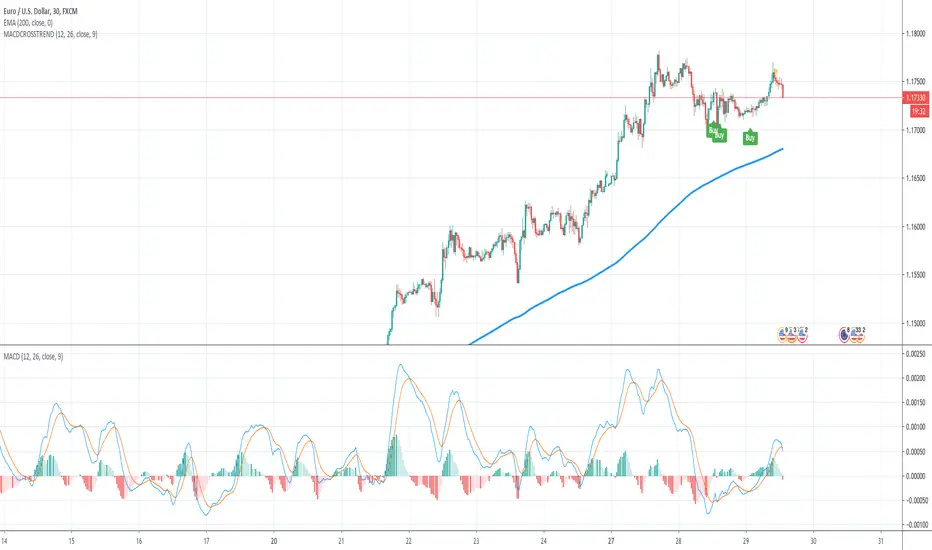
MACD Crossover Trend IndicatorHow this indicator works:
This indicator detects MACD Crossovers based on the current trend. It checks wether the current close price is above or below the 200 EMA and therefore decides whether we are in an up- or down trend.
UP-TREND: If the MACD is below 0 and crosses up the signal line, then this is a BUY signal!
DOWN-TREND: If the MACD is above 0 and crosses down the signal line, then this is a SELL signal!
How to trade this:
First rule: Be consistent!
Second rule: You will have lost trades and losing streaks - deal with it!
First set the SL slightly below the last significant low (eventually add/subtract the ATR value to/from it)
Then adjust the TP and ALWAYS use a RR ratio of 1.5.
NEVER get out of the trade earlier
Take every possible trade!
Important: Money management is key... so be consistent!
Have fun! :)
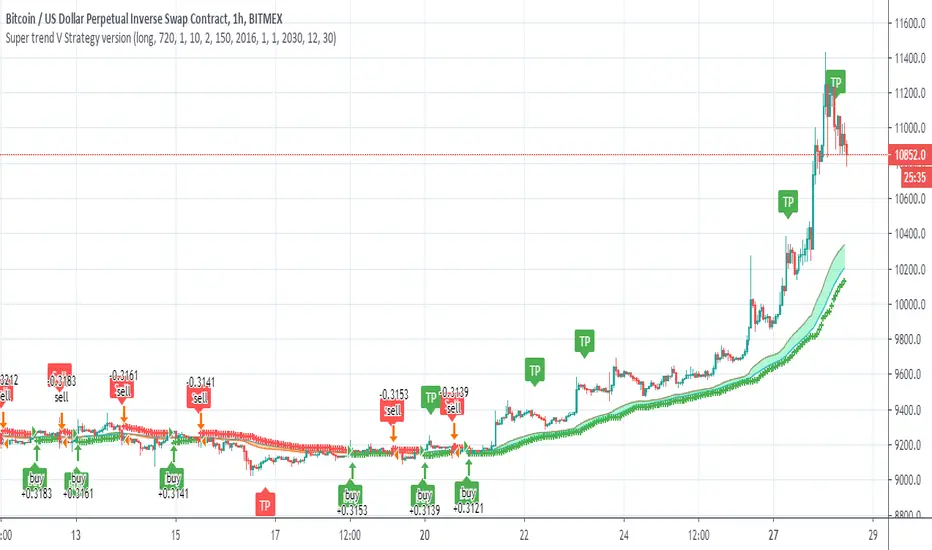
Super trend V Strategy versionThis is the strategy of Super trend V indicator
it not calculating the TP points which can make it much more proftible in theory
just the buy and sell of the super trend
youy can choose long only
short only
or both directions
Mayer MultiplesScript that plots the 200 Moving average, and several Mayer Multiple levels in the chart. This may help guestimate TP levels
Entry Exits: Check and Set Entry & Exits Easily in PIPS or PriceThis is a simple yet super useful script I made and use. I have learned so much from the community here at TV I thought I should give back a little. Hope you all like it. Comments and suggestions are welcome.
Note: By default it uses an entry point of the 500 bar high just so that when you add it your chart doesn't dissappear into a single line, which happens if the entry was set to 0 by default.
HOW TO USE: Simply input your entry point for the trade. By default it will show various popular SL and TP levels. You can modify to suit your preference. You can specify PIPS or actual prices below. Before I wrote this script I was forever calculating (and making mistakes) pips to price and pips to price. This does it all for you simply and easily.
PS. The FLOATINGLABEL function is uper useful as well. I found little docs out there so hopefully this will help you create floating labels for various things easily.
I hope you all enjoy.
Dougie Pips

Trend following 3 EMA & Bullish Engulfing indicator for ForexHello world,
I now took the time and puzzled through my own indicator.
The idea:
Main "strategy" uses 3 EMAs (8, 13 and 21) to attain trend-relevant information.
Then we look for bullish & bearing engulfing candles which indicate and pullback into trend direction and a gain in momentum.
Trading purpose:
One could now enter with next open. SL at low/high of engulfing candle. TP at e.g. 1.25 of that candles size.
Security:
There are two security functions build in.
We check for higher timeframe confirmation.
This is done by checking if current trend is in accordance with the EMA of the next higher timframe.
Standard-deviation is 3 on default. Can be changed in the inputs.
Alerts:
Until now there is just one alertcondition programmed.
It alerts for every engulfing candle (bullish and bearish).
More will follow in further versions.
Inputs:
I build in multiple inputs.
- switch on/off the security EMA's
- define security trend backcheck
- define the higher timeframe (15min/1h, 1h/240, 4h/D, D/W)
Happy to take feedback or contr.
All the best,
c4ss10p314

ATR/StdDev SL/TP LabelThis is a handy little info box containing the Stop-Loss/Take-Profit values
for a LONG/SHORT position based on either the ATR or the Standard Deviation
multiplied by a configurable constant.

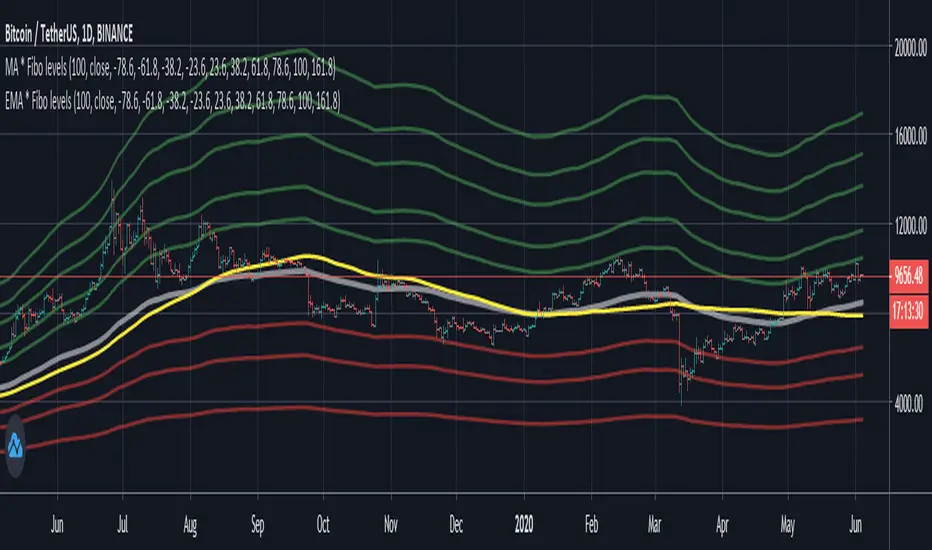
MA * Fibo levels (canal)Some updates to the scrypt "MA * Fibo levels (auto)"
In the previous scrypt we drew lines using either highs or lows of the candles due to the positiveness or negativeness of given percentages.
But, after some research it seems easier to use CANALS to buy or sell rather than LINES. So these canals are the intervals between SMA(highs) and SMA(lows) multiplied by FIBO coefficients. However, lines can be also used as stop-losses if the price goes out of the canal, and wait until the price reaches the other canal.
Good luck in trading!
If the scrypt was useful let me know!
Any feedbacks and ideas are welcomed!

Twin Range Filter Algo@Colinmck used two different ranges to generate signals. Read his release notes to find out what the original script does.
I added one condition which seems to increase performance on 15m BTCUSD as well as 1h BTCUSD and that is ATR with 32 periods being smaller than ATR with 64 periods. I used my script Volatility Optimiser to discover this tendency.
Both buying and selling conditions are same as in @Colinmck's script plus one condition of my own. You can disable my condition.
Target and stop-loss are manually set values in ticks.
Time stop-loss is manually set value in a number of candles. After this number of candles, a position always exits (or should 😇). You can disable it by inserting a very long period. I do not recommend it, because a value of indicator should not be measured in luck and if market starts moving in the direction after 40 periods, the predictive capability of an indicator is questionable.
I used 300/150/17 for 15m BTCUSD chart and 900/30/17 for 1h BTCUSD. I didn't try to optimize any other parameters for these periods.
Since this script relies mostly on volatility for its prediction, I wouldn't recommend using it on its own. Individual approach to the market is recommended. Also, it didn't work on EURUSD when using the same default values and different order management (tp, sl, time sl), so it is probably not as versatile.
Let me know what do you think of this strategy. If you have some ideas about how to make it more reliable, share it in the comments, I might put it to the test. Good luck 🍀


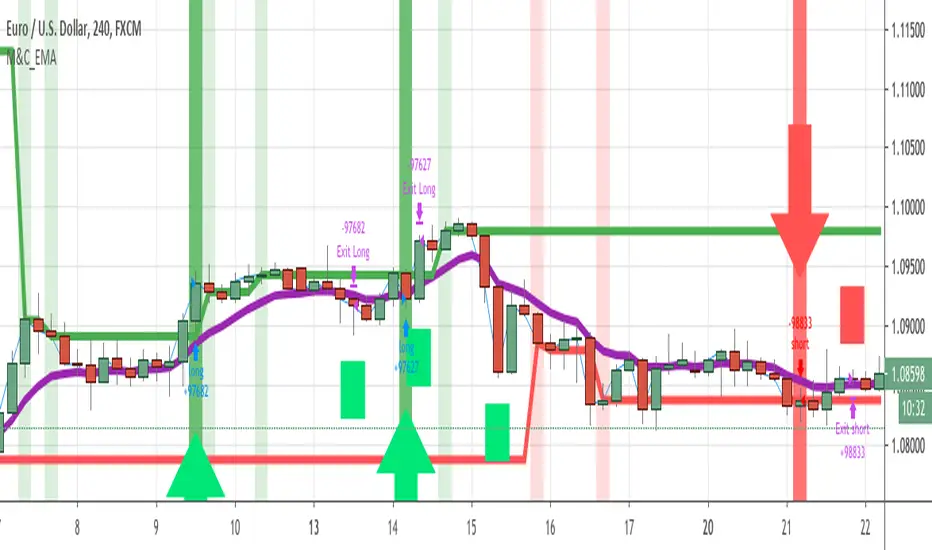
Mathias & Christer EMASo this Strategy is my first at when writing it's not 100% finnished.
The strategy idé builds on EMA (9) being clearly over/under the EMA for some bars.
If the EMA is over this will make a triggerline that when EMA (1) crosses this line it signals a buy/sell.
I don't have a great TP or SL for this yet so as of now I'm only using oposit crossing of close for now.
Colors and indicators:
light green/red - indicates that EMA (9) has been crossed and that a new Triggerline is painted at that candles close position.
dark green/red and Up /down Arrow - indicats that the triggerline has been crossed and an order should be taken here.
green/red squares - are where the order closed.
purple line - EMA (9)
blue line - EMA (1)
Percent Trailing Stop (%) - For Study Scripts===========
Percent Trailing Stop (%) - { FOR STUDY SCRIPTS }
===========
Wow - this is an example of how to implement Alerts relating to a Trailing Stop (%) within your Study Script. It's taken a bit of effort to get this working but I think we got there!
Alerts include Open Long/Short, Trailing Stop Hit, and (the most important one) Movement of Trailing Stop! <- this is actually really quite good, by the way! :)
You can ignore the actual entry/exit orders - they're based on a simple MA cross and are therefore NOT relevant, NOT profitable and NOT recommended!
You should be using this code as a way of adding a Trailing Stop to your own scripts - hope it helps!
Set your "Open Long/Short" Alert to "Once per Bar Close" - Set your "Trailing Stop Hit" Alert to "Once per Bar" - Set your "Move TSL" Alert to "Once per Bar Close". - You're all done! Enjoy.
-----------
Good Luck and Happy Trading!

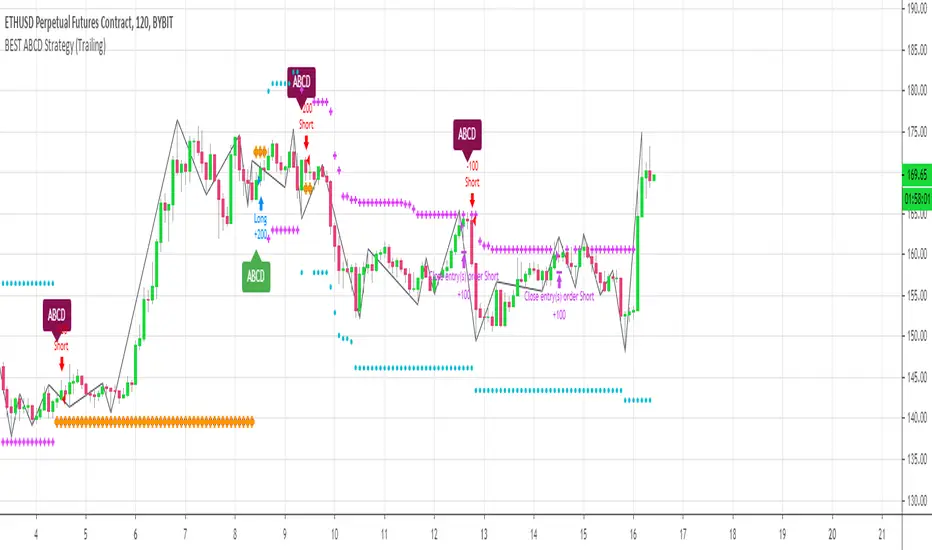
[Daveatt] BEST ABCD Pattern Strategy (Trailing SL + TP)Hello traders
This is the strategy version of my ABCD pattern. I added the Trailing Stop and Trailing Profit upon a follower request
I - Concept
I present to you, ladies and gentlemen, the first screener for harmonic patterns .
Starting with an ACBD pattern screener this time!!
I used the calculations from Ricardo Santo's script
In short, he's using fractals (regular or Bill Williams ) for the pattern calculations. A masterpiece !!!
II - Definitions
The ABCD pattern ( AB=CD ) is one of the classic chart patterns which is repeated over and over again.
The ABCD pattern shows perfect harmony between price and time.
The Williams Fractal is an indicator, developed by Bill Williams , that aims to detect reversal points (highs and lows) and marks them with arrows.
Up fractals and down fractals have specific shapes. The Williams Fractal indicator helps users determine in which direction price will develop
💎Strategy filters💎
I included some cool backtest filters:
- Trailing stop with trigger concept coming from this Trailing Stop Strategy
- Trailing profit with trigger coming from this Trailing Profit Strategy
Last words
It works for all asset classes (Forex, crypto, indices, etc...) and does not repaint
All the BEST
Dave

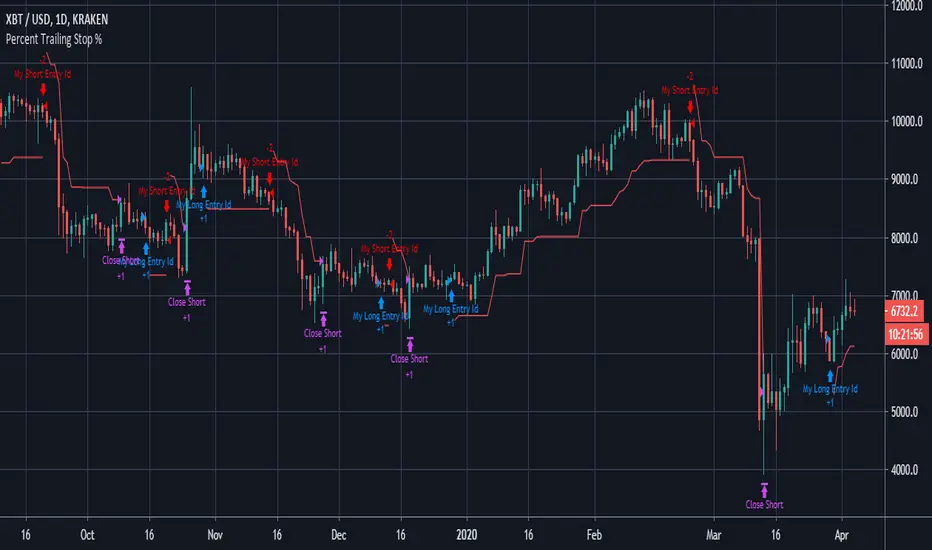
Percent Trailing Stop %===========
Percent Trailing Stop %
===========
Another Stop Loss Indicator today - our last Fixed SL/TP script went down quite well, this one is for adding a Percent Trailing Stop from Entry Price to your own strategy.
You can ignore the actual entry/exit orders - they're based on a simple MA cross and are therefore NOT relevant, NOT profitable and NOT recommended!
You should be using this code as a way of adding a % Trailing Stop to your own scripts - hope it helps!
You should also notice that a generally considered losing strategy (a simple MA cross) could actually become profitable with careful money management - try combining this Trailing Stop script with our Fixed Stop/Take Profit script for really accurate management of your capital.
-----------
Good Luck and Happy Trading!
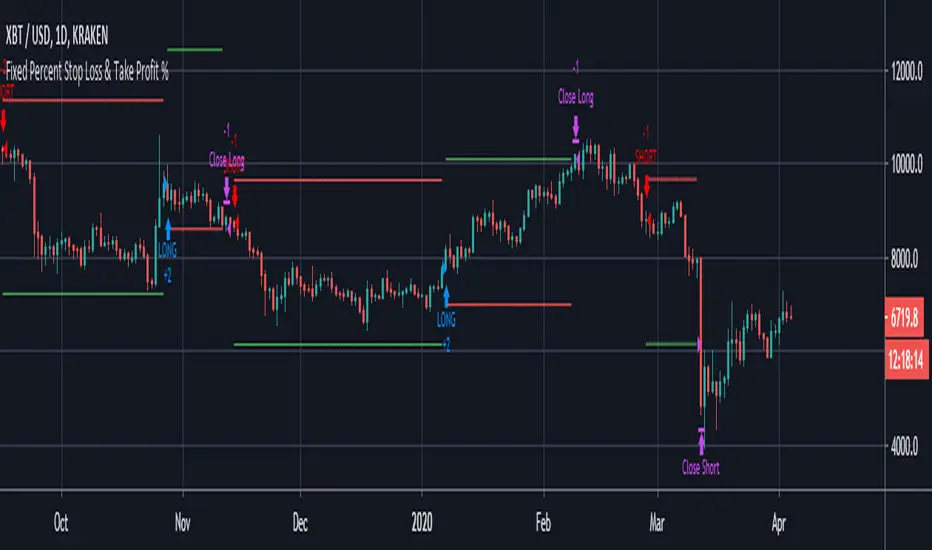
Fixed Percent Stop Loss & Take Profit %===========
Fixed Percent Stop Loss & Take Profit %
===========
A neat example of how to set up Fixed Stops and Take Profit as a percent of the entry price.
Yup, that's about it!
You can ignore the actual entry/exit orders - they're based on a simple MA cross and are therefore NOT relevant, NOT really profitable and NOT recommended!
You should be using this code as a way of adding Stops and Takes to your own scripts - hope it helps!
-----------
Good Luck and Happy Trading!
Price Action and 3 EMAs Momentum plus Sessions FilterThis indicator plots on the chart the parameters and signals of the Price Action and 3 EMAs Momentum plus Sessions Filter Algorithmic Strategy. The strategy trades based on time-series (absolute) and relative momentum of price close, highs, lows and 3 EMAs.
I am still learning PS and therefore I have only been able to write the indicator up to the Signal generation. I plan to expand the indicator to Entry Signals as well as the full Strategy.
The strategy works best on EURUSD in the 15 minutes TF during London and New York sessions with 1 to 1 TP and SL of 30 pips with lots resulting in 3% risk of the account per trade. I have already written the full strategy in another language and platform and back tested it for ten years and it was profitable for 7 of the 10 years with average profit of 15% p.a which can be easily increased by increasing risk per trade. I have been trading it live in that platform for over two years and it is profitable.
Contributions from experienced PS coders in completing the Indicator as well as writing the Strategy and back testing it on Trading View will be appreciated.
STRATEGY AND INDICATOR PARAMETERS
Three periods of 12, 48 and 96 in the 15 min TF which are equivalent to 3, 12 and 24 hours i.e (15 min * period / 60 min) are the foundational inputs for all the parameters of the PA & 3 EMAs Momentum + SF Algo Strategy and its Indicator.
3 EMAs momentum parameters and conditions
• FastEMA = ema of 12 periods
• MedEMA = ema of 48 periods
• SlowEMA = ema of 96 periods
• All the EMAs analyse price close for up to 96 (15 min periods) equivalent to 24 hours
• There’s Upward EMA momentum if price close > FastEMA and FastEMA > MedEMA and MedEMA > SlowEMA
• There’s Downward EMA momentum if price close < FastEMA and FastEMA < MedEMA and MedEMA < SlowEMA
PA momentum parameters and conditions
• HH = Highest High of 48 periods from 1st closed bar before current bar
• LL = Lowest Low of 48 periods from 1st closed bar from current bar
• Previous HH = Highest High of 84 periods from 12th closed bar before current bar
• Previous LL = Lowest Low of 84 periods from 12th closed bar before current bar
• All the HH & LL and prevHH & prevLL are within the 96 periods from the 1st closed bar before current bar and therefore indicative of momentum during the past 24 hours
• There’s Upward PA momentum if price close > HH and HH > prevHH and LL > prevLL
• There’s Downward PA momentum if price close < LL and LL < prevLL and HH < prevHH
Signal conditions and Status (BuySignal, SellSignal or Neutral)
• The strategy generates Buy or Sell Signals if both 3 EMAs and PA momentum conditions are met for each direction and these occur during the London and New York sessions
• BuySignal if price close > FastEMA and FastEMA > MedEMA and MedEMA > SlowEMA and price close > HH and HH > prevHH and LL > prevLL and timeinrange (LDN&NY) else Neutral
• SellSignal if price close < FastEMA and FastEMA < MedEMA and MedEMA < SlowEMA and price close < LL and LL < prevLL and HH < prevHH and timeinrange (LDN&NY) else Neutral
Entry conditions and Status (EnterBuy, EnterSell or Neutral)(NOT CODED YET)
• ENTRY IS NOT AT THE SIGNAL BAR but at the current bar tick price retracement to FastEMA after the signal
• EnterBuy if current bar tick price <= FastEMA and current bar tick price > prevHH at the time of the Buy Signal
• EnterSell if current bar tick price >= FastEMA and current bar tick price > prevLL at the time of the Sell Signal

Stochastic Pop and Drop by Jake Bernstein v1 [Bitduke]I found a simple strategy by Jake Bernstein, modified it a little and created a strategy with Risk Management System (SL+TP); After that I test it on the different cryptocurrency pairs.
About the Indicator
Basically it's the strategy of 2 indicators: Stochastic Oscillator to define the bias and Average Directional Index to confirm it.
One again, It uses Stochastic Oscillator to define the trading bias. In particular, the trading bias was deemed bullish when the weekly 14-period Stochastic Oscillator was above some default value (in him paper - 50) and rising and vice versa.
Once the trading bias is established, Steckler used the Average Directional Index (ADX) to define a slowdown in the trend. ADX measures the strength of the trend and a move below 20 signals a weak trend.
Modifications
I didn't implement Average Directional Index (ADX) and test just different sources for data, oscillator periods and different levels in relation to the crypto market.
So, it shows good results with two tight thresholds at 55 and 45 level.
The bar chart below the defining the bullish and bearish periods (green and red) and gives a signal to enter the trade (purple bars).
Backtesting
Backtested on XBTUSD , BTCPERP (FTX) pairs. You may notice it shows good results on 3h timeframe.
Relatively low drawdown
~ 10% (from 2019 to date) FTX
~ 22% (4 years from 2016) Bitmex
I backtested on the different altcoin pairs as well, but the results were just not good.
Relatively good results were shown by some index pairs from the FTX exchange ( FTX:SHITPERP ), but I think there is a few data for backtesting to be asure in them.
Bitmex 3h (2017 - 2020) :
i.imgur.com
FTX 3h (2019 - 2020):
i.imgur.com
Possible Improvements
- Regarding trading algorithm it would be good to check with strategy with ADX somehow. Maybe for the better entries
- As for Risk Management system, it can be improved by adding trailing stop to the strategy.
Link: school.stockcharts.com

MA 12, MA 24, RSI OB-OS, CCI by WP@SITechDeveloped by Worachart Pirunruk, MD - Siam Intelligence Technology
This is the signal that generates based on 4 Technical Analysis Tools:
1. SMA 12,
2. SMA 26,
3. RSI 14,3,3
4. CCI
Signal to Buy/Long when the RSI below Dynamic oversold line based on close price back 60 bars.
Parameter. This signal doesn't have to best TP point, I'm working on improvement, now. Btw, don't forget to calculate you Margin Level. I'll teach you guys later of how to calculate.
Have fun Trading guys, and don't forget to give back to others. Because, Giving is Receiving."
WP@SITech
