Top and BottomThis system try to find Top and Bottom using Donochian channel over Fib Bollinger
You can use the TF to find more (shorter time) or less such events (longer time)
No alert but they are easy to make for such system
The main problem that it work very good when the your asset us more or less stable . but in case of large dumping it will try to find the new low
so be aware on this issue if you make alert to this system
"top" için komut dosyalarını ara

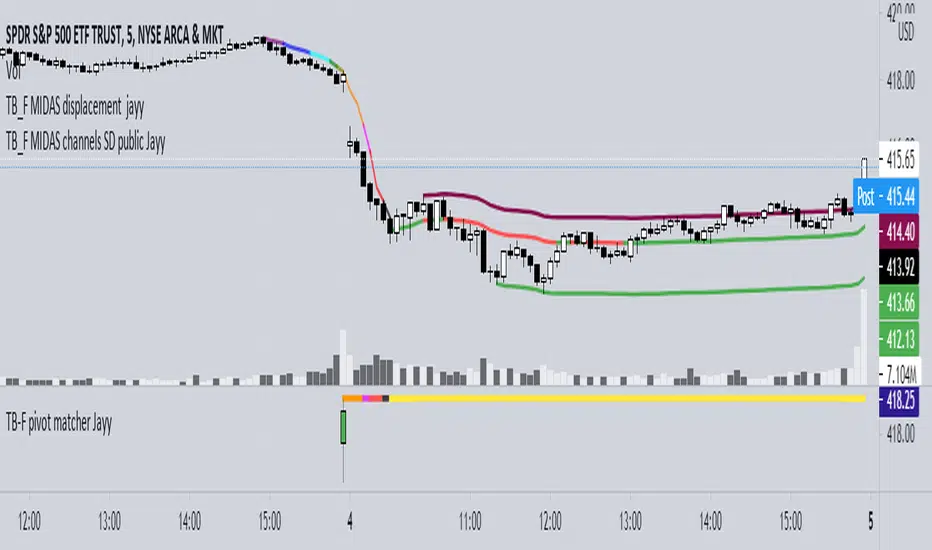
Top Bottom Finder Public version- Jayy This script plots a 6 algos from the Coles/Hawkins "Midas Technical Analysis" book:
Top finder / Bottom Finder (Levine Algo by Bob English)* - onlinelibrary.wiley.com
MIDAS VWAP Gen-1) -
MIDAS VWAP average and deltas
VWAP (Gen-1) using a date or a bar n number can be initiated at bar 0 - useful for a new IPO
Standard Deviation of MIDAS VWAP
MIDAS Displacement Channels (Coles) - edmond.mires.co
An%20Anchored%20VWAP%20Channel%20For%20Congested%20Markets.pdf
* for better results with topfinder and bottomfinder use the companion TB-F Matcher script.
See wiki for a synopsis: en.wikipedia.org
Relevant info can be found in: Midas Technical Analysis: A VWAP Approach to Trading and Investing in Today’s Markets by
Andrew Coles, David G. Hawkins Copyright © 2011 by Andrew Coles and David G. Hawkins.
Appendix C: TradeStation Code for the MIDAS Topfinder/Bottomfinder Curves ported to Tradingview
This script requires a working understanding of "Midas Technical Analysis" Google "Midas Technical Analysis" and a variety of information will appear.
To find fit the curve as described in the Midas book a companion script is required that will after a few manual iterative inputs guide you to the appropriate D value for the for input into this program ( see the TB-F Matcher script). You might also try the Midas average and Deltas as described in the book. I have added the 2nd, 3rd and 4th multiples of Delta.
The advantage is that there is no curve fitting. You still need to select a starting point for Midas or the topfinder bottomfinder (TB_F)
or the VWAP.
////////////////////////////////////////////////////////////////////////////////////////////////////////////////////////////
See the notes in the script below
Cheers Jayy
UCS_Top & Bottom CandleThis is an experimental Indicator based on Momentum. Picks the Top & Bottom Candle for most Swing. Please post your opinion or suggestion to improve this indicator.
I have not back tested this completely. This is recently developed Indicator.

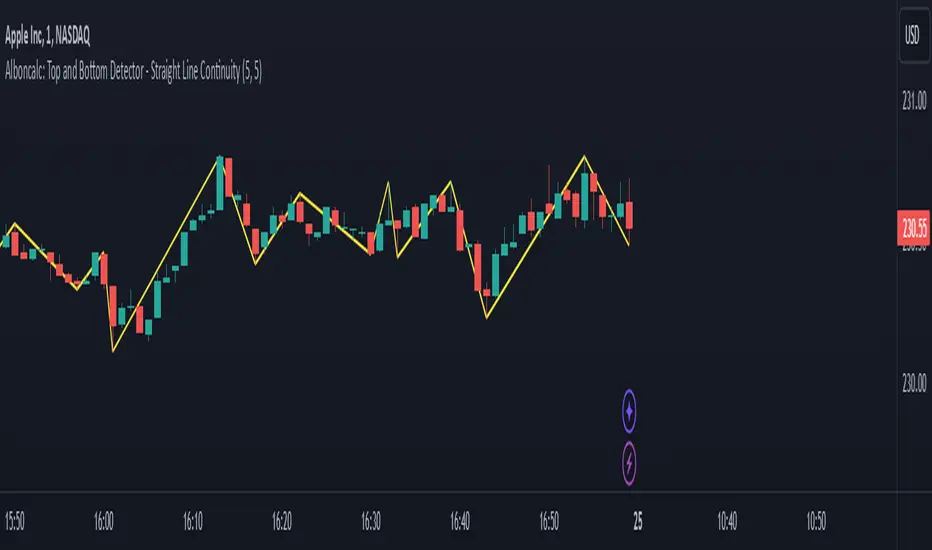
Alboncalc: Top and Bottom Detector - Straight Line ContinuityDescription:
The "Alboncalc: Top and Bottom Detector - Straight Line Continuity" is an innovative indicator for identifying key price reversal points (tops and bottoms) with precision. Unlike traditional indicators that focus on abstract data representations like oscillators or momentum-based lines, this indicator directly overlays the price chart. It draws a continuous line connecting highs and lows (tops and bottoms), providing traders with a clear and immediate visual representation of market swings. The lines automatically adjust in real-time, maintaining a straight path during trend continuations and only shifting when a trend reversal is detected.
Originality and Usefulness:
This indicator stands out from other tools available on TradingView due to its unique ability to maintain a continuous line across price swings, preserving accuracy and visual clarity. Most traditional top-and-bottom detectors merely mark points or provide indicators that are disconnected from price action, making it harder for traders to spot patterns. This script takes a different approach by drawing lines directly on the price chart, offering greater precision and better trend visualization. This innovation is particularly useful for traders who rely on visual cues and price action analysis to make decisions. It simplifies the process of identifying reversal points and trends without needing to rely on lagging indicators.
How It Works:
This indicator detects tops and bottoms based on user-defined periods. When the highest point in a given period is detected, it marks it as a top, and similarly, when the lowest point is detected, it marks it as a bottom. As the price moves, the indicator adjusts the lines to connect consecutive tops and bottoms. If the trend continues in the same direction (e.g., an uptrend), the line remains straight and extends. If a reversal is detected, a new line is drawn to connect the previous bottom (or top) to the new reversal point, providing an accurate visual representation of market trends.
How to Use:
1. Load the Indicator: Add the "Alboncalc: Top and Bottom Detector - Straight Line Continuity" to your chart from the TradingView script library.
2. Customize Settings: Adjust the "Top Period" and "Bottom Period" inputs to fine-tune the sensitivity of top and bottom detection based on your preferred timeframe.
3. Observe Price Action: As the price moves, the indicator will draw lines directly over the price chart, connecting tops and bottoms.
4. Interpret the Lines: Use the continuous lines to identify ongoing trends and potential reversal points. The line remains straight during trend continuation, indicating sustained movement in one direction. A new line signifies a reversal in the trend.
This tool is ideal for traders using trend-following strategies, breakout detection, or those who prefer clean, visual price action analysis (Only Tops and Bottons).
Underlying Concepts:
The core of this indicator is based on the highest high and lowest low concept, which is common in technical analysis. The logic is simple:
- A top is detected when the price reaches a high point compared to a user-defined number of prior candles (i.e., the `top_period`).
- A bottom is detected when the price hits a low point compared to the prior candles (i.e., the `bottom_period`).
When the price continues in the same trend, the line is extended without a break. This behavior ensures that trends are represented in a clear and consistent manner, which helps traders better identify trend continuations and reversals.
Code Breakdown:
```pinescript
//@version=5
indicator("Top and Bottom Detector - Straight Line Continuity", overlay=true)
```
- This initializes the indicator and specifies that it will overlay directly on the price chart.
```pinescript
var int top_period = input.int(5, title="Top Period", minval=1)
var int bottom_period = input.int(5, title="Bottom Period", minval=1)
```
- These inputs allow the user to customize the number of candles used to identify tops and bottoms. A higher period results in fewer but more significant top/bottom detections, while a lower period increases sensitivity.
```pinescript
isTop = ta.highest(top_period) == high
isBottom = ta.lowest(bottom_period) == low
```
- These lines check if the current candle has the highest high or the lowest low in the defined period. If true, the current price is either a top or a bottom.
```pinescript
var line currentLine = na
var float last_price = na
var int last_index = na
var bool isUpTrend = na
```
- These variables store the current line being drawn (`currentLine`), the last detected price (`last_price`), and the direction of the trend (`isUpTrend`). `last_index` tracks where the last top or bottom was detected.
```pinescript
if (isTop or isBottom)
if (not na(last_price))
if ((isTop and isUpTrend) or (isBottom and not isUpTrend))
line.set_xy2(currentLine, bar_index, (isTop ? high : low))
else
currentLine := line.new(x1=last_index, y1=last_price, x2=bar_index, y2=(isTop ? high : low), color=color.yellow, width=2)
last_price := (isTop ? high : low)
last_index := bar_index
isUpTrend := isTop
```
- The `if` block handles the logic of drawing the line. If a top or bottom is detected, and the trend continues (either an uptrend for tops or a downtrend for bottoms), the current line is extended using `line.set_xy2`. If a reversal is detected, a new line is drawn using `line.new`.
- The `last_price` and `last_index` variables are updated after each detection, and the `isUpTrend` flag is set based on whether a top or bottom was found.
Conclusion:
This indicator offers a more precise and visually intuitive way of identifying tops and bottoms directly on the price chart, making it an essential tool for traders focused on price action. Its ability to draw continuous lines through ongoing trends and adjust only upon a reversal makes it superior in terms of visual clarity compared to most conventional indicators.
TARVIS Labs - Bitcoin Macro Bottom/Top SignalsSCRIPT DESCRIPTION
This is a script specifically written to help provide indicators from a macro view. This script is best run on the 1 day interval on Bitstamp's $BTCUSD chart. It helps indicate when to accumulate bitcoin, and when its in a bull run when there are local tops, strong top warnings, and a signal to exit a bull run. This is described further below.
If you don't have interest in trading on the way to the top I suggest turning off the following indicators in the settings of the indicator:
- Opportunity To Buy Back In Indicator
- Local Top Near Bull Run Top Indicator
ACCUMULATION ZONE INDICATOR - LIGHT GREEN
Description
When we look at the history of Bitcoin every bottom has crossed below the 100 week EMA. Once it does its accompanied by hash ribbon cross with miner capitulation. After that is the prime time to accumulate as theres a clearer signal the bottom is in. Specifically, a signal to look for is the 14 day MACD/signal cross and the 14 day MACD continuing to stay above the signal until the price returns above the 100 week EMA. This is prime accumulation territory.
Strategy for Usage
A good strategy to use when accumulating the bottom is dollar-cost averaging over a 30 day period. The accumulation zone can last longer than 30 days but 30 days is a good range of time to DCA.
STRONG BUY IN ACCUMULATION ZONE INDICATOR - DARK GREEN
Description
We can add to the bottoming signal by looking for post-downtrend reversals inside the bottoming signal. We do this by using a 9/19 daily cross.
Strategy for Usage
These post-downtrend reversals can potentially provide better targeted days for accumulation than the broader bottoming signal and can be used to add more on that day than on an average day for the dollar cost average strategy. Say for example, use 1/3 of funds on these days rather than 1/30th.
OPPORTUNITY TO BUY BACK IN INDICATOR - BLUE
Description
When the 1d 18 EMA > 1d 63 EMA and the 12/52 1d crosses. These together provide good buy opportunities to buy bitcoin.
Strategy for Usage
If you happen to find yourself out of the market from your own TA or a trade, this signal can provide a buy opportunity to reenter the market if you're out of it.
BULL RUN LOCAL TOP INDICATOR - ORANGE
Description
We will similarly use the 100 week EMA to determine trend reversal into a bull run. When we see the 100 week EMA uptrending, we can begin to look for local tops using the 9/19 daily MACD/signal bearish cross along with the 12 EMA having a negative slope, which could be the beginning signal for a local top.
Strategy for Usage
This is a rather light indicator, but can be used in tandem with your own technical analysis to determine if you want to reenter after you exit from its signal.
LOCAL TOP NEAR BULL RUN TOP INDICATOR - RED
Description
When the 100 week EMA is in an uptrend we can look for significant loss of momentum in order to determine if a local top is in near a bull run top. Similar to the Bull Run Local Top Indicator, this strategy uses a MACD/signal cross but instead uses the 30/65 day EMAs.
Strategy for Usage
Ideally the right strategy to use here is to exit the market when this indicator starts. When the indicator ends if the "End of Bull Run Indicator" is not showing on the chart you can buy back into the market.
TOP IS LIKELY IN INDICATOR
Description
When the 100 week EMA is in a very strong uptrend and the 9/19 weekly MACD/signal bearish cross occurs, and the 63 EMA begins to downtrend.
Strategy for Usage
This signal typically accompanies the "Local Top Near Bull Run Top Indicator" therefore if you're following the strategy you would likely already be out of the market, but if you're not and this signal fires its a strong signal the top is in and we're likely going to start seeing a strong retrace. This is typically right before we see the "End of Bull Run Indicator". There is only one occurrence where it wasn't followed by a large drop & the "End of Bull Run Indicator" and that was in the 2017 bull run where there were many strong retracements post local top. The likelihood we see that again is low, but if it were to happen you can buy back into the market when the "Top is Likely In Indicator" and the "Local Top Near Bull Run Top Indicator" are not firing.
TOP IS LIKELY IN INDICATOR
Description
When the 100 week EMA is in a strong uptrend and the 9/19 weekly MACD/signal bearish cross occurs, and the 63 EMA begins to downtrend.
Strategy for Usage
This signal typically accompanies the "Local Top Near Bull Run Top Indicator" therefore if you're following the strategy you would likely already be out of the market, but if you're not and this signal fires its a strong signal the top is in and we're likely going to start seeing a strong retrace. This is typically right before we see the "End of Bull Run Indicator". There is only one occurrence where it wasn't followed by a large drop & the "End of Bull Run Indicator" and that was in the 2017 bull run where there were many strong retracements post local top. The likelihood we see that again is low, but if it were to happen you can buy back into the market when the "Top is Likely In Indicator" and the "Local Top Near Bull Run Top Indicator" are not firing.
END OF BULL RUN INDICATOR
Description
When the 100 week EMA is in an uptrend and the 1d 18 EMA crosses the 1d 63 EMA.
Strategy for Usage
When the 100 week EMA is a strong uptrend and the 18/63 cross occurs the top is very likely in. It has occurred in every bull run top leading to the bear market.

Extended SOPR Indicator - SSOPR Tops (A/B toggle)Extended SOPR Indicator — SSOPR Tops and Lows (A/B toggle)
Observation-only. Data: Glassnode SOPR.
Overview
This indicator extends the classical SOPR (Spent Output Profit Ratio) to improve readability and reduce noise on charts. SOPR measures whether coins moved on-chain were spent at a profit or at a loss. In brief: SOPR > 1 → spending at profit; SOPR < 1 → spending at loss. SSOPR (from "Smoothed SOPR") applies optional log transform (centers baseline at 0), smoothing (standard or adaptive), and adds structured signals: Z‑score lows (capitulation), buy zones , and top detection after prolonged elevation.
Why extend SOPR? (SSOPR vs classical SOPR)
• Noise reduction: Raw daily SOPR can whipsaw around its baseline. SSOPR uses smoothing and (optionally) adaptive smoothing so regimes are visible without overfitting.
• Better readability: The log transform shifts the break-even line to 0, making “profit territory” (above 0) and “loss territory” (below 0) visually intuitive on oscillators.
• Actionable context: Z‑score highlights extreme lows (capitulation risk), a simple buy-zone threshold marks potential accumulation, and a structured top pattern (with a time factor) helps frame distribution phases after sustained elevation.
What the script plots
• Smoothed SOPR (SSOPR): An orange line representing the smoothed SOPR (with optional log transform and optional adaptive smoothing).
• Top markers: A red triangle appears once at the onset of a confirmed top pattern.
• Background shading:
– Soft green: Buy zone when SSOPR falls below the “Buy Threshold.” (+ Z‑score capitulation zones (extreme lows)).
– Soft red: Top‑zone shading when the top criteria are met but before the single triangle fires.
Inputs & parameters
• Smoothing Length (default 14): Base window for smoothing SSOPR. Higher values = smoother, slower response.
• Apply Log Transform (default ON): Uses log(SOPR) so the baseline is 0 (log(1)=0). Above 0 → net profit regime; below 0 → net loss regime.
• Adaptive Smoothing (default OFF): Expands smoothing length as volatility rises using a standard deviation proxy; reduces whipsaws while preserving structure.
• Z‑score Threshold for Lows (default −2.5): Highlights capitulation zones when SSOPR deviates far below its rolling mean.
• SSOPR Buy Threshold (default −0.02): Simple rule-of-thumb level for potential accumulation context when below (log scale).
• SSOPR Top Threshold (default +0.005): Minimum elevation required for “profit territory” when assessing tops (log scale).
• Min Bars Above Threshold Before Top (default 50): Ensures prolonged elevation before calling a top.
• Lookback for Peak Detection (default 50): Window used to locate the recent high.
• Drop % from Peak to Confirm Top (default 5%): Confirms the start of distribution from a local high.
• Highlight Background : Toggles shaded zones.
Top detection (indicator-only)
A top fires when ALL of the following are true:
SSOPR spent at least Min Bars Above Threshold above the Top Threshold (sustained elevation).
The rising phase test passes (Option A or B; see below).
A drop from the local peak exceeds Drop % within the Lookback window.
The peak occurred in profit territory (SSOPR > Top Threshold).
To avoid repeated signals during the decline, the script emits the triangle once, at onset.
Rising‑phase switch: Option A vs Option B
• Option A — Up‑step ratio : Over the last A: Bars for Rising Check (default 50), it requires that at least A: Required Up‑Step Ratio (default 60%) of bars were rising (each bar compared to the previous). This favors gradual, persistent advances and filters out “choppy” lifts.
• Option B — Net slope : Compares current SSOPR to its value B: Bars Back for Net Slope ago (default 50). If higher, the series is considered rising. This is simpler and reacts faster in volatile phases but can admit brief pseudo‑trends.
Guidance : Prefer A for conservative confirmation in slow, persistent cycles; use B when trend moves are strong and you need timely detection.
Interpretation guide
• Regimes (log view): Above 0 → spending at profit; below 0 → spending at loss.
• Capitulation lows: When Z‑score < threshold, conditions often reflect forced/liquidity‑driven spending. Treat as context, not signals.
• Buy zone: SSOPR < Buy Threshold flags potential accumulation conditions (combine with price structure).
• Tops: After prolonged elevation, a confirmed top often coincides with profit‑taking/distribution phases.
Recommended timeframes
• Daily : Code optimized for daily timeframe.
Method summary
• SSOPR source: GLASSNODE:BTC_SOPR (via request.security ).
• Optional log transform: sopr → log(sopr) to normalize around 0.
• Smoothing: SMA over Smoothing Length , optionally adaptive using local volatility (std dev).
• Z‑score: (SSOPR − mean) / std dev, highlighting extreme lows.
• Top: Requires long elevation above Top Threshold , rising‑phase (A/B), and a subsequent drop > Drop % from recent high.
Limitations & notes
• SOPR reflects on‑chain movements; some activity occurs off‑chain (exchanges, internal transfers). Not all moves imply sale; aggregation makes it a usable proxy for profit/loss realization.
• Higher smoothing reduces noise but delays signals; adaptive smoothing can help but is still a trade‑off.
• Treat thresholds as context markers. They are not entry/exit signals by themselves.
• Use with price structure, volume, and other on‑chain indicators (e.g., realized price bands, dormancy/CDD) for confluence.
How to use (examples)
• Advance holding above 0 (log view): Retests of 0 from above that hold—while SSOPR remains elevated—often mark absorption; look for Top conditions only after sustained elevation and a confirmed drop from peak.
• Downtrend below 0: Rejections near 0 can align with continued loss realization; extreme Z‑score lows suggest capitulation risk—context for accumulation, not a blind buy.
Recommended settings
• Weekly: Log ON, Smoothing Length 14–30, Adaptive ON, Buy Threshold −0.02, Top Threshold +0.005, Rising Method A, Min Bars 50.
• Daily: Log ON, Smoothing Length 14–20, Adaptive OFF or ON (depending on noise), Rising Method B for timely slope checks.
Credits & references
• SOPR metric: Renato Shirakashi; documentation: Glassnode , CryptoQuant , overview: Bitbo .
Disclaimer
This script is for research/education on market behavior. It is not financial advice. Indicators provide context; decisions remain your responsibility.
Tags
bitcoin, btc, on‑chain, sopr, ssopr, glassnode, oscillator, regime, distribution, capitulation

TARVIS Labs - Alts Macro Bottom/Top SignalsSCRIPT DESCRIPTION
PLEASE READ THROUGH THIS CAREFULLY.
This is a script specifically written to help provide indicators from a macro view for ALTS. This script needs to be run on the 1 day. It helps indicate when to accumulate alts, and when its in a bull run when this a bull run top beginning to form with warnings, and a indicator that a top is in. This is described further below.
NOTE - in order to accomodate most alts the script had to be broad enough in its indicators to cover many different scenarios. If you are trading a smaller altcoin I suggest taking a more conservative approach to accumulation.
FAQs:
1. Why is there no accumulation zone showing up before an uptrend?
This could be because the trend has been so strong for this coin that there hasn't been a strong enough signal to accumulate or this could be that the chart doesnt have enough historical data (needs over 2 years) for the indicators to flash green.
2. Why is there no tops shown for a chart Im looking at?
This is either because there isn't enough historical data (needs over 2 years) for the indicators to build or because the altcoin didnt perform as well as the rest of the market. The altcoin has to perform as well as the market over the length of the bull run in order for the signals to show. Typically an altcoin that shows sharp increases and sharp drops shortly after will not have signals show up.
3. The "Potential End of Bull Run Top Indicator" showed up but we weren't near the top yet, why is that?
The alts indicator has to work across many altcoins, and their trends are not all the same. This can lead to the indicator showing but not necessarily being the exact top. The data from the alts macro bottom/top signals should be paired with the "TARVIS Labs bitcoin macro bottom/top signals" indicator for BTC. The reasoning is because if the top is not showing that its in for Bitcoin its likely that the altcoin's top is also not in. You should use the two in tandem to know if the bull run top is very likely in.
ACCUMULATION ZONE INDICATOR - LIGHT GREEN
Description
When we look at the general crypto landscape, the 200d & 300d EMAs are extremely useful. We can use their cross and momentum in order to determine a bottom forming. If the price has fallen over 40% below the 200 day EMA and the 200 day EMA has crossed below the 300d EMA, its a downtrend with a steep fall, which could indicate a good time to accumulate. When we see the 200 day EMA's slope drop drastically (over 5% w/w) it is also a good signal to accumulate.
Strategy for Usage
For alts, the strategy can vary drastically. You need to take into account:
1. the market cap of the altcoin, is it a smaller market cap altcoin or a larger one?
2. historical trend, does it typically trend strongly with a smaller accumulation zone?
Once you've taken these into account you can form a strategy. For example, if the altcoin has had smaller accumulation zones historically you'll want to take advantage of the accumulation zones when they pop up and be more aggressive (say a 30 day accumulation). If the altcoin has historically had longer accumulation zones then you'll want to be more conservative with your strategy and potentially have a 100 day (or even longer) accumulation period. If the altcoin is a smaller market cap alt, you will want to also take that into account. You'll want to likely be more conservative,
STRONG BUY IN ACCUMULATION ZONE INDICATOR - DARK GREEN
Description
We can add to the bottoming signal by looking for strong downtrends inside the bottoming signal. We do this by seeing when the 36 day EMA has a slope decreasing by 2% day/day.
Strategy for Usage
These strong downtrend days can be used to add more to our accumulation strategy. We can add more on these days (ex. double what you were planning to on a typical accumulation day).
LOCAL TOP NEAR BULL RUN TOP INDICATOR - RED
Description
When the 100 week EMA is in a strong uptrend (4% increase w/w) we can look for significant loss of momentum in order to determine if a local top is in near a bull run top. This strategy uses a MACD with 9/36/9 config for the daily chart. We look for the signals momentum loss, when the slope becomes negative.
Strategy for Usage
Ideally the right strategy to use here is to exit the market when this indicator starts. When the indicator ends if the "Potential End of Bull Run Top Indicator" is not showing on the chart you can buy back into the market.
POTENTIAL END OF BULL RUN TOP INDICATOR - DARK RED
Description
When the 100 week EMA is in a strong uptrend (3% increase w/w), and a MACD config of 108/234/9 has a negative signal slope signifying a very large momentum loss, but the 1d 18 EMA is still above the 1d 63 EMA we show this signal.
Strategy for Usage
This is a strong indicator that the top is in, and it potentially being the bull run top. Because alts can vary strongly in their charts, this should be a strong warning but not necessarily a certainty that the bull run is over.

Pi Cycle BTC Top + Pre-Alert BandsPi Cycle BTC Top + Pre-Alert Bands is an advanced implementation of the classic Pi Cycle Top model, designed for Bitcoin cycle analysis on higher timeframes (especially 1D BTCUSD/BTCUSD·INDEX).
The original Pi Cycle Top uses two moving averages:
• 111-day SMA (short MA)
• 350-day SMA ×2 (long MA)
A Pi Top is signaled when the 111 SMA crosses above the 350×2 SMA. Historically, this has occurred near major BTC cycle highs.
This script extends that idea with a 3-step early-warning sequence:
• Pi Green – early compression: short/long MA ratio crosses upward into the green band (convergence from below is required).
• Pi Yellow – mid-cycle warning: only fires if a valid Green has already occurred in the same cycle.
• Pi Cycle Top – final top: the classic Pi Cycle cross, limited to one top signal per cycle. After a top, no new Yellow or Top signals can appear until a new Green event starts the next cycle.
Background shading shows the active phase (Green / Yellow / late-cycle zone), so you can see at a glance where BTC is within its Pi-based macro structure.
All logic is non-repainting: request.security() uses lookahead_off and no future data is accessed.
Typical use
This indicator is intended as a macro-cycle timing and risk-awareness tool, not a stand-alone entry system. Many traders use it to:
• Watch for Pi Green as the start of a potential late-cycle advance.
• Treat Pi Yellow as a rising-risk environment and tighten risk management.
• Use the Pi Cycle Top as a historical high-risk zone where large profit-taking or hedging may be considered.
Always combine this with your own analysis (trend, volume, on-chain, macro) before making decisions.
How to set alerts
Add the indicator to your chart (1D BTCUSD or BTCUSD·INDEX recommended).
Click Alerts → Condition → Pi Cycle BTC Top + Pre-Alert Bands.
Choose one of:
• Pi Cycle – Green Pre-Alert (early convergence)
• Pi Cycle – Yellow Pre-Alert (after Green only)
• Pi Cycle – TOP (Single per Cycle, after Green)
Use “Once per bar close” for higher-timeframe reliability.
Disclaimer
This tool is for educational and analytical purposes only. The Pi Cycle concept is based on historical behavior and does not guarantee future results. This is not financial advice; always do your own research and manage risk appropriately.

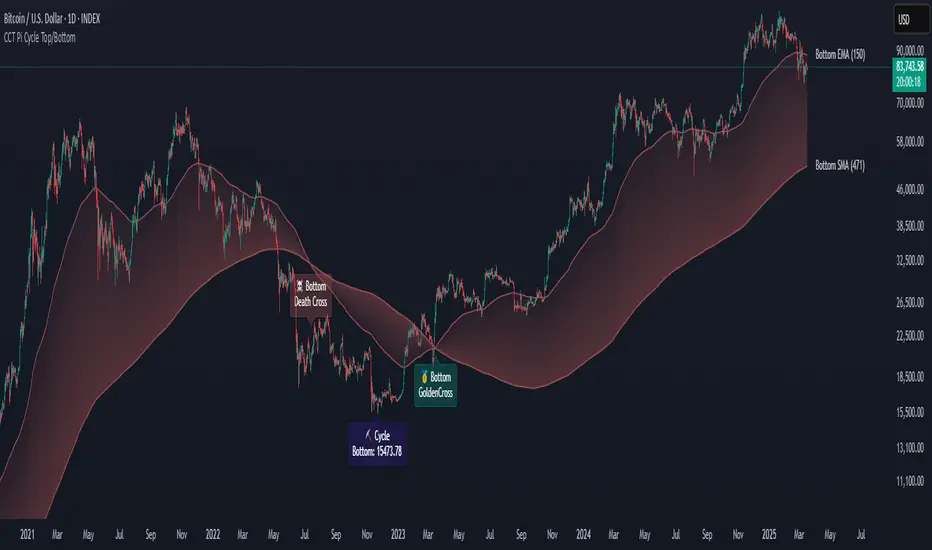
CCT Pi Cycle Top/BottomPi Cycle Top/bottom: The Ultimate Market Cycle Indicator
Introduction
The Pi Cycle Top/bottom Indicator is one of the most reliable tools for identifying Bitcoin market cycle peaks and bottoms. Its effectiveness lies in the strategic combination of moving averages that historically align with major market cycle reversals. Unlike traditional moving average crossovers, this indicator applies an advanced iterative approach to pinpoint price extremes with higher accuracy.
This version, built entirely with Pine Script™ v6, introduces unprecedented precision in detecting both the Pi Cycle Top and Pi Cycle Bottom, eliminating redundant labels, optimizing visual clarity, and ensuring the indicator adapts dynamically to evolving market conditions.
What is the Pi Cycle Theory?
The Pi Cycle Top and Pi Cycle Bottom were originally introduced based on a simple yet profound discovery: key moving average crossovers consistently align with macro market tops and bottoms.
Pi Cycle Top: The crossover of the 111-day Simple Moving Average (SMA) and the 350-day SMA multiplied by 2 has historically signaled market tops with astonishing accuracy.
Pi Cycle Bottom: The intersection of the 150-day Exponential Moving Average (EMA) and the 471-day SMA has repeatedly marked significant market bottoms.
While traditional moving average strategies often suffer from lag and false signals, the Pi Cycle Indicator enhances accuracy by applying a range-based scanning methodology, ensuring that only the most critical reversals are detected.
How This Indicator Works
Unlike basic moving average crossovers, this script introduces a unique iteration process to refine the detection of Pi Cycle points. Here’s how it works:
Detecting Crossovers:
Identifies the Golden Cross (bullish crossover) and Death Cross (bearish crossover) for both the Pi Cycle Top and Pi Cycle Bottom.
Iterating Through the Cycle:
Instead of plotting a simple crossover point, this script scans the range between each Golden and Death Cross to identify the absolute lowest price (Pi Cycle Bottom) and highest price (Pi Cycle Top) within that cycle.
Precision Labeling:
The indicator dynamically adjusts label positioning:
If the price at the crossover is below the fast moving average → the label is placed on the moving average with a downward pointer.
If the price is above the fast moving average → the label is placed below the candle with an upward pointer.
This ensures optimal visibility and prevents misleading signal placement.
Advanced Pine Script v6 Features:
Labels and moving average names are only shown on the last candle, reducing chart noise while maintaining clarity.
Offers full user customization, allowing traders to toggle:
Pi Cycle Top & Bottom visibility
Moving average labels
Crossover labels
Why This Indicator is Superior
This script is not just another moving average crossover tool—it is a market cycle tracker designed for long-term investors and analysts who seek:
✔ High-accuracy macro cycle identification
✔ Elimination of false signals using an iterative range-based scan
✔ Automatic detection of market extremes without manual adjustments
✔ Optimized visuals with smart label positioning
✔ First-of-its-kind implementation using Pine Script™ v6 capabilities
How to Use It?
Bull Market Tops:
When the Pi Cycle Top indicator flashes, consider the potential for a market cycle peak.
Historically, Bitcoin has corrected significantly after these signals.
Bear Market Bottoms:
When the Pi Cycle Bottom appears, it suggests a macro accumulation phase.
These signals have aligned perfectly with historical cycle bottoms.
Final Thoughts
The Pi Cycle Top/bottom Indicator is a must-have tool for traders, investors, and analysts looking to anticipate long-term trend reversals with precision. With its refined methodology, superior label positioning, and cutting-edge Pine Script™ v6 optimizations, this is the most reliable version ever created.
Volume Stack US Top 40 [Pt]█ Overview
Volume Stack US Top 40 is a versatile TradingView indicator designed to give you an at-a-glance view of market sentiment and volume dynamics across the top 40 U.S. large-cap stocks. Inspired by the popular Saty Volume Stack, this enhanced version aggregates essential volume and price strength data from major tickers on both the NYSE and NASDAQ, and works seamlessly on all timeframes.
█ Key Features
Dynamic Buy / Sell Volume Stack: This indicator dynamically stacks the volume bars so that the side with higher volume appears on top. For example, green over red signals more buy-side volume, while red over green indicates greater sell-side volume.
Cross-Market Analysis: Easily toggle between NYSE and NASDAQ to analyze the most influential U.S. stocks. The indicator automatically loads the correct set of tickers based on your selection.
Flexible Coverage: Choose from Top 10, Top 20, Top 30, or Top 40 tickers to tailor the tool to your desired scope of analysis.
Dynamic Table Display: A neat on-chart table lists the selected ticker symbols along with visual cues that reflect each stock’s strength. You can even remove exchange prefixes for a cleaner look.
█ Inputs & Settings
Market Selector: Choose whether to view data from the NYSE or NASDAQ; the indicator automatically loads the corresponding list of top tickers.
Number of Tickers: Select from ‘Top 10’, ‘Top 20’, ‘Top 30’, or ‘Top 40’ stocks to define the breadth of your analysis.
Color Options: Customize the colors for bullish and bearish histogram bars to suit your personal style.
Table Preferences: Adjust the on-chart table’s display style (grid or one row), text size, and decide whether to show exchange information alongside ticker symbols.
█ Usage & Benefits
Volume Stack US Top 40 is ideal for traders and investors who need a clear yet powerful tool to gauge overall market strength. By combining volume and price action data across multiple major stocks, it helps you:
Quickly assess whether the market sentiment is bullish or bearish.
Confirm trends by comparing volume patterns against intraday price movements.
Enhance your trading decisions with a visual representation of market breadth and dynamic buy/sell volume stacking.
Its intuitive design means you spend less time adjusting complex settings and more time making confident, informed decisions.

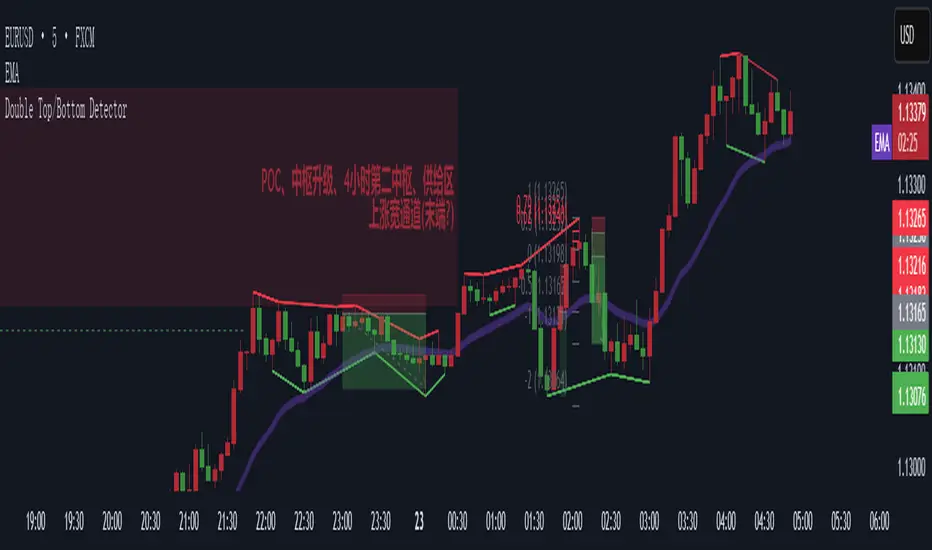
Double Top/Bottom [AlgoAlpha]Introducing the Double Top/Bottom Indicator by AlgoAlpha, a powerful tool designed to identify key reversal patterns in the market with precision. This indicator meticulously detects double tops and double bottoms, helping traders recognize potential trend reversals and make informed trading decisions.
Key Features:
🔍 Pattern Detection : Accurately identifies double top and double bottom formations based on customizable time horizons.
🎨 Customizable Appearance : Choose your preferred colors for bullish and bearish trends to match your trading style.
📊 Signal Labels : Option to display only the second pivot of the double top/bottom for a cleaner chart view.
🔧 Flexible Settings : Adjust the time horizon to control the look-back period, allowing for detection of both short-term and long-term patterns.
📈 Visual Enhancements : Draws trend lines and fills between pivotal points to visually highlight potential reversal zones.
🔔 Alerts : Set up alerts for potential double top and double bottom formations to stay informed of key market movements.
How to Use the Double Top/Bottom Indicator :
🛠 Add the Indicator : Simply add the Double Top/Bottom Indicator to your TradingView chart from your favorites. Customize the time horizon and appearance settings to fit your trading preferences.
📊 Analyze Patterns : Watch for the identified double top and double bottom patterns along with the corresponding trend lines and filled areas to anticipate potential market reversals.
🔔 Set Alerts : Enable alerts to receive notifications when double top or double bottom patterns are detected, ensuring you never miss a critical trading opportunity.
How It Works : The indicator scans the price action for pivot highs and lows within a specified time horizon, identifying potential double top and double bottom patterns. It maintains a sequence of these pivots and verifies the formation of these patterns based on the relationship between consecutive pivots and the proximity to a defined limit. When a double top or double bottom is confirmed, the indicator marks the second pivot point with a label and draws trend lines to visualize the reversal pattern. Additionally, it provides alert conditions to notify traders of potential confirmations, enhancing decision-making without cluttering the chart.
⚠️ Important Reminder : The labels indicating double tops and bottoms appear with a delay and are intended to mark the formations after they have already formed. They are not meant to be used as real-time trading signals. While they align perfectly with pivot points in hindsight, please use them as markers for analysis rather than immediate trading triggers.

Volatility Calculator for Daily Top and Bottom RangeWith the usage of ATR, applied on the close of the daily candle, I am calculated the volatility channels for the TOP and BOTTOM
Based on this logic, we can estimate, with a huge confidence factor, where the prices are going to be compressed for the trading day.
Having said that, lets take a look at the data gathered among the most important financial markets:
SPX
TOP CROSSES : 2116
BOT CROSSES : 1954
Total Daily Candles : 18908
Occurance ratio = 0.215
NDX
TOP CROSSES : 1212
BOT CROSSES : 1183
Total Daily Candles : 9386
Occurance ratio = 0.255
DIA
TOP CROSSES : 759
BOT CROSSES : 769
Total Daily Candles : 6109
Occurance ratio = 0.25
DXY
TOP CROSSES : 1597
BOT CROSSES : 1598
Total Daily Candles : 13156
Occurance ratio = 0.243
DAX
TOP CROSSES : 1878
BOT CROSSES : 1848
Total Daily Candles : 13155
Occurance ratio = 0.283
BTC USD
TOP CROSSES : 416
BOT CROSSES : 417
Total Daily Candles : 4290
Occurance ratio = 0.194
ETH USD
TOP CROSSES : 247
BOT CROSSES : 268
Total Daily Candles : 2452
Occurance ratio = 0.21
EUR USD
TOP CROSSES : 820
BOT CROSSES : 805
Total Daily Candles : 7489
Occurance ratio = 0.217
GOLD
TOP CROSSES : 1722
BOT CROSSES : 1569
Total Daily Candles : 13747
Occurance ratio = 0.239
USOIL
TOP CROSSES : 1077
BOT CROSSES : 1089
Total Daily Candles : 10231
Occurance ratio = 0.212
US 10Y
TOP CROSSES : 1302
BOT CROSSES : 1365
Total Daily Candles : 9075
Occurance ratio = 0.294
Based on this, we can assume with a very high confidence ( 70-80%) that the market is going to stay, within the range created from the BOT and TOP ATR points.

Bull Flag & Flat Top Breakout DetectorBull Flag & Flat Top Detector - Quick Reference Guide
Pattern Overview
🚩 Bull Flag
╱╲
╱ ╲ ← Pullback (2-5 red candles)
╱ ╲
╱ ╲____
╱ ╲
│ │
│ THE POLE │ ← Strong upward move (3+ green candles)
│ │
└──────────────┘
What to look for:
Strong initial move (the "pole") - 3+ green candles, 3%+ move
Brief pullback - 2-5 candles, less than 50% retracement
Pullback should "drift" lower, not crash
Entry on first candle to make new high after pullback
📊 Flat Top Breakout
════════════════ ← Resistance (multiple touches)
↑ ↑ ↑
╱╲ ╱╲ ╱╲
╱ ╲╱ ╲╱ ╲ ← Consolidation
╱ ╲
╱ ╲
What to look for:
Multiple touches of same resistance level (2+)
Tight consolidation range
Each failed breakout builds pressure
Entry on convincing break above resistance with volume
Signal Types
SignalShapeColorMeaningBull Flag Breakout▲ TriangleLimeEntry signal - go longFlat Top Breakout◆ DiamondAquaEntry signal - go longBear Flag Breakout▼ TriangleRedShort entry (if enabled)Pattern Forming🚩 FlagFaded GreenBull flag developingPattern Forming■ SquareFaded BlueFlat top developing
Level Lines Explained
LineColorStyleMeaningEntryLimeSolidBreakout trigger priceStop LossRedDashedExit if price falls hereTarget 1AquaDottedFirst profit target (2R)Target 2YellowDottedSecond profit target (3R)
Info Table Reference
FieldWhat It ShowsBull FlagScanning / Forming 🚩 / Breakout ✓Flat TopScanning / Forming 📊 / Breakout ✓PullbackCandle count + retracement %Rel VolumeCurrent bar vs averageEMA 20Above ✓ or Below ✗VWAPAbove ✓ or Below ✗Green StreakConsecutive green candles (pole)ResistanceTouch count for flat top
Trading Checklist
Before Entry ✅
Pattern status shows "FORMING" or "BREAKOUT"
Price above EMA (table shows ✓)
Price above VWAP (table shows ✓)
Relative volume 1.5x+ (ideally 2x+)
Stock is in play (up 5%+ on day, has catalyst)
Market direction supportive (not fighting trend)
Entry Execution
Wait for breakout candle to form
Confirm volume spike on breakout
Enter as close to entry line as possible
Set stop loss at red dashed line
Know your target levels
Trade Management
If no immediate follow-through → consider exit ("breakout or bailout")
Take 50% off at Target 1
Move stop to breakeven
Let remainder run toward Target 2
Exit fully if price returns below entry
Bull Flag Quality Checklist
Pole Quality:
FactorIdealAcceptableAvoidGreen candles5+3-4Less than 3Move size10%+3-10%Less than 3%VolumeIncreasingSteadyDecliningCandle bodiesLargeMediumSmall/doji
Pullback Quality:
FactorIdealAcceptableAvoidCandle count2-34-56+RetracementUnder 38%38-50%Over 50%VolumeDecliningSteadyIncreasingCharacterOrderly driftChoppySharp drop
Flat Top Quality Checklist
FactorGood SetupWeak SetupTouches3+ at same levelOnly 2, widely spacedToleranceVery tight (0.2%)Loose (1%+)Duration5-15 barsToo short or too longVolumeDrying upErraticPrior trendUpSideways/down
Common Mistakes to Avoid
❌ Entering too early
Wait for actual breakout, not anticipation
"Forming" ≠ "Breakout"
❌ Ignoring volume
No volume = likely false breakout
Require 1.5x+ relative volume minimum
❌ Fighting the trend
Check EMA and VWAP status
Both should be ✓ for high probability
❌ Wide stops
Stop should be below pullback low
If stop is too wide, skip the trade
❌ Holding losers
"Breakout or bailout" - if it doesn't work, exit
Failed breakouts often reverse hard
❌ Chasing extended moves
If you missed entry, wait for next pattern
Don't chase 5+ candles after breakout
Risk Management Rules
Position Sizing
Risk Amount = Account × Risk % (typically 1-2%)
Position Size = Risk Amount ÷ (Entry - Stop)
Example:
Account: $25,000
Risk: 1% = $250
Entry: $5.00
Stop: $4.70
Risk per share: $0.30
Position Size: $250 ÷ $0.30 = 833 shares
Risk-Reward Targets
TargetR MultipleExample (risk $0.30)Target 12:1+$0.60 ($5.60)Target 23:1+$0.90 ($5.90)
Timeframe Guide
TimeframeProsConsBest For1-minMore patterns, precise entryNoisy, false signalsScalping5-minGood balance, cleaner patternsFewer signalsDay trading15-minHigh quality patternsMiss fast movesSwing entries
Settings Quick Reference
Default Settings (Balanced)
Pole: 3 candles, 3% move
Pullback: 2-5 candles, 50% max retrace
Volume: 1.5x required
Filters: EMA + VWAP ON
Aggressive Settings
Pole: 2 candles, 2% move
Pullback: 2-6 candles, 60% max retrace
Volume: 1.2x required
Filters: VWAP OFF
Conservative Settings
Pole: 4 candles, 5% move
Pullback: 2-4 candles, 40% max retrace
Volume: 2.0x required
Filters: Both ON
Alert Setup
Recommended Alerts
"Bull Flag Forming"
Get early warning as pattern develops
Prepare your position size and levels
"Bull Flag Breakout"
Primary entry alert
React quickly when triggered
"Any Bullish Breakout"
Catch both bull flags and flat tops
Good for watchlist scanning
Alert Setup Steps
Right-click chart → Add Alert
Condition: Select "Bull Flag & Flat Top Breakout Detector"
Choose alert type from dropdown
Set expiration and notification method
Troubleshooting
Q: Patterns not detecting?
Lower the Min Pole Move % setting
Reduce Min Pole Candles requirement
Check that price is in acceptable range
Q: Too many false signals?
Increase volume multiplier to 2.0x
Enable both EMA and VWAP filters
Increase Min Pole Move %
Q: Levels not showing?
Enable "Show Entry Line", "Show Stop Loss", "Show Targets"
Check "Max Patterns to Display" setting
Q: Info table not visible?
Enable "Show Info Table" in settings
Try different table position
Pattern Combinations
Best Setups (A+ Quality)
Bull flag on a gap day (Gap & Go → Bull Flag)
Flat top at pre-market high resistance
Pattern forming above VWAP with 5x+ volume
Avoid These
Bull flag below VWAP
Flat top in downtrending stock
Low volume patterns
Patterns late in the day (after 2pm)
Daily Routine
Pre-Market (7-9am)
Build watchlist of gappers (5%+, high volume)
Apply indicator to top 3-5 candidates
Note pre-market levels
Market Open (9:30-10:30am)
Watch for "FORMING" status on watchlist
Prepare entries as patterns develop
Execute on breakout signals
Manage trades according to plan
Midday (10:30am-2pm)
Look for second-wave patterns
Be more selective (less momentum)
Consider tighter stops
Close (2-4pm)
Generally avoid new patterns
Manage existing positions
Review day's trades

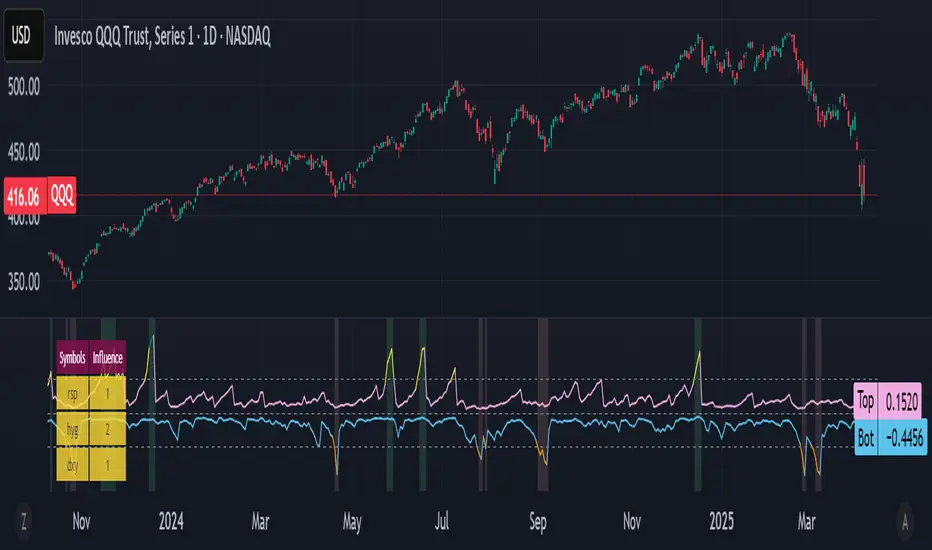
Bottom and Top finder [theUltimator5]🧭 Bottom and Top Finder — Multi-Symbol Momentum Divergence Detector
The Bottom and Top Finder by theUltimator5 is a highly configurable, momentum-based indicator designed to identify potential market reversal points using a multi-symbol relative strength comparison framework. It evaluates Directional Movement Index (DMI) values from up to three correlated or macro-influential assets to determine when the current instrument may be approaching a bottom (oversold exhaustion) or a top (overbought exhaustion).
🧠 How It Works
This script computes both the +DI (positive directional index) and -DI (negative directional index) for:
The currently selected chart symbol
Up to three user-defined reference symbols (e.g., sector leaders, macro ETFs, currencies, volatility proxies)
It uses a logarithmic percent-change approach to normalize all movement metrics, ensuring results are scale-invariant and price-neutral — meaning it works consistently whether a stock trades at $1 or $100,000. This makes the comparison between different assets meaningful, even if they trade on different scales or volatility levels.
The indicator then:
Compares the +DI values of the reference symbols to the current symbol’s +DI → seeking bottoming signals (suggesting the current symbol is unusually weak).
Compares the -DI values of the reference symbols to the current symbol’s -DI → seeking topping signals (suggesting the current symbol is unusually strong on the downside).
These comparisons are aggregated using a weighted average, where you control the influence (multiplier) of each reference symbol.
🔁 Trigger Logic
The indicator generates two dynamic lines:
Bot Line (Bottom Line): Based on reference +DI vs. current +DI
Top Line: Based on reference -DI vs. current -DI
If the Bot Line rises above the user-defined threshold, it may signal that capitulation or oversold conditions are developing. Similarly, if the Top Line rises above its threshold, it may indicate a blow-off top or overbought selling pressure.
To avoid false positives, a second smoothing-based condition must also be met:
The line must significantly exceed its moving average, confirming momentum divergence.
When both conditions are true, the indicator highlights the background in light red (bottom alert) or green (top alert) for easy visual scanning.
🔧 Key Inputs & Customization
You can fine-tune this tool using the following parameters:
Smoothing Length: Controls how smooth or sensitive the DI values are.
Reference Symbols: Up to 3 assets (default: RSP, HYG, DXY) — customizable for sector, macro, or inverse relationships.
Influence Multipliers: Adjust the weight each symbol has on the overall signal.
Display Options:
Toggle to highlight the chart background during trigger conditions.
Toggle to display a real-time table of reference symbols and their influence levels.
📈 Visual Output
Two plotted lines: One for bottoms and one for tops
Dynamically colored based on how far they exceed thresholds
Background highlights to mark trigger zones
Optional table displaying the current reference symbol setup and weights
🛠 Best Use Cases
This tool is ideal for:
Identifying short-term tops or bottoms using momentum exhaustion
Spotting divergences between an asset and broader market or sector health
Macro analysis with assets like SPY, QQQ, GME, MSFT, BTC, etc...
Pair trading signals or market breadth confirmation/disagreement
It complements other technical indicators like RSI, MACD, Bollinger Bands, or price structure patterns (double bottoms/tops, etc.)
Double Tops & Bottoms [QuantVue]This indicator is designed to detect and plot Double Tops and Double Bottoms, by setting the initial high or low using standard pivot points.
Double Tops
A Double Top is a bearish reversal pattern, typically found when an uptrend returns back to a prior peak. It signifies a potential turning point or resistance level and could potentially reverse in direction.
The pattern is confirmed as a Double Top when the price breaks above the resistance level, but closes below it. A decisive close below this level is seen as a confirmation of the bearish trend.
Double Bottoms
A Double Bottom, on the other hand, is a bullish reversal pattern typically found after a downtrend. It signals a potential turning point or support level where the price has bottomed and could potentially reverse upwards.
The pattern is confirmed as a Double Bottom when the price breaks below the support level, but closes above it. A decisive close above this level is viewed as a confirmation of the bullish trend.
Indicator Features
🔹Double Top Detection: When a double top is identified, a downward-pointing triangle will be plotted above the bar, and if the alerts are enabled, a notification will be triggered.
🔹Double Bottom Detection: When a double bottom is identified, an upward-pointing triangle will be plotted below the bar, and if the alerts are enabled, a notification will be triggered.
🔹Pivot Lookback: Defines the number of bars to the left and right of the pivot that must be lower/higher to qualify as a pivot.
🔹Maximum Length Between Tops/Bottoms: Maximum number of bars between two tops/bottoms to be considered a double top or bottom.
🔹Style Settings: Allows the user to customize the appearance of the lines indicating the tops/bottoms. Options include color selection, line style (dotted, dashed, or solid), and line thickness.
🔹Alerts: The user can enable or disable alerts for Double Top and Double Bottom.
Give this indicator a BOOST and COMMENT your thoughts!
We hope you enjoy.
Cheers!

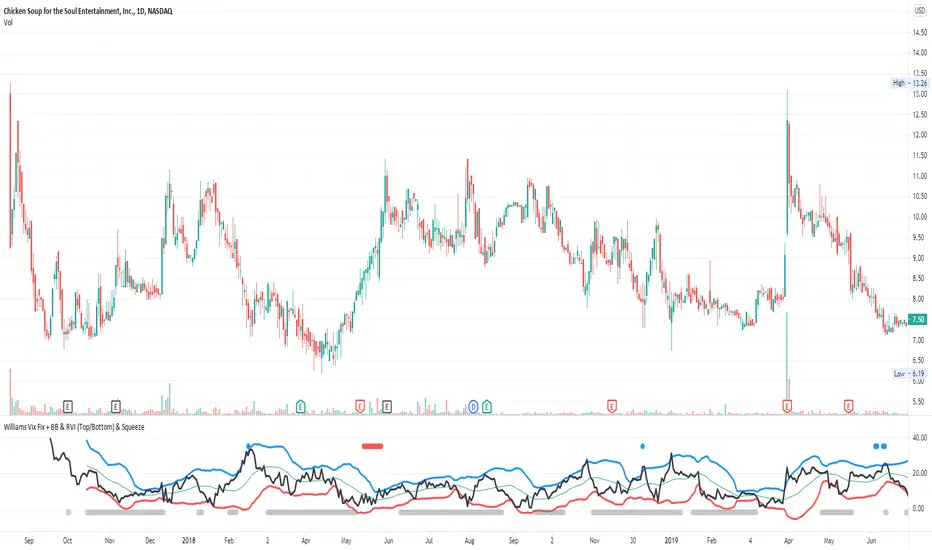
Williams Vix Fix + BB & RVI (Top/Bottom) & SqueezeLegend :
- When line touches or crosses red band it is Top signal (Williams Vix Fix)
- When line touches or crosses blue band it is Bottom signal (Williams Vix Fix)
- Red dot at the top of indicator is a Top signal (Relative Volatility Index)
- Blue dot at the top of indicator is a Bottom signal (Relative Volatility Index)
- Gray dot at the bottom of indicator is a Squeeze signal
This is an attempt to make use of the main features of all 4 of these very popular Volatility tools :
- Williams Vix Fix + Bollinger Bands (as per Larry Williams idea, link )
- Relative Volatility Index (RVI)
- The crossing of Keltner Channel by the Bollinger Bands (Squeeze)
The goal is to find the best tool to find bottoms and top relative to volatility . This is a simple combination, but I find it very useful personally
(no need to reinvent the wheel, just need to find what works best)
The idea is that Williams Vix Fix + Bollinger Bands already give the main volatility bottom and top (Bottom are more accurate).
So instead of trying to modify it, I chose to compliment it by mapping with points when the Relative Volatility Index (RVI) reached the
top/bottom thresholds (red dot means top and blue dot means bottom). That way we can easily see when both indicators find a top or bottom relative
to volatility (of course this needs to be then confirmed with a momentum indicator rally).
In addition, I added the squeeze because this quickly shows the potential breakouts.
For ideas on how to continue this work, it would be very interesting to be able to create a probability of a bottom and top relative to volatility using the
Williams Vix Fix + Bollinger Bands and "Relative Volatility Index" signals as both work well and give top or bottom the other doesn't see.
Reversal Radars — Berk v2.0 (Bottom & Top)1) Combined script (Dip+Tepe)
Title:
Reversal Radars — Berk v2.0 (Bottom & Top)
Description (EN):
What it does
Two high-probability reversal detectors in one indicator: a Bottom Reversal Radar (long bias) and a Top Reversal Radar (short/hedge bias). Each radar aggregates multiple conditions into a single score and triggers when Score ≥ Threshold.
How it works
RSI regime shift: Bottom = recovery after oversold (touched 30, crosses up 35). Top = roll-over from overbought (touched 70, crosses down 65).
MACD cross: Bull (up) for bottoms, Bear (down) for tops.
EMA8 filter: Close above (bottom) / below (top) EMA(8).
Structure break (BOS): Close above recent swing high / below recent swing low (lookbackBars, using precomputed highest/lowest to avoid inconsistencies).
EMA200 proximity: Price within a configurable band (default −5% … +2%).
Volume expansion: Volume ≥ SMA(20) × multiplier (default 1.5×).
Divergence: Pivot-confirmed (3/3) bullish (bottom) or bearish (top) RSI divergence.
Scoring: RSI shift +2, divergence +2, MACD +1, EMA8 +1, BOS +1, Volume +1, EMA200 band +1.
Signals & Alerts
Bottom: label “DÖNÜŞ↑” and alert “Dipten Dönüş — Ana Sinyal” when scoreLong ≥ thrLong.
Top: label “DÖNÜŞ↓” and alert “Tepeden Dönüş — Ana Sinyal” when scoreShort ≥ thrShort.
Use Once per bar close for stable alerts.
Inputs
lenRSI, rsiOS=30, rsiRecover=35, rsiOB=70, rsiFall=65, volLen=20, volMult=1.5, lookbackBars=5, ema200 band (−5…+2%), thrLong/thrShort, toggles for Bottom/Top.
Timeframes & tips
Best on Daily/4H. Tighten thresholds (e.g., 4) and raise volume multiplier (1.8–2.0×) on lower TFs or thin liquidity.
No-repaint note
Evaluated on bar close; pivot divergences confirm with a natural ~3-bar delay.
Disclaimer
Educational use only. Not financial advice.
Tags: reversal, divergence, rsi, macd, ema, volume, trend, screener, stocks, crypto, bist
2) Bottom-only (Dip)
Title:
Bottom Reversal Radar — Berk v1.4
Description (EN):
Purpose
Scores bottoming conditions and triggers when Score ≥ Threshold (default 3).
Components
RSI recovery after oversold (30→35), MACD bull cross, close above EMA8, BOS above recent swing high, near-EMA200 band (−5…+2%), volume ≥ SMA(20)×1.5, and pivot-confirmed (3/3) bullish RSI divergence. Weights: RSI +2, Divergence +2, others +1.
Usage
Add to chart, set alert “Dipten Dönüş — Ana Sinyal”, Once per bar close. Works on any timeframe (need ≥200 bars for EMA200). Daily/4H recommended.
No-repaint
Bar-close evaluation; divergence confirms with ~3 bars.
Tags: bottom, reversal, rsi, macd, ema, volume, divergence
3) Top-only (Tepe)
Title:
Top Reversal Radar — Berk v1.0
Description (EN):
Purpose
Detects topping risk and triggers when Score ≥ Threshold (default 3) for exits/hedges.
Components
RSI roll-over from overbought (70→65), MACD bear cross, close below EMA8, BOS below recent swing low, near-EMA200 band, volume ≥ SMA(20)×1.5, and pivot-confirmed (3/3) bearish RSI divergence. Weights: RSI +2, Divergence +2, others +1.
Usage
Add to chart, set alert “Tepeden Dönüş — Ana Sinyal”, Once per bar close. Daily/4H preferred; tighten thresholds on lower TFs.
No-repaint
Bar-close evaluation; divergence confirms with ~3 bars.
Tags: top, reversal, rsi, macd, ema, volume, divergence

Double Top/Bottom Fractals DetectorDouble Top/Bottom Detector with Williams Fractals (Extended + Early Signal)
This indicator combines the classic Williams Fractals methodology with an enhanced mechanism to detect potential reversal patterns—namely, double tops and double bottoms. It does so by using two separate detection schemes:
Confirmed Fractals for Pattern Formation:
The indicator calculates confirmed fractals using the traditional Williams Fractals rules. A fractal is confirmed if a bar’s high (for an up fractal) or low (for a down fractal) is the highest or lowest compared to a specified number of bars on both sides (default: 2 bars on the left and 2 on the right).
Once a confirmed fractal is identified, its price (high for tops, low for bottoms) and bar index are stored in an internal array (up to the 10 most recent confirmed fractals).
When a new confirmed fractal appears, the indicator compares it with previous confirmed fractals. If the new fractal is within a user-defined maximum bar distance (e.g., 20 bars) and the price difference is within a specified tolerance (default: 0.8%), the indicator assumes that a double top (if comparing highs) or a double bottom (if comparing lows) pattern is forming.
A signal is then generated by placing a label on the chart—SELL for a double top and BUY for a double bottom.
Early Signal Generation:
To capture potential reversals sooner, the indicator also includes an “early signal” mechanism. This uses asymmetric offsets different from the confirmed fractal calculation:
Signal Right Offset: Defines the candidate bar used for early signal detection (default is 1 bar).
Signal Left Offset: Defines the number of bars to the left of the candidate that must confirm the candidate’s price is the extreme (default is 2 bars).
For an early top candidate, the candidate bar’s high must be greater than the highs of the bars specified by the left offset and also higher than the bar immediately to its right. For an early bottom candidate, the corresponding condition applies for lows.
If the early candidate’s price level is within the acceptable tolerance when compared to any of the previously stored confirmed fractals (again, within the allowed bar distance), an early signal is generated—displayed as SELL_EARLY or BUY_EARLY.
The early signal block can be enabled or disabled via a checkbox input, allowing traders to choose whether to use these proactive signals.
Key Parameters:
n:
The number of bars used to confirm a fractal. The fractal is considered valid if the bar’s high (or low) is higher (or lower) than the highs (or lows) of the preceding and following n bars.
maxBarsApart:
The maximum number of bars allowed between two fractals for them to be considered part of the same double top or bottom pattern.
tolerancePercent:
The maximum allowed percentage difference (default: 0.8%) between the high (or low) values of two fractals to qualify them as matching for the pattern.
signalLeftOffset & signalRightOffset:
These parameters define the asymmetric offsets for early signal detection. The left offset (default: 2) specifies how many bars to look back, while the right offset (default: 1) specifies the candidate bar’s position.
earlySignalsEnabled:
A checkbox option that allows users to enable or disable early signal generation. When disabled, the indicator only uses confirmed fractal signals.
How It Works:
Fractal Calculation and Plotting:
The confirmed fractals are calculated using the traditional method, ensuring robust identification by verifying the pattern with a symmetrical offset. These confirmed fractals are plotted on the chart using triangle shapes (upwards for potential double bottoms and downwards for potential double tops).
Pattern Detection:
Upon detection of a new confirmed fractal, the indicator checks up to 10 previous fractals stored in internal arrays. If the new fractal’s high or low is within the tolerance range and close enough in terms of bars to one of the stored fractals, it signifies the formation of a double top or double bottom. A corresponding SELL or BUY label is then placed on the chart.
Early Signal Feature:
If enabled, the early signal block checks for candidate bars based on the defined asymmetric offsets. These candidates are evaluated to see if their high/low levels meet the early confirmation criteria relative to nearby bars. If they also match one of the confirmed fractal levels (within tolerance and bar distance), an early signal is issued with a label (SELL_EARLY or BUY_EARLY) on the chart.
Benefits for Traders:
Timely Alerts:
By combining both confirmed and early signals, the indicator offers a proactive approach to detect reversals sooner, potentially improving entry and exit timing.
Flexibility:
With adjustable parameters (including the option to disable early signals), traders can fine-tune the indicator to better suit different markets, timeframes, and trading styles.
Enhanced Pattern Recognition:
The dual-layered approach (confirmed fractals plus early detection) helps filter out false signals and captures the essential formation of double tops and bottoms more reliably.

Double Top/Bottom DetectorDouble Top/Bottom Detector Indicator Description
Overview
The Double Top/Bottom Detector is a technical analysis tool designed to automatically identify and label potential double top and double bottom patterns on price charts. By combining pivot point detection with configurable height tolerance and pullback depth criteria, this indicator helps traders visually spot possible trend reversal zones without manual drawing or guesswork.
Key Features
• Pivot Point Identification
The indicator uses a symmetric window approach to find true highs and lows. A pivot high is confirmed only when a bar’s high exceeds the highs of a specified number of bars both before and after it. Likewise, a pivot low is established when a bar’s low is the lowest in its surrounding window.
• Double Top and Double Bottom Detection
– Height Tolerance: Ensures that the two pivot points forming the pattern are within a user-defined percentage of each other.
– Pullback Depth: Measures the drop (for a double top) or the rise (for a double bottom) between the two pivot points and confirms that it meets a minimum percentage threshold.
• Automatic Drawing and Labeling
When a valid double top is detected, a red line connects the two pivot highs and a “Double Top” label is centered above the line. For a double bottom, a green line connects the two pivot lows and a “Double Bottom” label appears below the midpoint.
• Pivot Visualization for Debugging
Small red and green triangles mark every detected pivot high and pivot low on the chart, making it easy to verify and fine-tune settings.
Parameters
Height Tolerance (%) – The maximum allowable percentage difference between the two pivot heights (default 2.0).
Pullback Minimum (%) – The minimum required percentage pullback (for tops) or rebound (for bottoms) between the two pivots (default 5.0).
Pivot Lookback – The number of bars to look back and forward for validating pivot points (default 5).
Window Length – The number of bars over which to compute pullback extrema, equal to twice the pivot lookback plus one (default derived from pivot lookback).
Usage Instructions
1. Copy the Pine Script code into TradingView’s editor and select version 6.
2. Adjust the parameters based on the asset’s volatility and timeframe. A larger lookback window yields fewer but more reliable pivots; tighter height tolerance produces more precise pattern matches.
3. Observe the chart for red and green triangles marking pivot highs and lows. When two qualifying pivots occur, the indicator draws a connecting line and displays a descriptive label.
4. To extend the number of visible historical lines and labels, increase the max\_lines\_count and max\_labels\_count settings in the indicator declaration.
Customization Ideas
• Add volume or moving average filters to reduce false signals.
• Encapsulate pivot logic into reusable functions for cleaner code.
• Incorporate alert conditions to receive notifications when new double top or bottom patterns form.
This indicator is well suited for medium- to long-term analysis and can be combined with risk management rules to enhance decision making.
Flat Tops/Bottoms aka Devil's MarkThis Pine script indicator is designed to visually depict price inefficiencies, as identified by Flat Top/Bottom Candles (aka Devil's Mark). A Flat Top/Bottom Candle is a scenario where there is an absence of a wick at the top or the bottom of the candle. These represent zones of inefficiency and will frequently act as magnets for price that the market will strive to rebalance in accordance with ICT principles.
Relevance:
Flat Top/Bottom Candles are zones where price delivery didn't provide opportunity for manipulation representing an inefficiency that the market will seek to rebalance. Consequently, these zones can provide good targets for entries in the opposite direction or take profit targets for previous entries in the direction of the Flat Top/Bottom Candle.
How It Works:
The indicator keeps track of all Flat Top/Bottom Candles from the beginning of the available history. It automatically removes all mitigated Flat Top/Bottom Candles, which are situations where the price has gone past the candle without a wick.
Configurability:
You can configure the colors, style & width of the lines used to represent flat top/bottom candles.
What makes this indicator different:
Designed with high performance in mind, to reduce impact on chart render time.
Only keeping the currently valid flat top/bottoms on the chart.

CBA Block Tops/Bottoms w/TableHow It Works
Separate Block Sizes & Pre-Calculations: • Two inputs let you set the TOP block size and the BOTTOM block size independently (default both 5). • The script pre-calculates the highest high over the TOP block and the lowest low over the BOTTOM block using ta.highest and ta.lowest.
Horizontal Line Customization: • Users can toggle each horizontal line on or off (via showTopLine and showBottomLine). • Colors, widths, and line styles (Solid, Dotted, or Dashed) for TOP and BOTTOM lines are customizable with separate inputs. • When a block ends, if the corresponding line is enabled, a horizontal line is drawn using the user‑selected parameters.
Array Storage and Averaging: • The script appends each block’s TOP value to the tops array and each BOTTOM value to the bottoms array, keeping their sizes to a maximum defined by the lookback (default 25). • A helper function, f_avg(), safely computes the average of the array values.
Table Display: • A table is created with three columns: an index column (with fixed labels “Active”, “Prev”, “Prev-2”, “Prev-3”, “Prev-4”, “Avg”), a TOP column, and a BOTTOM column. • The first five rows display the most recent TOP and BOTTOM signals (“Active” being the most recent), and the final row shows the average values.
This code gives you full control over both the TOP and BOTTOM block calculations and the appearance of their horizontal lines, all while presenting the data in an informative table.

Atlantean Bitcoin Weekly Market Condition - Top/Bottom BTC Overview:
The "Atlantean Bitcoin Weekly Market Condition Detector - Top/Bottom BTC" is a specialized TradingView indicator designed to identify significant turning points in the Bitcoin market on a weekly basis. By analyzing long-term and short-term moving averages across two distinct resolutions, this indicator provides traders with valuable insights into potential market bottoms and tops, as well as the initiation of bull markets.
Key Features:
Market Bottom Detection: The script uses a combination of a simple moving average (SMA) and an exponential moving average (EMA) calculated over long and short periods to identify potential market bottoms. When these conditions are met, the script signals a "Market Bottom" label on the chart, indicating a possible buying opportunity.
Bull Market Start Indicator: When the short-term EMA crosses above the long-term SMA, it signals the beginning of a bull market. This is marked by a "Bull Market Start" label on the chart, helping traders to prepare for potential market upswings.
Market Top Detection: The script identifies potential market tops by analyzing the crossunder of long and short-term moving averages. A "Market Top" label is plotted, suggesting a potential selling point.
Customizable Moving Averages Display: Users can choose to display the moving averages used for detecting market tops and bottoms, providing additional insights into market conditions.
How It Works: The indicator operates by monitoring the interactions between the specified moving averages:
Market Bottom: Detected when the long-term SMA (adjusted by a factor of 0.745) crosses over the short-term EMA.
Bull Market Start: Detected when the short-term EMA crosses above the long-term SMA.
Market Top: Detected when the long-term SMA (adjusted by a factor of 2) crosses under the short-term SMA.
These conditions are highlighted on the chart, allowing traders to visualize significant market events and make informed decisions.
Intended Use: This indicator is best used on weekly Bitcoin charts. It’s designed to provide long-term market insights rather than short-term trading signals. Traders can use this tool to identify strategic entry and exit points during major market cycles. The optional display of moving averages can further enhance understanding of market dynamics.
Originality and Utility: Unlike many other indicators, this script not only highlights traditional market tops and bottoms but also identifies the aggressive start of bull markets, offering a comprehensive view of market conditions. The unique combination of adjusted moving averages makes this script a valuable tool for long-term Bitcoin traders.
Disclaimer: The signals provided by this indicator are based on historical data and mathematical calculations. They do not guarantee future market performance. Traders should use this tool as part of a broader trading strategy and consider other factors before making trading decisions. Not financial advice.
Happy Trading!
By Atlantean

Double Top, Double Bottom & Head and Shoulders Patterns [ST]Double Top, Double Bottom & Head and Shoulders Patterns
Description in English:
This indicator identifies double top, double bottom, head and shoulders, and inverse head and shoulders patterns on a 4-hour timeframe. It marks the pivot points with circles and outlines the structures with lines, providing clear visual signals of these important reversal patterns.
The colors are customizable for each pattern type.
Detailed Explanation:
Configuration:
Pivot Length: This input defines the period over which pivot points are calculated. The default value is 10.
Circle Color: This input sets the color of the circles that mark the identified double top and double bottom patterns. The default color is blue.
Line Color: This input sets the color of the lines that circle the identified structures of double top and double bottom patterns. The default color is red.
Head and Shoulders Color: This input sets the color of the circles and lines that mark the head and shoulders patterns. The default color is orange.
Inverse Head and Shoulders Color: This input sets the color of the circles and lines that mark the inverse head and shoulders patterns. The default color is purple.
Pattern Identification:
Pivot High and Low: The script uses the pivothigh and pivotlow functions to identify local maxima and minima, essential for detecting the patterns.
Double Top: Identified when there are two pivot highs within the pivot length, and the second high is equal to the first. This pattern typically indicates a potential reversal from an uptrend to a downtrend.
Double Bottom: Identified when there are two pivot lows within the pivot length, and the second low is equal to the first. This pattern typically indicates a potential reversal from a downtrend to an uptrend.
Head and Shoulders: Identified when there is a higher pivot high (head) between two lower pivot highs (shoulders), indicating a potential reversal from an uptrend to a downtrend.
Inverse Head and Shoulders: Identified when there is a lower pivot low (head) between two higher pivot lows (shoulders), indicating a potential reversal from a downtrend to an uptrend.
Drawing Circles and Lines:
Double Top: Marked with blue circles and red lines.
Double Bottom: Marked with blue circles and red lines.
Head and Shoulders: Marked with orange circles and lines.
Inverse Head and Shoulders: Marked with purple circles and lines.
Indicator Benefits:
Pattern Identification: Helps traders identify key reversal patterns (double top, double bottom, head and shoulders, and inverse head and shoulders) on the 4-hour timeframe.
Visual Cues: Provides clear visual signals for these patterns, aiding in making informed trading decisions.
Customizable Parameters: Allows traders to adjust the pivot length, circle color, line color, head and shoulders color, and inverse head and shoulders color to suit different trading strategies and market conditions.
Justification of Component Combination:
Combining pivot point identification with pattern recognition provides a robust method for detecting significant reversal patterns. The visual cues enhance the trader's ability to quickly spot these patterns on the chart.
How Components Work Together:
The script first identifies pivot points based on the specified pivot length.
It then checks for the presence of double top, double bottom, head and shoulders, and inverse head and shoulders patterns using these pivot points.
When a pattern is identified, it is marked with a circle on the chart, and lines are drawn around the structure to provide a clear visual indication of the pattern's presence.
Título: Padrões de Morro Duplo, Fundo Duplo e Ombro-Cabeça-Ombro
Descrição em Português:
Este indicador identifica padrões de morro duplo, fundo duplo, ombro-cabeça-ombro e ombro-cabeça-ombro invertido no gráfico de 4 horas.
Ele marca os pontos de pivô com círculos e contorna as estruturas com linhas, fornecendo sinais visuais claros desses importantes padrões de reversão. As cores são personalizáveis para cada tipo de padrão.
Explicação Detalhada:
Configuração:
Comprimento do Pivô: Este input define o período sobre o qual os pontos de pivô são calculados. O valor padrão é 10.
Cor do Círculo: Este input define a cor dos círculos que marcam os padrões identificados de morro duplo e fundo duplo. A cor padrão é azul.
Cor da Linha: Este input define a cor das linhas que contornam as estruturas identificadas de morro duplo e fundo duplo. A cor padrão é vermelha.
Cor de Ombro-Cabeça-Ombro: Este input define a cor dos círculos e linhas que marcam os padrões de ombro-cabeça-ombro. A cor padrão é laranja.
Cor de Ombro-Cabeça-Ombro Invertido: Este input define a cor dos círculos e linhas que marcam os padrões de ombro-cabeça-ombro invertido. A cor padrão é lilás.
Identificação de Padrões:
Pivô Alto e Baixo: O script usa as funções pivothigh e pivotlow para identificar máximas e mínimas locais, essenciais para detectar os padrões.
Morro Duplo: Identificado quando há duas máximas de pivô dentro do comprimento do pivô, e a segunda máxima é igual à primeira. Este padrão geralmente indica uma reversão potencial de uma tendência de alta para uma tendência de baixa.
Fundo Duplo: Identificado quando há duas mínimas de pivô dentro do comprimento do pivô, e a segunda mínima é igual à primeira. Este padrão geralmente indica uma reversão potencial de uma tendência de baixa para uma tendência de alta.
Ombro-Cabeça-Ombro: Identificado quando há uma máxima de pivô mais alta (cabeça) entre duas máximas de pivô mais baixas (ombros), indicando uma reversão potencial de uma tendência de alta para uma tendência de baixa.
Ombro-Cabeça-Ombro Invertido: Identificado quando há uma mínima de pivô mais baixa (cabeça) entre duas mínimas de pivô mais altas (ombros), indicando uma reversão potencial de uma tendência de baixa para uma tendência de alta.
Desenho de Círculos e Linhas:
Morro Duplo: Marcado com círculos azuis e linhas vermelhas.
Fundo Duplo: Marcado com círculos azuis e linhas vermelhas.
Ombro-Cabeça-Ombro: Marcado com círculos e linhas laranjas.
Ombro-Cabeça-Ombro Invertido: Marcado com círculos e linhas lilás.
Benefícios do Indicador:
Identificação de Padrões: Ajuda os traders a identificar padrões-chave de reversão (morro duplo, fundo duplo, ombro-cabeça-ombro e ombro-cabeça-ombro invertido) no gráfico de 4 horas.
Sinais Visuais: Fornece sinais visuais claros para esses padrões, auxiliando na tomada de decisões informadas.
Parâmetros Personalizáveis: Permite que os traders ajustem o comprimento do pivô, a cor do círculo, a cor da linha, a cor de ombro-cabeça-ombro e a cor de ombro-cabeça-ombro invertido para se adequar a diferentes estratégias de negociação e condições de mercado.
Justificação da Combinação de Componentes:
Combinar a identificação de pontos de pivô com o reconhecimento de padrões fornece um método robusto para detectar padrões de reversão significativos. Os sinais visuais melhoram a capacidade do trader de identificar rapidamente esses padrões no gráfico.
Como os Componentes Funcionam Juntos:
O script primeiro identifica os pontos de pivô com base no comprimento do pivô especificado.
Em seguida, verifica a presença de padrões de morro duplo, fundo duplo, ombro-cabeça-ombro e ombro-cabeça-ombro invertido usando esses pontos de pivô.
Quando um padrão é identificado, ele é marcado com um círculo no gráfico, e linhas são desenhadas ao redor da estrutura para fornecer uma indicação visual clara da presença do padrão.
