"top" için komut dosyalarını ara


Pulse DPO: Major Cycle Tops and Bottoms█ OVERVIEW
Pulse DPO is an oscillator designed to highlight Major Cycle Tops and Bottoms .
It works on any market driven by cycles. It operates by removing the short-term noise from the price action and focuses on the market's cyclical nature.
This indicator uses a Normalized version of the Detrended Price Oscillator (DPO) on a 0-100 scale, making it easier to identify major tops and bottoms.
Credit: The DPO was first developed by William Blau in 1991.
█ HOW TO READ IT
Pulse DPO oscillates in the range between 0 and 100. A value in the upper section signals an OverBought (OB) condition, while a value in the lower section signals an OverSold (OS) condition.
Generally, the triggering of OB and OS conditions don't necessarily translate into swing tops and bottoms, but rather suggest caution on approaching a market that might be overextended.
Nevertheless, this indicator has been customized to trigger the signal only during remarkable top and bottom events.
I suggest using it on the Daily Time Frame , but you're free to experiment with this indicator on other time frames.
The indicator has Built-in Alerts to signal the crossing of the Thresholds. Please don't act on an isolated signal, but rather integrate it to work in conjunction with the indicators present in your Trading Plan.
█ OB SIGNAL ON: ENTERING OVERBOUGHT CONDITION
When Pulse DPO crosses Above the Top Threshold it Triggers ON the OB signal. At this point the oscillator line shifts to OB color.
When Pulse DPO enters the OB Zone, please beware! In this Area the Major Players usually become Active Sellers to the Public. While the OB signal is On, it might be wise to Consider Selling a portion or the whole Long Position.
Please note that even though this indicator aims to focus on major tops and bottoms, a strong trending market might trigger the OB signal and stay with it for a long time. That's especially true on young markets and on bubble-mode markets.
█ OB SIGNAL OFF: EXITING OVERBOUGHT CONDITION
When Pulse DPO crosses Below the Top Threshold it Triggers OFF the OB signal. At this point the oscillator line shifts to its normal color.
When Pulse DPO exits the OB Zone, please beware because a Major Top might just have occurred. In this Area the Major Players usually become Aggressive Sellers. They might wind up any remaining Long Positions and Open new Short Positions.
This might be a good area to Open Shorts or to Close/Reverse any remaining Long Position. Whatever you choose to do, it's usually best to act quickly because the market is prone to enter into panic mode.
█ OS SIGNAL ON: ENTERING OVERSOLD CONDITION
When Pulse DPO crosses Below the Bottom Threshold it Triggers ON the OS signal. At this point the oscillator line shifts to OS color.
When Pulse DPO enters the OS Zone, please beware because in this Area the Major Players usually become Active Buyers accumulating Long Positions from the desperate Public.
While the OS signal is On, it might be wise to Consider becoming a Buyer or to implement a Dollar-Cost Averaging (DCA) Strategy to build a Long Position towards the next Cycle. In contrast to the tops, the OS state usually takes longer to resolve a major bottom.
█ OS SIGNAL OFF: EXITING OVERSOLD CONDITION
When Pulse DPO crosses Above the Bottom Threshold it Triggers OFF the OS signal. At this point the oscillator line shifts to its normal color.
When Pulse DPO exits the OS Zone, please beware because a Major Bottom might already be in place. In this Area the Major Players become Aggresive Buyers. They might wind up any remaining Short Positions and Open new Long Positions.
This might be a good area to Open Longs or to Close/Reverse any remaining Short Positions.
█ WHY WOULD YOU BE INTERESTED IN THIS INDICATOR?
This indicator is built over a solid foundation capable of signaling Major Cycle Tops and Bottoms across many markets. Let's see some examples:
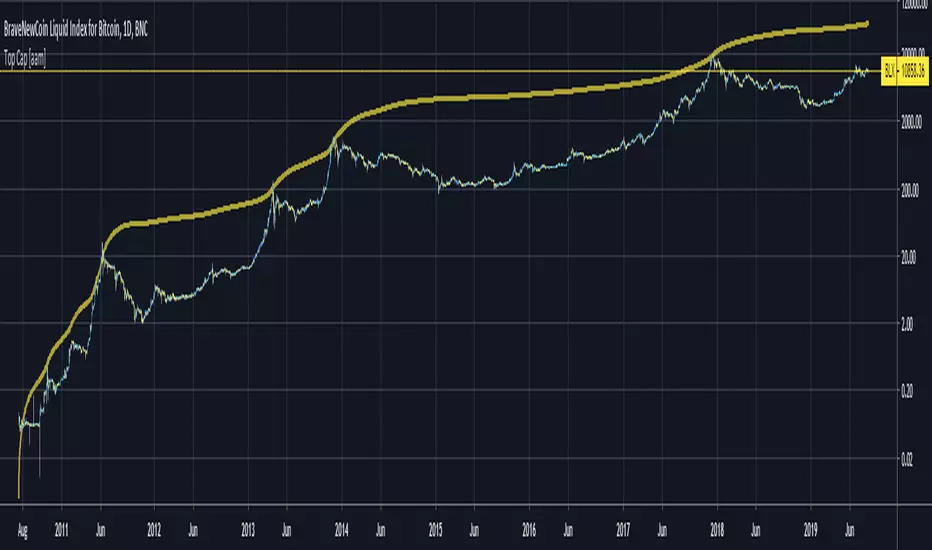
Early Bitcoin Years: From 0 to 1242
This chart is in logarithmic mode in order to properly display various exponential cycles. Pulse DPO is properly signaling the major early highs from 9-Jun-2011 at 31.50, to the next one on 9-Apr-2013 at 240 and the epic top from 29-Nov-2013 at 1242.
Due to the massive price movements, the OB condition stays pinned during most of the exponential price action. But as you can see, the OB condition quickly vanishes once the Cycle Top has been reached. As the market matures, the OB condition becomes more exceptional and triggers much closer from the Cycle Top.
With regards to Cycle Bottoms, the early bottom of 2 after having peaked at 31.50 doesn’t get captured by the indicator. That is the only cycle bottom that escapes the Pulse DPO when the bottom threshold is set at a value of 5. In that event, the oscillator low reached 6.95.
Bitcoin Adoption Spreading: From 257 to 73k
This chart is in logarithmic mode in order to properly display various exponential cycles. Pulse DPO is properly signaling all the major highs from 17-Dec-2017 at 19k, to the next one on 14-Apr-2021 at 64k and the most recent top from 9-Nov-2021 at 68k.
During the massive run of 2017, the OB condition still stayed triggered for a few weeks on each swing top. But on the next cycles it started to signal only for a few days before each swing top actually happened. The OB condition during the last cycle top triggered only for 3 days. Therefore the signal grows in focus as the market matures.
At the time of publishing this indicator, Bitcoin printed a new All Time High (ATH) on 13-Mar-2024 at 73k. That run didn’t trigger the OB condition. Therefore, if the indicator is correct the Bitcoin market still has some way to grow during the next months.
With regards to Cycle Bottoms, the bottom of 3k after having peaked at19k got captured within the wide OS zone. The bottom of 15k after having peaked at 68k got captured too within the OS accumulation area.
Gold
Pulse DPO behaves surprisingly well on a long standing market such as Gold. Moving back to the 197x years it’s been signaling most Cycle Tops and Bottoms with precision. During the last cycle, it shows topping at 2k and bottoming at 1.6k.
The current price action is signaling OB condition in the range of 2.5k to 2.7k. Looking at past cycles, it tends to trigger on and off at multiple swing tops until reaching the final cycle top. Therefore this might indicate the first wave within a potential gold run.
Oil
On the Oil market, we can see that most of the cycle tops and bottoms since the 80s got signaled. The only exception being the low from 2020 which didn’t trigger.
EURUSD
On Forex markets the Pulse DPO also behaves as expected. Looking back at EURUSD we can see the marketing triggering OB and OS conditions during major cycle tops and bottoms from recent times until the 80s.
S&P 500
On the S&P 500 the Pulse DPO catched the lows from 2016 and 2020. Looking at present price action, the recent ATH didn’t trigger the OB condition. Therefore, the indicator is allowing room for another leg up during the next months.
Amazon
On the Amazon chart the Pulse DPO is mirroring pretty accurately the major swings. Scrolling back to the early 2000s, this chart resembles early exponential swings in the crypto space.
Tesla
Moving onto a younger tech stock, Pulse DPO captures pretty accurately the major tops and bottoms. The chart is shown in logarithmic scale to better display the magnitude of the moves.
█ SETTINGS
This indicator is ideal for identifying major market turning points while filtering out short-term noise. You are free to adjust the parameters to align with your preferred trading style.
Parameters : This section allows you to customize any of the Parameters that shape the Oscillator.
Oscillator Length: Defines the period for calculating the Oscillator.
Offset: Shifts the oscillator calculation by a certain number of periods, which is typically half the Oscillator Length.
Lookback Period: Specifies how many bars to look back to find tops and bottoms for normalization.
Smoothing Length: Determines the length of the moving average used to smooth the oscillator.
Thresholds : This section allows you to customize the Thresholds that trigger the OB and OS conditions.
Top: Defines the value of the Top Threshold.
Bottom: Defines the value of the Bottom Threshold.

Top Finder & Dip Hunter [BackQuant]Top Finder & Dip Hunter
A practical tool to map where price is statistically most likely to exhaust or mean-revert. It builds objective support for dips and resistance for tops from multiple methodologies, then filters raw touches with volume, momentum, trend, and price-action context to surface higher-quality reversal opportunities.
What this does
Draws a Dip Support line and a Top Resistance line using the method you select, or a blended hybrid.
Evaluates each touch/penetration against Quality Filters and assigns a 0–100 composite score.
Prints clean DIP and TOP signals only when depth/extension and quality pass your thresholds.
Optionally annotates the chart with the computed quality score at signal time.
Why it’s useful
Objectivity: Converts vague “looks extended” into rules, reduces discretion creep.
Signal hygiene: Filters raw touches using trend, volume, momentum, and candle structure to avoid obvious traps.
Adaptable regimes: Switch methods, sensitivity, and lookbacks to match choppy vs trending conditions.
How support and resistance are built
Pick one per side, or use “Hybrid.”
Dynamic: Anchors to the extreme of a lookback window, padded by recent ATR, so buffers expand in volatile periods and contract when calm.
Fibonacci: Uses the 0.618/0.786 retracement pair inside the current swing window to target common reaction zones.
Volatility: Uses a moving-average basis with standard-deviation bands to capture statistically stretched moves.
Volume-Weighted: Centers off VWAP and penalizes deviations using dispersion of price around VWAP, helpful on intraday instruments.
Hybrid: A weighted average of the above to smooth out single-method biases.
When a touch becomes a signal
Depth/extension test:
Dips must penetrate their support by at least Min Dip Depth % .
Tops must extend above resistance by at least Min Top Rise % .
Quality Score gate: The composite must clear Min Quality Score . Components:
Trend alignment: Favor dips in bullish regimes and tops in bearish regimes using EMAs and RSI.
Volume confirmation: Reward expansion or spikes versus a 20-period baseline.
RSI context: Prefer oversold for dips, overbought for tops.
Momentum shift: Look for short-term momentum turning in the expected direction.
Candle structure: Reward hammer/shooting-star style responses at the level.
How to use it
Pick your regime:
Range/chop, small caps, mean-revert intraday → Volatility or Volume Weighted .
Cleaner swings/trends → Dynamic or Fibonacci .
Unsure or mixed conditions → Hybrid .
Set windows: Start with Lookback = 50 for both sides. Increase in higher timeframes or slow assets, decrease for fast scalps.
Tune sensitivity: Raise Dip/Top Sensitivity to widen buffers and reduce noise. Lower to be more aggressive.
Gate with quality: Begin with Min Quality Score = 60 . Push to 70–80 for cleaner swing entries, relax to 50–60 for scalps.
Act on first prints: The script only fires on new qualified events. Use the score label to prioritize A-setups.
Typical workflows
Intraday futures/crypto: Volume-Weighted or Volatility methods for both sides, higher Sensitivity , require Volume Filter and Momentum Filter on. Look for DIP during opening drive exhaustion and TOP near late-session fatigue.
Swing equities/FX: Dynamic or Fibonacci with moderate sensitivity. Keep Trend Filter on to only take dips above the 200-EMA and tops below it.
Countertrend scouts: Lower Min Dip Depth % / Min Top Rise % slightly, but raise Min Quality Score to compensate.
Reading the chart
Lines: “Dip Support” and “Top Resistance” are the current actionable rails, lightly smoothed to reduce flicker.
Signals: “DIP” prints below bars when a qualified dip appears, “TOP” prints above for qualified tops.
Scores: Optional labels show the composite at signal time. Favor higher numbers, especially when aligned with higher-timeframe trend.
Background hints: Light highlights mark raw touches meeting depth/extension, even if they fail quality. Treat these as early warnings.
Tuning tips
If you get too many false DIP signals in downtrends, raise Min Dip Depth % and keep Trend Filter on.
If tops appear late in squeezes, lower Top Sensitivity slightly or switch top side to Fibonacci .
On assets with erratic volume, prefer Volatility or Dynamic methods and down-weight the Volume Filter .
For strict systems, increase Min Quality Score and require both Volume and Momentum filters.
What this is not
It is not a blind reversal signal. It’s a structured context tool. Combine with your risk plan and higher-timeframe map.
It is not a guarantee of mean reversion. In strong trends, expect fewer, higher-score opportunities and respect invalidation quickly.
Suggested presets
Scalp preset: Lookback 30–40, Sensitivity 1.2–1.5, Quality ≥ 55, Volume & Momentum filters ON.
Swing preset: Lookback 75–100, Sensitivity 1.0–1.2, Quality ≥ 70, Trend & Volume filters ON.
Chop preset: Volatility/Volume-Weighted methods, Quality ≥ 60, Momentum filter ON, RSI emphasis.
Input quick reference
Dip/Top Method: Choose the model for each side or “Hybrid” to blend.
Lookback: Swing window the levels are built from.
Sensitivity: Scales volatility padding around levels.
Min Dip Depth % / Min Top Rise %: Minimum breach/extension to qualify.
Quality Filters: Trend, Volume, Momentum toggles, plus Min Quality Score gate.
Visuals: Colors and whether to print score labels.
Best practices
Map higher-timeframe trend first, then act on lower-timeframe DIP/TOP in the trend’s favor.
Use the score as triage. Skip mediocre prints into news or at session open unless score is exceptional.
Pre-define stop placement relative to the level you used. If a DIP fails, exit on loss of structure rather than waiting for the next print.
Bottom line: Top Finder & Dip Hunter codifies where reversals are most defensible and only flags the ones with supportive context. Tune the method and filters to your market, then let the score keep your playbook disciplined.

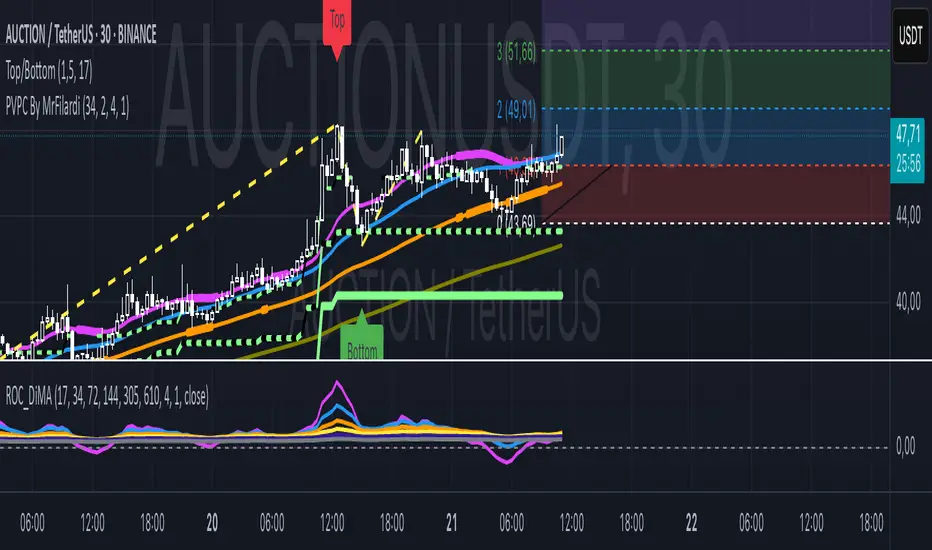
Top G indicator [BigBeluga]Top G Indicator is a straightforward yet powerful tool designed to identify market extremes, helping traders spot potential tops and bottoms effectively.
🔵 Key Features:
High Probability Signals:
𝔾 Label: Indicates high-probability market bottoms based on specific conditions such as low volatility and momentum shifts.
Top Label: Highlights high-probability market tops using key price action dynamics.
Simple Signals for Potential Extremes:
^ (Caret): Marks potential bottom areas with less certainty than 𝔾 labels.
v (Inverted Caret): Signals potential top areas with less certainty than Top labels.
Midline Visualization:
A smoothed midline helps identify the center of the current range, providing additional context for trend and range trading.
Range Highlighting:
Dynamic bands around the highest and lowest points of the selected period, color-coded for easy identification of the market range.
🔵 Usage:
Spot Extremes: Use 𝔾 and Top labels to identify high-probability reversal points for potential entries or exits.
Monitor Potential Reversals: Leverage ^ and v marks for additional signals on potential turning points, especially during range-bound conditions.
Range Analysis: Use the midline and dynamic bands to determine the market's range and its center, aiding in identifying consolidation or breakout scenarios.
Confirmation Tool: Combine this indicator with other tools to confirm reversal or trend continuation setups.
Top G Indicator is a simple yet effective tool for spotting market extremes, designed to assist traders in making timely decisions by identifying potential tops and bottoms with clarity.

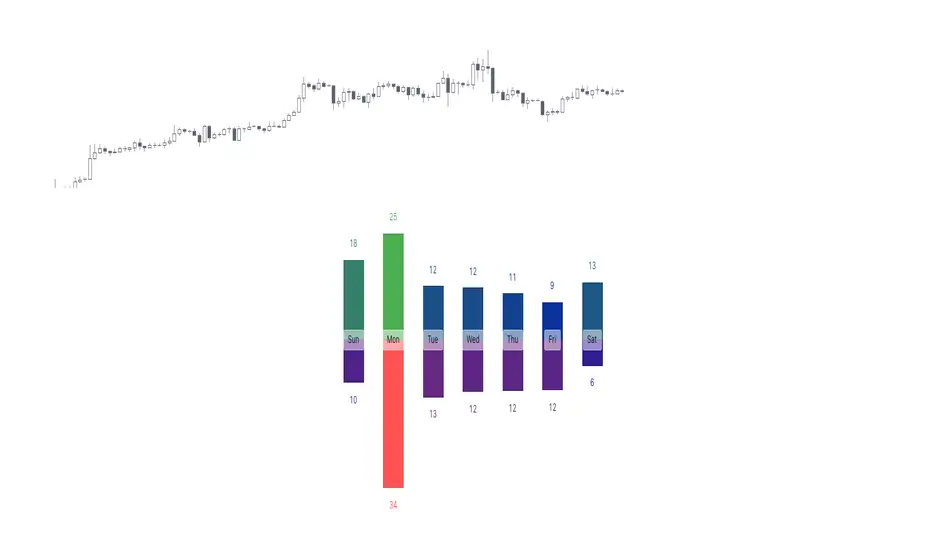
Tops & Bottoms - Day of Week Report█ OVERVIEW
The indicator tracks when the weekly tops and bottoms occur and reports the statistics by the days of the week.
█ CONCEPTS
Not all the days of the week are equal, and the market dynamic can follow through or shift over the trading week. Tops and bottoms are vital when entering a trade, as they will decide if you are catching the train or being straight offside. They are equally crucial when exiting a position, as they will determine if you are closing at the optimal price or seeing your unrealized profits vanish.
This indicator is before all for educational purposes. It aims to make the knowledge available to all traders, facilitate understanding of the various markets, and ultimately get to know your trading pairs by heart (and saving a lot of your time backtesting!).
USDJPY tops and bottoms percentages on any given week.
USDJPY tops and bottoms percentages on up weeks versus down weeks.
█ FEATURES
Custom interval
By default, the indicator uses the weekly interval defined by the symbol (e.g., Monday to Sunday). This option allows you to specify your custom interval.
Weekly interval type filter
Analyze the weekly interval on any weeks, up weeks, or down weeks.
Configurable time range filter
Select the period to report from.
█ NOTES
Trading session
The indicator analyzes the days of the week from the daily chart. The daily trading sessions are defined by the symbol (e.g., 17:00 - 17:00 on EURUSD).
Extended/electronic trading session
The indicator can include the extended hours when activated on the chart, using the 24-hour or 1440-minute timeframe.
█ HOW TO USE
Plot the indicator and navigate on the 1-day or 24-hour timeframe.
Tops & Bottoms - Time of Day Report█ OVERVIEW
The indicator tracks and reports the percentage of occurrence of daily tops and bottoms by the time of the day.
█ CONCEPTS
At certain times during the trading day, the market reverses and marks the high or low of the day. Tops and bottoms are vital when entering a trade, as they will decide if you are catching the train or being straight offside. They are equally crucial when exiting a position, as they will determine if you are closing at the optimal price or seeing your unrealized profits vanish.
This indicator is before all for educational purposes. It aims to make the knowledge available to all traders, facilitate understanding of the various markets, and ultimately get to know your trading pairs by heart.
Tops and bottoms percentage of occurrence on EURGBP (London time).
Up days versus down days on EURUSD (London time).
█ FEATURES
Selectable time zones
Present the column chart in your local time zone (or other market participants).
Configurable time range filter
Select the period to report from.
Day type filter
Analyze all days, or filter only up days or down days.
█ HOW TO USE
Plot the indicator and visit the 1-hour or 30-minute timeframe.
█ NOTES
Timeframe choice
The 1-hour timeframe produces a higher number of days sampled. Prefer the usage of the 30-minute timeframe when your market starts at 9:30 AM.
Daylight Saving Time (DST)
The exchange time and geographical time zone options may observe Daylight Saving Time, unlike UTC+0.

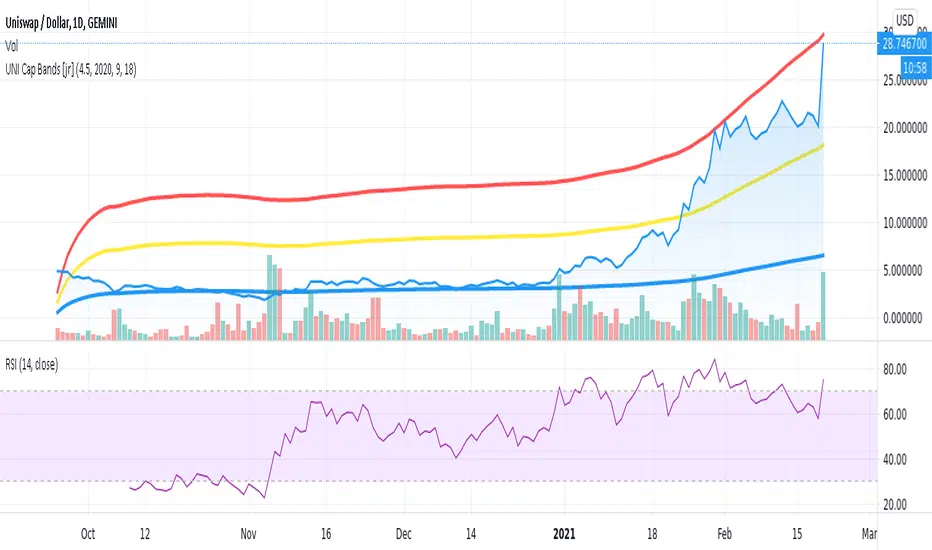
UNI Top Cap [jcray]Top cap indicator for UNI, the Uniswap Protocol token. Modified from BTC Top Cap by aamonkey
TOP & BOTTOM Cycle [aamonkey]Works best on BTC and only on the daily timeframe!
This is a TOP / BOTTOM indicator for big market cycles.
These tops and bottoms are based on the difference between the 200MA on the daily and the price.

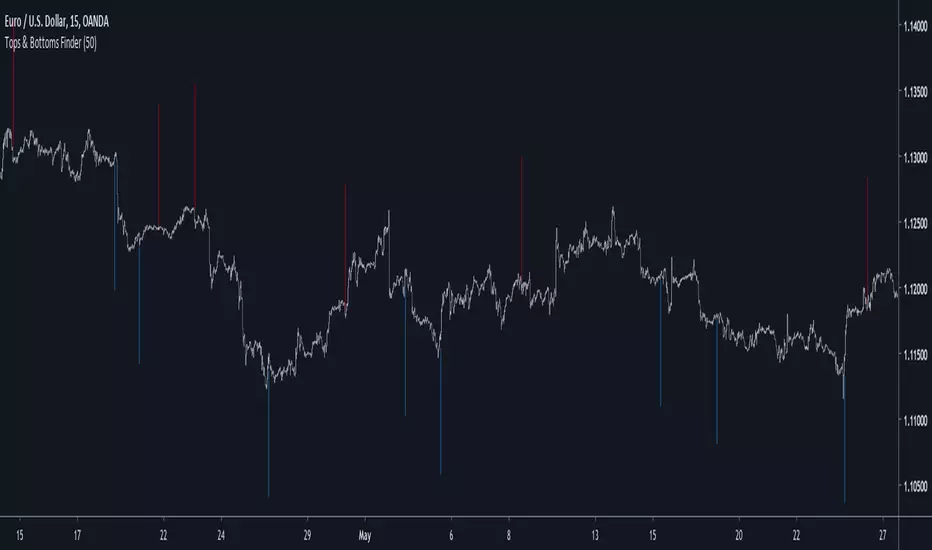
Tops & Bottoms FinderIntroduction
I already shared a method to estimate tops and bottoms (1), the number of parameters could lead to optimization issues so i tried to make a simpler method. In this method i use a simple rescaling method based on individual direction deviation. I will explain further details below.
The Indicator
I use as source for the entire calculation an exponential moving average, the first reaction to this choice would be to think that i wanted to filter signals in order to reduce them, but the truth is that i wanted to have more signals instead, this is because the first calculations involving standard deviations are based on price direction, so by using a smooth input we can get more persistent values in a and b , but its totally up to you to use whatever you want in a , just take into account that less smooth = less signals, this is why i used this calculation process.
a = close and length = 7
a = least squares moving average and length = 25
So you could use pretty much everything you want as input.
Conclusion
The accuracy of such indicators is still relatively low but i presented a way to estimate tops and bottoms without using highest/lowest or differencing thus creating a totally new approach. I encourage you to experiment with it and share your results. If you learned something with this post then i'am happy :)
Notes
Based on several complaints i will have to leave even sooner, i think the 7 of June will be a good day, so if you need something i encourage you to ask me now. With the hope you can understand.
Thanks for reading !
(1)
Tops/BottomsUsing Modified code from Lazybear's CVI 0.17% indicator and some logic, this script can help identify value buy and sell opportunities at a very early phase. Best used as a confirmation tool. This is a beta, so use it as such. Enjoy.
Sometimes "top" indications in an uptrend mean to look for an opportunity to add to position while "bottom" indications during a downtrend can represent the same thing. The trend is your friend, use it to your advantage!
Red star above bar == potential top
Green star below bar == potential bottom

Top Cap [aamonkey]Historically matched market tops for BTC.
It's the Average Cap (see my other indicator) multiplied by 35.
The default settings are for BTC.
If you want to test this indicator on another chart you have to change the launch date settings (and maybe play around with the multiplier).
Some Interesting Launch dates:
- BTC: 3 JAN 2009
- ETH: 30. JUL 2015
- LTC: 7. OCT 2011
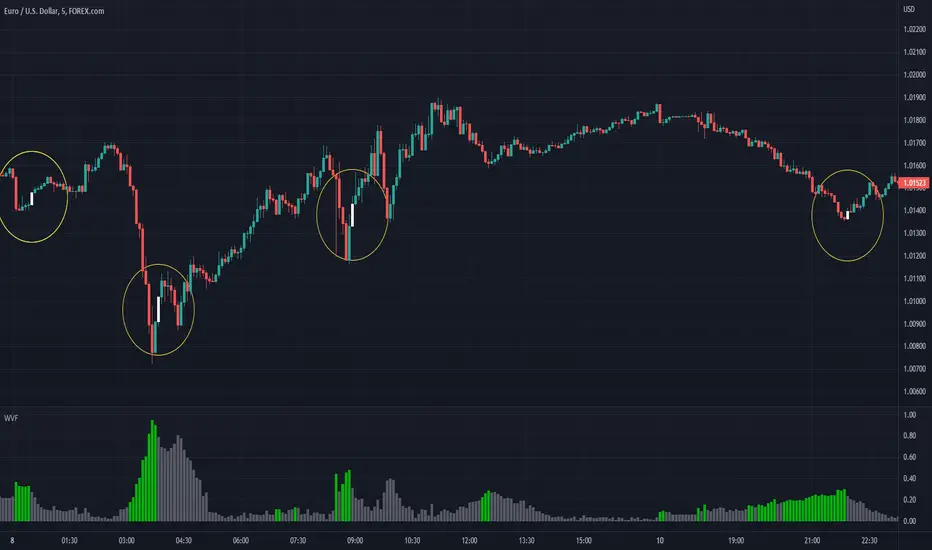
CM_Williams_Vix_Fix - Market Top and Bottom with multi-timeframeThis is a modification of CM_Williams_Vix_Fix indicator to include both market tops and bottoms with multi-timeframe support. The original indicator only finds market bottoms.
All credits go to the original author ChrisMoody.
Original script link
Working:
The histogram above 0 signifies the trend of market going UP and the histogram below 0 signifies the trend of market going DOWN.
The histogram bar is calculated using "LookBack Period Standard Deviation High" number of candles. A threshold is calculated using bollinger bands and based on percentile of "Look Back Period Percentile High" number of candles.
If the histogram bar above 0 crosses the up threshold then we have market top which is signified by histogram bar having the color green. If the histogram bar below 0 crosses the down threshold then we have market bottom which is signified by histogram bar having the color red.
The market tops and bottoms can also be calculated across multiple timeframes.
Sample usage:
Suppose the market is in an uptrend and the indicator displays red market bottom bar, this might be an indication that the market has reached the end of a pullback. We can use additional indicators like stochastic or rsi to get additional confluence.
This indicator does not repaint but you need to wait for the candle to close.

Price Action Top/BottomThis script is a variation from Auto Fibo retration.
It makrs top and bottom prices. You can use to study the price action.
The user can choose the line color, to show or not, the marks green and red
The user can choose the minimal candles between top and bottom, by default is 17
The deep is the percentage of the diference about the last bottom/top from the previous one.
Golden Ratio Fibonacci Multipliers Top Detector [UO]Fibonacci levels that show the critical top and bottom levels. There is no way to miss the top and bottom. And a top detector.
Also the most important SMA lines (SMA 50, 200), EMA21. Those are the most frequently used lines by traders.
This indicator is based on the work of www.tradingview.com
His work set me thinking. Could I also see the bottom using Fibonacci numbers? Yes, of course.
My favorite timeframes with this indicator are 6H, 1D, 3D.
Intensively used for BTC and BNB. And useful for any other coin.

CM_Laguerre PPO PercentileRank Mkt Tops & BottomsCustom Code that Finds Market Tops & Bottoms!!!
CM_Laguerre PPO PercentileRank V2 Mkt Tops & Bottoms
Original Laguerre PPO code was Created by TheLark.
Special Thanks to coondawg71 and ChartArt for Great Insights
This Is Version 2 Of This Indicator that now Finds Market Tops and Bottoms.
Coming Next…Upper Indicator Pinpointing Entries Based on Price Action!!!
See Original Post Below For Detailed Information.
Other Indicators That Show Market Bottoms Well.
CM ATR PERCENTILERANK - GREAT FOR SHOWING MARKET BOTTOMS!
GREAT CONFIRMING INDICATOR FOR THE WILLIAMS VIX FIX
TWO TRADING SYSTEMS - BASED ON EXTREME MOVES!!!

Williams Vix Fix Bottoms and TopsThis indicator uses the very popular Williams Vix Fix for Bottoms by Chris Moody but not only does it search for bottoms, it can also be switch to work for tops for those who look to short the market. I've also added in a few options like flipping the indicator, color adjustments on the settings page, as well as cut a few of the options I feel did not need to be in which cluttered the screen when the settings were opened. In his later revisions of the Williams Vix Fix, CM took out the functions which draw the high/low ranges as well as the standard deviation which is what this indicator uses to show entry points. I have added options back on to draw these, I think it's useful. To be honest, I have not messed around with the number settings much so I am not sure how adjusting the look back range or going for smaller / bigger percentage changes would change how well the indicator works. It seems to work very well at its default settings.
With the Bollinger Band deviation, you have to remember that it looks back at the set amount of candles (20 by default) and uses those for the standard deviation: 1 dev = 68%, 2 dev = 95%, 3 dev = 99.7%
These percentages mean that at 2 dev, 95% of the last 20 candles will remain within the boundaries of the Bollinger Bands. Three tends to be too high, one is usually too low. Two is pretty good.
The lowest percentile option probably won't change much other than bring up the bottom line which doesn't effect the alerts or signals, just something to observe.
The highest percentile option makes a difference similar to the stand deviation and Bollinger Band. The higher you put it, the less likely it will get triggered but the more reliant it of a signal it should be.
As always, I have left notes throughout the code and I did leave in the code that was original but commented it out as I don't believe it's worth having.
I like to have the high/lows drawn, as well as the standard deviation. Then I find that the filtered entries are most accurate signals to follow. Simple entry is hit or miss, Aggressive entry is always early but sometimes that's not a great thing.
Eflatun CCI Divergence and Top/BottomThe Commodity Channel Index (CCI) with Divergence and finding Top / Bottom points
Select MA with Sma, Ema, Wma, SWma, VWma, Hma or Rma
Follow bar color on top or bottom

Pi Cycle Top IndicatorIndicator Overview
The Pi Cycle Top Indicator has historically been effective in picking out the timing of market cycle highs to within 3 days.
It uses the 111 day moving average (111DMA) and a newly created multiple of the 350 day moving average, the 350DMA x 2.
Note: The multiple is of the price values of the 350DMA not the number of days.
For the past three market cycles, when the 111DMA moves up and crosses the 350DMA x 2 we see that it coincides with the price of Bitcoin peaking.
It is also interesting to note that 350 / 111 is 3.153, which is very close to Pi = 3.142. In fact, it is the closest we can get to Pi when dividing 350 by another whole number.
It once again demonstrates the cyclical nature of Bitcoin price action over long time frames. Though in this instance it does so with a high degree of accuracy over the past 7 years.
How It Can Be Used
Pi Cycle Top is useful to indicate when the market is very overheated. So overheated that the shorter term moving average, which is the 111 day moving average, has reached a x2 multiple of the 350 day moving average. Historically it has proved advantageous to sell Bitcoin at this time in Bitcoin's price cycles.
Created By
Philip Swift

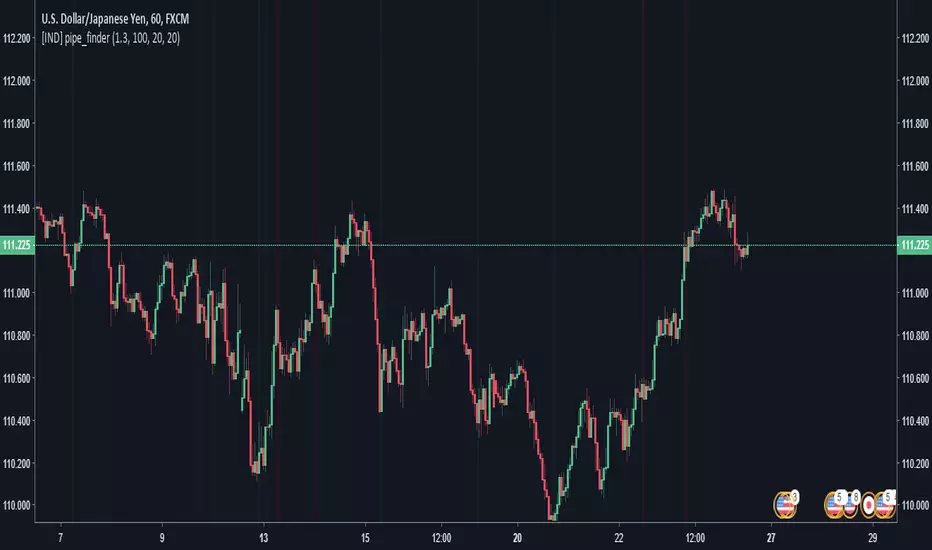
pipe_finder. Reversal Indicator for Pipe Top & Bottom Patterns.Simple indicator to find pipe bottom and top patterns.
Definition:
- Pipe Bottom:
- Positive Difference from Open and Close is greater than the average thickness of the last "x" candles multiplied by sensitivity "y"
- The previous candle is red and the current candle is green
- Trend Definition - (Trend for EMA length 'z" has a slope less than 0 or pointed downwards)
- The average of the current and previous candle's volume is greater than the average volume for the last "n" candles.
- Pipe Top:
- Positive Difference from Open and Close is greater than the average thickness of the last "x" candles multiplied by sensitivity "y"
- The previous candle is green and the current candle is red
- Trend Definition - (Trend for EMA length 'z" has a slope greater than 0 or pointed upwards)
- The average of the current and previous candle's volume is greater than the average volume for the last "n" candles.
Settings:
Sensitivity: How thick do the pipe candles have to be? (Greater sensitivity = more alerts)
Candle Thickness Average Period: The number of past candles used for measuring the average body size of candlestick.
Filter EMA Length: Length of the EMA used to filter between bull trends and bear trends.
Volume EMA Length: Length of the volume EMA.
Top-Down 8 Levels + Wick Alerts + H4 Box (Stable)Top-Down Analysis Box
This Indicator Helps You Do
Perform top-down analysis quickly
Identify HTF liquidity levels instantly
Spot wick taps (liquidity grabs) in real-time
Trade key institutional levels with confidence
Use H4 zones for direction and bias
Set alerts for high-probability reaction levels

Top-Down Analysis previous day Top-Down Analysis 2nd Candle with Enhanced Features
This powerful TradingView script is designed for traders looking for a comprehensive and customizable top-down analysis tool. The indicator plots horizontal lines based on significant price levels from multiple timeframes (Daily, 4-Hour, 1-Hour, and Weekly), offering clear reference points for technical analysis. Each timeframe is associated with high and low levels from the previous candle, and these levels are represented with customizable line styles, colors, and widths.
Key Features:
Multi-Timeframe Support: Displays high and low levels from the previous candle for the Daily, 4-Hour, 1-Hour, and Weekly timeframes. Customize which timeframes to show.
Customizable Line Appearance: Choose the line color, style (solid, dotted, dashed), and width for each timeframe. This allows for a personalized chart appearance to suit your trading strategy.
Text Labels: Add custom text labels to each line, and move them dynamically to the right, keeping them visible as the candles progress. The labels can be customized with user-defined text for each timeframe’s high and low levels.
Toggle Line Visibility: Easily control the visibility of the horizontal lines and their labels for each timeframe, allowing you to focus on the levels that matter most.
Price Alerts: Set price alerts when the price crosses any of the plotted levels, including the Daily, 4-Hour, 1-Hour, and Weekly levels. Receive notifications when significant price interactions occur.
User Control: With inputs for changing timeframes, colors, labels, and more, this indicator is fully customizable to fit your trading style.
This indicator is ideal for day traders, swing traders, and anyone utilizing multi-timeframe analysis for more informed decision-making.

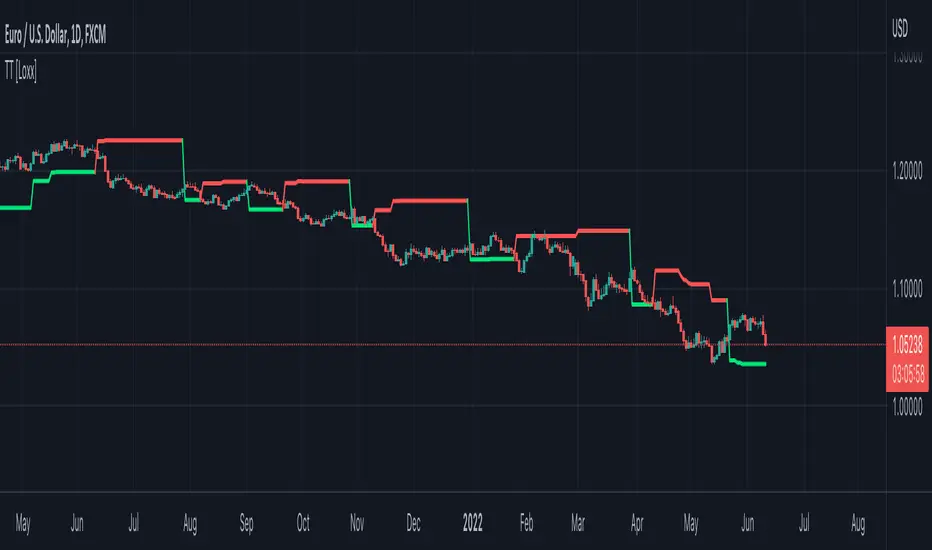
Top Trend [Loxx]Top Trend is a trend following indicator that signals breakouts and plots dynamic support and resistance levels.
Included:
-Calculation of Top Trend using either Bollinger Bands and Keltner Channels
This is an exact clone of the "TopTrend" for MT4 indicator