Fibonacci Retracements & Trend Following Strategy V2This Pine Script strategy generates trading signals using Fibonacci levels and trend-following indicators.
1. Strategy Summary
This strategy analyzes price movements using a combination of Fibonacci levels and trend-following indicators, providing potential trading signals. The strategy includes Fibonacci levels as well as EMA (Exponential Moving Average) and ADX (Average Directional Index) indicators.
2. Indicators and Parameters
Fibonacci Levels
Fibonacci Level 1, Level 2, Level 3, Level 4: Used as Fibonacci retracement levels. These levels are typically set at 0.236, 0.382, 0.618, and 0.786. Users can adjust these values according to their preferences.
Trend-Following Indicator
Trend Length: The period for calculating the EMA used as the trend-following indicator. For example, if set to 20, the EMA will be calculated over 20 periods.
ADX (Average Directional Index)
ADX Length: The period for calculating the ADX. ADX measures the strength of the price trend and is usually set to 14 periods.
ADX Threshold: A threshold value for the ADX. This value determines when trading signals will be activated.
3. Usage Steps
Displaying the Indicator on the Chart:
On the TradingView platform, paste the code into the Pine Editor and click the "Add to Chart" button to add it to the chart.
Analyzing the Indicators:
Fibonacci Levels: Show retracement levels of price movements. When the price reaches one of these levels, potential reversals may occur.
Trend-Following Indicator: EMAs determine the direction of the trend. Green EMA represents an uptrend, while red EMA represents a downtrend.
ADX: Measures the strength of the trend. When ADX surpasses the threshold value, it indicates a strong trend.
Trading Signals:
Long Signal: Generated when the price is above the second Fibonacci level and the trend is upward. Additionally, the ADX value must be above the set threshold.
Short Signal: Generated when the price is below the second Fibonacci level and the trend is downward. Additionally, the ADX value must be above the set threshold.
Target Prices:
Long Targets: Determines upward targets based on Fibonacci levels. These targets indicate expected prices if the price reverses from Fibonacci levels.
Short Targets: Determines downward targets based on Fibonacci levels. These targets indicate expected prices if the price reverses from Fibonacci levels.
4. Chart Displays
Trend Up (Green Line): Shows the rising EMA.
Trend Down (Red Line): Shows the falling EMA.
Fibonacci Levels (Blue Lines): Shows Fibonacci retracement levels.
Long Targets (Green Circles): Shows targets for long positions.
Short Targets (Red Circles): Shows targets for short positions.
Long Signal (Green Label): Buy signal.
Short Signal (Red Label): Sell signal.
5. Important Notes
Retracement and Target Levels: Fibonacci levels can act as potential retracement or support/resistance levels. However, they should always be used in conjunction with other technical analysis tools.
Trend and ADX: ADX is used to determine the strength of the trend. Be aware that when ADX is low, trends may be weak.
6. Example Scenarios
Example 1: If the trend is upward (green EMA) and the price is above the second Fibonacci level, you may receive a long position signal. If the ADX value is above the threshold, the signal may be stronger.
Example 2: If the trend is downward (red EMA) and the price is below the second Fibonacci level, you may receive a short position signal. If the ADX value is above the threshold, the signal may be stronger.
This updated version contains significant improvements in both technical aspects and user experience. Innovations such as ADX calculations and dynamic Fibonacci levels make the strategy more robust and flexible. The code's readability and comprehensibility have been enhanced, and errors have been corrected.
This guide will help you understand the basic operation of the strategy. It is always recommended to conduct your own research and test the strategy before using it.
GOOD LUCK. // halilvarol
Komut dosyalarını "the strat" için ara

Artaking 2Components of the Indicator:
Moving Averages:
Short-Term Moving Average (MA): This is a 50-period Simple Moving Average (SMA) applied to the closing price. It is used to track the short-term trend of the market.
Long-Term Moving Average (MA): This is a 200-period SMA used to track the long-term trend.
Day Trading Moving Average: A 20-period SMA is used specifically for day trading signals, focusing on shorter-term price movements.
Purpose:
The crossing of these moving averages (short-term crossing above or below long-term) provides basic buy and sell signals, indicative of potential trend reversals or continuations.
ADX (Average Directional Index) for Trend Strength:
ADX Calculation: The ADX is calculated using a 14-period length with 14-period smoothing. The ADX value indicates the strength of a trend, regardless of direction.
Strong Trend Condition: The indicator considers a trend to be strong if the ADX value is above 25. This threshold helps filter out trades during weak or sideways markets.
Purpose:
To ensure that the strategy only generates signals when there is a strong trend, thus avoiding whipsaws in low volatility or range-bound conditions.
Support Levels:
Support Level Calculation: The indicator calculates the lowest close over the last 100 periods. This level is used to identify significant support zones where the price might find a floor.
Purpose:
Support levels are critical in identifying potential areas where the price might bounce, making them ideal for setting stop losses or identifying buy opportunities.
Volatility Spike (Proxy for News Trading):
ATR (Average True Range) Calculation: The indicator uses a 14-period ATR to measure market volatility. A volatility spike is identified when the ATR is greater than 1.5 times the 14-period SMA of the ATR.
Purpose:
This serves as a proxy for news events or other sudden market movements that could make the market unpredictable. The indicator avoids generating signals during these periods to reduce the risk of being caught in a volatile, potentially news-driven move.
Fibonacci Retracement Levels:
61.8% Fibonacci Level: Calculated from the highest high and lowest low over the long MA period, this retracement level is widely regarded as a significant support or resistance level.
Purpose:
Position traders often use Fibonacci levels to identify potential reversal points. The indicator incorporates the 61.8% level to fine-tune entries and exits.
Candlestick Patterns for Price Action Trading:
Bullish Engulfing Pattern: A bullish reversal pattern where a green candle fully engulfs the previous red candle.
Bearish Engulfing Pattern: A bearish reversal pattern where a red candle fully engulfs the previous green candle.
Purpose:
These patterns are classic signals used in price action trading to identify potential reversals at key levels, especially when they align with other conditions like support/resistance or Fibonacci levels.
Signal Generation:
The indicator generates buy and sell signals by combining the above elements:
Buy Signal:
A buy signal is triggered when:
The short-term MA crosses above the long-term MA (indicating a potential uptrend).
The trend is strong (ADX > 25).
The current price is near or below the 61.8% Fibonacci retracement level, suggesting a potential reversal.
No significant volatility spike is detected, ensuring the market isn’t reacting unpredictably to news.
Sell Signal:
A sell signal is triggered when:
The short-term MA crosses below the long-term MA (indicating a potential downtrend).
The trend is strong (ADX > 25).
The current price is near or above the 61.8% Fibonacci retracement level, suggesting potential resistance.
No significant volatility spike is detected.
Day Trading Signals:
Independent of the main trend signals, the indicator also generates intraday buy and sell signals when the price crosses above or below the 20-period day trading MA.
Price Action Signals:
The indicator can trigger buy or sell signals based purely on price action, such as the occurrence of bullish or bearish engulfing patterns. This is optional and can be enabled or disabled.
Alerts:
The indicator includes built-in alert conditions that notify the trader when a buy or sell signal is generated. This allows traders to act immediately without having to constantly monitor the charts.
Practical Application:
This indicator is versatile and can be used across various trading styles:
Position Trading: The long-term MA, Fibonacci retracement, and ADX provide a solid foundation for identifying long-term trends and potential entry/exit points.
Day Trading: The short-term MA and day trading MA offer quick signals for intraday trading.
Price Action: Candlestick pattern recognition allows for precise entry points based on market sentiment and behavior.
News Trading: The volatility spike filter helps avoid trading during periods of market instability, often driven by news events.
Conclusion:
The Comprehensive Trading Strategy Indicator is a robust tool designed to help traders navigate various market conditions by integrating multiple strategies into a single, coherent framework. It provides clear, actionable signals while filtering out potentially dangerous trades during volatile or weak market conditions. Whether you're a long-term trader, a day trader, or someone who relies on price action, this indicator can be a valuable addition to your trading toolkit.

Breadth Thrust Strategy with Volatility Stop-LossThe "Breadth Thrust Strategy with Volatility Stop-Loss" is a trading strategy designed to capitalize on market momentum while managing risk through volatility-based stop-losses. Here's a detailed breakdown of the strategy:
Strategy Overview:
Market Breadth Analysis: The strategy uses the "Breadth Thrust Indicator," which evaluates market momentum by calculating the ratio of advancing stocks to the total number of stocks on the New York Stock Exchange (NYSE). This indicator helps identify bullish market conditions. An optional feature allows for the inclusion of volume data in this calculation, enhancing the signal's robustness.
Signal Generation: A long position is triggered when the smoothed breadth ratio (or the combined breadth and volume ratio) crosses above a specified low threshold (e.g., 0.4). This crossover indicates a potential shift towards positive market momentum.
Key Parameters:
Smoothing Length (length): Defines the period over which the breadth or combined ratio is smoothed using a simple moving average (SMA) to reduce noise and highlight the underlying trend.
Low Threshold (threshold_low): The level below which the smoothed ratio must fall before crossing back above to trigger a long signal.
Hold Periods (hold_periods): The minimum number of periods for which the position will be held once entered, ensuring the strategy captures a meaningful move.
Volatility Multiplier (volatility_multiplier): A multiplier applied to the Average True Range (ATR) to determine the distance of the stop-loss from the entry price, which adjusts according to market volatility.
Trade Management:
Entry Signal: The strategy enters a long position when the smoothed combined ratio crosses above the low threshold, signaling a potential bullish reversal.
ATR-Based Stop-Loss: Upon entering a trade, the strategy calculates a stop-loss level based on the ATR, which measures market volatility. The stop-loss is set at a distance from the entry price, determined by multiplying the ATR by the specified volatility multiplier. This adaptive stop-loss mechanism helps protect the position from adverse market moves.
Stop-Loss Adjustment: While the position is open, the stop-loss level is dynamically updated, ensuring it never decreases (trailing stop-loss effect) but can be adjusted upwards to reflect the latest price action relative to volatility.
Position Closure: The position is closed if:
The market price falls to or below the stop-loss level.
The position has been held for the specified number of periods (hold_periods), after which it is automatically closed.
Additional Settings:
Initial Capital: The strategy starts with an initial capital of $10,000.
Commissions and Slippage: Each trade incurs a commission of $5 per order, and slippage is accounted for at $1 per trade.
Background Highlighting: The chart background turns green when a position is open, providing a clear visual indication of the active trade.
This strategy is designed to identify and capitalize on upward momentum in the market while employing a volatility-adjusted stop-loss to manage risk. By combining market breadth analysis with volatility-based stop-losses, the strategy aims to balance profit potential with protection against sudden market reversals.

Multi-Regression StrategyIntroducing the "Multi-Regression Strategy" (MRS) , an advanced technical analysis tool designed to provide flexible and robust market analysis across various financial instruments.
This strategy offers users the ability to select from multiple regression techniques and risk management measures, allowing for customized analysis tailored to specific market conditions and trading styles.
Core Components:
Regression Techniques:
Users can choose one of three regression methods:
1 - Linear Regression: Provides a straightforward trend line, suitable for steady markets.
2 - Ridge Regression: Offers a more stable trend estimation in volatile markets by introducing a regularization parameter (lambda).
3 - LOESS (Locally Estimated Scatterplot Smoothing): Adapts to non-linear trends, useful for complex market behaviors.
Each regression method calculates a trend line that serves as the basis for trading decisions.
Risk Management Measures:
The strategy includes nine different volatility and trend strength measures. Users select one to define the trading bands:
1 - ATR (Average True Range)
2 - Standard Deviation
3 - Bollinger Bands Width
4 - Keltner Channel Width
5 - Chaikin Volatility
6 - Historical Volatility
7 - Ulcer Index
8 - ATRP (ATR Percentage)
9 - KAMA Efficiency Ratio
The chosen measure determines the width of the bands around the regression line, adapting to market volatility.
How It Works:
Regression Calculation:
The selected regression method (Linear, Ridge, or LOESS) calculates the main trend line.
For Ridge Regression, users can adjust the lambda parameter for regularization.
LOESS allows customization of the point span, adaptiveness, and exponent for local weighting.
Risk Band Calculation:
The chosen risk measure is calculated and normalized.
A user-defined risk multiplier is applied to adjust the sensitivity.
Upper and lower bounds are created around the regression line based on this risk measure.
Trading Signals:
Long entries are triggered when the price crosses above the regression line.
Short entries occur when the price crosses below the regression line.
Optional stop-loss and take-profit mechanisms use the calculated risk bands.
Customization and Flexibility:
Users can switch between regression methods to adapt to different market trends (linear, regularized, or non-linear).
The choice of risk measure allows adaptation to various market volatility conditions.
Adjustable parameters (e.g., regression length, risk multiplier) enable fine-tuning of the strategy.
Unique Aspects:
Comprehensive Regression Options:
Unlike many indicators that rely on a single regression method, MRS offers three distinct techniques, each suitable for different market conditions.
Diverse Risk Measures: The strategy incorporates a wide range of volatility and trend strength measures, going beyond traditional indicators to provide a more nuanced view of market dynamics.
Unified Framework:
By combining advanced regression techniques with various risk measures, MRS offers a cohesive approach to trend identification and risk management.
Adaptability:
The strategy can be easily adjusted to suit different trading styles, timeframes, and market conditions through its various input options.
How to Use:
Select a regression method based on your analysis of the current market trend (linear, need for regularization, or non-linear).
Choose a risk measure that aligns with your trading style and the market's current volatility characteristics.
Adjust the length parameter to match your preferred timeframe for analysis.
Fine-tune the risk multiplier to set the desired sensitivity of the trading bands.
Optionally enable stop-loss and take-profit mechanisms using the calculated risk bands.
Monitor the regression line for potential trend changes and the risk bands for entry/exit signals.
By offering this level of customization within a unified framework, the Multi-Regression Strategy provides traders with a powerful tool for market analysis and trading decision support. It combines the robustness of regression analysis with the adaptability of various risk measures, allowing for a more comprehensive and flexible approach to technical trading.

ICT Power Of Three | Flux Charts💎 GENERAL OVERVIEW
Introducing our new ICT Power Of Three Indicator! This indicator is built around the ICT's "Power Of Three" strategy. This strategy makes use of these 3 key smart money concepts : Accumulation, Manipulation and Distribution. Each step is explained in detail within this write-up. For more information about the process, check the "HOW DOES IT WORK" section.
Features of the new ICT Power Of Three Indicator :
Implementation of ICT's Power Of Three Strategy
Different Algorithm Modes
Customizable Execution Settings
Customizable Backtesting Dashboard
Alerts for Buy, Sell, TP & SL Signals
📌 HOW DOES IT WORK ?
The "Power Of Three" comes from these three keywords "Accumulation, Manipulation and Distribution". Here is a brief explanation of each keyword :
Accumulation -> Accumulation phase is when the smart money accumulate their positions in a fixed range. This phase indicates price stability, generally meaning that the price constantly switches between up & down trend between a low and a high pivot point. When the indicator detects an accumulation zone, the Power Of Three strategy begins.
Manipulation -> When the smart money needs to increase their position sizes, they need retail traders' positions for liquidity. So, they manipulate the market into the opposite direction of their intended direction. This will result in retail traders opening positions the way that the smart money intended them to do, creating liquidity. After this step, the real move that the smart money intended begins.
Distribution -> This is when the real intention of the smart money comes into action. With the new liquidity thanks to the manipulation phase, the smart money add their positions towards the opposite direction of the retail mindset. The purpose of this indicator is to detect the accumulation and manipulation phases, and help the trader move towards the same direction as the smart money for their trades.
Detection Methods Of The Indicator :
Accumulation -> The indicator detects accumulation zones as explained step-by-step :
1. Draw two lines from the lowest point and the highest point of the latest X bars.
2. If the (high line - low line) is lower than Average True Range (ATR) * accumulationConstant
3. After the condition is validated, an accumulation zone is detected. The accumulation zone will be invalidated and manipulation phase will begin when the range is broken.
Manipulation -> If the accumulation range is broken, check if the current bar closes / wicks above the (high line + ATR * manipulationConstant) or below the (low line - ATR * manipulationConstant). If the condition is met, the indicator detects a manipulation zone.
Distribution -> The purpose of this indicator is to try to foresee the distribution zone, so instead of a detection, after the manipulation zone is detected the indicator automatically create a "shadow" distribution zone towards the opposite direction of the freshly detected manipulation zone. This shadow distribution zone comes with a take-profit and stop-loss layout, customizable by the trader in the settings.
The X bars, accumulationConstant and manipulationConstant are subject to change with the "Algorithm Mode" setting. Read the "Settings" section for more information.
This indicator follows these steps and inform you step by step by plotting them in your chart.
🚩UNIQUENESS
This indicator is an all-in-one suite for the ICT's Power Of Three concept. It's capable of plotting the strategy, giving signals, a backtesting dashboard and alerts feature. Different and customizable algorithm modes will help the trader fine-tune the indicator for the asset they are currently trading. The backtesting dashboard allows you to see how your settings perform in the current ticker. You can also set up alerts to get informed when the strategy is executable for different tickers.
⚙️SETTINGS
1. General Configuration
Algorithm Mode -> The indicator offers 3 different detection algorithm modes according to your needs. Here is the explanation of each mode.
a) Small Manipulation
This mode has the default bar length for the accumulation detection, but a lower manipulation constant, meaning that slighter imbalances in the price action can be detected as manipulation. This setting can be useful on tickers that have lower liquidity, thus can be manipulated easier.
b) Big Manipulation
This mode has the default bar length for the accumulation detection, but a higher manipulation constant, meaning that heavier imbalances on the price action are required in order to detect manipulation zones. This setting can be useful on tickers that have higher liquidity, thus can be manipulated harder.
c) Short Accumulation
This mode has a ~70% lower bar length requirement for accumulation zone detection, and the default manipulation constant. This setting can be useful on tickers that are highly volatile and do not enter accumulation phases too often.
Breakout Method -> If "Close" is selected, bar close price will be taken into calculation when Accumulation & Manipulation zone invalidation. If "Wick" is selected, a wick will be enough to validate the corresponding zone.
2. TP / SL
TP / SL Method -> If "Fixed" is selected, you can adjust the TP / SL ratios from the settings below. If "Dynamic" is selected, the TP / SL zones will be auto-determined by the algorithm.
Risk -> The risk you're willing to take if "Dynamic" TP / SL Method is selected. Higher risk usually means a better winrate at the cost of losing more if the strategy fails. This setting is has a crucial effect on the performance of the indicator, as different tickers may have different volatility so the indicator may have increased performance when this setting is correctly adjusted.
3. Visuals
Show Zones -> Enables / Disables rendering of Accumulation (yellow) and Manipulation (red) zones.

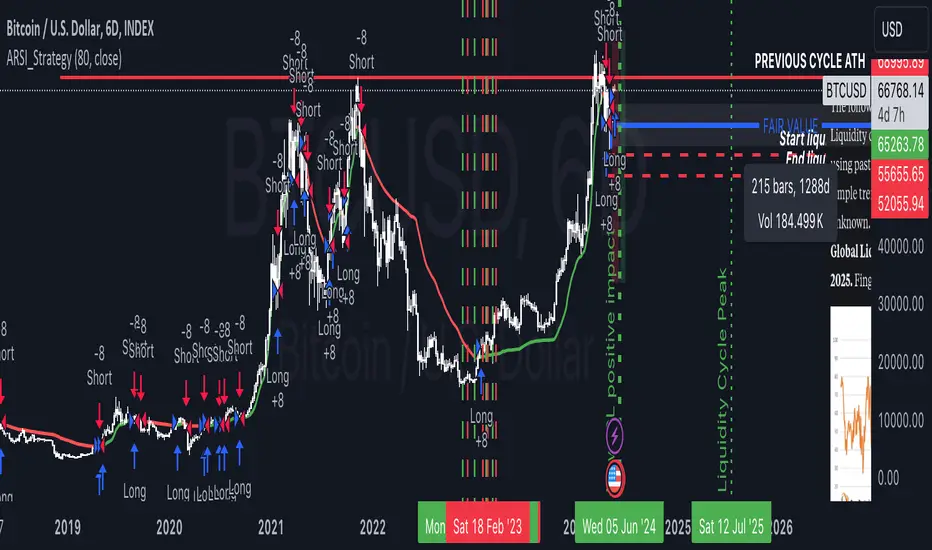
All Divergences with trend / SL - Uncle SamThanks to the main inspiration behind this strategy and the hard work of:
"Divergence for many indicators v4 by LonesomeTheBlue"
The "All Divergence" strategy is a versatile approach for identifying and acting upon various divergences in the market. Divergences occur when price and an indicator move in opposite directions, often signaling potential reversals. This strategy incorporates both regular and hidden divergences across multiple indicators (MACD, Stochastics, CCI, etc.) for a comprehensive analysis.
Key Features:
Comprehensive Divergence Analysis: The strategy scans for regular and hidden divergences across a variety of indicators, increasing the probability of identifying potential trade setups.
Trend Filter: To enhance accuracy, a moving average (MA) trend filter is integrated. This ensures trades align with the overall market trend, reducing the risk of false signals.
Customizable Risk Management: Users can adjust parameters for long/short stop-loss and take-profit levels to match their individual risk tolerance.
Additional Risk Management (Optional): An experimental MA-based risk management feature can be enabled to close positions if the market shows consecutive closes against the trend.
Clear Visuals: The script plots pivot points, divergence lines, and stop-loss levels on the chart for easy reference.
Strategy Settings (Defaults):
Enable Long/Short Strategy: True
Long/Short Stop Loss %: 2%
Long/Short Take Profit %: 5%
Enable MA Trend: True
MA Type: HMA (Hull Moving Average)
MA Length: 500
Use MA Risk Management: False (Experimental)
MA Risk Exit Candles: 2 (If enabled)
Pivot Period: 9
Source for Pivot Points: Close
Backtest Details (Example):
The strategy has been backtested on XAUUSD 1H (Goold/USD 1 hour timeframe) with a starting capital of $1,000. The backtest period covers around 2 years. A commission of 0.02% per trade and a 0.1% slippage per trade were factored in to simulate real-world trading costs.
Disclaimer:
This strategy is for educational and informational purposes only. Backtested results are not indicative of future performance. Use this strategy at your own risk. Always conduct your own analysis and consider consulting a financial professional before making any trading decisions.
Important Notes:
The default settings are a good starting point, but feel free to experiment to find optimal parameters for your specific trading style and market.
The MA-based risk management is an experimental feature. Use it with caution and thoroughly test it before deploying in live trading.
Backtest results can vary depending on the market, timeframe, and specific settings used. Always consider slippage and commission fees when evaluating a strategy's potential profitability.

High & Low Of Custom Session - Breakout True Open [cognyto]This indicator is based on the High & Low Of Custom Session - OpeningRange Breakout (Expo) created by Zeiierman.
It adds new functionality and enhances existing settings, targeting ES, NQ, and YM:
Manages session defaults to 12:00 to 13:00
New true opening fully customizable (default 13:00)
Manages timeframe visualization (default 15m and below)
Manages session draw length until the end of the current session (default NY)
Manages previous sessions, allowing the to be hidden
Improves timezone selection (default NY)
Following the strategy called Paradox detailed by DayTradingRauf, it works with indices like ES, NQ, and YM.
The rules consider three possible profiles:
First
AM session as consolidation (08:00-12:00)
Lunch hour range as consolidation (less than 100 points)
PM session breaking either side of the session range
Second
AM session trending lower (08:00-12:00)
Lunch hour range as consolidation (less than 100 points)
PM session trending higher
Third
AM session trending higher (08:00-12:00)
Lunch hour range as consolidation (less than 100 points)
PM session trending lower
After the session ends, the opening price at 13:00 is automatically drawn as it is a key point for the entry strategy.
The strategy can be monitored using a 5-minute or 15-minute timeframe as follows:
- Wait for a liquidity hunt (either the high or low of the lunch session range or AM is taken).
- If liquidity is taken, switch to the 1-minute timeframe and wait for a CISD (change in the state of delivery), where the price closes below an OB, or consider a breaker block or iFVG to enter the trade.
- Bullish entries should happen below the opening price at 13:00, and bearish entries should happen above.
- Consider a 1:2 reward ratio. However, runners can target the opposite side of the range that was not yet taken.
This indicator is for informational purposes only and you should not rely on any information it provides as legal, tax, investment, financial or other advice. Nothing provided by this indicator constitutes a solicitation, recommendation, endorsement or offer by cognyto or any third party service provider to buy or sell any securities or other financial instruments in this or any other jurisdiction in which such solicitation or offer would be unlawful under the securities laws of such jurisdiction.

Smoothed Heiken Ashi Candles with Delayed SignalsThis is a trend-following approach that uses a modified version of Heiken Ashi candles with additional smoothing. Here are the key components and features:
1. Heiken Ashi Modification: The strategy starts by calculating Heiken Ashi candles, which are known for better trend visualization. However, it modifies the traditional Heiken Ashi by using Exponential Moving Averages (EMAs) of the open, high, low, and close prices.
2. Double Smoothing: The strategy applies two layers of smoothing. First, it uses EMAs to calculate the Heiken Ashi values. Then, it applies another EMA to the Heiken Ashi open and close prices. This double smoothing aims to reduce noise and provide clearer trend signals.
3. Long-Only Approach: As the name suggests, this strategy only takes long positions. It doesn't short the market during downtrends but instead exits existing long positions when the sell signal is triggered.
4. Entry and Exit Conditions:
- Entry (Buy): When the smoothed Heiken Ashi candle color changes from red to green (indicating a potential start of an uptrend).
- Exit (Sell): When the smoothed Heiken Ashi candle color changes from green to red (indicating a potential end of an uptrend).
5. Position Sizing: The strategy uses a percentage of equity for position sizing, defaulting to 100% of available equity per trade. This should be tailored to each persons unique approach. Responsible trading would use less than 5% for each trade. The starting capital used is a responsible and conservative $1000, reflecting the average trader.
This strategy aims to provide a smooth, trend-following approach that may be particularly useful in markets with clear, sustained trends. However, it may lag in choppy or ranging markets due to its heavy smoothing. As with any strategy, it's important to thoroughly back test and forward test before using it with real capital, and to consider using it in conjunction with other analysis tools and risk management techniques.
Other smoothed Heiken Ashi indicators do not provide buy and sell signals, and only show the change in color to dictate a change in trend. By adding buy and sell signals after the close of the changing candle, alerts can be programmed, which helps this be a more hands off protocol to experiment with. Other smoothed Heiken Ashi indicators do not allow for alarms to be set.
This is a unique HODL strategy which helps identify a change in trend, without the noise of day to day volatility. By switching to a line chart, it removes the candles altogether to avoid even more noise. The goal is to HODL a coin while the color is bullish in an uptrend, but once the indicator gives a sell signal, to sell the holdings back to a stable coin and let the chart ride down. Once the chart gives the next buy signal, use that same capital to buy back into the asset. In essence this removes potential losses, and helps buy back in cheaper, gaining more quantitity fo the asset, and therefore reducing your average initial buy in price.
Most HODL strategies ride the price up, miss selling at the top, then riding the price back down in anticipation that it will go back up to sell. This strategy will not hit the absolute tops, but it will greatly reduce potential losses.

Smoothed Heiken Ashi Strategy Long OnlyThis is a trend-following approach that uses a modified version of Heiken Ashi candles with additional smoothing. Here are the key components and features:
1. Heiken Ashi Modification: The strategy starts by calculating Heiken Ashi candles, which are known for better trend visualization. However, it modifies the traditional Heiken Ashi by using Exponential Moving Averages (EMAs) of the open, high, low, and close prices.
2. Double Smoothing: The strategy applies two layers of smoothing. First, it uses EMAs to calculate the Heiken Ashi values. Then, it applies another EMA to the Heiken Ashi open and close prices. This double smoothing aims to reduce noise and provide clearer trend signals.
3. Long-Only Approach: As the name suggests, this strategy only takes long positions. It doesn't short the market during downtrends but instead exits existing long positions when the sell signal is triggered.
4. Entry and Exit Conditions:
- Entry (Buy): When the smoothed Heiken Ashi candle color changes from red to green (indicating a potential start of an uptrend).
- Exit (Sell): When the smoothed Heiken Ashi candle color changes from green to red (indicating a potential end of an uptrend).
5. Position Sizing: The strategy uses a percentage of equity for position sizing, defaulting to 100% of available equity per trade. This should be tailored to each persons unique approach. Responsible trading would use less than 5% for each trade. The starting capital used is a responsible and conservative $1000, reflecting the average trader.
This strategy aims to provide a smooth, trend-following approach that may be particularly useful in markets with clear, sustained trends. However, it may lag in choppy or ranging markets due to its heavy smoothing. As with any strategy, it's important to thoroughly backtest and forward test before using it with real capital, and to consider using it in conjunction with other analysis tools and risk management techniques.
This has been created mainly to provide data to judge what time frame is most profitable for any single asset, as the volatility of each asset is different. This can bee seen using it on AUXUSD, which has a higher profitable result on the daily time frame, whereas other currencies need a higher or lower time frame. The user can toggle between each time frame and watch for the higher profit results within the strategy tester window.
Other smoothed Heiken Ashi indicators also do not provide buy and sell signals, and only show the change in color to dictate a change in trend. By adding buy and sell signals after the close of the candle in which the candle changes color, alerts can be programmed, which helps this be a more hands off protocol to experiment with. Other smoothed Heiken Ashi indicators do not allow for alarms to be set.
This is a unique HODL strategy which helps identify a change in trend, without the noise of day to day volatility. By switching to a line chart, it removes the candles altogether to avoid even more noise. The goal is to HODL a coin while the color is bullish in an uptrend, but once the indicator gives a sell signal, to sell the holdings back to a stable coin and let the chart ride down. Once the chart gives the next buy signal, use that same capital to buy back into the asset. In essence this removes potential losses, and helps buy back in cheaper, gaining more quantitity fo the asset, and therefore reducing your average initial buy in price.
Most HODL strategies ride the price up, miss selling at the top, then riding the price back down in anticipation that it will go back up to sell. This strategy will not hit the absolute tops, but it will greatly reduce potential losses.

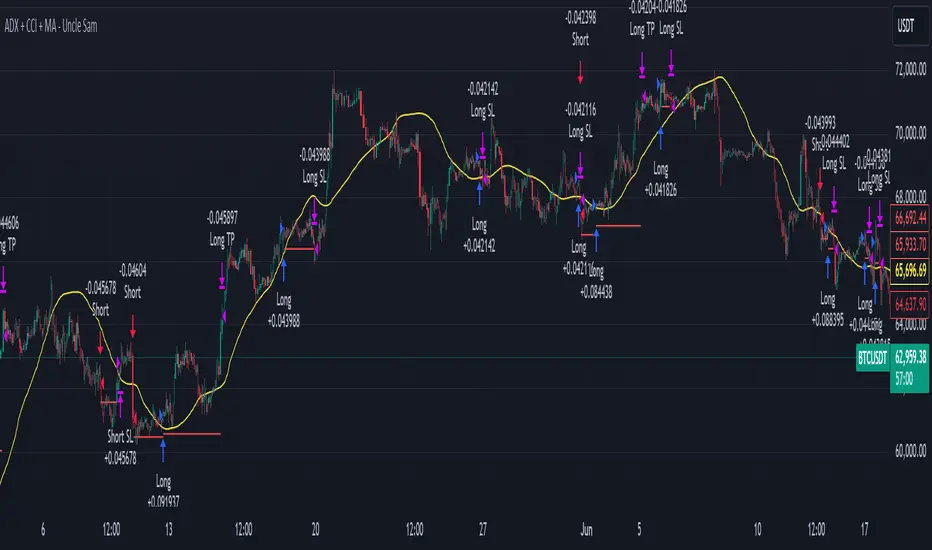
ADX + CCI + MA - Uncle SamStrategy Name: ADX + CCI + MA - Uncle Sam
Overview
This strategy aims to capitalize on trending markets by combining the Average Directional Index (ADX), Commodity Channel Index (CCI), and a customizable Moving Average (MA). It's designed for traders seeking a balanced approach to both long (buy) and short (sell) opportunities. Special thanks to the creators of the ADX and CCI indicators for their invaluable contributions to technical analysis.
Strategy Concept
The core idea is to identify strong trends with the ADX, confirm potential entry points with the CCI, and use the MA to filter trades in the direction of the broader trend. This approach seeks to avoid entering positions during periods of consolidation or when the trend is weak.
Indicator Logic
ADX (Average Directional Index): The ADX measures the strength of a trend, regardless of its direction. A value above the customizable adx_threshold (default 20) signals a strong trend, making it a prime environment for this strategy.
CCI (Commodity Channel Index): The CCI is a momentum oscillator that helps identify overbought (above 100) and oversold (below -100) conditions. We use CCI crossovers to time entries in the direction of the prevailing trend.
MA (Moving Average): The MA acts as a trend filter, ensuring we only enter trades aligned with the overall market direction. You have flexibility in choosing the MA type (SMA, EMA, etc.) and its length to suit your trading style and timeframe.
Entry Conditions
Long (Buy):
ADX is above the adx_threshold.
CCI crosses above 100.
Price is above the chosen Moving Average (if MA trend filtering is enabled).
Short (Sell):
ADX is above the adx_threshold.
CCI crosses below -100.
Price is below the chosen Moving Average (if MA trend filtering is enabled).
Exit Conditions
Stop Loss (SL): Each position has a customizable stop-loss percentage to manage risk. The default setting is 1%.
Take Profit (TP): Each position has a customizable take-profit percentage to secure gains. The default setting is 5%.
MA-Based Risk Management (Optional): This feature allows for early exits if the price closes against the MA trend for a specified number of candles. The default setting is 2 candles.
Default Settings
CCI Period: 15
ADX Length: 10
ADX Threshold: 20
MA Type: HMA
MA Length: 200
MA Source: Close
Commission Fee: $0.0
A commission fee is not added, add your trading/platform commission for realistic trading costs.
Backtest Results
The strategy has been backtested on with the default settings and a starting capital of $1000, with 0.0% commission fee. It shows promising results.
Disclaimer: Backtesting is hypothetical and does not guarantee future performance.
Important Considerations:
Customization: The strategy offers extensive customization to tailor it to your preferences. Experiment with different parameters and settings to find what works best for your trading style.
Risk Management: Always use proper risk management techniques, including position sizing and stop losses, to protect your capital.
Advanced Gold Scalping Strategy with RSI Divergence# Advanced Gold Scalping Strategy with RSI Divergence
## Overview
This Pine Script implements an advanced scalping strategy for gold (XAUUSD) trading, primarily designed for the 1-minute timeframe. The strategy utilizes the Relative Strength Index (RSI) indicator along with its moving average to identify potential trade setups based on divergences between price action and RSI movements.
## Key Components
### 1. RSI Calculation
- Uses a customizable RSI length (default: 60)
- Allows selection of the source for RSI calculation (default: close price)
### 2. Moving Average of RSI
- Supports multiple MA types: SMA, EMA, SMMA (RMA), WMA, VWMA, and Bollinger Bands
- Customizable MA length (default: 3)
- Option to display Bollinger Bands with adjustable standard deviation multiplier
### 3. Divergence Detection
- Implements both bullish and bearish divergence identification
- Uses pivot high and pivot low points to detect divergences
- Allows for customization of lookback periods and range for divergence detection
### 4. Entry Conditions
- Long Entry: Bullish divergence when RSI is below 40
- Short Entry: Bearish divergence when RSI is above 60
### 5. Trade Management
- Stop Loss: Customizable, default set to 11 pips
- Take Profit: Customizable, default set to 33 pips
### 6. Visualization
- Plots RSI line and its moving average
- Displays horizontal lines at 30, 50, and 70 RSI levels
- Shows Bollinger Bands when selected
- Highlights divergences with "Bull" and "Bear" labels on the chart
## Input Parameters
- RSI Length: Adjusts the period for RSI calculation
- RSI Source: Selects the price source for RSI (close, open, high, low, hl2, hlc3, ohlc4)
- MA Type: Chooses the type of moving average applied to RSI
- MA Length: Sets the period for the moving average
- BB StdDev: Adjusts the standard deviation multiplier for Bollinger Bands
- Show Divergence: Toggles the display of divergence labels
- Stop Loss: Sets the stop loss distance in pips
- Take Profit: Sets the take profit distance in pips
## Strategy Logic
1. **RSI Calculation**:
- Computes RSI using the specified length and source
- Calculates the chosen type of moving average on the RSI
2. **Divergence Detection**:
- Identifies pivot points in both price and RSI
- Checks for higher lows in RSI with lower lows in price (bullish divergence)
- Checks for lower highs in RSI with higher highs in price (bearish divergence)
3. **Trade Entry**:
- Enters a long position when a bullish divergence is detected and RSI is below 40
- Enters a short position when a bearish divergence is detected and RSI is above 60
4. **Position Management**:
- Places a stop loss order at the entry price ± stop loss pips (depending on the direction)
- Sets a take profit order at the entry price ± take profit pips (depending on the direction)
5. **Visualization**:
- Plots the RSI and its moving average
- Draws horizontal lines for overbought/oversold levels
- Displays Bollinger Bands if selected
- Shows divergence labels on the chart for identified setups
## Usage Instructions
1. Apply the script to a 1-minute XAUUSD (Gold) chart in TradingView
2. Adjust the input parameters as needed:
- Increase RSI Length for less frequent but potentially more reliable signals
- Modify MA Type and Length to change the sensitivity of the RSI moving average
- Adjust Stop Loss and Take Profit levels based on current market volatility
3. Monitor the chart for Bull (long) and Bear (short) labels indicating potential trade setups
4. Use in conjunction with other analysis and risk management techniques
## Considerations
- This strategy is designed for short-term scalping and may not be suitable for all market conditions
- Always backtest and forward test the strategy before using it with real capital
- The effectiveness of divergence-based strategies can vary depending on market trends and volatility
- Consider using additional confirmation signals or filters to improve the strategy's performance
Remember to adapt the strategy parameters to your risk tolerance and trading style, and always practice proper risk management.

Versatile Moving Average StrategyVersatile Moving Average Strategy (VMAS)
Overview:
The Versatile Moving Average Strategy (VMAS) is designed to provide traders with a flexible approach to trend-following, utilizing multiple types of moving averages. This strategy allows for customization in choosing the moving average type and length, catering to various market conditions and trading styles.
Key Features:
- Multiple Moving Average Types: Choose from SMA, EMA, SMMA (RMA), WMA, VWMA, HULL, LSMA, and ALMA to best suit your trading needs.
- Customizable Inputs: Adjust the moving average length, source of price data, and stop-loss source to fine-tune the strategy.
- Target Percent: Set the percentage difference between successive profit targets to manage your risk and rewards effectively.
- Position Management: Enable or disable long and short positions, allowing for versatility in different market conditions.
- Commission and Slippage: The strategy includes realistic commission settings to ensure accurate backtesting results.
Strategy Logic:
1. Moving Average Calculation: The selected moving average is calculated based on user-defined parameters.
2. Entry Conditions:
- A long position is entered when the entry source crosses over the moving average, if long positions are enabled.
- A short position is entered when the entry source crosses under the moving average, if short positions are enabled.
3. Stop-Loss: Positions are closed if the stop-loss source crosses the moving average in the opposite direction.
4. Profit Targets: Multiple profit targets are defined, with each target set at an incremental percentage above (for long positions) or below (for short positions) the entry price.
Default Properties:
- Account Size: $10000
- Commission: 0.01% per trade
- Risk Management: Positions are sized to risk 80% of the equity per trade, because we get very tight stoploss when position is open.
- Sample Size: Backtesting has been conducted to ensure a sufficient sample size of trades, ideally more than 100 trades.
How to Use:
1. Configure Inputs: Set your preferred moving average type, length, and other input parameters.
2. Enable Positions: Choose whether to enable long, short, or both types of positions.
3. Backtest and Analyze: Run backtests with realistic settings and analyze the results to ensure the strategy aligns with your trading goals.
4. Deploy and Monitor: Once satisfied with the backtesting results, deploy the strategy in a live environment and monitor its performance.
This strategy is suitable for traders looking to leverage moving averages in a versatile and customizable manner. Adjust the parameters to match your trading style and market conditions for optimal results.
Note: Ensure the strategy settings used for publication are the same as those described here. Always conduct thorough backtesting before deploying any strategy in a live trading environment.

Bloodbath IndicatorThis indicator identifies days where the number of new 52-week lows for all issues exceeds a user-defined threshold (default 4%), potentially signaling a market downturn. The background of the chart turns red on such days, providing a visual alert to traders following the "Bloodbath Sidestepping" strategy.
Based on: "THE RIPPLE EFFECT OF DAILY NEW LOWS," By Ralph Vince and Larry Williams, 2024 Charles H. Dow Award Winner
threshold: Percentage of issues making new 52-week lows to trigger the indicator (default: 4.0).
Usage:
The chart background will turn red on days exceeding the threshold of new 52-week lows.
Limitations:
This indicator relies on historical data and doesn't guarantee future performance.
It focuses solely on new 52-week lows and may miss other market signals.
The strategy may generate false positives and requires further analysis before trading decisions.
Disclaimer:
This script is for informational purposes only and should not be considered financial advice. Always conduct your own research before making any trading decisions.

VAWSI and Trend Persistance Reversal Strategy SL/TPThis is a completely revamped version of my "RSI and ATR Trend Reversal Strategy."
What's New?
The RSI has been replaced with an original indicator of mine, the "VAWSI," as I've elected to call it.
The standard RSI measures a change in an RMA to determine the strength of a movement.
The VAWSI performs very similarly, except it uses another original indicator of mine, the VAWMA.
VAWMA stands for "Volume (and) ATR Weight Moving Average." It takes an average of the volume and ATR and uses the ratio of each bar to weigh a moving average of the source.
It has the same formula as an RSI, but uses the VAWMA instead of an RMA.
Next we have the Trend Persistence indicator, which is an index on how long a trend has been persisting for. It is another original indicator. It takes the max deviation the source has from lowest/highest of a specified length. It then takes a cumulative measure of that amount, measures the change, then creates a strength index with that amount.
The VAWSI is a measure of an emerging trend, and the Trend Persistence indicator is a measure of how long a trend has persisted.
Finally, the 3rd main indicator, is a slight variation of an ATR. Rather than taking the max of source - low or high- source and source - source , it instead takes the max of high-low and the absolute value of source - the previous source. It then takes the absolute value of the change of this, and normalizes it with the source.
Inputs
Minimum SL/TP ensures that the Stop Loss and Take Profit still exist in untrendy markets. This is the minimum Amount that will always be applied.
VAWSI Weight is a divided by 100 multiplier for the VAWSI. So value of 200 means it is multiplied by 2. Think of it like a percentage.
Trend Persistence weight and ATR Weight are applied the same. Higher the number, the more impactful on the final calculation it is.
Combination Mult is an outright multiplier to the final calculation. So a 2.0 = * 2.0
Trend Persistence Smoothing Length is the length of the weighted moving average applied to the Trend Persistence Strength index.
Length Cycle Decimal is a replacement of length for the script.
Here we used BlackCat1402's Dynamic Length Calculation, which can be found on his page. With his permission we have implemented it into this script. Big shout out to them for not only creating, but allowing us to use it here.
The Length Cycle Decimal is used to calculate the dynamic length. Because TradingView only allows series int for their built-in library, a lot of the baseline indicators we use have to be manually recreated as functions in the following section.
The Strategy
As usual, we use Heiken Ashi values for calculations.
We begin by establishing the minimum SL/TP for use later.
Next we determine the amount of bars back since the last crossup or crossdown of our threshold line.
We then perform some normalization of our multipliers. We want a larger trend or larger VAWSI amount to narrow the threshold, so we have 1 divide them. This way, a higher reading outputs a smaller number and vice versa. We do this for both Trend Persistence, and the VAWSI.
The VAWSI we also normalize, where rather than it being a 0-100 reading of trend direction and strength, we absolute it so that as long as a trend is strong, regardless of direction, it will have a higher reading. With these normalized values, we add them together and simply subtract the ATR measurement rather than having 1 divide it.
Here you can see how the different measurements add up. A lower final number suggests imminent reversal, and a higher final number suggests an untrendy or choppy market.
ATR is in orange, the Trend Persistence is blue, the VAWSI is purple, and the final amount is green.
We take this final number and depending on the current trend direction, we multiply it by either the Highest or Lowest source since the last crossup or crossdown. We then take the highest or lowest of this calculation, and have it be our Stop Loss or Take Profit. This number cannot be higher/lower than the previous source to ensure a rapid spike doesn't immediately close your position on a still continuing trend. As well, the threshold cannot be higher/ lower than the the specified Stop Loss and Take Profit
Only after the source has fully crossed these lines do we consider it a crossup or crossdown. We confirm this with a barstate.isconfirmed to prevent repainting. Next, each time there is a crossup or crossdown we enter a long or a short respectively and plot accordingly.
I have the strategy configured to "process on order close" to ensure an accurate backtesting result. You could also set this to false and add a 1 bar delay to the "if crossup" and "if crossdown" lines under strategy so that it is calculated based on the open of the next bar.
Final Notes
The amounts have been preconfigured for performance on RIOT 5 Minute timeframe. Other timeframes are viable as well. With a few changes to the parameters, this strategy has backtested well on NVDA, AAPL, TSLA, and AMD. I recommend before altering settings to try other timeframes first.
This script does not seem to perform nearly as well in typically untrendy and choppy markets such as crypto and forex. With some setting changes, I have seen okay results with crypto, but overfitting could be the cause there.
Thank you very much, and please enjoy.

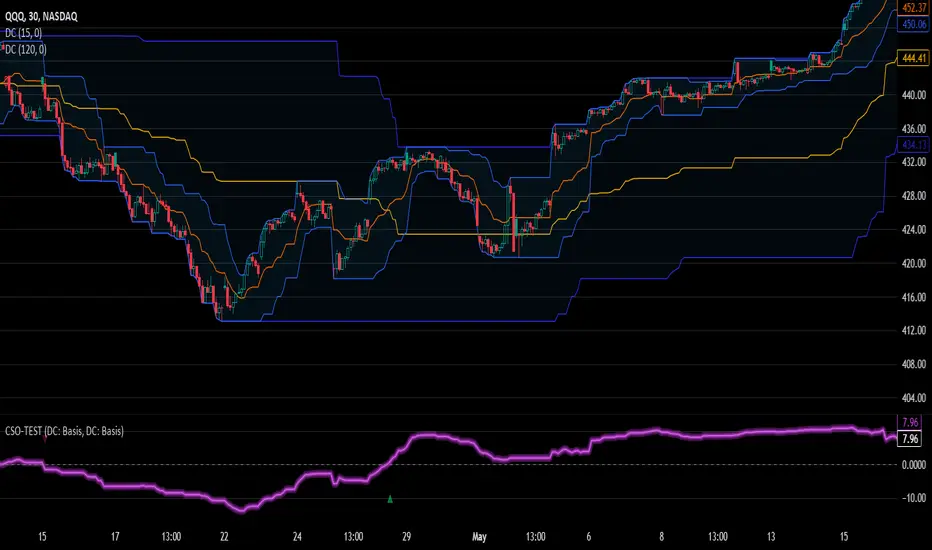
Custom Signal Oscillator StrategyThe CSO is made to help traders easily test their theories by subtracting the difference between two customizable plots(indicators) without having to search for strategies. The general purpose is to provide a tool to users without coding knowledge.
How to use :
Apply the indicator(s) to test
Go to the CSO strategy input settings and select the desired plots from the added indicators. (The back test will enter long or short depending on the fast signal crosses on the slow signal)
Pull up the strategy tester
Adjust the input settings on the selected indicator(s) to back test
For example, the published strategy is using the basis lines from two Donchian channels with varying length. This can be utilized with multiple overlays on the chart and oscillators that are operating on the same scale with each other. Since chart glows aren't extremely common, a glow option is included to stand out on the chart as the chain operator. A long only option for is also included for versatility.
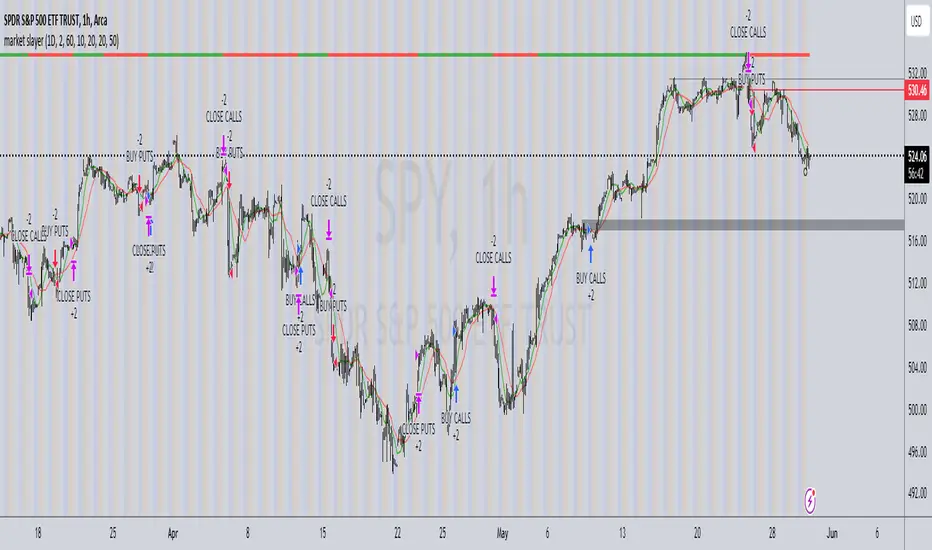
market slayerInput Parameters:
Various input parameters allow customization of the strategy, including options to show trend confirmation, specify trend timeframes and values, set SMA lengths, enable take profit and stop loss, and define their respective values.
Calculations:
Simple Moving Averages (SMAs) are calculated based on the specified lengths.
Buy and sell signals are generated based on the crossover and crossunder of the short and long SMAs.
Confirmation Bars:
Functions are defined to determine bullish or bearish confirmation bars based on certain conditions.
These confirmation bars are used to confirm trend direction and generate additional signals.
Plotting:
SMAs are plotted on the chart.
Trend labels and signal markers are plotted based on the calculated conditions.
Trade Signals:
Buy and sell conditions are defined based on the crossover/crossunder of SMAs and confirmation of trend direction.
Strategy entries and exits are executed accordingly.
Take Profit and Stop Loss:
Optional take profit and stop loss functionality is included.
Trades are automatically closed when profit or loss thresholds are reached.
Closing Trades:
Trades are also closed based on changes in trend confirmation bars to ensure alignment with the overall market direction.
Alerts:
Alert conditions are defined for opening and closing trades, providing notifications when certain conditions are met.
Overall, this script aims to provide a systematic approach to trading by combining moving average crossovers with trend confirmation bars, along with options for risk management through take profit and stop loss orders. Users can customize various parameters to adapt the strategy to different market conditions and trading preferences.
The script uses the request.security() function with the lookahead parameter set to barmerge.lookahead_on to access data from a higher timeframe within the Pine Script on TradingView. Let's break down why it's used:
Higher Timeframe Analysis:
By default, Pine Script operates on the timeframe of the chart it's applied to. However, in trading strategies, it's common to incorporate signals or data from higher timeframes to confirm or validate signals generated on lower timeframes. This helps traders to align their trades with the broader market trend.
Trend Confirmation:
In this script, the confirmationTrendTimeframe parameter allows users to specify a higher timeframe for trend confirmation. The request.security() function fetches the data from this higher timeframe and applies the defined conditions to confirm the trend direction.
Lookahead Behavior:
The lookahead parameter set to barmerge.lookahead_on ensures that the script considers the most up-to-date information available on the higher timeframe when making trading decisions on the lower timeframe. This prevents the script from lagging behind or using outdated data, enhancing the accuracy of trend confirmation.
Usage in confirmationTrendBullish and confirmationTrendBearish:
These variables are assigned the values returned by the request.security() function, which represents the bullish or bearish trend confirmation based on the conditions applied to the data from the higher timeframe.
KumoTrade Ichimoku StrategyThe KumoTrade Ichimoku Strategy is an advanced trading strategy designed to help users identify market trends and potential trading opportunities using the Ichimoku Kinko Hyo technical analysis indicator. This strategy leverages the Ichimoku cloud (Kumo) along with other crucial indicators such as the Tenkan-sen and Kijun-sen lines to generate strong signals.
Main Components of the Strategy:
Tenkan-sen (Conversion Line): Indicates the short-term direction of the price, typically calculated as the average of the highest high and the lowest low over the past 9 periods.
Kijun-sen (Base Line): Indicates the medium-term direction of the price, usually calculated as the average of the highest high and the lowest low over the past 26 periods.
Senkou Span A and Senkou Span B: These two lines form the cloud (Kumo), which projects future support and resistance levels.
Chikou Span (Lagging Span): Plots the current closing price 26 periods back to measure the market's momentum.
Strategy Rules:
Bullish Bias (Bias Bull): Indicates that the prices are in a long-term uptrend. In this strategy, this is confirmed if the low prices are above the daily EMA (Exponential Moving Average).
Kijun Sen Touch Down: Occurs when prices cross below the Kijun-sen line and then close back above it, indicating a potential bullish reversal.
Tenkan-Kijun Cross Up: A bullish signal generated when the Tenkan-sen line crosses above the Kijun-sen line.
Close Over Tenkan and Kijun: A strong bullish signal when the close price crosses above both the Tenkan-sen and Kijun-sen lines.
Trading Setups:
Long Setup: Generated when the Kijun-sen is above the highest point of the Kumo (senkou_max) and the closing price is below the lowest point of the Kumo (senkou_min). This setup is checked over the last 21 bars.
Short Setup: Generated when the Kijun-sen is below the lowest point of the Kumo (senkou_min) and the closing price is above the highest point of the Kumo (senkou_max). This setup is also checked over the last 21 bars. (Not avalible yet)
Entry Conditions:
Ultra Long Entry: This condition checks for a bullish bias, the Tenkan-Kijun cross up or Kijun Sen touch down, high volume, and that the price is not within the Kumo cloud.
Main Long Entry: This condition requires the closing price to be above the Kumo cloud, a green Kumo cloud, a bullish bias, the Tenkan rule, and that the price is not within the Kumo cloud.
Exit Conditions:
A trailing stop loss is implemented to protect profits. The stop loss level is dynamically updated based on the highest high of the last 5 bars minus three times the ATR (Average True Range) value.
Visuals on the Chart:
The Tenkan-sen and Kijun-sen lines are plotted for visual reference.
The Kumo cloud is displayed with different colors indicating bullish (green) or bearish (red) conditions.
Entry points are marked on the chart, and the trailing stop loss levels are plotted as well.
The KumoTrade Ichimoku Strategy aims to provide a comprehensive approach to trading by combining multiple aspects of the Ichimoku indicator to generate reliable trading signals and manage risk effectively.

Adaptive RSI StrategyThe Adaptive RSI Strategy is designed to give you an edge by adapting to changing market conditions more effectively than the traditional RSI. By adjusting dynamically to recent price movements, this strategy aims to provide more timely and accurate trade signals.
How Does It Work?
You can set the number of periods for the RSI calculation. The default is 14, but feel free to experiment with different lengths to suit your trading style.
Choose the price data to base the RSI on, typically the closing price.
Decide if you want the strategy to visually highlight upward and downward movements of the Adaptive RSI (ARSI) on the chart. This can help you quickly spot trends.
Adaptive Calculation:
Alpha: The strategy uses an adaptive factor called alpha, which changes based on recent RSI values. This makes the RSI more sensitive to recent market conditions.
Adaptive RSI (ARSI): This is the core of our strategy. It calculates the ARSI using the adaptive alpha, making it more responsive to price changes compared to the traditional RSI.
Trade Signals:
Long Entry (Buy Signal): The strategy triggers a buy signal when the ARSI value crosses above its previous value. This indicates a potential upward trend, suggesting it's a good time to enter a long position.
Short Entry (Sell Signal): Conversely, a sell signal is triggered when the ARSI value crosses below its previous value, indicating a potential downward trend and suggesting it's a good time to enter a short position.
Visual Representation:
If you enable the highlight movements feature, the ARSI line on the chart will change color: green for upward movements and red for downward movements. This makes it easier to see potential trade opportunities at a glance.
Why Use the Adaptive RSI Strategy?
Responsiveness: The adaptive nature of this strategy means it's more sensitive to market changes, helping you react quicker to new trends.
Customization: You can tailor the length of the RSI period and decide whether to highlight movements, allowing you to adapt the strategy to your specific needs and preferences.
Visual Clarity: Highlighting the ARSI movements on the chart makes it easier to spot trends and potential entry points, giving you a clearer picture of the market.
TASC 2024.06 REIT ETF Trading System█ OVERVIEW
This strategy script demonstrates the application of the Real Estate Investment Trust (REIT) ETF trading system presented in the article by Markos Katsanos titled "Is The Price REIT?" from TASC's June 2024 edition of Traders' Tips .
█ CONCEPTS
REIT stocks and ETFs offer a simplified, diversified approach to real estate investment. They exhibit sensitivity to interest rates, often moving inversely to interest rate and treasury yield changes. Markos Katsanos explores this relationship and the correlation of prices with the broader market to develop a trading strategy for REIT ETFs.
The script employs Bollinger Bands and Donchian channel indicators to identify oversold conditions and trends in REIT ETFs. It incorporates the 10-year treasury yield index (TNX) as a proxy for interest rates and the S&P 500 ETF (SPY) as a benchmark for the overall market. The system filters trade entries based on their behavior and correlation with the REIT ETF price.
█ CALCULATIONS
The strategy initiates long entries (buy signals) under two conditions:
1. Oversold condition
The weekly ETF low price dips below the 15-week Bollinger Band bottom, the closing price is above the value by at least 0.2 * ATR ( Average True Range ), and the price exceeds the week's median.
Either of the following:
– The TNX index is down over 15% from its 25-week high, and its correlation with the ETF price is less than 0.3.
– The yield is below 2%.
2. Uptrend
The weekly ETF price crosses above the previous week's 30-week Donchian channel high.
The SPY ETF is above its 20-week moving average.
Either of the following:
– Over ten weeks have passed since the TNX index was at its 30-week high.
– The correlation between the TNX value and the ETF price exceeds 0.3.
– The yield is below 2%.
The strategy also includes three exit (sell) rules:
1. Trailing (Chandelier) stop
The weekly close drops below the highest close over the last five weeks by over 1.5 * ATR.
The TNX value rises over the latest 25 weeks, with a yield exceeding 4%, or its value surges over 15% above the 25-week low.
2. Stop-loss
The ETF's price declines by at least 8% of the previous week's close and falls below the 30-week moving average.
The SPY price is down by at least 8%, or its correlation with the ETF's price is negative.
3. Overbought condition
The ETF's value rises above the 100-week low by over 50%.
The ETF's price falls over 1.5 * ATR below the 3-week high.
The ETF's 10-week Stochastic indicator exceeds 90 within the last three weeks.
█ DISCLAIMER
This strategy script educates users on the system outlined by the TASC article. However, note that its default properties might not fully represent real-world trading conditions for an individual. By default, it uses 10% of equity as the order size and a slippage amount of 5 ticks. Traders should adjust these settings and the commission amount when using this script. Additionally, since this strategy utilizes compound conditions on weekly data to trigger orders, it will generate significantly fewer trades than other, higher-frequency strategies.

Enhanced Forex IndicatorDescription of the "Enhanced Forex Indicator"
The "Enhanced Forex Indicator" is designed for traders who want a comprehensive technical analysis tool on the TradingView platform. This script integrates Exponential Moving Averages (EMAs), support and resistance zones, and candlestick pattern recognition to provide actionable trading signals, particularly useful for Forex and other financial markets. The script is suitable for intraday trading and swing trading.
Components of the Indicator
Exponential Moving Averages (EMAs):
Short EMA (Blue Line): Faster responding average, good for identifying recent trend changes.
Long EMA (Red Line): Slower moving average, helps in confirming longer-term trends.
Support and Resistance Zones:
Resistance Zone (Red): Area where potential selling pressure could overcome buying pressure, halting price increases temporarily or reversing them.
Support Zone (Green): Area where potential buying pressure could overcome selling pressure, supporting prices and preventing them from falling further.
Candlestick Patterns:
Bullish Engulfing Pattern (Green Triangle Up 'BE'): Suggests a potential upward reversal or start of a bullish trend.
Bearish Engulfing Pattern (Red Triangle Down 'BE'): Indicates a potential downward reversal or start of a bearish trend.
Buy/Sell Signals:
Buy Signal (Green Label 'BUY'): Triggered when the price is above both EMAs and a bullish engulfing pattern is detected.
Sell Signal (Red Label 'SELL'): Triggered when the price is below both EMAs and a bearish engulfing pattern is detected.
Trading Setup:
Entry: Consider entering a buy position when the 'BUY' signal appears, indicating bullish conditions. Enter a sell position when the 'SELL' signal appears, indicating bearish conditions.
Exit: Look for closing signals opposite your entry or use predefined take profit and stop loss levels. For instance, exit a buy position on a 'SELL' signal or when the price drops below the support zone.
Risk Management:
Set stop losses just below the support zone for buy orders and above the resistance zone for sell orders to protect against significant losses.
Adjust position sizes according to your risk tolerance and account balance.
Considerations:
Use this indicator in conjunction with other analysis tools and fundamental data to confirm signals and strengthen your trading strategy.
Periodically backtest the strategy based on this indicator to ensure its effectiveness in current market conditions.
Optimization:
Adjust the lengths of the EMAs and the buffer size of the support and resistance zones to better fit the asset's volatility and your trading timeframe.

Volume-Supported Linear Regression Trend Modified StrategyHi everyone, this will be my first published script on Tradingview, maybe more to come.
For quite some time I have been looking for a script that performs no matter if price goes up or down or sideways. I believe this strategy comes pretty close to that. Although nowhere near the so called "buy&hold equity" of BTC, it has produced consistent profits even when price goes down.
It is a strategy which seems to work best on the 1H timeframe for cryptocurrencies.
Just by testing different settings for SL and TP you can customize it for each pair.
THE STRATEGY:
Basically, I used the Volume Supported Linear Regression Trend Model that LonesomeTheBlue has created and modified a few things such as entry and exit conditions. So all credits go to him!
LONG ENTRY: When there is a bullish cross of the short term trend (the histogram/columns), while the long term trend is above 0 and rising.
SHORT ENTRY: When there is a bearish cross (green to red) of the short-term trend (the histogram/columns), while the long term trend is beneath 0 and decreasing.
LONG EXIT: Bearish crossover of short-term trend while long term trend is below 0
SHORT EXIT: Bullish crossover of short-term trend while long term trend is above 0
Combining this with e.g. a SL of 2% and a TP of 20% (as used in my backtesting), combined with pyramiding and correct risk management, it gives pretty consistent results.
Be aware, this is only for educational purpose and in no means financial advise. Past results do not guarantee future results. This strategy can lose money!
Enjoy :)
PS: It works not only on BTC of course, works even better on some other major crypto pairs. I'll leave it to you to find out which ones ;)
Price Based Z-Trend - Strategy [presentTrading]█ Introduction and How it is Different
Z-score: a statistical measurement of a score's relationship to the mean in a group of scores.
Simple but effective approach.
The "Price Based Z-Trend - Strategy " leverages the Z-score, a statistical measure that gauges the deviation of a price from its moving average, normalized against its standard deviation. This strategy stands out due to its simplicity and effectiveness, particularly in markets where price movements often revert to a mean. Unlike more complex systems that might rely on a multitude of indicators, the Z-Trend strategy focuses on clear, statistically significant price movements, making it ideal for traders who prefer a streamlined, data-driven approach.
BTCUSD 6h LS Performance
█ Strategy, How It Works: Detailed Explanation
🔶 Calculation of the Z-score
"Z-score is a statistical measurement that describes a value's relationship to the mean of a group of values. Z-score is measured in terms of standard deviations from the mean. If a Z-score is 0, it indicates that the data point's score is identical to the mean score. A Z-score of 1.0 would indicate a value that is one standard deviation from the mean. Z-scores may be positive or negative, with a positive value indicating the score is above the mean and a negative score indicating it is below the mean."
The Z-score is central to this strategy. It is calculated by taking the difference between the current price and the Exponential Moving Average (EMA) of the price over a user-defined length, then dividing this by the standard deviation of the price over the same length:
z = (x - μ) /σ
Local
🔶 Trading Signals
Trading signals are generated based on the Z-score crossing predefined thresholds:
- Long Entry: When the Z-score crosses above the positive threshold.
- Long Exit: When the Z-score falls below the negative threshold.
- Short Entry: When the Z-score falls below the negative threshold.
- Short Exit: When the Z-score rises above the positive threshold.
█ Trade Direction
The strategy allows users to select their preferred trading direction through an input option.
█ Usage
To use this strategy effectively, traders should first configure the Z-score thresholds according to their risk tolerance and market volatility. It's also crucial to adjust the length for the EMA and standard deviation calculations based on historical performance and the expected "noise" in price data.
The strategy is designed to be flexible, allowing traders to refine settings to better capture profitable opportunities in specific market conditions.
█ Default Settings
- Trade Direction: Both
- Standard Deviation Length: 100
- Average Length: 100
- Threshold for Z-score: 1.0
- Bar Color Indicator: Enabled
These settings offer a balanced starting point but can be customized to suit various trading styles and market environments. The strategy's parameters are designed to be adjusted as traders gain experience and refine their approach based on ongoing market analysis.
Z-score is a must-learn approach for every algorithmic trader.

Sector Rotation Hedging With Volatility Index [TradeDots]The "Sector Rotation Hedging Strategy With Volatility Index" is a comprehensive trading indicator developed to optimally leverage the S&P500 volatility index. It is designed to switch between distinct ETF sectors, strategically hedging to moderate risk exposure during harsh market volatility.
HOW DOES IT WORK
The core of this indicator is grounded on the S&P500 volatility index (VIX) close price and its 60-day moving average. This serves to determine whether the prevailing market volatility is above or below the quarterly average.
In periods of elevated market volatility, risk exposure escalates significantly. Traders retaining stocks in sectors with disproportionately high volatility face increased vulnerability to negative returns. To tackle this, our indicator employs a two-pronged approach utilizing two sequential candlestick close prices to confirm if volatility surpasses the average value.
Upon confirming above-average volatility, a hedging table is deployed to spotlight ETFs with low volatility, such as the Utilities Select Sector SPDR Fund (XLU), to derisk the overall portfolio.
Conversely, in low-volatility conditions, sectors yielding higher returns like the Technology Select Sector SPDR Fund (XLK) are preferred. The hedging table is utilized to earmark high-return sector ETFs.
Thus, during highly volatile market periods, the strategy recommends enhancing portfolio allocation to low-volatility ETFs. During low-volatility windows, the portfolio is calibrated towards high-volatility ETFs for heightened returns.
IMPORTANT CONSIDERATION
In real trading, additional considerations encompassing trading commissions, management fees, and ancillary rotation costs should be factored in. False signals may arise, potentially leading to losses from these fees.
RISK DISCLAIMER
Trading entails substantial risk, and most day traders incur losses. All content, tools, scripts, articles, and education provided by TradeDots serve purely informational and educational purposes. Past performances are not definitive predictors of future results.
