Weis V5 zigzag jayySomehow, I deleted version 5 of the zigzag script. Same name. I have added some older notes describing how the Weis Wave works.
I have also changed the date restriction that stopped the script from working after Dec 31, 2022.
What you see here is the Weis zigzag wave plotted directly on the price chart. This script is the companion to the Weis cumulative wave volume script.
What is a Weis wave? David Weis has been recognized as a Wyckoff method analyst he has written two books one of which, Trades About to Happen, describes the evolution of the now-popular Weis wave. The method employed by Weis is to identify waves of price action and to compare the strength of the waves on characteristics of wave strength. Chief among the characteristics of strength is the cumulative volume of the wave. There are other markers that Weis uses as well for example how the actual price difference between the start of the Weis wave from start to finish. Weis also uses time, particularly when using a Renko chart
David Weis did a futures io video which is a popular source of information about his method. (Search David Weis and futures.io. I strongly suggest you also read “Trades About to Happen” by David Weis.
This will get you up and running more quickly when studying charts. However, you should choose the Traditional method to be true to David Weis technique as described in his book "Trades About to Happen" and in the Futures IO Webcast featuring David Weis
. The Weis pip zigzag wave shows how far in terms of bar close price a Weis wave has traveled through the duration of a Weis wave. The Weis zigzag wave is used in combination with the Weis cumulative volume wave. The two waves should be set to the same "wave size".
To use this script, you must set the wave size: Using the traditional Weis method simply enter the desired wave size in the box "How should wave size be calculated", in this example I am using a traditional wave size of .25. Each wave for each security and each timeframe requires its own wave size. Although not the traditional method devised by David Weis a more automatic way to set wave size would be to use Average True Range (ATR). Using ATR is not the true Weis method but it does give you similar waves and, importantly, without the hassle described above. Once the Weis wave size is set then the zigzag wave will be shown with volume. Because Weis used the closing price of a wave to define waves a line Bar highs and bar lows are not captured by the Weis Wave. The default script setting is now cumulative volume waves using an ATR of 7 and a multiplication factor of .5.
To display volume in a way that does not crowd out neighbouring volumes Weis displayed volume as a maximum of 3 digits (usually). Consider two Weis Wave volumes 176,895,570 and 2,654,763,889. To display wave volume as three digits it is necessary to take a number such as 176,895,570 and truncate it. 176,895,570 can be represented as 177 X 10 to the power of 6. The number displayed must also be relative to other numbers in the field. If the highest volume on the page is: 2,654,763,889 and with only three numbers available to display the result the value shown must be 265 (265 X 10 to the power of 7). Since 176,895,570 is an order of magnitude smaller than 2,654,763,889 therefore 175,895,570 must be shown as 18 instead of 177. In this way, the relative magnitudes of the two volumes can be understood. All numbers in the field of view must be truncated by the same order of magnitude to make the relative volumes understandable. The script attempts to calculate the order of magnitude value automatically. If you see a red number in the field of view it means the script has failed to do the calculation automatically and you should use the manual method – use the dialogue box “Calculate truncated wave value automatically or manually”. Scroll down from the automatic method and select manual. Once "manual" is selected the values displayed become the power values or multipliers for each wave.
Using the manual method you will select a “Multiplier” in the next dialogue box. Scan the field and select the largest value in the field of view (visible chart) is the multiplier of interest. If you select a lower number than the maximum value will see at least one red “up”. If you are too high you will see at least one red “down”. Scroll in the direction recommended or the values on the screen will be totally incorrect. With volume truncated to the highest order values, the eye can quickly get a feel for relative volumes. It also reduces the crowding and overlapping of values on the screen. You can opt to show the full volume to help get a sense of the magnitude of the true volumes.
How does the script determine if a Weis wave is continuing to grow or not?
The script evaluates the closing price of each new bar relative to the "Weis wave size". Suppose the current bar closes at a new low close, within the current down wave, at $30.00. If the Weis wave size is $0.10 then the algorithm will remember the $30.00 close and compare it to the close of the next bar. If the bar close price does not close equal to or lower than $30.00 or close equal to or higher than $30.10 then the wave is still a down wave with a current low of $30.00. This is true even if the bar low is less than $30.00 or the bar high is greater than 30.10 – only the bar’s closing price matters. If a bar's closing price climbs back up to a close of $30.11 then because the closing price has moved more than $0.10 (the Weis wave size) then that is a wave reversal with a new up-trending wave. In the above example if there was currently a downward trending wave and the bar closes were as follows $30.00, $30.09, $30.01, $30.05, $30.10 The wave direction would continue to stay downward trending until the close of $30.10 was achieved. As such $30.00 would be the low and the following closes $30.09, $30.01, $30.05 would be allocated to the new upward-trending wave. If however There was a series of bar closes like this $30.00, $30.09, $30.01, $30.05, $29.99 since none of the closes was equal to above the 10-cent reversal target of $30.10 but instead, a new Weis wave low was achieved ($29.99). As such the closes of $30.09, $30.01, $30.05 would all be attributed to the continued down-trending wave with a current low of $29.99, even though the closing price for the interim bars was above $30.00. Now that the Weis Wave low is now 429.99 then, in order to reverse this continued downtrend price will need to close at or above $30.09 on subsequent bar closes assuming now new low bar close is achieved. With large wave sizes, wave direction can be in limbo for many bars before a close either renews wave direction or reverses it and confirms wave direction as either a reversal or a continuation. On the zig-zag, a wave line and its volume will not be "printed" until a wave reversal is confirmed.
The wave attribution is similar when using other methods to define wave size. If ATR is used for wave size instead of a traditional wave constant size such as $0.10 or $2 or 2000 pips or ... then the wave size is calculated based on current ATR instead of the Weis wave constant (Traditional selected value).
I have the option to display pseudo-Ord volume. In truth, Ord used more traditional zig-zag pivots of bar highs and lows. Waves using closes as pivots can have some significant differences. This difference can be lessened by using smaller time frames and larger wave sizes.
There are other options such to display the delta price or pip size of a Weis Wave, the number of bars in a wave, and a few other options.
"the script" için komut dosyalarını ara

BE - Pr_DayLowHigh_BreakoutScreener AlgoHerewith presenting the Screener based indicator which supports Algo trade on the NSE stocks. The idea behind this indicator is when the Current day stock breaks out of Yesterday's high or Low with promising volumes (Using MA's and POC of Volume Profile) along with formation of candle Pattern. Initiates the Trade entries.
Note: Indicator is designed to take an entry even before the candle is closed as soon as the entry level is crossed and it shall exit the trade as soon as the SL is hit even before candle is close.
How to Work with this Indicator.
You can map up to 15 Scripts in this indicator. However you may decide if you wish to load all 15 are few of them. if you wish to load only 10, below settings should help you ignore the rest 10 symbols from screening it for setups
Updating Symbol Script.
This is an important part is used for Algo trades. Read the tooltip for better understanding of the format. Acceptable format is Broker Name followed with : and space with Symbol mapping Name followed with / and Instrument token provided by broker if no token alloted for the script then you may keep 0 against symbol name followed with / and Qty in terms of absolute value or in terms of percentage.
Trade and Scan Settings
Symbol List Mapping
For Improvements in Results - Use Events and keep a track of it / use Nudges etc.

Liquidation Levels - By LeviathanThis indicator generates liquidation levels of over-leveraged traders and utilizes a variety of different tools to analyze data such as Open Interest and Volume to provide an edge in your trading system and help you with valuable market insights.
The concept of this indicator is inspired by the platform Hyblock and their Liquidation Levels tool.
The script offers a lot of flexibility in settings, so please read these instructions and test out different parameters to see what works best for you. Here is a short overview of all inputs, one by one.
PRIMARY SOURCE OF DATA
This input allows you to choose the primary source of data that the script uses to calculate liquidation levels. I encourage you to test them all and see which works best for the assets and timeframes you trade. You can also regularly switch between to see confluences.
My personal favorite inputs (and also most accurate ones) are Open Interest, Open Interest + Volume (OI+VOL), and Open Interest + CVD (OI+CVD), as they utilize Open Interest in the calculations, which is the most important factor when it comes to analyzing position opening/closing and market activity in general. The other options that do not include Open Interest (Volume, CVD) were mainly added to provide the possibility to use the indicator on pairs where OI data is not available. Please note that this indicator is built on Tradingview and can only use data (e.g., Open Interest) provided by Tradingview, which is unfortunately quite limited. This is why I recommend using the script with OI-based data source inputs on Binance's perpetual futures pairs, as this is where OI data is available. The volume-based data source inputs can be used on spot pairs, forex, indices, and other markets, where Open Interest data is not provided.
To summarize the use of Primary Source of Data input:
1. Open Interest - use on Binance’s perpetual futures or anywhere else where OI data is available
2. OI + VOL - use on Binance’s perpetual futures or anywhere else where OI data is available
3. OI + CVD - use on Binance’s perpetual futures or anywhere else where OI data is available
4. CVD - use on any pair you wish
5. Volume - use on any pair you wish
DIRECTIONAL BIAS
If turned on, the Directional bias function uses volume and some other calculations to predict which side’s liquidation levels are more likely to be filled and only keep those levels on your chart.
- Directional Bias for Liquidation Levels
Turned ON: only one side’s liquidation levels are shown on the chart
Turned OFF: all liquidation levels are shown on the chart
- Directional Bias for Liquidation Level Bubbles
Turned ON: only one side’s liquidation level bubbles are shown on the chart
Turned OFF: all liquidation level bubbles are shown on the chart
I've separated directional bias options between Liquidation Levels and Liquidation Level Bubbles because sometimes it can be useful to have one of them ON and the other one OFF.
REDUCE SENSITIVITY
The Reduce Sensitivity option allows you to multiply the thresholds for "Smaller Size Liquidation," "Medium Size Liquidation," and "Large Size Liquidation" simultaneously. This is a useful feature as it enables you to easily filter larger positions and their liquidations without having to manually alter the standard deviation multipliers, which will be discussed in further detail later in the article.
The default value is 1, which means that it does nothing.
Increasing it above 1 will increase all thresholds and therefore generate fewer liquidation levels but with larger relative sizes.
Decreasing it below 1 will lower all thresholds and therefore generate more liquidation levels but with both smaller and larger relative sizes.
BASE
This input gives you the possibility to choose between four different bases, from which the liquidation levels will be generated.
CLOSE ⇒ Levels are plotted above and below the close of the candle
HALF ⇒ Levels are plotted above and below the middle of the candle ((high+low)/2)
VWAP ⇒ Levels are plotted above and below the volume-weighted average price
VWMA ⇒ Levels are plotted above and below the volume-weighted moving average
I suggest that you backtest them and see what works best for you.
LIQUIDATION LEVEL BUBBLES
If enabled, "Liquidation Level Bubbles" mark the beginning of a new liquidation level and indicate the relative size of liquidations that would occur if the price were to reach that level.
Liquidation Bubbles or Liquidation Levels in general appear when there is a large influx of new positions and logically, (significant) new positions lead to (significant) new liquidation levels. Liquidation Bubbles can be used to estimate the size and therefore significance of a given liquidation level. It could be argued that the price is more likely to be attracted to larger Liquidation Level Bubbles. While this is often true, it is not always the case as the strong momentum created by large positions can sustain for a prolonged period before reversing and filling the remaining levels Similarly to other features in this indicator, significant new positions are identified and filtered using standard deviation thresholds and their multipliers. New positions are considered significant when newly opened positions exceed the threshold for "Smaller Size Liquidation," leading to the creation of new liquidation levels and bubbles.
1. If new positions exceed the first standard deviation multiplier ("Smaller Size Liquidation Level"), but do not exceed “Medium Size Liquidation Level”, a smaller-sized bubble appears.
2. If new positions exceed the second standard deviation multiplier (”Medium Size Liquidation Level”), but do not exceed “Large Size Liquidation Level”, a medium-sized bubble appears.
3. If new positions surpass the third standard deviation multiplier (”Large Size Liquidation Level”), a large-sized bubble appears.
Significant opened positions are identified and filtered by size using three "thresholds" in the form of standard deviations, which can be modified in the indicator settings, in the section called "Standard Deviation Multipliers".
**Increasing** the standard deviation multipliers of Liquidation Level Bubbles effectively increases the threshold for a given bubble to occur, making the conditions for its appearance stricter.
⇒ Fewer Liquidation Levels - just larger positions are included
**Decreasing** the standard deviation multipliers of Liquidation Level Bubbles effectively decreases the threshold for a given bubble to occur, making the conditions for its appearance looser.
⇒ More Liquidation Levels - smaller positions are included
Keep in mind that this should always be the case:
*Smaller Size Liquidation Level < Medium Size Liquidation Level < Large Size Liquidation Level*
MARKET ORDER BUBBLES
"Market Order Bubbles" is my experimental concept used as a way to analyze large volumes and visualize the market activity at significant levels under certain conditions. It is based on my imitation of CVD which is also used in other parts of the script. The aim of this concept is to give you an idea about the real-time heavy market buying and selling, which could indicate eg. large liquidations, large entries/exits. in order to add confluence to your analysis. Please note that this concept is still in its early stages and may be confusing as it might have been poorly implemented. I recommend taking the time to thoroughly read through this section in order to fully understand it. On the other hand, early backtesting results appear very promising, as the win rate of countertrading buy and sell bubbles under certain conditions was fairly high (70%). I will continue working on this tool, so stay tuned for future updates.
**Market Buy Order Bubbles** appear above the price and possibly signal the following:
- Short positions being liquidated (exit short = buy order)
- New traders entering late longs based on FOMO (enter long = buy order)
- New short positions (sells) of “smarter” traders absorbing liquidated/closed shorts (buys)
⇒ Possible reversal to the downside - look for the liquidation levels of longs to get filled
**Market Sell Order Bubbles** appear below the price and possibly signal the following:
- Long positions being liquidated (exit long = sell order)
- New traders entering late shorts based on FOMO (enter short = sell order)
- New long positions (buys) of “smarter” traders absorbing liquidated/closed longs (sells)
⇒ Possible reversal to the upside - look for the liquidation levels of shorts to get filled
significant volumes are identified and filtered using three “thresholds” in the form of standard deviations, which can be modified in indicator settings.
1. If buy/sell volume surpasses the first standard deviation (”**Smaller Size Market Orders**”), then the **smaller-sized bubble** appears.
2. If buy/sell volume surpasses the second standard deviation (”**Medium Size Market Orders**”), then the **medium-sized bubble** appears.
3. If buy/sell volume surpasses the third standard deviation (”**Large Size Market Orders**”), then the **large-sized bubble** appears.
**Increasing** the standard deviation multipliers effectively increases the threshold for a given bubble to appear, making the conditions for its occurrence more strict.
**Decreasing** the standard deviation multipliers effectively decreases the threshold for a given bubble to appear, making the conditions for its occurrence more strict.
Keep in mind that this should always be the case:
*Smaller Size Market Orders < Medium Size Market Orders < Large Size Market Orders*
COLOR CANDLES
The Color Candles function is a useful and interesting feature that will enhance your analysis with additional context. If enabled, the indicator will color the chart's candles based on different data. Currently, there are three options to choose from, with more to be added in future updates.
Color Candles: OI DELTA
This option will color the candles to reflect Open Interest Delta. If there is a net increase in open positions (positive Open Interest Delta), the candle will be colored green. If there is a net decrease in open positions (negative Open Interest Delta), the candle will be colored red. It is important to note that this option only functions on pairs for which Tradingview provides OI data
Color Candles: VOLUME
This option utilizes volume data to help you identify the trend and momentum, coloring the candles accordingly - upward impulses are colored green and downward impulses are colored red. This makes it easier to recognize trend reversals and adjust your directional bias accordingly.
Color Candles: STOCH
This option uses the Stochastic Oscillator and SMA to color the candles, helping you identify momentum as upward green moves transition to downward red moves and vice versa.
LEVERAGE RATIO
Leverage ratio is another experimental concept I have added to this script. If turned on, it provides a broad insight into whether the market is relatively over-leveraged or if the leverage is relatively low. The aim is to use it as a confluence in anticipating incoming volatility and possibly use it to understand other aspects of market activity. It is still in its early stages of development and needless to say, it only works on pairs where Open Interest data is provided by Tradingview.
Crosses above price = Leverage is relatively high
Crosses below price = Leverage is relatively low
MARKET INFO SCREENER, LEVEL LEGEND, HIDE FILLED LINES
The last three inputs of Basic Settings section:
”The Market Info Screener” feature will display a small panel on the right side of your chart that provides useful data about the market, including Open Interest, Volume, the aggressive side of traders, and the Leverage Ratio. More data coming in future updates.
"Level Legend" option will display a small legend on the right side of the chart, helping you or others viewing the chart to understand what the objects on the chart mean.
"Hide Filled Lines" option will hide liquidation levels that have already been filled, only displaying the active ones in order to reduce clutter on your chart.
APPEARANCE
The “Appearance” settings offer a variety of modifications for colors, styles, and visibility.
The "Line Style" input allows you to choose the style and width of the liquidation level lines. You can also select which levels to display, as well as the color of the liquidation level lines and bubbles. The "Max Number of Lines" input allows you to specify the number of level lines you want on a chart. If you feel that there is too much clutter, you can decrease this number, and old lines will be removed. Please note that Tradingview has a built-in limit of 500 lines on a given chart, so this value cannot be set above 500. The "Market Buy/Sell Bubble Style" input can be used to modify the color and style of the market order bubbles. Enabling the "Show Settings Screener" option will display a screener with a list of all your settings on the right side of the chart, making it easier to share your preferred settings with others."
STANDARD DEVIATION MULTIPLIERS
This is where you can set the standard deviation thresholds for Liquidation Levels and Market Order Bubbles. These values can be customized to your preference, as the default values may not be suitable for your needs or you may want to experiment with different values to see more or fewer liquidation levels or market order bubbles on your chart. Personally, I sometimes use this feature to increase the Large Size Market Orders or Large Size Liquidation Levels multipliers so that large-sized bubbles are only assigned to extremely large positions or volumes.
If you want to only analyze larger positions or volumes, you can increase the "Smaller Size" multipliers, which act as a minimum threshold.
If you also want to include even smaller positions or volumes in your analysis, you can decrease the values of the "Smaller Size" multipliers, which act as a minimum threshold
Please note that the "Reduce Sensitivity" option in Basic Settings affects the standard deviation multipliers of the liquidation levels. Changing the "Reduce Sensitivity" value will equally multiply all of them (the ratio between Smaller, Medium, and Large multiplier values will remain the same)
STANDARD DEVIATION LENGTH
"Standard Deviation Length" defines the length (number of bars) used in all calculations that utilize the standard deviation function in this script. Decreasing it will generate Liquidation Levels and Liquidation Bubbles based more on recent data. Increasing it will generate Liquidation Levels and Liquidation Bubbles based on more long-term data.
CVD LENGTH
"CVD Length" refers to the length used in calculating cumulative volumes. Decreasing it will generate Liquidation Levels, Market Order Bubbles, and apply Directional bias based more on recent data. Increasing it will generate those based on more long-term data."
LEVEL CALCULATION MODES
“Level Calculation Modes” enable you to switch between three modes of calculating the distance between the base and actual liquidation levels.
COPYRIGHT
"Copyright" option will add your username to the copyright section at the bottom of the chart, giving you credit for your analysis if you post it somewhere.
Multi PivotsThis script is meant for day traders. It's based on the CPR concepts. The pivots plots based on the timeframe, means less that 15minuts it will plot daily pivots, less that daily tf, it plots weekly and then monthly. It also includes Camarillas, ADR levels, Fibonacci levels based on last 500 candles, Fib pivots, Pivot zones, developing pivot, Vwap, Dashboard shows RSI,ADX,Vwap,SuperTrend and day price difference. Options available to plot Day HighLow, Initial Balance levels as well. There is option to show running CPR which highlights virgin CPR. It can plot next day pivots as well
I dont own any of codes or ideas in the script. Codes are taken from different scripts and altered based on the requirements. Kudos to all the great pinecoders who provided their codes as public which helps everyone. Thanks

Short PositionThis is a “twin” indicator to the “Long Position” indicator. Both of these indicators share very similar scripting elements, purpose, and calculation logic. Mathematical principles are basically flipped 180° if you were to compare them, although things can be very complex in the coding world.
These indicators are intended to be used separately or in conjunction with each other. The reason they’re separated into two publications is mostly to avoid confusion when navigating through the settings. Settings are also “color-coated” with default colors and we do not think that too much green belongs in the “Short Position” indicator. Also, we believe that if someone wants to sell, they shouldn’t have to think about buying and vice versa.
“How to use” & script information
Upon execution of this script, you will be asked to click on the chart’s timeline. The position will then lock onto the candlesticks in that area and automatically (according to this script’s algorithm) calculate a “reasonable” leverage , as well as stop-loss, targets , and more.
These calculated levels are based on previous volatility for that specific chart and timeframe. Volatility is determined by different elements defined in this script (closed-source). In short, the script’s volatility-based algorithms looks at previous price action and then applies a very precise logic to it.
Now the user has a starting point and can determine if the indicator did a good job or if they want to input their own values. Below are some available functions that also can be enabled in the settings.
Focus-assist: Volatility and position-based signal during strong movements relative to previous volatility.
Dynamic-target: Volatility and position-based target that closes the position when strong movements are identified.
To keep this description short, we will stop here.
Summary
With this indicator, it’s possible to set up “fake” positions and practice or “play” with buying and selling with leverage. You can look at past performance and thereafter use it from day to day and see if you can make the right decisions in the right moments. You can also “invent” your own use cases or maybe you just want to visualize leverage.
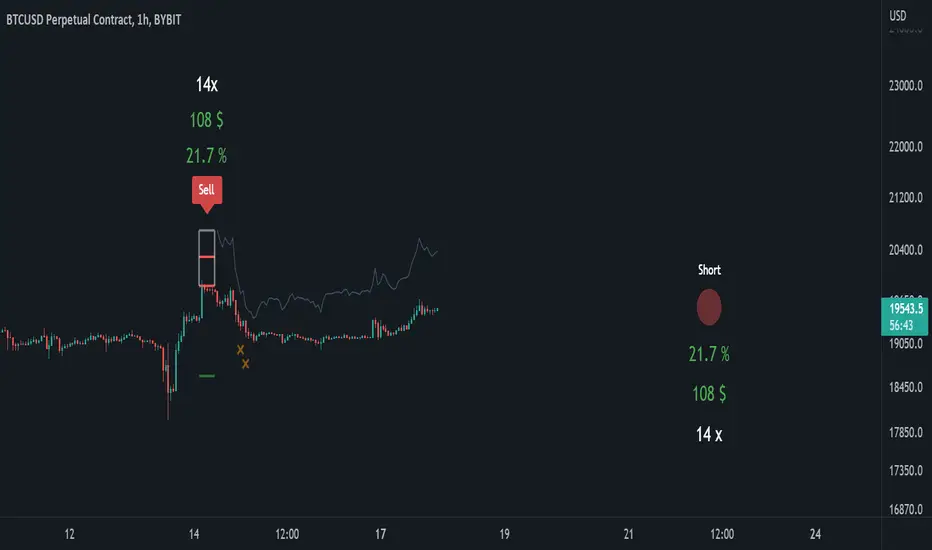
Long PositionThis is a “twin” indicator to the “Short Position” indicator. Both of these indicators share very similar scripting elements, purpose, and calculation logic. Mathematical principles are basically flipped 180° if you were to compare them, although things can be very complex in the coding world.
These indicators are intended to be used separately or in conjunction with each other. The reason they’re separated into two publications is mostly to avoid confusion when navigating through the settings. Settings are also “color-coated” with default colors and we do not think that too much red belongs in the “Long Position” indicator. Also, we believe that if someone wants to buy, they shouldn’t have to think about selling and vice versa.
“How to use” & script information
Upon execution of this script, you will be asked to click on the chart’s timeline. The position will then lock onto the candlesticks in that area and automatically (according to this script’s algorithm) calculate a “reasonable” leverage , as well as stop-loss, targets , and more.
These calculated levels are based on previous volatility for that specific chart and timeframe. Volatility is determined by different elements defined in this script (closed-source). In short, the script’s volatility-based algorithms looks at previous price action and then applies a very precise logic to it.
Now the user has a starting point and can determine if the indicator did a good job or if they want to input their own values. Below are some available functions that also can be enabled in the settings.
Focus-assist: Volatility and position-based signal during strong movements relative to previous volatility.
Dynamic-target: Volatility and position-based target that closes the position when strong movements are identified.
To keep this description short, we will stop here.
Summary
With this indicator, it’s possible to set up “fake” positions and practice or “play” with buying and selling with leverage. You can look at past performance and thereafter use it from day to day and see if you can make the right decisions in the right moments. You can also “invent” your own use cases or maybe you just want to visualize leverage.

DMI StrategyThis strategy is based on DMI indicator. It helps me to identify base or top of the script. I mostly use this script to trade in Nifty bank options, even when the signal comes in nifty . It can be used to trade in other scripts as well. Pivot points can also be used to take entry. Long entry is taken when DI+(11) goes below 10 and DI-(11) goes above 40 , whereas short entry is taken when DI-(11) goes below 10 and DI+(11) goes above 40.
For bank nifty , I take the trade in the strike price for which the current premium is nearby 300, with the SL of 20%. If premium goes below 10% I buy one more lot to average, but exit if the premium goes below 20% of the first entry. If the trade moves in the correct direction, we need to start trailing our stoploss or exit at the pre-defined target.
As this a strategy, there is one problem. While we are in the phase of "long", if again the "long" phase comes, it will not be shown on chart until a "short" phase has come, and vice versa. This has been resolved by creating an indicator instead of strategy with the name of "DMI Buy-sell on chart". Please go through that to get more entry points.
Please have a look at strategy tester to back test

3LS | 3 Line Strike Strategy [Kintsugi Trading]What is the 3LS | 3 Line Strike Strategy?
Incorporating the 3 Line Strike candlestick pattern into our strategy was inspired by Arty at The Moving Average and the amazing traders at TheTrdFloor .
The Three Line Strike is a trend continuation candlestick pattern consisting of four candles. Depending on their heights and collocation, a bullish or a bearish trend continuation can be predicted.
In a symphony of trend analysis, price action, and volume we can find and place high-probability trades with the 3LS Strategy.
How to use it!
----- First, start by choosing a Stop-Loss Strategy, Stop PIP Size, and Risk/Reward Ratio -----
- Stop-Loss Strategy
Fixed PIP Size – This uses the top/bottom of the indicator candle and places a TP based on the chosen Risk:Reward ratio.
ATR Trail (No set Target Profit, only uses ATR Stop)
ATR Trail-Stop (Has set Target Profit, however, stop is based on ATR inputs)
**If you choose an ATR Stop-Loss Strategy - input the desired ATR period and Multiple you would like the stop to be calculated at**
**ATR Stop-Loss Strategies have a unique alert setup for Auto-Trading. See Auto-Trading Section**
- Risk/Reward Ratio = If you have a .5 risk/reward, it means you are risking $100 to make $50.
- Additional Stop PIP Size = Number of PIPs over the default stop location of the top or bottom of the indicator candle.
----- Next, we set the Session Filter -----
Set the Timezone and Trade Session you desire. If no specific session is desired, simply set the Trade Session to 00:00 - 00:00.
----- Next, we set the Moving Average Cloud Fill -----
Enter the Fast and Slow Moving Average Length used to calculate trend direction:
MA Period Fast
MA Period Slow
These inputs will determine whether the strategy looks for Long or Short positions.
----- Next, we set the VSA – Volume Spread Analysis Settings -----
Check the box to show the indicator at the bottom of the chart if desired.
This is just a different visual output of the VSA | Volume Spread Analysis indicator available for free under the community indicators tab. You can add that indicator to your chart and see the same output in candle format.
In combination with the Moving Average Cloud, the Volume Spread Analysis will help us determine when to take a trade and in what direction.
The strategy is essentially looking for small reversals going against the overall trend and placing a trade once that reversal ends and the price moves back in the direction of the overall trend.
The 3LS Strategy utilizes confirmation between trend, volume, and price action to place high probability trades.
The VSA is completely customizable by:
Moving Average Length
MA-1 Multiplier
MA-2 Multiplier
MA-3 Multiplier
Check out the VSA | Volume Spread Analysis indicator in the community scripts section under the indicators tab to use this awesome resource on other strategies.
----- Next, we have the option to view the automated KT Bull/Bear Signals -----
Check the boxes to show the buy-sell signal on the chart if desired.
----- Next, we set the risk we want to use if Auto Trading the strategy -----
I always suggest using no more than 1-3% of your total account balance per trade. Remember, if you have multiple strategies triggering per day with each using 1%, the total percent at risk will be much larger.
For Example – if you have 10 strategies each risking 1% your total risk is 10% of your account, not 1%! Be mindful to only use 1-3% of your total account balance across all strategies, not just each individual one.
----- Finally, we backtest our ideas -----
After using the 'Strategy Tester' tab on TradingView to thoroughly backtest your predictions you are ready to take it to the next level - Automated Trading!
This was my whole reason for creating the script. If you work a full-time job, live in a time zone that is hard to trade, or just don't have the patience, this will be a game-changer for you as it was for me.
Auto-Trading
When it comes to auto-trading this strategy I have included two options in the script that utilize the alert messages generated by TradingView.
*Note: Please trade on a demo account until you feel comfortable enough to use real money, and then please stick to 1%-2% of your total account value in risk per trade.*
AutoView
PineConnector
**ATR Auto-Trading Alert Setup**
How to create alerts on 3 Line Strike Strategy
For Trailing Stops:
1) Adjust autoview/pineconnector settings
2) Click "add alert"
3) Select "Condition" = Strategy Name
4) Select "Order Fills Only" from the drop-down
3) Remove template message text from "message" box and place the exact text. '{{strategy.order.alert_message}}'
4) Click "create"
For Fixed Pip Stop:
1) Adjust autoview/pineconnector settings
2) Click "add alert"
3) Select "Condition" = Strategy Name
4) Select "alert() function calls only"
5) I like to title my Alert Name the same thing I named it as an Indicator Template to keep track
Good luck with your trading!

DMI StrategyThis strategy is based on DMI indicator. It helps me to identify base or top of the script. I mostly use this script to trade in Nifty bank options, even when the signal comes in nifty. It can be used to trade in other scripts as well. Pivot points can also be used to take entry. Long entry is taken when DI+(11) goes below 10 and DI-(11) goes above 40, whereas short entry is taken when DI-(11) goes below 10 and DI+(11) goes above 40.
For bank nifty, I take the trade in the strike price for which the current premium is nearby 300, with the SL of 20%. If premium goes below 10% I buy one more lot to average, but exit if the premium goes below 20% of the first entry. If the trade moves in the correct direction, we need to start trailing our stoploss or exit at the pre-defined target.
Please have a look at strategy tester to back test.

Buy/Sell on the levelsThis script is generally
My describe is:
There are a lot of levels we would like to buy some crypto.
When the price has crossed the level-line - we buy, but only if we have the permission in array(2)
When we have bought the crypto - we lose the permission for buy for now(till we will sell it on the next higher level)
When we sell some crypto(on the buying level + 1) we have the permission again.
There also are 2 protect indicators. We can buy if these indicators both green only(super trend and PIVOT )
Jun 12
Release Notes: Hello there,
Uncomment this section before use for real trade:
if array.get(price_to_sellBue, i) >= open and array.get(price_to_sellBue, i) <= close// and
//direction < 0 and permission_for_buy != 0
Here is my script.
In general - this is incredible simple script to use and understand.
First of all You can see this script working with only long orders, it means we going to get money if crypto grows only. Short orders we need to close the position on time.
In this script we buy crypto and sell with step 1% upper.
You can simply change the step by changing the price arrays.
Please note, if You want to see where the levels of this script is You Have to copy the next my indicator called LEVEL 1%
In general - if the price has across the price-level we buy some crypto and loose permission for buying for this level till we sell some crypto. There is ''count_of_orders" array field with value 2. When we bought some crypto the value turns to 0. 0 means not allowed to by on this level!!! The script buy if the bar is green only(last tick).
The script check every level(those we can see in "price_to_sellBue" array).
If the price across one of them - full script runs. After buying(if it possible) we check is there any crypto for sell on the level.
We check all levels below actual level( of actual level - ''i'' than we check all levels from 0 to i-1).
If there is any order that has value 0 in count of orders and index <= i-1 - we count it to var SELL amount and in the end of loop sell all of it.
Pay attention - it sells only if price across the level with red bar AND HAS ORDERS TO SELL WHICH WAS BOUGHT BELOW!!!
In Strategy tester it shows not-profitables orders sometimes, because if You have old Long position - it sells it first. First in - first out.
If the price goes down for a long time and You sell after 5 buys You sell the first of it with the highest value.
There is 2 protection from horrible buying in this strategy. The first one - Supertrend. If the supertrend is red - there is no permission for buy.
The second one - something between PIVOT and supertrend but with switcher.
If the price across last minimum - switcher is red - no permission for buy and the actual price becomes last minimum . The last maximum calculated for last 100 bars.
When the price across last maximum - switcher is green, we can buy. The last minimum calculation for last 100 bars, last maximum is actual price.
This two protections will save You from buying if price get crash down.
Enjoy my script.
Should You need the code or explanation, You have any ideas how to improve this crypt, contact me.
Vladyslav.
Jun 12
Release Notes: Here has been uncommented the protection for buy in case of price get down.
5 hours ago
Release Notes: Changed rages up to actual price to make it work

Trend Analysis Index [CC]The Trend Analysis Index was created by Adam White and not to be confused with the Trend Analysis Indicator that I also published. This indicator operates under the same idea but using a completely different calculation to achieve similar results. The idea behind this indicator is for a combination of volatility and trend confirmation. If the indicator is above it's signal line then the stock is very volatile and vice versa. If the stock is currently trending as in above a chosen moving average for example and the indicator falls below the signal line then there is a pretty good chance in a trend reversal. The recommended buy and sell system to use is to pair this indicator with a moving average crossover system which I have included in the script. Buy when the indicator is above it's signal and the shorter moving average crosses above the longer moving average. For selling you would do the same and sell when the indicator is above it's signal and the shorter moving average crosses below the longer moving average. I have included strong buy and sell signals in addition to the normal ones so stronger signals are darker in color and normal signals are lighter in color.
Let me know what other indicators or scripts you would like to see me publish!

Impact Zones - Skylyne InvestingWhat is the Impact Zone system:
The creation of Impact Zones started with our love for trading the Bond Market. Impact Zones were originally specifically tailored for the Bond market and now have been mastered to capture most of the Asset Classes out in the market today (Please look at Impact Zone Settings section for asset classes covered by this script). The Impact Zone system is a zone break (or market level break) following system with specific take profit points already established for you on the open of the market day (depending on your asset timing will vary).
*This script was designed for Intraday Trading, Long term or Swing Trading is not recommended with this system
The script will create buy and sell signals on the break of the Impact Zones when specific criteria is met along with the break of the zone. You do not have to use only our signals provided, you can also create your own trading rules based on our script.
Items to highlight:
Skylyne Upper Zone: Green Zone
Skylyne Middle: Yellow Line
Skylyne Lower Zone: Red Zone
Skylyne Take Profit Lines: Purple Lines
Skylyne Average: Orange Line (dynamic support/resistance)
Skylyne Overnight Session: Dark Blue (No Trade Zones)
Skylyne Signals: Buy / Sell
You can think of the Upper Zone as a bull zone and Lower zone as a bear zone, when price enters these zones we want to start watching price action to determine direction the market will take on the break or specified zone, whether it be a break and reversal or a break and run. This can be confirmed with either our signals (buy & sell) or the use of the dynamic support and resistance line (Skylyne Average).
Our script is written to capture market zones and place then on your screen with ease, we also have programmed in specific take profits and stop loss levels we have found the market respects on the intraday trading based on the Impact Zone captured.
The Impact Zones and Take Profit Levels change at Market open everyday. The levels provided will stay on your chart until the next Market open where the Impact Zones and Levels will change to accommodate that trading Day.
We recommend only using that trading days levels, however; using past levels can help trades depending on the case
The three Trades we want to highlight are:
1. Break of Impact Zones
a. This trade is taken when a break of the impact zone happens either in the positive or negative direction and traded to the next zone or take profit line (stop losses can be set with zones or the dynamic skylyne average crossovers)
2. Break of Skylyne Average
a. This trade is taken when price action confirms a bullish or bearish bias on the break of the average line (we would close this trade on the reverse break of the Skylyne Average using the zones as targets)
3. Break of the Skylyne Mid:
a. This trade is taken when a break of the Skylyne Mid level occurs and we use the upper and lower bounds of the Impact Zones as take profit and stop losses
Impact Zone Settings:
*Trading Category and Overnight Category must match the Asset Class being viewed on chart for accurate signals
1. Trading Category
a. Bonds
b. Corn/Wheat
c. Stocks
d. Index Futures
e. Euro/Dollar
f. Gold/Silver
2. Overnight Category
a. Bonds
b. Corn/Wheat
c. Stocks
d. Index Futures
e. Euro/Dollar
f. Gold/Silver
3. Chart Aggregation Limit (Default Value is 25 minutes)
Impact Zone Overnight Trading:
Impact Zone Overnight sessions are highlighted in a dark blue color and we use these highlighted time sessions as a NO TRADE session. Our system was built to be traded during normal market trading hours and overnight sessions tend to be less predictive in terms of direction and or zone reliance. If you choose to trade overnight sessions with Impact Zones, make sure you make a very in depth trading plan and stick to the rules set for yourself.
Impact Zone Signals:
1. Signals for buy or sell of the asset class happen on breaks of the Impact Zones, and when specific criteria are met that we determined necessary to evaluate the overall trend of the market
2. Not every break of the Impact Zones will trigger a signal
3. No signal will be generated during overnight sessions, we recommend studying overnight sessions before beginning to create your own overnight trading session plans based on Impact Zones
4. When a signal is generated you will use the next take profit line (purple line) in the direction of your trade you are in. Other trading signals were discussed above
5. If while you are in a trade and the skylyne average (orange line) is broke in the opposite direction of your trade you will take this as a dynamic stop, and in some cases a dynamic take profit
Impact Zone Charting Timeframes:
1. Recommendation of using the 1 minute chart aggregation bars to maximize profits and limit losses
2. The script has a default charting aggregation limit of 25 minutes, adjustments to the input (in the settings) to increase the aggregation limit need to be made in order to use higher than 25 minute timeframes
Charting Example:
First note is to notice how our publish example uses the 1-minute timeframe aggregation, this is because our script was written to maximize profit on the 1 minute time frame. The script can be used on any time frame, however; make sure that you increase the aggregation limit input when using timeframes above 25 minutes.
From the chart included in the script post, you can notice that buy and sell signals happen only when specified criteria is met, and not every time there is a crossover of the Impact Zones there is a signal. You do not only have to trade the buy and sell signals that our system provides, however; our team believes that these signals are one of the best ways to trade the Impact Zone script. If you deviate from only using signals provided and choose to use the Impact Zones differently, we recommend using the next level, or zone, in the direction of your trade as your take profit (As described in trade we want to highlight section)

MTF Oscillator Framework [PineCoders]This framework allows Pine coders to quickly build a complete multi-timeframe oscillator from any calculation producing values around a centerline, whether the values are bounded or not. Insert your calculation in the script and you have a ready-to-publish MTF Oscillator offering a plethora of presentation options and features.
█ HOW TO USE THE FRAMEWORK
1 — Insert your calculation in the `f_signal()` function at the top of the "Helper Functions" section of the script.
2 — Change the script's name in the `study()` declaration statement and the `alertcondition()` text in the last part of the "Plots" section.
3 — Adapt the default value used to initialize the CENTERLINE constant in the script's "Constants" section.
4 — If you want to publish the script, copy/paste the following description in your new publication's description and replace the "OVERVIEW" section with a description of your calculations.
5 — Voilà!
═════════════════════════════════════════════════════════════════════════
█ OVERVIEW
This oscillator calculates a directional value of True Range. When a bar is up, the positive value of True Range is used. A negative value is used when the bar is down. When there is no movement during the bar, a zero value is generated, even if True Range is different than zero. Because the unit of measure of True Range is price, the oscillator is unbounded (it does not have fixed upper/lower bounds).
True Range can be used as a metric for volatility, but by using a signed value, this oscillator will show the directional bias of progressively increasing/decreasing volatility, which can make it more useful than an always positive value of True Range.
The True Range calculation appeared for the first time in J. Welles Wilder's New Concepts in Technical Trading Systems book published in 1978. Wilder's objective was to provide a reliable measure of the effective movement—or range—between two bars, to measure volatility. True Range is also the building block used to calculate ATR (Average True Range), which calculates the average of True Range values over a given period using the `rma` averaging method—the same used in the calculation of another of Wilder's remarkable creations: RSI.
█ CONCEPTS
This oscillator's design stems from a few key concepts.
Relative Levels
Other than the centerline, relative rather than absolute levels are used to identify levels of interest. Accordingly, no fixed levels correspond to overbought/oversold conditions. Relative levels of interest are identified using:
• A Donchian channel (historical highs/lows).
• The oscillator's position relative to higher timeframe values.
• Oscillator levels following points in time where a divergence is identified.
Higher timeframes
Two progressively higher timeframes are used to calculate larger-context values for the oscillator. The rationale underlying the use of timeframes higher than the chart's is that, while they change less frequently than the values calculated at the chart's resolution, they are more meaningful because more work (trader activity) is required to calculate them. Combining the immediacy of values calculated at the chart's resolution to higher timeframe values achieves a compromise between responsiveness and reliability.
Divergences as points of interest rather than directional clues
A very simple interpretation of what constitutes a divergence is used. A divergence is defined as a discrepancy between any bar's direction and the direction of the signal line on that same bar. No attempt is made to attribute a directional bias to divergences when they occur. Instead, the oscillator's level is saved and subsequent movement of the oscillator relative to the saved level is what determines the bullish/bearish state of the oscillator.
Conservative coloring scheme
Several additive coloring conditions allow the bull/bear coloring of the oscillator's main line to be restricted to specific areas meeting all the selected conditions. The concept is built on the premise that most of the time, an oscillator's value should be viewed as mere noise, and that somewhat like price, it only occasionally conveys actionable information.
█ FEATURES
Plots
• Three lines can be plotted. They are named Main line , Line 2 and Line 3 . You decide which calculation to use for each line:
• The oscillator's value at the chart's resolution.
• The oscillator's value at a medium timeframe higher than the chart's resolution.
• The oscillator's value at the highest timeframe.
• An aggregate line calculated using a weighed average of the three previous lines (see the Aggregate Weights section of Inputs to configure the weights).
• The coloring conditions, divergence levels and the Hi/Lo channel always apply to the Main line, whichever calculation you decide to use for it.
• The color of lines 2 and 3 are fixed but can be set in the "Colors" section of Inputs.
• You can change the thickness of each line.
• When the aggregate line is displayed, higher timeframe values are only used in its calculation when they become available in the chart's history,
otherwise the aggregate line would appear much later on the chart. To indicate when each higher timeframe value becomes available,
a small label appears near the centerline.
• Divergences can be shown as small dots on the centerline.
• Divergence levels can be shown. The level and fill are determined by the oscillator's position relative to the last saved divergence level.
• Bull/bear markers can be displayed. They occur whenever a new bull/bear state is determined by the "Main Line Coloring Conditions".
• The Hi/Lo (Donchian) channel can be displayed, and its period defined.
• The background can display the state of any one of 11 different conditions.
• The resolutions used for the higher timeframes can be displayed to the right of the last bar's value.
• Four key values are always displayed in the Data Window (fourth icon down to the right of your chart):
oscillator values for the chart, medium and highest timeframes, and the oscillator's instant value before it is averaged.
Main Line Coloring Conditions
• Nine different conditions can be selected to determine the bull/bear coloring of the main line. All conditions set to "ON" must be met to determine the bull/bear state.
• A volatility state can also be used to filter the conditions.
• When the coloring conditions and the filter do not allow for a bull/bear state to be determined, the neutral color is used.
Signal
• Seven different averages can be used to calculate the average of the oscillator's value.
• The average's period can be set. A period of one will show the instant value of the oscillator,
provided you don't use linear regression or the Hull MA as they do not work with a period of one.
• An external signal can be used as the oscillator's instant value. If an already averaged external value is used, set the period to one in this indicator.
• For the cases where an external signal is used, a centerline value can be set.
Higher Timeframes
• The two higher timeframes are named Medium timeframe and Highest timeframe . They can be determined using one of three methods:
• Auto-steps: the higher timeframes are determined using the chart's resolution. If the chart uses a seconds resolution, for example,
the medium and highest resolutions will be 15 and 60 minutes.
• Multiples: the timeframes are calculated using a multiple of the chart's resolution, which you can set.
• Fixed: the set timeframes do not change with the chart's resolution.
Repainting
• Repainting can be controlled separately for the chart's value and the higher timeframe values.
• The default is a repainting chart value and non-repainting higher timeframe values. The Aggregate line will thus repaint by default,
as it uses the chart's value along with the higher timeframes values.
Aggregate Weights
• The weight of each component of the Aggregate line can be set.
• The default is equal weights for the three components, meaning that the chart's value accounts for one third of the weight in the Aggregate.
High Volatility
• This provides control over the volatility filter used in the Main line's coloring conditions and the background display.
• Volatility is determined to be high when the short-term ATR is greater than the long-term ATR.
Colors
• You can define your own colors for all of the oscillator's plots.
• The default colors will perform well on both white and black chart backgrounds.
Alerts
• An alert can be defined for the script. The alert will trigger whenever a bull/bear marker appears in the indicator's display.
The particular combination of coloring conditions and the display of bull/bear markers when you create the alert will thus determine when the alert triggers.
Once the alerts are created, subsequent changes to the conditions controlling the display of markers will not affect the existing alert(s).
• You can create multiple alerts from this script, each triggering on different conditions.
Backtesting & Trading Engine Signal Line
• An invisible plot named "BTE Signal" is provided. It can be used as an entry signal when connected to the PineCoders Backtesting & Trading Engine as an external input.
It will generate an entry whenever a marker is displayed.
Look first. Then leap.

Weis pip zigzag jayyWhat you see here is the Weis pip zigzag wave plotted directly on the price chart. This script is the companion to the Weis pip wave ( ) which is plotted in the lower panel of the displayed chart and can be used as an alternate way of plotting the same results. The Weis pip zigzag wave shows how far in terms of price a Weis wave has traveled through the duration of a Weis wave. The Weis pip zigzag wave is used in combination with the Weis cumulative volume wave. The two waves must be set to the same "wave size".
To use this script you must set the wave size. Using the traditional Weis method simply enter the desired wave size in the box "Select Weis Wave Size" In this example, it is set to 5. Each wave for each security and each timeframe requires its own wave size. Although not the traditional method a more automatic way to set wave size would be to use ATR. This is not the true Weis method but it does give you similar waves and, importantly, without the hassle described above. Once the Weis wave size is set then the pip wave will be shown.
I have put a pip zigzag of a 5 point Weis wave on the bar chart - that is a different script. I have added it to allow your eye to see what a Weis wave looks like. You will notice that the wave is not in straight lines connecting wave tops to bottoms this is a function of the limitations of Pinescript version 1. This script would need to be in version 4 to allow straight lines. There are too many calculations within this script to allow conversion to Pinescript version 4 or even Version 3. I am in the process of rewriting this script to reduce the number of calculations and streamline the algorithm.
The numbers plotted on the chart are calculated to be relative numbers. The script is limited to showing only three numbers vertically. Only the highest three values of a number are shown. For example, if the highest recent pip value is 12,345 only the first 3 numerals would be displayed ie 123. But suppose there is a recent value of 691. It would not be helpful to display 691 if the other wave size is shown as 123. To give the appropriate relative value the script will show a value of 7 instead of 691. This informs you of the relative magnitude of the values. This is done automatically within the script. There is likely no need to manually override the automatically calculated value. I will create a video that demonstrates the manual override method.
What is a Weis wave? David Weis has been recognized as a Wyckoff method analyst he has written two books one of which, Trades About to Happen, describes the evolution of the now popular Weis wave. The method employed by Weis is to identify waves of price action and to compare the strength of the waves on characteristics of wave strength. Chief among the characteristics of strength is the cumulative volume of the wave. There are other markers that Weis uses as well for example how the actual price difference between the start of the Weis wave from start to finish. Weis also uses time, particularly when using a Renko chart. Weis specifically uses candle or bar closes to define all wave action ie a line chart.
David Weis did a futures io video which is a popular source of information about his method.
This is the identical script with the identical settings but without the offending links. If you want to see the pip Weis method in practice then search Weis pip wave. If you want to see Weis chart in pdf then message me and I will give a link or the Weis pdf. Why would you want to see the Weis chart for May 27, 2020? Merely to confirm the veracity of my algorithm. You could compare my Weis chart here () from the same period to the David Weis chart from May 27. Both waves are for the ES!1 4 hour chart and both for a wave size of 5.
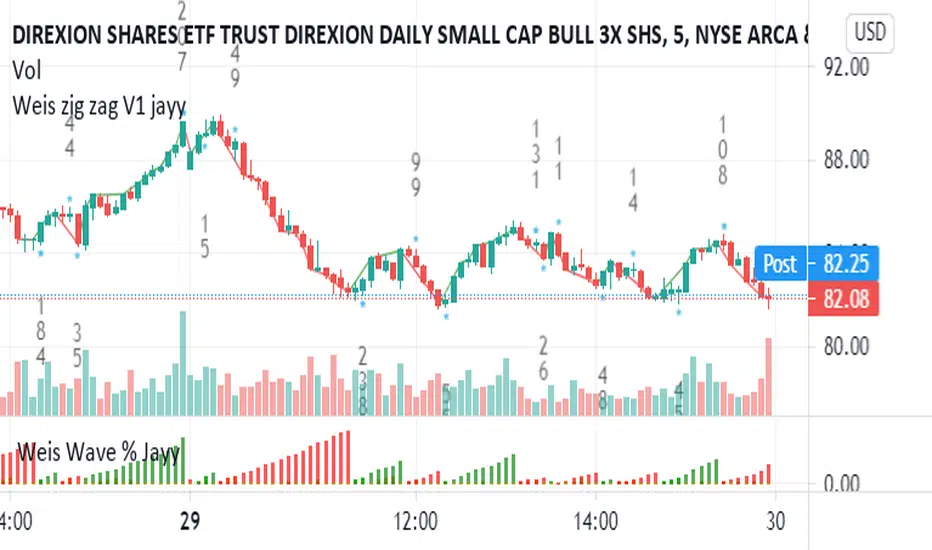
TA Basics: further "Steps" with our Moving AverageSo far in this series of posts, we have worked thru creating a basic zero-lag moving average, then moved forward all the way to coding a "Fibonacci" Weighted Moving Average.
in this post we take a look at a technique that can help traders minimize noise in the underlying data and get better insight on the changes that are happening in the data series represented by the moving average. we'll look at adding "stepping" to our Fibonacci Moving Average as an example. we introduce the Stepping Fibonacci Moving Average , or Step_FiMA
note that you can use the same technique with any plot you may have. feel free to copy or leverage the relevant parts of the script - the script is commented to make this easier.
How is this useful?
==================
with "stepping", you get your indicator to "round" the outcome into pre-specified bands or ranges. this works very similar to how, for example, range or Renko charts work. you can easily see the difference in the chart above once we look at a non-stepped and a stepping moving average of the same length side-by-side
the more granular your timeframe is, you will see the effect of the stepping clearer - here's how the same chart looks when we go into the 1-hr aggregation
Notes about this script
====================
there are couple of pieces i wanted to highlight in the script if you plan to use some of it :
1 - the step(x) function is meant to try to automatically pick the best "suitable" step size based on the range of the underlying series (for example, the closing price). these ranges i included here in the code are just my own "best choices" - you are totally welcome to adjust these ranges and the resulting step size to your own preference
2 - we applied the stepping as a user-choice. user can choose a manual entry, or "0" to get the code to automatically pick the step size, or enter -1 (or actually any value below zero) to cancel the stepping option altogether - this gives us some flexibility on how to use the stepping in an indicator
3 - very important (and somehow confusing): on the "rounding" approach:
the magic math formula that actually creates the stepping is this one
result = round(input / step) * step
now, this tells the script to "round" the result up or down (the basic rounding) -- so for example, a price of 17 with a step of 5 would be rounded (down) to 15, where as a price of 18 would be rounded "up" to 20 -- this is not the way some of us would expect or want, cause the price never reached 20 and they would want an 18 to still be rounded to 15 - and the stepping line not to show 20 *until* the price actually hits or exceeds 20 -- in that case, you would need to replace the function "round" with the function "floor" --
so the new formula becomes: floor(input / step) * step
-- in an ideal world, we can make this rounding choice a user-option in the settings -- maybe in an improved version
4 - we kept the smoothing option, and it takes place before the stepping is applied - we continue to use that smoothing to further minimize the level changes in the FiMA line.
I hope you find this script useful in your journey with technical analysis and DIY scripting, and good luck in your trading.

Support Resistance - DynamicThis is Dynamic Support / Resistance script.
How it Works?
It finds Pivot Points and creates channels for each Pivot Point. Channel size is calculated by (Highest - Lowest) * %Channel_size in Loopback Period. After creating channels it calculates that how many Pivot Points in the channels. more Pivot Points in channel means stronger Support/Resistance. in the option menu there is S/R Strength, this is the minimum number of Pivot Points that each channel must contain to be S/R. calculation starts from last pivot point and go back for "loopback period" which is 300 by default. so last Pivot Points have more priority. Finally after calculating Support/Resistance it draws lines.
Number of Support/Resistance line is Dynamic and up to 20 lines, that means number of lines changes dynamically. you can see how the script puts Suppport/Resistance lines dynamically by "Replay" button. (if I have time I will try to put a video)
Currently the scripts checks up to 40 pivot points in loopback period. it shows up to 20 S/Rs only for visible area in the chart.
There is option to Show S/R lines as Solid, Dotted or Dashed.
Enjoy!
