[blackcat] L1 Stock Volume AnalyzerLevel: 1
Background
The basic volume analysis is that buyers are in control when the price is increased. The purchase volume takes place at the offer price and represents the lowest advertised price at which sellers sell their shares. When someone buys shares at the current asking price, it shows that someone wants the shares and is included in the purchase volume metric.
Function
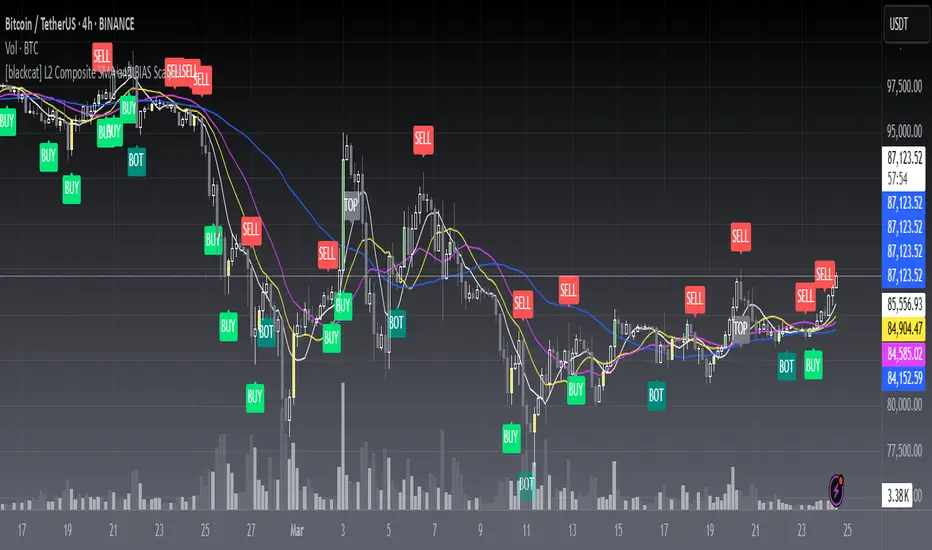
L1 Stock Volume Analyzer plot colorful volume candles with different meanings: red for red price bars, green for green price bars, yellow for active buying volume, fuchsia for active selling volume, navy for high active buying volume turn over rate, and white for high active selling volume turn over rate.
Key Signal
VOLUME SIGNAL:
activbuying ---> active buying volume
activselling ---> active selling volume
abtor ---> high active buying turn over rate
astor ---> high active selling turn over rate
PRICE SIGNAL:
cd ---> price covergence and divergence
positioning ---> price positioning
callthshots ---> call the shorts price signal
Pros and Cons
Pros:
1. extract volume detailed information to judge price trend together
2. price convergence and divergence help to identify long and short entry points
Cons:
1. price convergence and divergence visually works well only for <= 8H time frame
2. this indicator only works for stock trading pairs
Remarks
In order to put price and volume in a unified scale, this indicator is scaled. This scaling is not suitable for all markets. At present, it has only been optimized in the stock exchange market.
Readme
In real life, I am a prolific inventor. I have successfully applied for more than 60 international and regional patents in the past 12 years. But in the past two years or so, I have tried to transfer my creativity to the development of trading strategies. Tradingview is the ideal platform for me. I am selecting and contributing some of the hundreds of scripts to publish in Tradingview community. Welcome everyone to interact with me to discuss these interesting pine scripts.
The scripts posted are categorized into 5 levels according to my efforts or manhours put into these works.
Level 1 : interesting script snippets or distinctive improvement from classic indicators or strategy. Level 1 scripts can usually appear in more complex indicators as a function module or element.
Level 2 : composite indicator/strategy. By selecting or combining several independent or dependent functions or sub indicators in proper way, the composite script exhibits a resonance phenomenon which can filter out noise or fake trading signal to enhance trading confidence level.
Level 3 : comprehensive indicator/strategy. They are simple trading systems based on my strategies. They are commonly containing several or all of entry signal, close signal, stop loss, take profit, re-entry, risk management, and position sizing techniques. Even some interesting fundamental and mass psychological aspects are incorporated.
Level 4 : script snippets or functions that do not disclose source code. Interesting element that can reveal market laws and work as raw material for indicators and strategies. If you find Level 1~2 scripts are helpful, Level 4 is a private version that took me far more efforts to develop.
Level 5 : indicator/strategy that do not disclose source code. private version of Level 3 script with my accumulated script processing skills or a large number of custom functions. I had a private function library built in past two years. Level 5 scripts use many of them to achieve private trading strategy.
Pine Script® göstergesi