Double SupertrendThis strategy is based on a custom indicator that was created based on the Supertrend indicator. At its core, there are always 2 super trend indicators with different factors to reduce market noise (false signals).
The strategy/indicator has some parameters to improve the signals and filters.
TECHNICAL ANALYSIS
☑ Show Indicators
This option will enable/disable the Supertrend indicators on the chart.
☑ Length
The length will be used on the Supertrend Indicator to calculate its values.
☑ Dev Fast
The fast deviation or factor from one of the super trend indicators. This will be the leading indicator for entry signals, as well as for the exit signals.
☑ Dev Slow
The slow deviation or factor from one of the super trend indicators. This will be the confirmation indicator for entry and exit signals.
☑ Exit Type
It's possible to select from 4 options for the exit signals. Exit signals always take profit target.
☑ ⥹ Reversals
This option will make the strategy/indicator calculate the exit signals based on the difference between the given period's highest and lowest candle value (see Period on this list). It's displayed on the chart with the cross. As it's possible to verify in the image below, there are multiple exit spots for every entry.
☑ ⥹ ATR
Using ATR as a base indicator for exit signals will make the strategy/indicator place limit/stop orders. Candle High + ATR for longs, Candle Low - ATR for shorts. The strategy will show the ATR level for take profit and stick with it until the next signal. This way, the take profit value remains based on the candle of the entry signal.
☑ ⥹ Fast Supertrend
With this option selected, the exit signals will be based on the Fast Supertsignal value, mirrored to make a profit.
☑ ⥹ Slow Supertrend
With this option selected, the exit signals will be based on the Slow Supertsignal value, which is mirrored to take profit.
☑ Period
This will represent the number of candles used on the exit signals when Reversals is selected as Exit Type. It's also used to calculate the gradient used on the Fills and Supertrend signals.
☑ Multiplier
It's used on the take profit when the ATR option is selected on the Exit Type.
STRATEGY
☑ Use The Strategy
This will enable/disable the strategy to show the trades calculations.
☑ Show Use Long/Short Entries
Option to make the strategy show/use Long or Short signals. Available only if Use The Strategy is enabled
☑ Show Use Exit Long/Short
Option to make the strategy show/use Exit Long or Short signals (valid when Reversals option is selected on the Exit Type). Available only if Use The Strategy is enabled
☑ Show Use Add Long/Short
Option to make the strategy show/use Add Long or Short signals. With this option enabled, the strategy will place multiple trades in the same direction, almost the same concept as a pyramiding parameter. It's based on the Fast Supersignal when the candle fails to cross and reverses. Available only if Use The Strategy is enabled
☑ Trades Date Start/End
The date range that the strategy will check the market data and make the trades
HOW TO USE
It's very straightforward. A long signal will appear as a green arrow with a text Long below it. A short signal will appear as a red arrow with a text Short above it. It's ideal to wait for the candle to finish to validate the signal.
The exit signals are optional but give a good idea of the configuration used when backtesting. Each market and timeframe will have its own configuration for the best results. On average, sticking to ATR as an exit signal will have less risk than the other options.
☑ Entry Signals
Follow the arrows with Long/Short texts on them. Wait for the signal candle to close to validate the entry.
☑ Exit Signals
Use them to close your position or to trail stop your orders and maximize profits. Select the exit type suitable for each timeframe and market
☑ Add Entries
It's possible to increase the position following the add margin/contracts based on the Add signals. Not mandatory, but may work as reentries or late entries using the same signal.
☑ What about Stop Loss?
The stop-loss levels were not included as a separated signal because it's already in the chart. There are some possible ideas for the stop loss:
☑⥹ Candle High/Low (2nd recommend option)
When it's a Long signal from the entry signal candle, the stop loss can be the Low value of the same candle. Very tight stop loss in some cases, depending on the candle range
☑⥹ Local Top/Bottom
Selecting the local top/bottom as stop loss will give the strategy more room for false breakouts or reversals, keeping the trade open and minimizing noises. Increases the risk
☑⥹ Fast Supertrend (1st recommend option)
The fast supertrend can be used as stop-loss as well. making it a moving level and working close to trail stop management
☑⥹ Fixed Percentage
It's possible to use a fixed risk percentage for the trades, making the risk easier to control and project. Since the market volatility is not fixed, this may affect the accuracy of the trades
☑⥹ Based on the ATR (3rd recommend option)
When the exit type option ATR is selected, it will display the take profit level for that entry. Just mirror that value and put it as stop-loss, or multiply that amount by 1.5 to have more room for market noise.
EXAMPLE CONFIGURATIONS
Here are some configuration ideas for some markets (all of them are from crypto, especially futures markets)
BTCUSDT 15min - Default configuration
BTCUSDT 1h - Length 10 | Dev Fast 3 | Dev Slow 4 | Exit Type ATR | Period 50 | Multiplier 1
BTCUSDT 4h - Length 10 | Dev Fast 2 | Dev Slow 4 | Exit Type ATR | Period 50 | Multiplier 1
ETHUSDT 15min - Length 20 | Dev Fast 1 | Dev Slow 3 | Exit Type Fast Supertrend | Period 50 | Multiplier 1
IOTAUSDT 15min - Length 10 | Dev Fast 1 | Dev Slow 2 | Exit Type Slow Supertrend | Period 50 | Multiplier 1
OMGUSDT 15min - Length 10 | Dev Fast 1 | Dev Slow 4 | Exit Type Slow Supertrend | Period 50 | Multiplier 1
VETUSDT 15min - Length 10 | Dev Fast 3 | Dev Slow 4 | Exit Type Slow Supertrend | Period 50 | Multiplier 1
HOW TO FIND OTHER CONFIGURATIONS
Here are some steps to find suitable configurations
select a market and time frame
enable the Use This Strategy option on the strategy
open the strategy tester panel and select the performance summary
open the strategy configuration and go to properties
change the balance to the same price of the symbol (example: BTCUSDT 60.000, use 60.000 as balance)
go back to the inputs tab and keep changing the parameters until you see the net profit be positive and bigger than the absolute value of the drawdown
in case you can't find a suitable configuration, try other timeframes
Since the tester reflects what happened in the past candles, it's not guaranteed to give the same results. However, this indicator/Strategy can be used with other indicators as a leading signal or confirmation signal.
"text" için komut dosyalarını ara

benchLibrary "bench"
A simple banchmark library to analyse script performance and bottlenecks.
Very useful if you are developing an overly complex application in Pine Script, or trying to optimise a library / function / algorithm...
Supports artificial looping benchmarks (of fast functions)
Supports integrated linear benchmarks (of expensive scripts)
One important thing to note is that the Pine Script compiler will completely ignore any calculations that do not eventually produce chart output. Therefore, if you are performing an artificial benchmark you will need to use the bench.reference(value) function to ensure the calculations are executed.
Please check the examples towards the bottom of the script.
Quick Reference
(Be warned this uses non-standard space characters to get the line indentation to work in the description!)
```
// Looping benchmark style
benchmark = bench.new(samples = 500, loops = 5000)
data = array.new_int()
if bench.start(benchmark)
while bench.loop(benchmark)
array.unshift(data, timenow)
bench.mark(benchmark)
while bench.loop(benchmark)
array.unshift(data, timenow)
bench.mark(benchmark)
while bench.loop(benchmark)
array.unshift(data, timenow)
bench.stop(benchmark)
bench.reference(array.get(data, 0))
bench.report(benchmark, '1x array.unshift()')
// Linear benchmark style
benchmark = bench.new()
data = array.new_int()
bench.start(benchmark)
for i = 0 to 1000
array.unshift(data, timenow)
bench.mark(benchmark)
for i = 0 to 1000
array.unshift(data, timenow)
bench.stop(benchmark)
bench.reference(array.get(data, 0))
bench.report(benchmark,'1000x array.unshift()')
```
Detailed Interface
new(samples, loops) Initialises a new benchmark array
Parameters:
samples : int, the number of bars in which to collect samples
loops : int, the number of loops to execute within each sample
Returns: int , the benchmark array
active(benchmark) Determing if the benchmarks state is active
Parameters:
benchmark : int , the benchmark array
Returns: bool, true only if the state is active
start(benchmark) Start recording a benchmark from this point
Parameters:
benchmark : int , the benchmark array
Returns: bool, true only if the benchmark is unfinished
loop(benchmark) Returns true until call count exceeds bench.new(loop) variable
Parameters:
benchmark : int , the benchmark array
Returns: bool, true while looping
reference(number, string) Add a compiler reference to the chart so the calculations don't get optimised away
Parameters:
number : float, a numeric value to reference
string : string, a string value to reference
mark(benchmark, number, string) Marks the end of one recorded interval and the start of the next
Parameters:
benchmark : int , the benchmark array
number : float, a numeric value to reference
string : string, a string value to reference
stop(benchmark, number, string) Stop the benchmark, ending the final interval
Parameters:
benchmark : int , the benchmark array
number : float, a numeric value to reference
string : string, a string value to reference
report(Prints, benchmark, title, text_size, position)
Parameters:
Prints : the benchmarks results to the screen
benchmark : int , the benchmark array
title : string, add a custom title to the report
text_size : string, the text size of the log console (global size vars)
position : string, the position of the log console (global position vars)
unittest_bench(case) Cache module unit tests, for inclusion in parent script test suite. Usage: bench.unittest_bench(__ASSERTS)
Parameters:
case : string , the current test case and array of previous unit tests (__ASSERTS)
unittest(verbose) Run the bench module unit tests as a stand alone. Usage: bench.unittest()
Parameters:
verbose : bool, optionally disable the full report to only display failures

LabelHelperLibrary "LabelHelper"
Utility for managing active labels on the chart.
add(level, txt, labelColor, textColor) For displaying a lable at the last bar.
Parameters:
level : The value to display the label at.
txt : The text to show on the label.
labelColor : The color of the label.
textColor : The text color of the label.
Returns: The label being managed.

logLibrary "log"
Logging library for easily displaying debug, info, warn, error and critical messages.
No real need to explain why you might want to use this library! I'm sure you've all experienced the frustration of trying to understand the data state of your scripts... so, enjoy! More on it's way...
(Don't forget to check the helpers in the script and the useful tips below)
Some Useful Tips
By default the log console persists between bars (for history) and bars and ticks (for realtime).
Sometimes it is useful to clear the log after each candle or tick (assuming we are using the above helpers):
```
log_print(clear = true) // starts afresh on every bar and tick (excludes historical bars but good realtime tick analysis)
log_print(clear = barstate.isnew) // clears the log at the start of each bar (again, excludes historical but good realtime candle analysis)
```
It is also useful to be able to selectively understand the state of data at specific points or times within a script:
```
if log.once()
debug('useful variable', my_var) // this log only gets written once, upon first execution of this statement
if log.only(5)
debug3(a, b, c) // these variables are only logged the first five times this statement is executed
log_print(clear = false) // clear must be false and you should not write other logs on every bar, or the above will be lost
```
Final tip. If you want to view ONLY log entries of a particular level, then negate the constant:
```
log_print(level = -LOG_DEBUG)
```
Detailed Interface
once() Restrict execution to only happen once. Usage: if assert.once()\n happens_once()
Returns: bool, true on first execution within scope, false subsequently
only(repeat) Restrict execution to happen a set number of times. Usage: if assert.only(5)\n happens_five_times()
Parameters:
repeat : int, the number of times to return true
Returns: bool, true for the set number of times within scope, false subsequently
init() Initialises the log array
Returns: string , tuple based array to contain all pending log entries (__LOG)
clear(msgs) Clears the log array
Parameters:
msgs : string , the current collection of unfiltered and unprocessed logs (__LOG)
trace(msgs, msg) Writes a trace message to the log console
Parameters:
msgs : string , the current collection of unfiltered and unprocessed logs (__LOG)
msg : string, the trace message to write to the log
debug(msgs, msg) Writes a debug message to the log console
Parameters:
msgs : string , the current collection of unfiltered and unprocessed logs (__LOG)
msg : string, the debug message to write to the log
info(msgs, msg) Writes an info message to the log console
Parameters:
msgs : string , the current collection of unfiltered and unprocessed logs (__LOG)
msg : string, the info message to write to the log
warn(msgs, msg) Writes a warning message to the log console
Parameters:
msgs : string , the current collection of unfiltered and unprocessed logs (__LOG)
msg : string, the warn message to write to the log
error(msgs, msg) Writes an error message to the log console
Parameters:
msgs : string , the current collection of unfiltered and unprocessed logs (__LOG)
msg : string, the error message to write to the log
fatal(msgs, msg) Writes a critical message to the log console
Parameters:
msgs : string , the current collection of unfiltered and unprocessed logs (__LOG)
msg : string, the fatal message to write to the log
log(msgs, level, msg) Write a log message to the log console with a custom level
Parameters:
msgs : string , the current collection of unfiltered and unprocessed logs (__LOG)
level : ing, the logging level to assign to the message
msg : string, the log message to write to the log
severity(msgs) Checks the unprocessed log messages and returns the highest present level
Parameters:
msgs : string , the current collection of unfiltered and unprocessed logs (__LOG)
Returns: int, the highest level found within the unfiltered logs
print(msgs, level, clear, rows, text_size, position) Prints all log messages to the screen
Parameters:
msgs : string , the current collection of unfiltered and unprocessed logs (__LOG)
level : int, the minimum required log level of each message to be displayed
clear : bool, clear the printed log console after each render (useful with realtime when set to barstate.isconfirmed)
rows : int, the number of rows to display in the log console
text_size : string, the text size of the log console (global size vars)
position : string, the position of the log console (global position vars)
unittest_log(case) Log module unit tests, for inclusion in parent script test suite. Usage: log.unittest_log(__ASSERTS)
Parameters:
case : string , the current test case and array of previous unit tests (__ASSERTS)
unittest(verbose) Run the log module unit tests as a stand alone. Usage: log.unittest()
Parameters:
verbose : bool, optionally disable the full report to only display failures

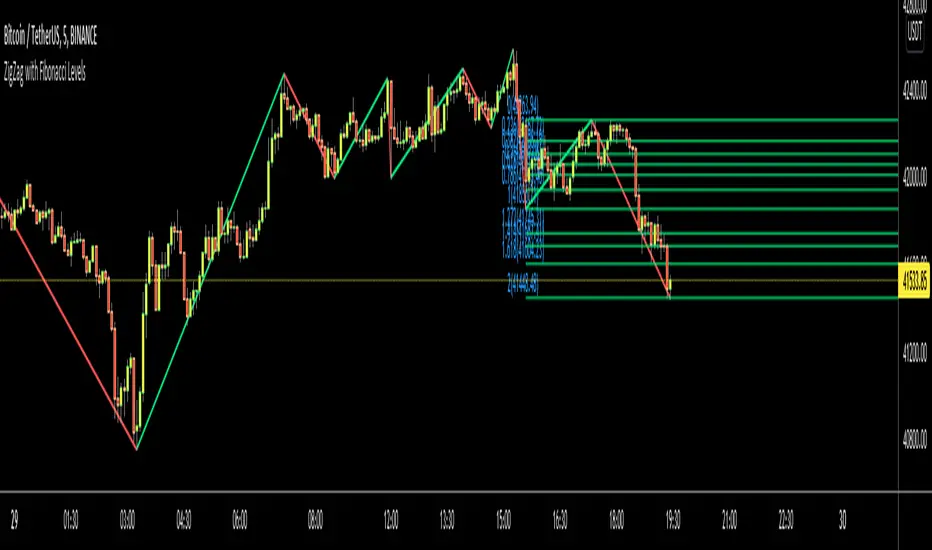
ZigZag with Fibonacci LevelsHello Traders,
This is " ZigZag with Fibonacci Levels " script. It finds the ZigZag, draw Fibonacci lines and put labels accordingly. I get many requests for this script, so here it is.
You can set ZigZag period as you wish. Bigger numbers (such 20, 30) may give better perspective and result.
It draws Fibonacci levels between 0%-100% and If the price goes higher/lower than 100% level than the script draws Fibonacci Levels accordingly. This means it draws Fibonacci levels until this levels get higher/lower than the price.
As an example:
if you don't want to see ZigZag Lines then you have option to disable it and see only Fibonacci levels:
You have coloring options for Zigzag, Fibonacci lines and texts:
Enjoy!
BTC Dashboard D / 4H / 1H (simple)//@version=5
indicator("BTC Dashboard D / 4H / 1H (simple)", overlay = true)
// ---------- Réglages ----------
rsiLen = 14
emaLen50 = 50
emaLen200 = 200
// Petite fonction pour formater les nombres
f_fmt(float v) =>
str.tostring(v, format.mintick)
// ---------- TIMEFRAMES ----------
tfD = "D"
tf4H = "240"
tf1H = "60"
// ---------- DAILY ----------
closeD = request.security(syminfo.tickerid, tfD, close)
ema50D = request.security(syminfo.tickerid, tfD, ta.ema(close, emaLen50))
ema200D = request.security(syminfo.tickerid, tfD, ta.ema(close, emaLen200))
rsiD = request.security(syminfo.tickerid, tfD, ta.rsi(close, rsiLen))
// ---------- 4H ----------
close4H = request.security(syminfo.tickerid, tf4H, close)
ema504H = request.security(syminfo.tickerid, tf4H, ta.ema(close, emaLen50))
ema2004H = request.security(syminfo.tickerid, tf4H, ta.ema(close, emaLen200))
rsi4H = request.security(syminfo.tickerid, tf4H, ta.rsi(close, rsiLen))
// ---------- 1H ----------
close1H = request.security(syminfo.tickerid, tf1H, close)
ema501H = request.security(syminfo.tickerid, tf1H, ta.ema(close, emaLen50))
ema2001H = request.security(syminfo.tickerid, tf1H, ta.ema(close, emaLen200))
rsi1H = request.security(syminfo.tickerid, tf1H, ta.rsi(close, rsiLen))
// ---------- TABLE ----------
var table t = table.new(position.top_right, 4, 4, border_width = 1)
if barstate.islast
// Ligne d’en-tête
table.cell(t, 0, 0, "TF", text_color = color.white, bgcolor = color.new(color.black, 0))
table.cell(t, 0, 1, "Close", text_color = color.white, bgcolor = color.new(color.black, 0))
table.cell(t, 0, 2, "EMA50 / EMA200", text_color = color.white, bgcolor = color.new(color.black, 0))
table.cell(t, 0, 3, "RSI", text_color = color.white, bgcolor = color.new(color.black, 0))
// ----- DAILY -----
rowD = 1
table.cell(t, rowD, 0, "D", text_color = color.yellow, bgcolor = color.new(color.blue, 70))
table.cell(t, rowD, 1, f_fmt(closeD))
table.cell(t, rowD, 2, "50: " + f_fmt(ema50D) + "\n200: " + f_fmt(ema200D))
table.cell(t, rowD, 3, f_fmt(rsiD))
// ----- 4H -----
row4 = 2
table.cell(t, row4, 0, "4H", text_color = color.white, bgcolor = color.new(color.teal, 70))
table.cell(t, row4, 1, f_fmt(close4H))
table.cell(t, row4, 2, "50: " + f_fmt(ema504H) + "\n200: " + f_fmt(ema2004H))
table.cell(t, row4, 3, f_fmt(rsi4H))
// ----- 1H -----
row1 = 3
table.cell(t, row1, 0, "1H", text_color = color.white, bgcolor = color.new(color.green, 70))
table.cell(t, row1, 1, f_fmt(close1H))
table.cell(t, row1, 2, "50: " + f_fmt(ema501H) + "\n200: " + f_fmt(ema2001H))
table.cell(t, row1, 3, f_fmt(rsi1H))

TrendDetectorLibLibrary "TrendDetector_Lib"
method formatTF(timeframe)
Namespace types: series string, simple string, input string, const string
Parameters:
timeframe (string) : (string) The timeframe to convert (e.g., "15", "60", "240").
Returns: (string) The formatted timeframe (e.g., "15M", "1H", "4H").
f_ma(type, src, len)
Computes a Moving Average value based on type and length.
Parameters:
type (simple string) : (string) One of: "SMA", "EMA", "RMA", "WMA", "VWMA".
src (float) : (series float) Source series for MA (e.g., close).
len (simple int) : (simple int) Length of the MA.
Returns: (float) The computed MA series.
render(tbl, trendDetectorSwitch, frameColor, frameWidth, borderColor, borderWidth, textColor, ma1ShowTrendData, ma1Timeframe, ma1Value, ma2ShowTrendData, ma2Timeframe, ma2Value, ma3ShowTrendData, ma3Timeframe, ma3Value)
Fills the provided table with Trend Detector contents.
@desc This renderer does NOT plot and does NOT create tables; call from indicator after your table exists.
Parameters:
tbl (table) : (table) Existing table to render into.
trendDetectorSwitch (bool) : (bool) Master toggle to draw the table content.
frameColor (color) : (color) Table frame color.
frameWidth (int) : (int) Table frame width (0–5).
borderColor (color) : (color) Table border color.
borderWidth (int) : (int) Table border width (0–5).
textColor (color) : (color) Table text color.
ma1ShowTrendData (bool) : (bool) Show MA #1 in table.
ma1Timeframe (simple string) : (string) MA #1 timeframe.
ma1Value (float)
ma2ShowTrendData (bool) : (bool) Show MA #2 in table.
ma2Timeframe (simple string) : (string) MA #2 timeframe.
ma2Value (float)
ma3ShowTrendData (bool) : (bool) Show MA #3 in table.
ma3Timeframe (simple string) : (string) MA #3 timeframe.
ma3Value (float)

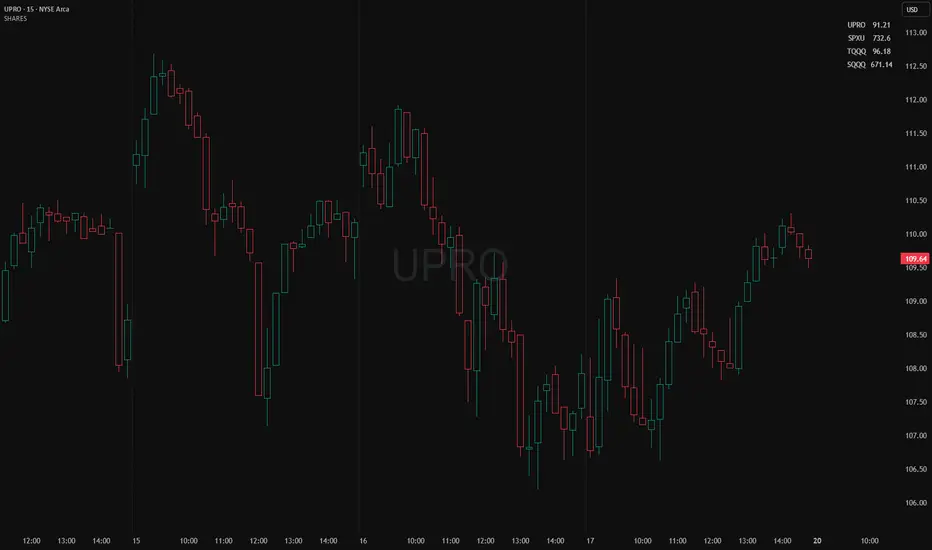
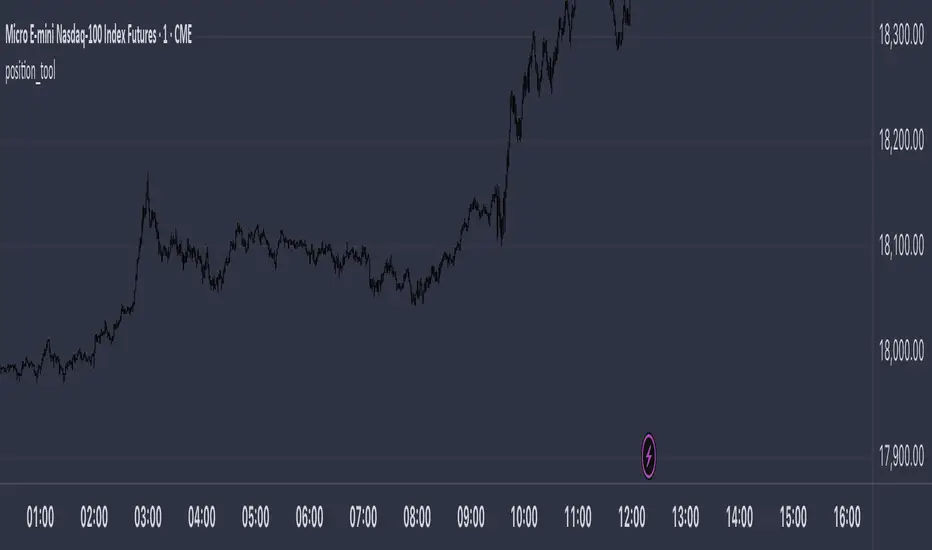
Position Size ToolPosition Size Tool
What it does:
Shows a small on-chart table that converts per-ticker dollar amounts into share counts (shares = amount ÷ current price) for up to 4 configurable tickers.
Inputs (indicator settings)
Ticker 1–4 — select the symbol (TradingView will show the exchange-qualified form like BATS:TQQQ in the settings).
Ticker N $ Amount — dollar amount to convert into shares for that ticker.
Show Ticker N — toggle each row on/off.
Table Text Color — color of the table text.
Table Position — screen location (Top/ Middle/ Bottom × Left/Center/Right).
Font Size — Small / Medium / Large.
Show Empty Top Row — optional spacer row.
What the table displays
Left column: the ticker symbol only (the script strips the exchange prefix for display, so BATS:TQQQ appears as TQQQ in the table).
Right column: the calculated share count, formatted to two decimal places (or "—" if price is not available or zero).
Table updates on the chart’s timeframe using live/last bar prices.
How to use
Add the indicator to a chart.
Open the indicator’s settings panel.
In Ticker 1–4, type/select the symbols you want (you may see the exchange prefix there; that’s TradingView’s UI).
Enter the dollar amounts for each ticker.
Use Show Ticker N to hide/show rows.
Adjust text color, font size, and table position as desired.
Notes
The settings field will always show the exchange-qualified symbol (TradingView behavior); the script strips the exchange only for the on-chart display.
If the selected symbol has no price data on the chart/timeframe, the table shows "—".
Shares are computed as amt ÷ current close from the requested symbol and timeframe.
Example of how to use this tool:
Monitor an index and execute trades on leveraged derivative products. This tool will determine the quantity of shares that can be purchased with a pre-determined dollar amount. Ex: Monitor SPX for entry/exit signals and execute trades on UPRO/SPXU/SPXL/SPXS.
Input a ticker and a dollar amount for position size, shares that can be purchased will be calculated based on the current asset price.
This tool can be helpful for those that use multiple platforms simultaneously to monitor and execute trades.
VWAP Multi-TimeframeThis is a multi-timeframe VWAP indicator that provides volume weighted average price calculations for the following time periods:
15min
30min
1H
2H
4H
6H
8H
12H
1D
1W
1M
3M
6M
1Y
You can use the lower timeframes for short term trend control areas and use the longer timeframes for long term trend control areas. Trade in the direction of the trend and watch for price reactions that you can trade when price gets close to or touches any of these levels.
This indicator will provide a data plot value of 1 for bullish when price is above all VWAPs that are turned on, -1 for bearish when price is below all VWAPs that are turned on and 0 for neutral when price is not above or below all VWAPs. Use this 1, -1, 0 value as a filter on your signal generating indicators so that you can prevent signals from coming in unless they are in the same direction as the VWAP trend.
Features
Trend direction value of 1, -1 or 0 to send to external indicators so you can filter your signal generating indicators using the VWAP trend.
Trend table that shows you whether price is above or below all of the major VWAPs. This includes the daily, weekly, monthly and yearly VWAPs.
Trend coloring between each VWAP and the close price of each candle so you can easily identify the trend direction.
Customization
Set the source value to use for all of the VWAP calculations. The default is HLC3.
Turn on or off each VWAP.
Change the color of each VWAP line.
Change the thickness of each VWAP line.
Turn on or off labels for each VWAP or turn all labels on or off at once.
Change the offset length from the current bar to the label text.
Change the label text color.
Turn on or off trend coloring for each VWAP.
Change the color for up trends and down trends.
Turn on or off the trend direction display table.
Change the location of the trend direction display table.
Adjust the background and text colors on the trend direction display table.
How To Use The Trend Direction Filtering Feature
The indicator will provide a data plot value of 1 for bullish when price is above all of the VWAPs that are turned on, a value of -1 for bearish when price is below all of the VWAPS that are turned on and a value of 0 for neutral when price is above and below some of the VWAPs that are turned on.
The name of the value to use with your external indicators will show up as: VWAP Multi-Timeframe: Trend Direction To Send To External Indicators
Make sure to use that as your source on your external indicators to get the correct values.
This 1, -1 or 0 value can then be used by another external indicator to tell the indicator what is allowed to do. For instance if you have another indicator that provides buy and sell signals, you can use this trend direction value to prevent your other indicator from giving a sell signal when the VWAP trend is bullish or prevent your other indicator from giving a buy signal when the VWAP trend is bearish.
You will need to program your other indicators to use this trend filtering feature, but this indicator is already set up with this filtering code so you can use it with any other indicator that you choose to filter(if you know how to customize pine script).
Markets You Can Use This Indicator On
This indicator uses volume and price to calculate values, so it will work on any chart that provides volume and price data.

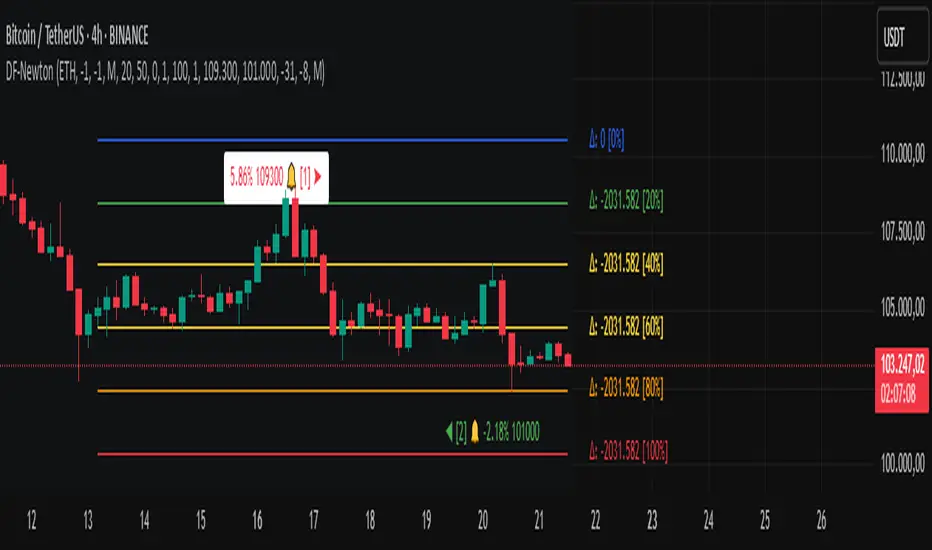
Differential-Isaac-Newton
Description of the Differential-Isaac-Newton Indicator (DF-Newton)
This indicator plots custom Fibonacci levels on the chart using configurable multiples and offers various display options to assist with technical analysis.
What does it do?
Calculates and plots Fibonacci levels based on user-defined multiples (default multiple is 20).
Allows switching between long mode (buy) and short mode (sell) to adjust the levels accordingly.
Displays horizontal lines at Fibonacci levels with customizable colors and styles.
Shows labels with different information such as level price, Fibonacci percentage, and difference between levels.
Includes controls to show/hide different elements and customize the appearance.
How to use it?
Main Settings
Multiple of 2 for Fibonacci: Defines the percentage interval used to calculate Fibonacci levels (e.g., 20 creates levels at 0%, 20%, 40%, etc.).
Line Horizontal Offset: Defines the horizontal distance (in bars) of the Fibonacci line to improve visibility.
Short Mode: Enable to calculate levels based on a downward movement (from low to high).
Classic Mode: Changes the line colors to a classic Fibonacci color scheme (blue, green, yellow, orange, red).
Toggle Solid Line: Switches between solid and dotted lines for Fibonacci levels.
Labels
Choose which information to display on the labels next to the lines:
Show Only Level Prices: Displays only the Fibonacci level price.
Show Only Level Percentages: Displays only the Fibonacci percentage level.
Show Difference Values (Δ): Shows the difference between the current and previous level, along with the percentage (which can be hidden).
Hide Percentage in Difference Mode: Hides the percentage when difference mode is enabled.
Hide All Labels: Hides all labels from the chart.
Visual Customization
Label Size: Size of the label text (XS, S, M, L).
Label Horizontal Offset: Horizontal distance of labels relative to the lines.
Background Offset: Adjusts background color offset for better visibility.
Fibonacci Line Color: Color of the Fibonacci lines (when classic mode is off).
Label Text Color: Color of the label text.
Level Interpretation
Fibonacci levels are calculated between the highest high and lowest low of the last 100 candles.
The indicator plots horizontal lines at Fibonacci levels according to the selected multiple.
Line colors help identify important levels (configurable in classic mode).
Labels show the exact level price and Fibonacci percentage, helping with entry, exit, support, and resistance decisions.
Recommendations
Use Short Mode to analyze Fibonacci levels for sell trades.
Use Classic Mode for a traditional color scheme and easier identification.
Adjust Line Horizontal Offset to avoid overlapping current candles.
Combine price and percentage display for easier analysis.
Explore Difference Mode (Δ) to understand gaps between consecutive Fibonacci levels.
Practical Example
If you set the multiple to 20, the indicator will show levels at 0%, 20%, 40%, 60%, 80%, and 100%. Each level will have a horizontal line and a label showing the corresponding price and percentage, or the difference from the previous level, depending on your settings.
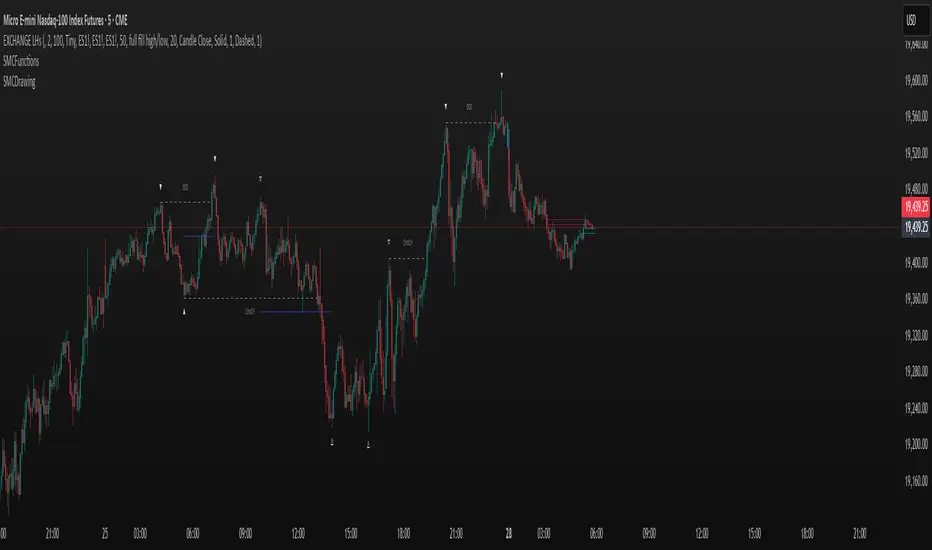
SMCDrawingLibrary "SMCDrawing"
drawSwingPointLabel(bar_index, price, swing_type, text_color, size)
Parameters:
bar_index (int)
price (float)
swing_type (string)
text_color (color)
size (string)
drawBOSLabel(start_bar, price, end_bar, bos_text, line_color, line_style, line_width, text_color, size)
Parameters:
start_bar (int)
price (float)
end_bar (int)
bos_text (string)
line_color (color)
line_style (string)
line_width (int)
text_color (color)
size (string)
drawRetracementLine(start_bar, price, end_bar, line_color, line_style, line_width)
Parameters:
start_bar (int)
price (float)
end_bar (int)
line_color (color)
line_style (string)
line_width (int)
drawFVG(high_time, low_time, high_price, low_price, is_bullish, line_color, line_width, bar_time)
Parameters:
high_time (int)
low_time (int)
high_price (float)
low_price (float)
is_bullish (bool)
line_color (color)
line_width (int)
bar_time (int)
drawBPRLabel(bar_time, price, is_bullish, text_color)
Parameters:
bar_time (int)
price (float)
is_bullish (bool)
text_color (color)
drawVolumeSpike(bar_time, price, percent_oi, normalized_volume, spike_color)
Parameters:
bar_time (int)
price (float)
percent_oi (float)
normalized_volume (float)
spike_color (color)
drawCandle(bar_index, open, high, low, close, up_color, down_color, wick_color, up_border_color, down_border_color)
Parameters:
bar_index (int)
open (float)
high (float)
low (float)
close (float)
up_color (color)
down_color (color)
wick_color (color)
up_border_color (color)
down_border_color (color)
position_toolLibrary "position_tool"
Trying to turn TradingView's position tool into a library from which you can draw position tools for your strategies on the chart. Not sure if this is going to work
calcBaseUnit()
Calculates the chart symbol's base unit of change in asset prices.
Returns: (float) A ticks or pips value of base units of change.
calcOrderPipsOrTicks(orderSize, unit)
Converts the `orderSize` to ticks.
Parameters:
orderSize (float) : (series float) The order size to convert to ticks.
unit (simple float) : (simple float) The basic units of change in asset prices.
Returns: (int) A tick value based on a given order size.
calcProfitLossSize(price, entryPrice, isLongPosition)
Calculates a difference between a `price` and the `entryPrice` in absolute terms.
Parameters:
price (float) : (series float) The price to calculate the difference from.
entryPrice (float) : (series float) The price of entry for the position.
isLongPosition (bool)
Returns: (float) The absolute price displacement of a price from an entry price.
calcRiskRewardRatio(profitSize, lossSize)
Calculates a risk to reward ratio given the size of profit and loss.
Parameters:
profitSize (float) : (series float) The size of the profit in absolute terms.
lossSize (float) : (series float) The size of the loss in absolute terms.
Returns: (float) The ratio between the `profitSize` to the `lossSize`
createPosition(entryPrice, entryTime, tpPrice, slPrice, entryColor, tpColor, slColor, textColor, showExtendRight)
Main function to create a position visualization with entry, TP, and SL
Parameters:
entryPrice (float) : (float) The entry price of the position
entryTime (int) : (int) The entry time of the position in bar_time format
tpPrice (float) : (float) The take profit price
slPrice (float) : (float) The stop loss price
entryColor (color) : (color) Color for entry line
tpColor (color) : (color) Color for take profit zone
slColor (color) : (color) Color for stop loss zone
textColor (color) : (color) Color for text labels
showExtendRight (bool) : (bool) Whether to extend lines to the right
Returns: (bool) Returns true when position is closed
PineConnectorLibrary "PineConnector"
This library is a comprehensive alert webhook text generator for PineConnector. It contains every possible alert syntax variation from the documentation, along with some debugging functions.
To use it, just import the library (eg. "import ZenAndTheArtOfTrading/PineConnector/1 as pc") and use pc.buy(licenseID) to send an alert off to PineConnector - assuming all your webhooks etc are set up correctly.
View the PineConnector documentation for more information on how to send the commands you're looking to send (all of this library's function names match the documentation).
all()
Usage: pc.buy(pc_id, freq=pc.all())
Returns: "all"
once_per_bar()
Usage: pc.buy(pc_id, freq=pc.once_per_bar())
Returns: "once_per_bar"
once_per_bar_close()
Usage: pc.buy(pc_id, freq=pc.once_per_bar_close())
Returns: "once_per_bar_close"
na0(value)
Checks if given value is either 'na' or 0. Useful for streamlining scripts with float user setting inputs which default values to 0 since na is unavailable as a user input default.
Parameters:
value (float) : The value to check
Returns: True if the given value is 0 or na
getDecimals()
Calculates how many decimals are on the quote price of the current market.
Returns: The current decimal places on the market quote price
truncate(number, decimals)
Truncates the given number. Required params: mumber.
Parameters:
number (float) : Number to truncate
decimals (int) : Decimal places to cut down to
Returns: The input number, but as a string truncated to X decimals
getPipSize(multiplier)
Calculates the pip size of the current market.
Parameters:
multiplier (int) : The mintick point multiplier (1 by default, 10 for FX/Crypto/CFD but can be used to override when certain markets require)
Returns: The pip size for the current market
toWhole(number)
Converts pips into whole numbers. Required params: number.
Parameters:
number (float) : The pip number to convert into a whole number
Returns: The converted number
toPips(number)
Converts whole numbers back into pips. Required params: number.
Parameters:
number (float) : The whole number to convert into pips
Returns: The converted number
debug(txt, tooltip, displayLabel)
Prints to console and generates a debug label with the given text. Required params: txt.
Parameters:
txt (string) : Text to display
tooltip (string) : Tooltip to display (optional)
displayLabel (bool) : Turns on/off chart label (default: off)
Returns: Nothing
order(licenseID, command, symbol, parameters, accfilter, comment, secret, freq, debug)
Generates an alert string. Required params: licenseID, command.
Parameters:
licenseID (string) : Your PC license ID
command (string) : Command to send
symbol (string) : The symbol to trigger this order on
parameters (string) : Other optional parameters to include
accfilter (float) : Optional minimum account balance filter
comment (string) : Optional comment (maximum 20 characters)
secret (string) : Optional secret key (must be enabled in dashboard)
freq (string) : Alert frequency. Default = "all", options = "once_per_bar", "once_per_bar_close" and "none"
debug (bool) : Turns on/off debug label
Returns: An alert string with valid PC syntax based on supplied parameters
market_order(licenseID, buy, risk, sl, tp, betrigger, beoffset, spread, trailtrig, traildist, trailstep, atrtimeframe, atrperiod, atrmultiplier, atrshift, atrtrigger, symbol, accfilter, comment, secret, freq, debug)
Generates a market entry alert with relevant syntax commands. Required params: licenseID, buy, risk.
Parameters:
licenseID (string) : Your PC license ID
buy (bool) : true=buy/long, false=sell/short
risk (float) : Risk quantity (according to EA settings)
sl (float) : Stop loss distance in pips or price
tp (float) : Take profit distance in pips or price
betrigger (float) : Breakeven will be activated after the position gains this number of pips
beoffset (float) : Offset from entry price. This is the amount of pips you'd like to protect
spread (float) : Enter the position only if the spread is equal or less than the specified value in pips
trailtrig (float) : Trailing stop-loss will be activated after a trade gains this number of pips
traildist (float) : Distance of the trailing stop-loss from current price
trailstep (float) : Moves trailing stop-loss once price moves to favourable by a specified number of pips
atrtimeframe (int) : ATR Trailing Stop timeframe, only updates once per bar close. Options: 1, 5, 15, 30, 60, 240, 1440
atrperiod (int) : ATR averaging period
atrmultiplier (float) : Multiple of ATR to utilise in the new SL computation, default = 1
atrshift (int) : Relative shift of price information, 0 uses latest candle, 1 uses second last, etc. Default = 0
atrtrigger (int) : Activate the trigger of ATR Trailing after market moves favourably by a number of pips. Default = 0 (instant)
symbol (string) : The symbol to trigger this order on (defaults to current symbol)
accfilter (float) : Optional minimum account balance filter
comment (string) : Optional comment (maximum 20 characters)
secret (string) : Optional secret key (must be enabled in dashboard)
freq (string) : Alert frequency. Default = "all", options = "once_per_bar", "once_per_bar_close" and "none"
debug (bool) : Turns on/off debug label
Returns: A market order alert string with valid PC syntax based on supplied parameters
buy(licenseID, risk, sl, tp, betrigger, beoffset, spread, trailtrig, traildist, trailstep, atrtimeframe, atrperiod, atrmultiplier, atrshift, atrtrigger, symbol, accfilter, comment, secret, freq, debug)
Generates a market buy alert with relevant syntax commands. Required params: licenseID, risk.
Parameters:
licenseID (string) : Your PC license ID
risk (float) : Risk quantity (according to EA settings)
sl (float) : Stop loss distance in pips or price
tp (float) : Take profit distance in pips or price
betrigger (float) : Breakeven will be activated after the position gains this number of pips
beoffset (float) : Offset from entry price. This is the amount of pips you'd like to protect
spread (float) : Enter the position only if the spread is equal or less than the specified value in pips
trailtrig (float) : Trailing stop-loss will be activated after a trade gains this number of pips
traildist (float) : Distance of the trailing stop-loss from current price
trailstep (float) : Moves trailing stop-loss once price moves to favourable by a specified number of pips
atrtimeframe (int) : ATR Trailing Stop timeframe, only updates once per bar close. Options: 1, 5, 15, 30, 60, 240, 1440
atrperiod (int) : ATR averaging period
atrmultiplier (float) : Multiple of ATR to utilise in the new SL computation, default = 1
atrshift (int) : Relative shift of price information, 0 uses latest candle, 1 uses second last, etc. Default = 0
atrtrigger (int) : Activate the trigger of ATR Trailing after market moves favourably by a number of pips. Default = 0 (instant)
symbol (string) : The symbol to trigger this order on (defaults to current symbol)
accfilter (float) : Optional minimum account balance filter
comment (string) : Optional comment (maximum 20 characters)
secret (string) : Optional secret key (must be enabled in dashboard)
freq (string) : Alert frequency. Default = "all", options = "once_per_bar", "once_per_bar_close" and "none"
debug (bool) : Turns on/off debug label
Returns: A market order alert string with valid PC syntax based on supplied parameters
sell(licenseID, risk, sl, tp, betrigger, beoffset, spread, trailtrig, traildist, trailstep, atrtimeframe, atrperiod, atrmultiplier, atrshift, atrtrigger, symbol, accfilter, comment, secret, freq, debug)
Generates a market sell alert with relevant syntax commands. Required params: licenseID, risk.
Parameters:
licenseID (string) : Your PC license ID
risk (float) : Risk quantity (according to EA settings)
sl (float) : Stop loss distance in pips or price
tp (float) : Take profit distance in pips or price
betrigger (float) : Breakeven will be activated after the position gains this number of pips
beoffset (float) : Offset from entry price. This is the amount of pips you'd like to protect
spread (float) : Enter the position only if the spread is equal or less than the specified value in pips
trailtrig (float) : Trailing stop-loss will be activated after a trade gains this number of pips
traildist (float) : Distance of the trailing stop-loss from current price
trailstep (float) : Moves trailing stop-loss once price moves to favourable by a specified number of pips
atrtimeframe (int) : ATR Trailing Stop timeframe, only updates once per bar close. Options: 1, 5, 15, 30, 60, 240, 1440
atrperiod (int) : ATR averaging period
atrmultiplier (float) : Multiple of ATR to utilise in the new SL computation, default = 1
atrshift (int) : Relative shift of price information, 0 uses latest candle, 1 uses second last, etc. Default = 0
atrtrigger (int) : Activate the trigger of ATR Trailing after market moves favourably by a number of pips. Default = 0 (instant)
symbol (string) : The symbol to trigger this order on (defaults to current symbol)
accfilter (float) : Optional minimum account balance filter
comment (string) : Optional comment (maximum 20 characters)
secret (string) : Optional secret key (must be enabled in dashboard)
freq (string) : Alert frequency. Default = "all", options = "once_per_bar", "once_per_bar_close" and "none"
debug (bool) : Turns on/off debug label
Returns: A market order alert string with valid PC syntax based on supplied parameters
closeall(licenseID, comment, secret, freq, debug)
Closes all open trades at market regardless of symbol. Required params: licenseID.
Parameters:
licenseID (string) : Your PC license ID
comment (string) : Optional comment to include (max 20 characters)
secret (string) : Optional secret key (must be enabled in dashboard)
freq (string) : Alert frequency. Default = "all", options = "once_per_bar", "once_per_bar_close" and "none"
debug (bool) : Turns on/off debug label
Returns: The required alert syntax as a string
closealleaoff(licenseID, comment, secret, freq, debug)
Closes all open trades at market regardless of symbol, and turns the EA off. Required params: licenseID.
Parameters:
licenseID (string) : Your PC license ID
comment (string) : Optional comment to include (max 20 characters)
secret (string) : Optional secret key (must be enabled in dashboard)
freq (string) : Alert frequency. Default = "all", options = "once_per_bar", "once_per_bar_close" and "none"
debug (bool) : Turns on/off debug label
Returns: The required alert syntax as a string
closelong(licenseID, symbol, comment, secret, freq, debug)
Closes all long trades at market for the given symbol. Required params: licenseID.
Parameters:
licenseID (string) : Your PC license ID
symbol (string) : Symbol to act on (defaults to current symbol)
comment (string) : Optional comment to include (max 20 characters)
secret (string) : Optional secret key (must be enabled in dashboard)
freq (string) : Alert frequency. Default = "all", options = "once_per_bar", "once_per_bar_close" and "none"
debug (bool) : Turns on/off debug label
Returns: The required alert syntax as a string
closeshort(licenseID, symbol, comment, secret, freq, debug)
Closes all open short trades at market for the given symbol. Required params: licenseID.
Parameters:
licenseID (string) : Your PC license ID
symbol (string) : Symbol to act on (defaults to current symbol)
comment (string) : Optional comment to include (max 20 characters)
secret (string) : Optional secret key (must be enabled in dashboard)
freq (string) : Alert frequency. Default = "all", options = "once_per_bar", "once_per_bar_close" and "none"
debug (bool) : Turns on/off debug label
Returns: The required alert syntax as a string
closelongshort(licenseID, symbol, comment, secret, freq, debug)
Closes all open trades at market for the given symbol. Required params: licenseID.
Parameters:
licenseID (string) : Your PC license ID
symbol (string) : Symbol to act on (defaults to current symbol)
comment (string) : Optional comment to include (max 20 characters)
secret (string) : Optional secret key (must be enabled in dashboard)
freq (string) : Alert frequency. Default = "all", options = "once_per_bar", "once_per_bar_close" and "none"
debug (bool) : Turns on/off debug label
Returns: The required alert syntax as a string
closelongbuy(licenseID, risk, symbol, comment, secret, freq, debug)
Close all long positions and open a new long at market for the given symbol with given risk/contracts. Required params: licenseID.
Parameters:
licenseID (string) : Your PC license ID
risk (float) : Risk or contracts (according to EA settings)
symbol (string) : Symbol to act on (defaults to current symbol)
comment (string) : Optional comment to include (max 20 characters)
secret (string) : Optional secret key (must be enabled in dashboard)
freq (string) : Alert frequency. Default = "all", options = "once_per_bar", "once_per_bar_close" and "none"
debug (bool) : Turns on/off debug label
Returns: The required alert syntax as a string
closeshortsell(licenseID, risk, symbol, comment, secret, freq, debug)
Close all short positions and open a new short at market for the given symbol with given risk/contracts. Required params: licenseID, risk.
Parameters:
licenseID (string) : Your PC license ID
risk (float) : Risk or contracts (according to EA settings)
symbol (string) : Symbol to act on (defaults to current symbol)
comment (string) : Optional comment to include (max 20 characters)
secret (string) : Optional secret key (must be enabled in dashboard)
freq (string) : Alert frequency. Default = "all", options = "once_per_bar", "once_per_bar_close" and "none"
debug (bool) : Turns on/off debug label
Returns: The required alert syntax as a string
newsltplong(licenseID, sl, tp, symbol, accfilter, comment, secret, freq, debug)
Updates the stop loss and/or take profit of any open long trades on the given symbol with the given values. Required params: licenseID, sl and/or tp.
Parameters:
licenseID (string) : Your PC license ID
sl (float) : Stop loss pips or price (according to EA settings)
tp (float) : Take profit pips or price (according to EA settings)
symbol (string) : Symbol to act on (defaults to current symbol)
accfilter (float) : Optional minimum account balance filter
comment (string) : Optional comment to include (max 20 characters)
secret (string) : Optional secret key (must be enabled in dashboard)
freq (string) : Alert frequency. Default = "all", options = "once_per_bar", "once_per_bar_close" and "none"
debug (bool) : Turns on/off debug label
Returns: The required alert syntax as a string
newsltpshort(licenseID, sl, tp, symbol, accfilter, comment, secret, freq, debug)
Updates the stop loss and/or take profit of any open short trades on the given symbol with the given values. Required params: licenseID, sl and/or tp.
Parameters:
licenseID (string) : Your PC license ID
sl (float) : Stop loss pips or price (according to EA settings)
tp (float) : Take profit pips or price (according to EA settings)
symbol (string) : Symbol to act on (defaults to current symbol)
accfilter (float) : Optional minimum account balance filter
comment (string) : Optional comment to include (max 20 characters)
secret (string) : Optional secret key (must be enabled in dashboard)
freq (string) : Alert frequency. Default = "all", options = "once_per_bar", "once_per_bar_close" and "none"
debug (bool) : Turns on/off debug label
Returns: The required alert syntax as a string
closelongpct(licenseID, symbol, comment, secret, freq, debug)
Close a percentage of open long positions (according to EA settings). Required params: licenseID.
Parameters:
licenseID (string) : Your PC license ID
symbol (string) : Symbol to act on (defaults to current symbol)
comment (string) : Optional comment to include (max 20 characters)
secret (string) : Optional secret key (must be enabled in dashboard)
freq (string) : Alert frequency. Default = "all", options = "once_per_bar", "once_per_bar_close" and "none"
debug (bool) : Turns on/off debug label
Returns: The required alert syntax as a string
closeshortpct(licenseID, symbol, comment, secret, freq, debug)
Close a percentage of open short positions (according to EA settings). Required params: licenseID.
Parameters:
licenseID (string) : Your PC license ID
symbol (string) : Symbol to act on (defaults to current symbol)
comment (string) : Optional comment to include (max 20 characters)
secret (string) : Optional secret key (must be enabled in dashboard)
freq (string) : Alert frequency. Default = "all", options = "once_per_bar", "once_per_bar_close" and "none"
debug (bool) : Turns on/off debug label
Returns: The required alert syntax as a string
closelongvol(licenseID, risk, symbol, comment, secret, freq, debug)
Close all open long contracts on the current symbol until the given risk value is remaining. Required params: licenseID, risk.
Parameters:
licenseID (string) : Your PC license ID
risk (float) : The quantity to leave remaining
symbol (string) : Symbol to act on (defaults to current symbol)
comment (string) : Optional comment to include (max 20 characters)
secret (string) : Optional secret key (must be enabled in dashboard)
freq (string) : Alert frequency. Default = "all", options = "once_per_bar", "once_per_bar_close" and "none"
debug (bool) : Turns on/off debug label
Returns: The required alert syntax as a string
closeshortvol(licenseID, risk, symbol, comment, secret, freq, debug)
Close all open short contracts on the current symbol until the given risk value is remaining. Required params: licenseID, risk.
Parameters:
licenseID (string) : Your PC license ID
risk (float) : The quantity to leave remaining
symbol (string) : Symbol to act on (defaults to current symbol)
comment (string) : Optional comment to include (max 20 characters)
secret (string) : Optional secret key (must be enabled in dashboard)
freq (string) : Alert frequency. Default = "all", options = "once_per_bar", "once_per_bar_close" and "none"
debug (bool) : Turns on/off debug label
Returns: The required alert syntax as a string
limit_order(licenseID, buy, price, risk, sl, tp, betrigger, beoffset, spread, trailtrig, traildist, trailstep, atrtimeframe, atrperiod, atrmultiplier, atrshift, atrtrigger, symbol, accfilter, comment, secret, freq, debug)
Generates a limit order alert with relevant syntax commands. Required params: licenseID, buy, price, risk.
Parameters:
licenseID (string) : Your PC license ID
buy (bool) : true=buy/long, false=sell/short
price (float) : Price or pips to set limit order (according to EA settings)
risk (float) : Risk quantity (according to EA settings)
sl (float) : Stop loss distance in pips or price
tp (float) : Take profit distance in pips or price
betrigger (float) : Breakeven will be activated after the position gains this number of pips
beoffset (float) : Offset from entry price. This is the amount of pips you'd like to protect
spread (float) : Enter the position only if the spread is equal or less than the specified value in pips
trailtrig (float) : Trailing stop-loss will be activated after a trade gains this number of pips
traildist (float) : Distance of the trailing stop-loss from current price
trailstep (float) : Moves trailing stop-loss once price moves to favourable by a specified number of pips
atrtimeframe (int) : ATR Trailing Stop timeframe, only updates once per bar close. Options: 1, 5, 15, 30, 60, 240, 1440
atrperiod (int) : ATR averaging period
atrmultiplier (float) : Multiple of ATR to utilise in the new SL computation, default = 1
atrshift (int) : Relative shift of price information, 0 uses latest candle, 1 uses second last, etc. Default = 0
atrtrigger (int) : Activate the trigger of ATR Trailing after market moves favourably by a number of pips. Default = 0 (instant)
symbol (string) : The symbol to trigger this order on (defaults to current symbol)
accfilter (float) : Optional minimum account balance filter
comment (string) : Optional comment (maximum 20 characters)
secret (string) : Optional secret key (must be enabled in dashboard)
freq (string) : Alert frequency. Default = "all", options = "once_per_bar", "once_per_bar_close" and "none"
debug (bool) : Turns on/off debug label
Returns: A limit order alert string with valid PC syntax based on supplied parameters
buylimit(licenseID, price, risk, sl, tp, betrigger, beoffset, spread, trailtrig, traildist, trailstep, atrtimeframe, atrperiod, atrmultiplier, atrshift, atrtrigger, symbol, accfilter, comment, secret, freq, debug)
Generates a buylimit order alert with relevant syntax commands. Required params: licenseID, price, risk.
Parameters:
licenseID (string) : Your PC license ID
price (float) : Price or pips to set limit order (according to EA settings)
risk (float) : Risk quantity (according to EA settings)
sl (float) : Stop loss distance in pips or price
tp (float) : Take profit distance in pips or price
betrigger (float) : Breakeven will be activated after the position gains this number of pips
beoffset (float) : Offset from entry price. This is the amount of pips you'd like to protect
spread (float) : Enter the position only if the spread is equal or less than the specified value in pips
trailtrig (float) : Trailing stop-loss will be activated after a trade gains this number of pips
traildist (float) : Distance of the trailing stop-loss from current price
trailstep (float) : Moves trailing stop-loss once price moves to favourable by a specified number of pips
atrtimeframe (int) : ATR Trailing Stop timeframe, only updates once per bar close. Options: 1, 5, 15, 30, 60, 240, 1440
atrperiod (int) : ATR averaging period
atrmultiplier (float) : Multiple of ATR to utilise in the new SL computation, default = 1
atrshift (int) : Relative shift of price information, 0 uses latest candle, 1 uses second last, etc. Default = 0
atrtrigger (int) : Activate the trigger of ATR Trailing after market moves favourably by a number of pips. Default = 0 (instant)
symbol (string) : The symbol to trigger this order on (defaults to current symbol)
accfilter (float) : Optional minimum account balance filter
comment (string) : Optional comment (maximum 20 characters)
secret (string) : Optional secret key (must be enabled in dashboard)
freq (string) : Alert frequency. Default = "all", options = "once_per_bar", "once_per_bar_close" and "none"
debug (bool) : Turns on/off debug label
Returns: A limit order alert string with valid PC syntax based on supplied parameters
selllimit(licenseID, price, risk, sl, tp, betrigger, beoffset, spread, trailtrig, traildist, trailstep, atrtimeframe, atrperiod, atrmultiplier, atrshift, atrtrigger, symbol, accfilter, comment, secret, freq, debug)
Generates a selllimit order alert with relevant syntax commands. Required params: licenseID, price, risk.
Parameters:
licenseID (string) : Your PC license ID
price (float) : Price or pips to set limit order (according to EA settings)
risk (float) : Risk quantity (according to EA settings)
sl (float) : Stop loss distance in pips or price
tp (float) : Take profit distance in pips or price
betrigger (float) : Breakeven will be activated after the position gains this number of pips
beoffset (float) : Offset from entry price. This is the amount of pips you'd like to protect
spread (float) : Enter the position only if the spread is equal or less than the specified value in pips
trailtrig (float) : Trailing stop-loss will be activated after a trade gains this number of pips
traildist (float) : Distance of the trailing stop-loss from current price
trailstep (float) : Moves trailing stop-loss once price moves to favourable by a specified number of pips
atrtimeframe (int) : ATR Trailing Stop timeframe, only updates once per bar close. Options: 1, 5, 15, 30, 60, 240, 1440
atrperiod (int) : ATR averaging period
atrmultiplier (float) : Multiple of ATR to utilise in the new SL computation, default = 1
atrshift (int) : Relative shift of price information, 0 uses latest candle, 1 uses second last, etc. Default = 0
atrtrigger (int) : Activate the trigger of ATR Trailing after market moves favourably by a number of pips. Default = 0 (instant)
symbol (string) : The symbol to trigger this order on (defaults to current symbol)
accfilter (float) : Optional minimum account balance filter
comment (string) : Optional comment (maximum 20 characters)
secret (string) : Optional secret key (must be enabled in dashboard)
freq (string) : Alert frequency. Default = "all", options = "once_per_bar", "once_per_bar_close" and "none"
debug (bool) : Turns on/off debug label
Returns: A limit order alert string with valid PC syntax based on supplied parameters
stop_order(licenseID, buy, price, risk, sl, tp, betrigger, beoffset, spread, trailtrig, traildist, trailstep, atrtimeframe, atrperiod, atrmultiplier, atrshift, atrtrigger, symbol, accfilter, comment, secret, freq, debug)
Generates a stop order alert with relevant syntax commands. Required params: licenseID, buy, price, risk.
Parameters:
licenseID (string) : Your PC license ID
buy (bool) : true=buy/long, false=sell/short
price (float) : Price or pips to set limit order (according to EA settings)
risk (float) : Risk quantity (according to EA settings)
sl (float) : Stop loss distance in pips or price
tp (float) : Take profit distance in pips or price
betrigger (float) : Breakeven will be activated after the position gains this number of pips
beoffset (float) : Offset from entry price. This is the amount of pips you'd like to protect
spread (float) : Enter the position only if the spread is equal or less than the specified value in pips
trailtrig (float) : Trailing stop-loss will be activated after a trade gains this number of pips
traildist (float) : Distance of the trailing stop-loss from current price
trailstep (float) : Moves trailing stop-loss once price moves to favourable by a specified number of pips
atrtimeframe (int) : ATR Trailing Stop timeframe, only updates once per bar close. Options: 1, 5, 15, 30, 60, 240, 1440
atrperiod (int) : ATR averaging period
atrmultiplier (float) : Multiple of ATR to utilise in the new SL computation, default = 1
atrshift (int) : Relative shift of price information, 0 uses latest candle, 1 uses second last, etc. Default = 0
atrtrigger (int) : Activate the trigger of ATR Trailing after market moves favourably by a number of pips. Default = 0 (instant)
symbol (string) : The symbol to trigger this order on (defaults to current symbol)
accfilter (float) : Optional minimum account balance filter
comment (string) : Optional comment (maximum 20 characters)
secret (string) : Optional secret key (must be enabled in dashboard)
freq (string) : Alert frequency. Default = "all", options = "once_per_bar", "once_per_bar_close" and "none"
debug (bool) : Turns on/off debug label
Returns: A stop order alert string with valid PC syntax based on supplied parameters
buystop(licenseID, price, risk, sl, tp, betrigger, beoffset, spread, trailtrig, traildist, trailstep, atrtimeframe, atrperiod, atrmultiplier, atrshift, atrtrigger, symbol, accfilter, comment, secret, freq, debug)
Generates a buystop order alert with relevant syntax commands. Required params: licenseID, price, risk.
Parameters:
licenseID (string) : Your PC license ID
price (float) : Price or pips to set limit order (according to EA settings)
risk (float) : Risk quantity (according to EA settings)
sl (float) : Stop loss distance in pips or price
tp (float) : Take profit distance in pips or price
betrigger (float) : Breakeven will be activated after the position gains this number of pips
beoffset (float) : Offset from entry price. This is the amount of pips you'd like to protect
spread (float) : Enter the position only if the spread is equal or less than the specified value in pips
trailtrig (float) : Trailing stop-loss will be activated after a trade gains this number of pips
traildist (float) : Distance of the trailing stop-loss from current price
trailstep (float) : Moves trailing stop-loss once price moves to favourable by a specified number of pips
atrtimeframe (int) : ATR Trailing Stop timeframe, only updates once per bar close. Options: 1, 5, 15, 30, 60, 240, 1440
atrperiod (int) : ATR averaging period
atrmultiplier (float) : Multiple of ATR to utilise in the new SL computation, default = 1
atrshift (int) : Relative shift of price information, 0 uses latest candle, 1 uses second last, etc. Default = 0
atrtrigger (int) : Activate the trigger of ATR Trailing after market moves favourably by a number of pips. Default = 0 (instant)
symbol (string) : The symbol to trigger this order on (defaults to current symbol)
accfilter (float) : Optional minimum account balance filter
comment (string) : Optional comment (maximum 20 characters)
secret (string) : Optional secret key (must be enabled in dashboard)
freq (string) : Alert frequency. Default = "all", options = "once_per_bar", "once_per_bar_close" and "none"
debug (bool) : Turns on/off debug label
Returns: A stop order alert string with valid PC syntax based on supplied parameters
sellstop(licenseID, price, risk, sl, tp, betrigger, beoffset, spread, trailtrig, traildist, trailstep, atrtimeframe, atrperiod, atrmultiplier, atrshift, atrtrigger, symbol, accfilter, comment, secret, freq, debug)
Generates a sellstop order alert with relevant syntax commands. Required params: licenseID, price, risk.
Parameters:
licenseID (string) : Your PC license ID
price (float) : Price or pips to set limit order (according to EA settings)
risk (float) : Risk quantity (according to EA settings)
sl (float) : Stop loss distance in pips or price
tp (float) : Take profit distance in pips or price
betrigger (float) : Breakeven will be activated after the position gains this number of pips
beoffset (float) : Offset from entry price. This is the amount of pips you'd like to protect
spread (float) : Enter the position only if the spread is equal or less than the specified value in pips
trailtrig (float) : Trailing stop-loss will be activated after a trade gains this number of pips
traildist (float) : Distance of the trailing stop-loss from current price
trailstep (float) : Moves trailing stop-loss once price moves to favourable by a specified number of pips
atrtimeframe (int) : ATR Trailing Stop timeframe, only updates once per bar close. Options: 1, 5, 15, 30, 60, 240, 1440
atrperiod (int) : ATR averaging period
atrmultiplier (float) : Multiple of ATR to utilise in the new SL computation, default = 1
atrshift (int) : Relative shift of price information, 0 uses latest candle, 1 uses second last, etc. Default = 0
atrtrigger (int) : Activate the trigger of ATR Trailing after market moves favourably by a number of pips. Default = 0 (instant)
symbol (string) : The symbol to trigger this order on (defaults to current symbol)
accfilter (float) : Optional minimum account balance filter
comment (string) : Optional comment (maximum 20 characters)
secret (string) : Optional secret key (must be enabled in dashboard)
freq (string) : Alert frequency. Default = "all", options = "once_per_bar", "once_per_bar_close" and "none"
debug (bool) : Turns on/off debug label
Returns: A stop order alert string with valid PC syntax based on supplied parameters
cancel_neworder(licenseID, order, price, risk, sl, tp, betrigger, beoffset, spread, trailtrig, traildist, trailstep, atrtimeframe, atrperiod, atrmultiplier, atrshift, atrtrigger, symbol, accfilter, comment, secret, freq, debug)
Cancel + place new order template function.
Parameters:
licenseID (string) : Your PC license ID
order (string) : Cancel order type
price (float) : Price or pips to set limit order (according to EA settings)
risk (float) : Risk quantity (according to EA settings)
sl (float) : Stop loss distance in pips or price
tp (float) : Take profit distance in pips or price
betrigger (float) : Breakeven will be activated after the position gains this number of pips
beoffset (float) : Offset from entry price. This is the amount of pips you'd like to protect
spread (float) : Enter the position only if the spread is equal or less than the specified value in pips
trailtrig (float) : Trailing stop-loss will be activated after a trade gains this number of pips
traildist (float) : Distance of the trailing stop-loss from current price
trailstep (float) : Moves trailing stop-loss once price moves to favourable by a specified number of pips
atrtimeframe (int) : ATR Trailing Stop timeframe, only updates once per bar close. Options: 1, 5, 15, 30, 60, 240, 1440
atrperiod (int) : ATR averaging period
atrmultiplier (float) : Multiple of ATR to utilise in the new SL computation, default = 1
atrshift (int) : Relative shift of price information, 0 uses latest candle, 1 uses second last, etc. Default = 0
atrtrigger (int) : Activate the trigger of ATR Trailing after market moves favourably by a number of pips. Default = 0 (instant)
symbol (string) : The symbol to trigger this order on (defaults to current symbol)
accfilter (float) : Optional minimum account balance filter
comment (string) : Optional comment (maximum 20 characters)
secret (string) : Optional secret key (must be enabled in dashboard)
freq (string) : Alert frequency. Default = "all", options = "once_per_bar", "once_per_bar_close" and "none"
debug (bool) : Turns on/off debug label
Returns: A stop order alert string with valid PC syntax based on supplied parameters
cancellongbuystop(licenseID, price, risk, sl, tp, betrigger, beoffset, spread, trailtrig, traildist, trailstep, atrtimeframe, atrperiod, atrmultiplier, atrshift, atrtrigger, symbol, accfilter, comment, secret, freq, debug)
Cancels all long orders with the specified symbol and places a new buystop order. Required params: licenseID, price, risk.
Parameters:
licenseID (string) : Your PC license ID
price (float) : Price or pips to set limit order (according to EA settings)
risk (float) : Risk quantity (according to EA settings)
sl (float) : Stop loss distance in pips or price
tp (float) : Take profit distance in pips or price
betrigger (float) : Breakeven will be activated after the position gains this number of pips
beoffset (float) : Offset from entry price. This is the amount of pips you'd like to protect
spread (float) : Enter the position only if the spread is equal or less than the specified value in pips
trailtrig (float) : Trailing stop-loss will be activated after a trade gains this number of pips
traildist (float) : Distance of the trailing stop-loss from current price
trailstep (float) : Moves trailing stop-loss once price moves to favourable by a specified number of pips
atrtimeframe (int) : ATR Trailing Stop timeframe, only updates once per bar close. Options: 1, 5, 15, 30, 60, 240, 1440
atrperiod (int) : ATR averaging period
atrmultiplier (float) : Multiple of ATR to utilise in the new SL computation, default = 1
atrshift (int) : Relative shift of price information, 0 uses latest candle, 1 uses second last, etc. Default = 0
atrtrigger (int) : Activate the trigger of ATR Trailing after market moves favourably by a number of pips. Default = 0 (instant)
symbol (string) : The symbol to trigger this order on (defaults to current symbol)
accfilter (float) : Optional minimum account balance filter
comment (string) : Optional comment (maximum 20 characters)
secret (string) : Optional secret key (must be enabled in dashboard)
freq (string) : Alert frequency. Default = "all", options = "once_per_bar", "once_per_bar_close" and "none"
debug (bool) : Turns on/off debug label
Returns: A stop order alert string with valid PC syntax based on supplied parameters
cancellongbuylimit(licenseID, price, risk, sl, tp, betrigger, beoffset, spread, trailtrig, traildist, trailstep, atrtimeframe, atrperiod, atrmultiplier, atrshift, atrtrigger, symbol, accfilter, comment, secret, freq, debug)
Cancels all long orders with the specified symbol and places a new buylimit order. Required params: licenseID, price, risk.
Parameters:
licenseID (string) : Your PC license ID
price (float) : Price or pips to set limit order (according to EA settings)
risk (float) : Risk quantity (according to EA settings)
sl (float) : Stop loss distance in pips or price
tp (float) : Take profit distance in pips or price
betrigger (float) : Breakeven will be activated after the position gains this number of pips
beoffset (float) : Offset from entry price. This is the amount of pips you'd like to protect
spread (float) : Enter the position only if the spread is equal or less than the specified value in pips
trailtrig (float) : Trailing stop-loss will be activated after a trade gains this number of pips
traildist (float) : Distance of the trailing stop-loss from current price
trailstep (float) : Moves trailing stop-loss once price moves to favourable by a specified number of pips
atrtimeframe (int) : ATR Trailing Stop timeframe, only updates once per bar close. Options: 1, 5, 15, 30, 60, 240, 1440
atrperiod (int) : ATR averaging period
atrmultiplier (float) : Multiple of ATR to utilise in the new SL computation, default = 1
atrshift (int) : Relative shift of price information, 0 uses latest candle, 1 uses second last, etc. Default = 0
atrtrigger (int) : Activate the trigger of ATR Trailing after market moves favourably by a number of pips. Default = 0 (instant)
symbol (string) : The symbol to trigger this order on (defaults to current symbol)
accfilter (float) : Optional minimum account balance filter
comment (string) : Optional comment (maximum 20 characters)
secret (string) : Optional secret key (must be enabled in dashboard)
freq (string) : Alert frequency. Default = "all", options = "once_per_bar", "once_per_bar_close" and "none"
debug (bool) : Turns on/off debug label
Returns: A stop order alert string with valid PC syntax based on supplied parameters
cancelshortsellstop(licenseID, price, risk, sl, tp, betrigger, beoffset, spread, trailtrig, traildist, trailstep, atrtimeframe, atrperiod, atrmultiplier, atrshift, atrtrigger, symbol, accfilter, comment, secret, freq, debug)
Cancels all short orders with the specified symbol and places a sellstop order. Required params: licenseID, price, risk.
Parameters:
licenseID (string) : Your PC license ID
price (float) : Price or pips to set limit order (according to EA settings)
risk (float) : Risk quantity (according to EA settings)
sl (float) : Stop loss distance in pips or price
tp (float) : Take profit distance in pips or price
betrigger (float) : Breakeven will be activated after the position gains this number of pips
beoffset (float) : Offset from entry price. This is the amount of pips you'd like to protect
spread (float) : Enter the position only if the spread is equal or less than the specified value in pips
trailtrig (float) : Trailing stop-loss will be activated after a trade gains this number of pips
traildist (float) : Distance of the trailing stop-loss from current price
trailstep (float) : Moves trailing stop-loss once price moves to favourable by a specified number of pips
atrtimeframe (int) : ATR Trailing Stop timeframe, only updates once per bar close. Options: 1, 5, 15, 30, 60, 240, 1440
atrperiod (int) : ATR averaging period
atrmultiplier (float) : Multiple of ATR to utilise in the new SL computation, default = 1
atrshift (int) : Relative shift of price information, 0 uses latest candle, 1 uses second last, etc. Default = 0
atrtrigger (int) : Activate the trigger of ATR Trailing after market moves favourably by a number of pips. Default = 0 (instant)
symbol (string) : The symbol to trigger this order on (defaults to current symbol)
accfilter (float) : Optional minimum account balance filter
comment (string) : Optional comment (maximum 20 characters)
secret (string) : Optional secret key (must be enabled in dashboard)
freq (string) : Alert frequency. Default = "all", options = "once_per_bar", "once_per_bar_close" and "none"
debug (bool) : Turns on/off debug label
Returns: A stop order alert string with valid PC syntax based on supplied parameters
cancelshortselllimit(licenseID, price, risk, sl, tp, betrigger, beoffset, spread, trailtrig, traildist, trailstep, atrtimeframe, atrperiod, atrmultiplier, atrshift, atrtrigger, symbol, accfilter, comment, secret, freq, debug)
Cancels all short orders with the specified symbol and places a selllimit order. Required params: licenseID, price, risk.
Parameters:
licenseID (string) : Your PC license ID
price (float) : Price or pips to set limit order (according to EA settings)
risk (float) : Risk quantity (according to EA settings)
sl (float) : Stop loss distance in pips or price
tp (float) : Take profit distance in pips or price
betrigger (float) : Breakeven will be activated after the position gains this number of pips
beoffset (float) : Offset from entry price. This is the amount of pips you'd like to protect
spread (float) : Enter the position only if the spread is equal or less than the specified value in pips
trailtrig (float) : Trailing stop-loss will be activated after a trade gains this number of pips
traildist (float) : Distance of the trailing stop-loss from current price
trailstep (float) : Moves trailing stop-loss once price moves to favourable by a specified number of pips
atrtimeframe (int) : ATR Trailing Stop timeframe, only updates once per bar close. Options: 1, 5, 15, 30, 60, 240, 1440
atrperiod (int) : ATR averaging period
atrmultiplier (float) : Multiple of ATR to utilise in the new SL computation, default = 1
atrshift (int) : Relative shift of price information, 0 uses latest candle, 1 uses second last, etc. Default = 0
atrtrigger (int) : Activate the trigger of ATR Trailing after market moves favourably by a number of pips. Default = 0 (instant)
symbol (string) : The symbol to trigger this order on (defaults to current symbol)
accfilter (float) : Optional minimum account balance filter
comment (string) : Optional comment (maximum 20 characters)
secret (string) : Optional secret key (must be enabled in dashboard)
freq (string) : Alert frequency. Default = "all", options = "once_per_bar", "once_per_bar_close" and "none"
debug (bool) : Turns on/off debug label
Returns: A stop order alert string with valid PC syntax based on supplied parameters
cancellong(licenseID, symbol, accfilter, comment, secret, freq, debug)
Cancels all pending long orders with the specified symbol. Required params: licenseID.
Parameters:
licenseID (string) : Your PC license ID
symbol (string) : Symbol to act on (defaults to current symbol)
accfilter (float) : Optional minimum account balance filter
comment (string) : Optional comment to include (max 20 characters)
secret (string) : Optional secret key (must be enabled in dashboard)
freq (string) : Alert frequency. Default = "all", options = "once_per_bar", "once_per_bar_close" and "none"
debug (bool) : Turns on/off debug label
Returns: A cancel long alert command
cancelshort(licenseID, symbol, accfilter, comment, secret, freq, debug)
Cancels all pending short orders with the specified symbol. Required params: licenseID.
Parameters:
licenseID (string) : Your PC license ID
symbol (string) : Symbol to act on (defaults to current symbol)
accfilter (float) : Optional minimum account balance filter
comment (string) : Optional comment to include (max 20 characters)
secret (string) : Optional secret key (must be enabled in dashboard)
freq (string) : Alert frequency. Default = "all", options = "once_per_bar", "once_per_bar_close" and "none"
debug (bool) : Turns on/off debug label
Returns: A cancel short alert command
newsltpbuystop(licenseID, sl, tp, symbol, accfilter, comment, secret, freq, debug)
Updates the stop loss and/or take profit of any pending buy stop orders on the given symbol. Required params: licenseID, sl and/or tp.
Parameters:
licenseID (string) : Your PC license ID
sl (float) : Stop loss pips or price (according to EA settings)
tp (float) : Take profit pips or price (according to EA settings)
symbol (string) : Symbol to act on (defaults to current symbol)
accfilter (float) : Optional minimum account balance filter
comment (string) : Optional comment to include (max 20 characters)
secret (string) : Optional secret key (must be enabled in dashboard)
freq (string) : Alert frequency. Default = "all", options = "once_per_bar", "once_per_bar_close" and "none"
debug (bool) : Turns on/off debug label
Returns: The required alert syntax as a string
newsltpbuylimit(licenseID, sl, tp, symbol, accfilter, comment, secret, freq, debug)
Updates the stop loss and/or take profit of any pending buy limit orders on the given symbol. Required params: licenseID, sl and/or tp.
Parameters:
licenseID (string) : Your PC license ID
sl (float) : Stop loss pips or price (according to EA settings)
tp (float) : Take profit pips or price (according to EA settings)
symbol (string) : Symbol to act on (defaults to current symbol)
accfilter (float) : Optional minimum account balance filter
comment (string) : Optional comment to include (max 20 characters)
secret (string) : Optional secret key (must be enabled in dashboard)
freq (string) : Alert frequency. Default = "all", options = "once_per_bar", "once_per_bar_close" and "none"
debug (bool) : Turns on/off debug label
Returns: The required alert syntax as a string
newsltpsellstop(licenseID, sl, tp, symbol, accfilter, comment, secret, freq, debug)
Updates the stop loss and/or take profit of any pending sell stop orders on the given symbol. Required params: licenseID, sl and/or tp.
Parameters:
licenseID (string) : Your PC license ID
sl (float) : Stop loss pips or price (according to EA settings)
tp (float) : Take profit pips or price (according to EA settings)
symbol (string) : Symbol to act on (defaults to current symbol)
accfilter (float) : Optional minimum account balance filter
comment (string) : Optional comment to include (max 20 characters)
secret (string) : Optional secret key (must be enabled in dashboard)
freq (string) : Alert frequency. Default = "all", options = "once_per_bar", "once_per_bar_close" and "none"
debug (bool) : Turns on/off debug label
Returns: The required alert syntax as a string
newsltpselllimit(licenseID, sl, tp, symbol, accfilter, comment, secret, freq, debug)
Updates the stop loss and/or take profit of any pending sell limit orders on the given symbol. Required params: licenseID, sl and/or tp.
Parameters:
licenseID (string) : Your PC license ID
sl (float) : Stop loss pips or price (according to EA settings)
tp (float) : Take profit pips or price (according to EA settings)
symbol (string) : Symbol to act on (defaults to current symbol)
accfilter (float) : Optional minimum account balance filter
comment (string) : Optional comment to include (max 20 characters)
secret (string) : Optional secret key (must be enabled in dashboard)
freq (string) : Alert frequency. Default = "all", options = "once_per_bar", "once_per_bar_close" and "none"
debug (bool) : Turns on/off debug label
Returns: The required alert syntax as a string
eaoff(licenseID, secret, freq, debug)
Turns the EA off. Required params: licenseID.
Parameters:
licenseID (string) : Your PC license ID
secret (string) : Optional secret key (must be enabled in dashboard)
freq (string) : Alert frequency. Default = "all", options = "once_per_bar", "once_per_bar_close" and "none"
debug (bool) : Turns on/off debug label
Returns: The required alert syntax as a string
eaon(licenseID, secret, freq, debug)
Turns the EA on. Required params: licenseID.
Parameters:
licenseID (string) : Your PC license ID
secret (string) : Optional secret key (must be enabled in dashboard)
freq (string) : Alert frequency. Default = "all", options = "once_per_bar", "once_per_bar_close" and "none"
debug (bool) : Turns on/off debug label
Returns: The required alert syntax as a string

Breakout and Breakdown Indicator with RetestsThis indicator is designed to help traders identify high-probability breakout and breakdown points based on the first 5 minutes of market activity (9:30 am to 9:35 am). It works effectively on both the 1-minute and 5-minute timeframes, making it ideal for day traders and scalpers.
This indicator is a better indicator of my previous 5-Minute Opening Range Breakout indicator.
Key Features:
Dynamic Support and Resistance Lines: Automatically plots the highest and lowest price levels from 9:30 am to 9:35 am, providing essential support and resistance zones.
Breakout/Breakdown Detection: Identifies and marks successful breakout and breakdown points only after a confirmed retest, ensuring more accurate signals.
Visual Markers: Uses customizable green diamonds for successful breakouts and red diamonds for successful breakdowns, allowing easy identification on the chart.
Customization Options:
Change Colors: You can personalize the color of the breakout and breakdown markers, the label text, and the lines drawn from the 9:30 am to 9:35 am window.
Adapt to Your Chart: Adjust the indicator to match your preferred charting theme, ensuring it blends seamlessly with your trading setup.
How It Works:
Plots Key Levels: Identifies the highest and lowest prices during the first 5 minutes of trading (9:30 am to 9:35 am) and plots them on the chart.
Monitors Retests: Waits for a retest of these levels before confirming a breakout or breakdown.
Labels Breakouts/Breakdowns: After a retest, successful breakouts are marked with green diamonds and "Breakout" text, while breakdowns are marked with red diamonds and "Breakdown" text.
Why Use This Indicator?
Avoid False Signals: The retest requirement helps filter out false breakouts and breakdowns, offering more reliable trading signals.
Works Across Timeframes: Suitable for both 1-minute and 5-minute charts, allowing flexibility for different trading styles.
Some what Customizable: Adjust colors to fit your charting preferences and enhance visual clarity.
Recommended Use: Combine this indicator with other technical analysis tools, such as volume, candlestick patterns, or moving averages, for more informed trading decisions.
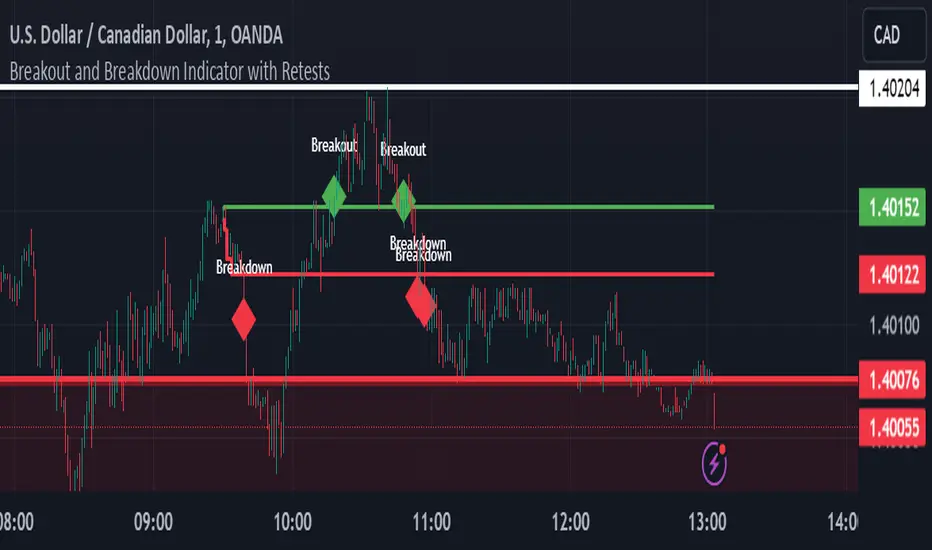
Risk Management Calculator with Fees and Take Profit [CHE]Risk Management Calculator with Fees and Take Profit
Welcome to the Risk Management Calculator with Fees and Take Profit script! This powerful tool is designed to help traders manage their risk effectively, calculate leverage, and set take profit targets. The script is inspired by and builds upon the ideas from the following TradingView script: ().
This script is inspired by and builds upon the ideas from the following TradingView script:
Features
1. Portfolio Size Input: Enter the size of your portfolio to accurately calculate your risk and leverage.
2. Max Loss Percent Input: Specify the maximum percentage of your portfolio that you are willing to risk on a single trade.
3. Max Leverage Input: Set the maximum leverage you are comfortable using.
4. Trading Fee Input: Include trading fees in your calculations to get a more realistic view of your potential losses and gains.
5. ATR Settings: Configure the ATR period and multiplier to calculate your stop loss and take profit levels.
6. RSI Settings: Adjust the RSI period for trend analysis.
How to Use
Portfolio Size
- Description: This is the total value of your trading account.
- Input: `portfolioSize`
- Default Value: 100
- Minimum Value: 0.001
Max Loss Percent
- Description: The maximum percentage of your portfolio you are willing to lose on a single trade.
- Input: `maxLossPercent`
- Default Value: 3%
- Range: 0.1% to 100%
Max Leverage
- Description: The maximum leverage you wish to use.
- Input: `maxLeverage`
- Default Value: 125
- Range: 1 to 125
Trading Fee
- Description: The fee percentage you pay per trade.
- Input: `feeRate`
- Default Value: 1%
- Range: 0% to 10%
ATR Settings
- ATR Period: Number of bars used to calculate the Average True Range.
- Input: `atrPeriod`
- Default Value: 5
- ATR Multiplier: Multiplier for ATR to set stop loss levels.
- Input: `atrMultiplier`
- Default Value: 2.0
Take Profit Multiplier
- Description: Multiplier for ATR to set take profit levels.
- Input: `takeProfitMultiplier`
- Default Value: 2.0
RSI Settings
- RSI Period: Period for the RSI calculation.
- Input: `rsiPeriod`
- Default Value: 14
Dashboard
The script includes a customizable dashboard that displays the following information:
- Portfolio Size
- Maximum Loss Amount
- Entry Price
- Stop Loss Price
- Stop Loss Percentage
- Calculated Leverage
- Order Value
- Order Quantity
- Trend Direction
- Adjusted Maximum Loss Percentage
- Take Profit Price
Dashboard Settings
- Location: Choose the position of the dashboard on the chart.
- Options: 'Top Right', 'Bottom Right', 'Top Left', 'Bottom Left'
- Size: Adjust the size of the dashboard text.
- Options: 'Tiny', 'Small', 'Normal', 'Large'
- Text/Frame Color: Set the color for the text and frame of the dashboard.
Underlying Principles and Assumptions
Leverage Calculation
The leverage calculation is fundamental to risk management in trading. It ensures that the risk per trade does not exceed a specified percentage of the portfolio. This calculation takes into account the potential loss from the entry price to the stop loss level, adjusted for trading fees. By dividing the maximum acceptable loss by the total potential loss (including fees), we derive a leverage that limits the exposure per trade. This approach helps traders avoid over-leveraging, which can lead to significant losses.
ATR and Stop Loss
The Average True Range (ATR) is used to set stop loss levels because it measures market volatility. A higher ATR indicates more volatility, which means wider stop losses are needed to avoid being prematurely stopped out by normal market fluctuations. By using an ATR multiplier, the stop loss is dynamically adjusted based on current market conditions, providing a more robust risk management strategy.
Take Profit Calculation
The take profit level is calculated as a multiple of the ATR, ensuring that it is set at a realistic level relative to market volatility. This method aims to capture significant price movements while avoiding the noise of smaller fluctuations. Setting take profit targets this way helps in locking in profits when the market moves favorably.
RSI for Trend Confirmation
The Relative Strength Index (RSI) is used to confirm the trend direction. An RSI above 50 typically indicates a bullish trend, while an RSI below 50 indicates a bearish trend. By aligning trades with the prevailing trend, the script increases the probability of successful trades. This trend confirmation helps in making informed decisions about leverage and position sizing.
Risk Color Coding
The script uses color coding to visually indicate the risk level and trend direction. Green indicates a favorable condition for long trades, red for short trades, and gray for neutral conditions. This intuitive color coding aids in quickly assessing the market conditions and making timely trading decisions.
Conclusion
This script aims to provide a comprehensive risk management tool for traders. By integrating portfolio size, leverage, fees, ATR, and RSI, it helps in making informed trading decisions. We hope you find this tool useful in your trading journey.
Happy Trading!

Money Flow Profile [LuxAlgo]The Money Flow Profile is a charting tool that measures the traded volume or the money flow at all price levels on the market over a specified time period and highlights the relationship between the price of a given asset and the willingness of traders to either buy or sell it, allowing traders to reveal dominant and/or significant price levels and to analyze the trading activity of a particular user-selected range.
This tool combines a volume/money flow profile, a sentiment profile, and price levels, where the right side of the profile highlights the distribution of the traded activity/money flow at different price levels, the left side of the profile highlights the market sentiment at those price levels, and in the middle the price levels.
🔶 USAGE
A volume/money flow profile is an advanced charting tool that displays the traded volume/money flow at different price levels over a specific period. It helps traders visualize where the majority of trading activity/money flow has occurred.
A sentiment profile is a difference between buy and sell volume/money flow aiming to highlight the sentiment/dominance at specific price levels.
Each row of the profile presents figures on volume and money flow specific to price levels.
High volume/money flow nodes indicate areas of high activity and are likely to act as support or resistance in the future. They attract price and try to hold it there. Conversely, low-volume nodes are areas with low trading activity, that are less subject to get revisited by the price. The market often bounces right over these levels, not staying for long. The "Profile Heatmap" option of the script helps to better emphasize the trading activity within each areas.
By measuring the traded activity at each price level the script presents an ability to highlight the consolidation zones, in other words, highlights accumulation and distribution zones. When the price moves toward one end of the consolidation and volume pick up, it can foreshadow a potential breakout.
Level of Significance, Point of Control, Highest Sentiment Zone, and Profile Price levels are some of the other profile-related options available with the script.
🔶 SETTINGS
The script takes into account user-defined parameters and plots the profiles, where detailed usage for each user-defined input parameter in indicator settings is provided with the related input's tooltip.
🔹 Profile Generic Settings
Lookback Length / Fixed Range: Sets the lookback length.
Profile Source: Sets the profile source, Volume, or Money Flow.
🔹 Profile Presentation Settings
Volume/Money Flow Profile: Toggles the visibility of the Volume/Money Flow Profile.
High Traded Nodes: Threshold and Color option for high traded nodes.
Average Traded Nodes: Color option for average traded nodes.
Low Traded Nodes: Threshold and Color option for low traded nodes.
🔹 Sentiment Profile Settings
Sentiment Profile: Toggles the visibility of the Sentiment Profile.
Sentiment Polarity Method: Sets the method used to calculate the up/down volume/money flow.
Bullish Nodes: Color option for Bullish Nodes.
Bearish Nodes: Color option for Bearish Nodes.
🔹 Profile Heatmap Settings
Profile Heatmap: Toggles the visibility of the profile heatmap.
Heatmap Source: Sets the source of the profile heatmap, Volume/Money Flow Profile, or Sentiment Profile.
Heatmap Transparency: Control the transparency of the profile heatmap.
🔹 Other Presentation Settings
Level of Significance: Toggles the visibility of the level of significance line/zone.
Consolidation Zones: Toggles the visibility of the consolidation zones.
Consolidation Threshold, Color: Sets the threshold value and zone color.
Highest Sentiment Zone: Toggles the visibility of the highest bullish or bearish sentiment zone.
Profile Price Levels, Color, Size: Toggles the visibility of the profile price levels, and sets the color and the size of the level labels.
Profile Range Background Fill: Toggles the visibility of the profiles range.
🔹 Other Settings
Number of Rows: Specify how many rows each profile histogram will have.
Profile Width %: Alters the width of the rows in the histogram, relative to the profile length
Profile Text Size: Alters the size of the text. Setting to Auto will keep the text within the box limits.
Profile Horizontal Offset: Enables to move profile in the horizontal axis.
🔶 RELATED SCRIPTS
Liquidity-Sentiment-Profile
Swing-Volume-Profiles
For more and other conceptual scripts you are kindly invited to visit LuxAlgo-Scripts .

Commission-aware Trade LabelsCommission-aware Trade Labels
Description:
This library provides an easy way to visualize take-profit and stop-loss levels on your chart, taking into account trading commissions. The library calculates and displays the net profit or loss, along with other useful information such as risk/reward ratio, shares, and position size.
Features:
Configurable take-profit and stop-loss prices or percentages.
Set entry amount or shares.
Calculates and displays the risk/reward ratio.
Shows net profit or loss, considering trading commissions.
Customizable label appearance.
Usage:
Add the script to your chart.
Create an Order object for take-profit and stop-loss with desired configurations.
Call target_label() and stop_label() methods for each order object.
Example:
target_order = Order.new(take_profit_price=27483, stop_loss_price=28000, shares=0.2)
stop_order = Order.new(stop_loss_price=29000, shares=1)
target_order.target_label()
stop_order.stop_label()
This script is a powerful tool for visualizing your trading strategy's performance and helps you make better-informed decisions by considering trading commissions in your profit and loss calculations.
Library "tradelabels"
entry_price(this)
Parameters:
this : Order object
@return entry_price
take_profit_price(this)
Parameters:
this : Order object
@return take_profit_price
stop_loss_price(this)
Parameters:
this : Order object
@return stop_loss_price
is_long(this)
Parameters:
this : Order object
@return entry_price
is_short(this)
Parameters:
this : Order object
@return entry_price
percent_to_target(this, target)
Parameters:
this : Order object
target : Target price
@return percent
risk_reward(this)
Parameters:
this : Order object
@return risk_reward_ratio
shares(this)
Parameters:
this : Order object
@return shares
position_size(this)
Parameters:
this : Order object
@return position_size
commission_cost(this, target_price)
Parameters:
this : Order object
@return commission_cost
target_price
net_result(this, target_price)
Parameters:
this : Order object
target_price : The target price to calculate net result for (either take_profit_price or stop_loss_price)
@return net_result
create_take_profit_label(this, prefix, size, offset_x, bg_color, text_color)
Parameters:
this
prefix
size
offset_x
bg_color
text_color
create_stop_loss_label(this, prefix, size, offset_x, bg_color, text_color)
Parameters:
this
prefix
size
offset_x
bg_color
text_color
create_entry_label(this, prefix, size, offset_x, bg_color, text_color)
Parameters:
this
prefix
size
offset_x
bg_color
text_color
create_line(this, target_price, line_color, offset_x, line_style, line_width, draw_entry_line)
Parameters:
this
target_price
line_color
offset_x
line_style
line_width
draw_entry_line
Order
Order
Fields:
entry_price : Entry price
stop_loss_price : Stop loss price
stop_loss_percent : Stop loss percent, default 2%
take_profit_price : Take profit price
take_profit_percent : Take profit percent, default 6%
entry_amount : Entry amount, default 5000$
shares : Shares
commission : Commission, default 0.04%
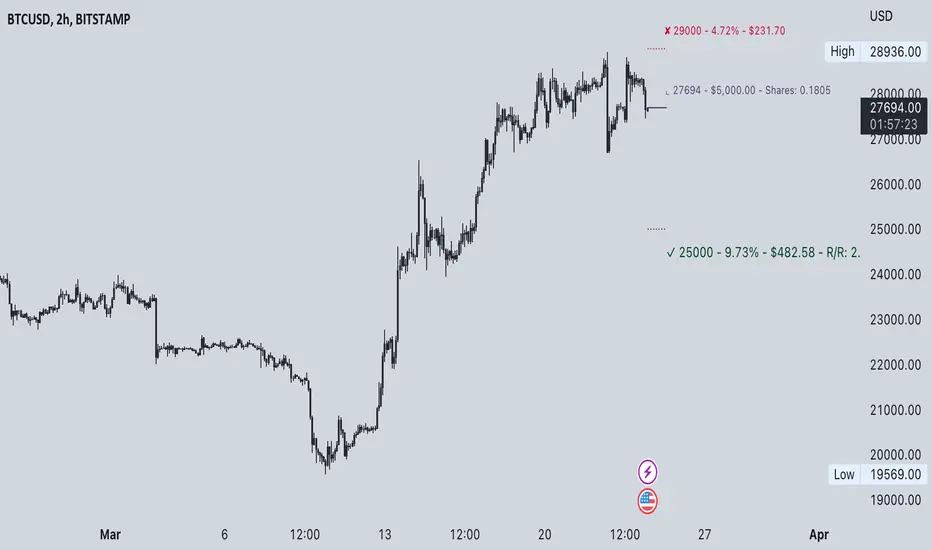
Multi-Condition Alert System d//@version=5
indicator("Multi-Condition Alert System", shorttitle="MC Alert", overlay=false)
// Timeframe check - Set to 10 minutes
isCorrectTF = timeframe.isintraday and timeframe.multiplier == 10
// EMA Calculations
ema9 = ta.ema(close, 9)
ema21 = ta.ema(close, 21)
ema50 = ta.ema(close, 50)
// MACD Calculations
= ta.macd(close, 12, 26, 9)
// RSI Calculations
rsiValue = ta.rsi(close, 14)
// Define RSI levels (you can adjust these based on your violet/yellow lines)
// Assuming violet is above 50 and yellow is below 50
rsiVioletLevel = 50 // Adjust based on your actual levels
rsiYellowLevel = 50 // Adjust based on your actual levels
// Conditions
emaCondition = ema9 > ema21 and ema9 > ema50
macdCondition = macdLine > signalLine
rsiCondition = rsiValue > rsiVioletLevel and rsiValue > rsiYellowLevel
// All conditions must be true
buySignal = emaCondition and macdCondition and rsiCondition and isCorrectTF
// Plotting for visualization
plot(ema9, color=color.blue, title="EMA 9")
plot(ema21, color=color.orange, title="EMA 21")
plot(ema50, color=color.red, title="EMA 50")
plot(macdLine, color=color.blue, title="MACD Line", style=plot.style_line)
plot(signalLine, color=color.orange, title="Signal Line", style=plot.style_line)
hline(rsiVioletLevel, "RSI Violet Level", color=color.purple)
hline(rsiYellowLevel, "RSI Yellow Level", color=color.yellow)
plot(rsiValue, color=color.white, title="RSI")
// Plot buy signals
plotshape(buySignal ? 1 : na, title="Buy Signal", location=location.bottom,
color=color.green, style=shape.triangleup, size=size.small)
// Alert condition
if buySignal
alert("BUY SIGNAL: EMA 9 > EMA 21 & 50, MACD blue > orange, RSI above levels", alert.freq_once_per_bar)
// Table display
var table signalTable = table.new(position.top_right, 1, 5, bgcolor=color.black,
border_width=1)
if barstate.islast
table.cell(signalTable, 0, 0, "10min TF Check:",
text_color=isCorrectTF ? color.green : color.red)
table.cell(signalTable, 0, 1, "EMA 9 > 21 & 50:",
text_color=emaCondition ? color.green : color.red)
table.cell(signalTable, 0, 2, "MACD Blue > Orange:",
text_color=macdCondition ? color.green : color.red)
table.cell(signalTable, 0, 3, "RSI Condition:",
text_color=rsiCondition ? color.green : color.red)
table.cell(signalTable, 0, 4, "BUY SIGNAL:",
text_color=buySignal ? color.green : color.red)

Impulse Reactor RSI-SMA Trend Indicator [ApexLegion]Impulse Reactor RSI-SMA Trend Indicator
Introduction and Theoretical Background
Design Rationale
Standard indicators frequently generate binary 'BUY' or 'SELL' signals without accounting for the broader market context. This often results in erratic "Flip-Flop" behavior, where signals are triggered indiscriminately regardless of the prevailing volatility regime.
Impulse Reactor was engineered to address this limitation by unifying two critical requirements: Quantitative Rigor and Execution Flexibility.
The Solution
Composite Analytical Framework This script is not a simple visual overlay of existing indicators. It is an algorithmic synthesis designed to function as a unified decision-making engine. The primary objective was to implement rigorous quantitative analysis (Volatility Normalization, Structural Filtering) directly within an alert-enabled framework. This architecture is designed to process signals through strict, multi-factor validation protocols before generating real-time notifications, allowing users to focus on structurally validated setups without manual monitoring.
How It Works
This is not a simple visual mashup. It utilizes a cross-validation algorithm where the Trend Structure acts as a gatekeeper for Momentum signals:
Logic over Lag: Unlike simple moving average crossovers, this script uses a 15-layer Gradient Ribbon to detect "Laminar Flow." If the ribbon is knotted (Compression), the system mathematically suppresses all signals.
Volatility Normalization: The core calculation adapts to ATR (Average True Range). This means the indicator automatically expands in volatile markets and contracts in quiet ones, maintaining accuracy without constant manual tweaking.
Adaptive Signal Thresholding: It incorporates an 'Anti-Greed' algorithm (Dynamic Thresholding) that automatically adjusts entry criteria based on trend duration. This logic aims to mitigate the risk of entering positions during periods of statistical trend exhaustion.
Why Use It?
Market State Decoding: The gradient Ribbon visualizes the underlying trend phase in real-time.
◦ Cyan/Blue Flow: Strong Bullish Trend (Laminar Flow).
◦ Magenta/Pink Flow: Strong Bearish Trend.
◦ Compressed/Knotted: When the ribbon lines are tightly squeezed or overlapping, it signals Consolidation. The system filters signals here to avoid chop.
Noise Reduction: The goal is not to catch every pivot, but to isolate high-confidence setups. The logic explicitly filters out minor fluctuations to help maintain position alignment with the broader trend.
⚖️ Chapter 1: System Architecture
Introduction: Composite Analytical Framework
System Overview
Impulse Reactor serves as a comprehensive technical analysis engine designed to synthesize three distinct market dimensions—Momentum, Volatility, and Trend Structure—into a unified decision-making framework. Unlike traditional methods that analyze these metrics in isolation, this system functions as a central processing unit that integrates disparate data streams to construct a coherent model of market behavior.
Operational Objective
The primary objective is to transition from single-dimensional signal generation to a multi-factor assessment model. By fusing data from the Impulse Core (Volatility), Gradient Oscillator (Momentum), and Structural Baseline (Trend), the system aims to filter out stochastic noise and identify high-probability trade setups grounded in quantitative confluence.
Market Microstructure Analysis: Limitations of Conventional Models
Extensive backtesting and quantitative analysis have identified three critical inefficiencies in standard oscillator-based strategies:
• Bounded Oscillator Limitations (The "Oscillation Trap"): Traditional indicators such as RSI or Stochastics are mathematically constrained between fixed values (0 to 100). In strong trending environments, these metrics often saturate in "overbought" or "oversold" zones. Consequently, traders relying on static thresholds frequently exit structurally valid positions prematurely or initiate counter-trend trades against prevailing momentum, resulting in suboptimal performance.
• Quantitative Blindness to Quality: Standard moving averages and trend indicators often fail to distinguish the qualitative nature of price movement. They treat low-volume drift and high-velocity expansion identically. This inability to account for "Volatility Quality" leads to delayed responsiveness during critical market events.
• Fractal Dissonance (Timeframe Disconnect): Financial markets exhibit fractal characteristics where trends on lower timeframes may contradict higher timeframe structures. Manual integration of multi-timeframe analysis increases cognitive load and susceptibility to human error, often resulting in conflicting biases at the point of execution.
Core Design Principles
To mitigate the aforementioned systemic inefficiencies, Impulse Reactor employs a modular architecture governed by three foundational principles:
Principle A:
Volatility Precursor Analysis Market mechanics demonstrate that volatility expansion often functions as a leading indicator for directional price movement. The system is engineered to detect "Volatility Deviation" — specifically, the divergence between short-term and long-term volatility baselines—prior to its manifestation in price action. This allows for entry timing aligned with the expansion phase of market volatility.
Principle B:
Momentum Density Visualization The system replaces singular momentum lines with a "Momentum Density" model utilizing a 15-layer Simple Moving Average (SMA) Ribbon.
• Concept: This visualization represents the aggregate strength and consistency of the trend.
• Application: A fully aligned and expanded ribbon indicates a robust trend structure ("Laminar Flow") capable of withstanding minor counter-trend noise, whereas a compressed ribbon signals consolidation or structural weakness.
Principle C:
Adaptive Confluence Protocols Signal validity is strictly governed by a multi-dimensional confluence logic. The system suppresses signal generation unless there is synchronized confirmation across all three analytical vectors:
1. Volatility: Confirmed expansion via the Impulse Core.
2. Momentum: Directional alignment via the Hybrid Oscillator.
3. Structure: Trend validation via the Baseline. This strict filtering mechanism significantly reduces false positives in non-trending (choppy) environments while maintaining sensitivity to genuine breakouts.
🔍 Chapter 2: Core Modules & Algorithmic Logic
Module A: Impulse Core (Normalized Volatility Deviation)
Operational Logic The Impulse Core functions as a volatility-normalized momentum gauge rather than a standard oscillator. It is designed to identify "Volatility Contraction" (Squeeze) and "Volatility Expansion" phases by quantifying the divergence between short-term and long-term volatility states.
Volatility Z-Score Normalization
The formula implements a custom normalization algorithm. Unlike standard oscillators that rely on absolute price changes, this logic calculates the Z-Score of the Volatility Spread.
◦ Numerator: (atr_f - atr_s) captures the raw momentum of volatility expansion.
◦ Denominator: (std_f + 1e-6) standardizes this value against historical variance.
◦ Result: This allows the indicator scales consistently across assets (e.g., Bitcoin vs. Euro) without manual recalibration.
f_impulse() =>
atr_f = ta.atr(fastLen) // Fast Volatility Baseline
atr_s = ta.atr(slowLen) // Slow Volatility Baseline
std_f = ta.stdev(atr_f, devLen) // Volatility Standard Deviation
(atr_f - atr_s) / (std_f + 1e-6) // Normalized Differential Calculation
Algorithmic Framework
• Differential Calculation: The system computes the spread between a Fast Volatility Baseline (ATR-10) and a Slow Volatility Baseline (ATR-30).
• Normalization Protocol: To standardize consistency across diverse asset classes (e.g., Forex vs. Crypto), the raw differential is divided by the standard deviation of the volatility itself over a 30-period lookback.
• Signal Generation:
◦ Contraction (Squeeze): When the Fast ATR compresses below the Slow ATR, it registers a potential volatility buildup phase.
◦ Expansion (Release): A rapid divergence of the Fast ATR above the Slow ATR signals a confirmed volatility expansion, validating the strength of the move.
Module B: Gradient Oscillator (RSI-SMA Hybrid)
Design Rationale To mitigate the "noise" and "false reversal" signals common in single-line oscillators (like standard RSI), this module utilizes a 15-Layer Gradient Ribbon to visualize momentum density and persistence.
Technical Architecture
• Ribbon Array: The system generates 15 sequential Simple Moving Averages (SMA) applied to a volatility-adjusted RSI source. The length of each layer increases incrementally.
• State Analysis:
Momentum Alignment (Laminar Flow): When all 15 layers are expanded and parallel, it indicates a robust trend where buying/selling pressure is distributed evenly across multiple timeframes. This state helps filter out premature "overbought/oversold" signals.
• Consolidation (Compression): When the distance between the fastest layer (Layer 1) and the slowest layer (Layer 15) approaches zero or the layers intersect, the system identifies a "Non-Tradable Zone," preventing entries during choppy market conditions.
// Laminar Flow Validation
f_validate_trend() =>
// Calculate spread between Ribbon layers
ribbon_spread = ta.stdev(ribbon_array, 15)
// Only allow signals if Ribbon is expanded (Laminar Flow)
is_flowing = ribbon_spread > min_expansion_threshold
// If compressed (Knotted), force signal to false
is_flowing ? signal : na
Module C: Adaptive Signal Filtering (Behavioral Bias Mitigation)
This subsystem, operating as an algorithmic "Anti-Greed" Mechanism, addresses the statistical tendency for signal degradation following prolonged trends.
Dynamic Threshold Adjustment
• Win Streak Detection: The algorithm internally tracks the outcome of closed trade cycles.
• Sensitivity Multiplier: Upon detecting consecutive successful signals in the same direction, a Penalty_Factor is applied to the entry logic.
• Operational Impact: This effectively raises the Required_Slope threshold for subsequent signals. For example, after three consecutive bullish signals, the system requires a 30% steeper trend angle to validate a fourth entry. This enforces stricter discipline during extended trends to reduce the probability of entering at the point of trend exhaustion.
Anti-Greed Logic: Dynamic Threshold Calculation
f_adjust_threshold(base_slope, win_streak) =>
// Adds a 10% penalty to the difficulty for every consecutive win
penalty_factor = 0.10
risk_scaler = 1 + (win_streak * penalty_factor)
// Returns the new, harder-to-reach threshold
base_slope * risk_scaler
Module D: Trend Baseline (Triple-Smoothed Structure)
The Trend Baseline serves as the structural filter for all signals. It employs a Triple-Smoothed Hybrid Algorithm designed to balance lag reduction with noise filtration.
Smoothing Stages
1. Volatility Banding: Utilizes a SuperTrend-based calculation to establish the upper and lower boundaries of price action.
2. Weighted Filter: Applies a Weighted Moving Average (WMA) to prioritize recent price data.
3. Exponential Smoothing: A final Exponential Moving Average (EMA) pass is applied to create a seamless baseline curve.
Functionality
This "Heavy" baseline resists minor intraday volatility spikes while remaining responsive to sustained structural shifts. A signal is only considered valid if the price action maintains structural integrity relative to this baseline
🚦 Chapter 3: Risk Management & Exit Protocols
Quantitative Risk Management (TP/SL & Trailing)
Foundational Architecture: Volatility-Adjusted Geometry Unlike strategies relying on static nominal values, Impulse Reactor establishes dynamic risk boundaries derived from quantitative volatility metrics. This design aligns trade invalidation levels mathematically with the current market regime.
• ATR-Based Dynamic Bracketing:
The protocol calculates Stop-Loss and Take-Profit levels by applying Fibonacci coefficients (Default: 0.786 for SL / 1.618 for TP) to the Average True Range (ATR).
◦ High Volatility Environments: The risk bands automatically expand to accommodate wider variance, preventing premature exits caused by standard market noise.
◦ Low Volatility Environments: The bands contract to tighten risk parameters, thereby dynamically adjusting the Risk-to-Reward (R:R) geometry.
• Close-Validation Protocol ("Soft Stop"):
Institutional algorithms frequently execute liquidity sweeps—driving prices briefly below key support levels to accumulate inventory.
◦ Mechanism: When the "Soft Stop" feature is enabled, the system filters out intraday volatility spikes. The stop-loss is conditional; execution is triggered only if the candle closes beyond the invalidation threshold.
◦ Strategic Advantage: This logic distinguishes between momentary price wicks and genuine structural breakdowns, preserving positions during transient volatility.
• Step-Function Trailing Mechanism:
To protect unrealized PnL while allowing for normal price breathing, a two-phase trailing methodology is employed:
◦ Phase 1 (Activation): The trailing function remains dormant until the price advances by a pre-defined percentage threshold.
◦ Phase 2 (Dynamic Floor): Once armed, the stop level creates a moving floor, adjusting relative to price action while maintaining a volatility-based (ATR) buffer to systematically protect unrealized PnL.
• Algorithmic Exit Protocols (Dynamic Liquidity Analysis)
◦ Rationale: Inefficiencies of Static Targets Static "Take Profit" levels often result in suboptimal exits. They compel traders to close positions based on arbitrary figures rather than evolving market structure, potentially capping upside during significant trends or retaining positions while the underlying trend structure deteriorates.
◦ Solution: Structural Integrity Assessment The system utilizes a Dynamic Liquidity Engine to continuously audit the validity of the position. Instead of targeting a specific price point, the algorithm evaluates whether the trend remains statistically robust.
Multi-Factor Exit Logic (The Tri-Vector System)
The Smart Exit protocol executes only when specific algorithmic invalidation criteria are met:
• 1. Momentum Exhaustion (Confluence Decay): The system monitors a 168-hour rolling average of the Confluence Score. A significant deviation below this historical baseline indicates momentum exhaustion, signaling that the driving force behind the trend has dissipated prior to a price reversal. This enables preemptive exits before a potential drawdown.
• 2. Statistical Over-Extension (Mean Reversion): Utilizing the core volatility logic, the system identifies instances where price deviates beyond 2.0 standard deviations from the mean. While the trend may be technically bullish, this statistical anomaly suggests a high probability of mean reversion (elastic snap-back), triggering a defensive exit to capitalize on peak valuation.
• 3. Oscillator Rejection (Immediate Pivot): To manage sudden V-shaped volatility, the system monitors RSI pivots. If a sharp "Pivot High" or divergence is detected, the protocol triggers an immediate "Peak Exit," bypassing standard trend filters to secure liquidity during high-velocity reversals.
🎨 Chapter 4: Visualization Guide
Gradient Oscillator Ribbon
The 15-layer SMA ribbon visualized via plot(r1...r15) represents the "Momentum Density" of the market.
• Visuals:
◦ Cyan/Blue Ribbon: Indicates Bullish Momentum.
◦ Pink/Magenta Ribbon: Indicates Bearish Momentum.
• Interpretation:
◦ Laminar Flow: When the ribbon expands widely and flows in parallel, it signifies a robust trend where momentum is distributed evenly across timeframes. This is the ideal state for trend-following.
◦ Compression (Consolidation): If the ribbon becomes narrow, twisted, or knotted, it indicates a "Non-Tradable Zone" where the market lacks a unified direction. Traders are advised to wait for clarity.
◦ Over-Extension: If the top layer crosses the Overbought (85) or Oversold (15) lines, it visually warns of potential market overheating.
Trend Baseline
The thick, color-changing line plotted via plot(baseline) represents the Structural Backbone of the market.
• Visuals: Changes color based on the trend direction (Blue for Bullish, Pink for Bearish).
• Interpretation:
Structural Filter: Long positions are statistically favored only when price action sustains above this baseline, while short positions are favored below it.
Dynamic Support/Resistance: The baseline acts as a dynamic support level during uptrends and resistance during downtrends.
Entry Signals & Labels
Text labels ("Long Entry", "Short Entry") appear when the system detects high-probability setups grounded in quantitative confluence.
• Visuals: Labeled signals appear above/below specific candles.
• Interpretation:
These signals represent moments where Volatility (Expansion), Momentum (Alignment), and Structure (Trend) are synchronized.
Smart Exit: Labels such as "Smart Exit" or "Peak Exit" appear when the system detects momentum exhaustion or structural decay, prompting a defensive exit to preserve capital.
Dynamic TP/SL Boxes
The semi-transparent colored zones drawn via fill() represent the risk management geometry.
• Visuals: Colored boxes extending from the entry point to the Take Profit (TP) and Stop Loss (SL) levels.
• Function:
Volatility-Adjusted Geometry: Unlike static price targets, these boxes expand during high volatility (to prevent wicks from stopping you out) and contract during low volatility (to optimize Risk-to-Reward ratios).
SAR + MACD Glow
Small glowing shapes appearing above or below candles.
• Visuals: Triangle or circle glows near the price bars.
• Interpretation:
This visual indicates a secondary confirmation where Parabolic SAR and MACD align with the main trend direction. It serves as an additional confluence factor to increase confidence in the trade setup.
Support/Resistance Table
A small table located at the bottom-right of the chart.
• Function: Automatically identifies and displays recent Pivot Highs (Resistance) and Pivot Lows (Support).
• Interpretation: These levels can be used as potential targets for Take Profit or invalidation points for manual Stop Loss adjustments.
🖥️ Chapter 5: Dashboard & Operational Guide
Integrated Analytics Panel (Dashboard Overview)
To facilitate rapid decision-making without manual calculation, the system aggregates critical market dimensions into a unified "Heads-Up Display" (HUD). This panel monitors real-time metrics across multiple timeframes and analytical vectors.
A. Intermediate Structure (12H Trend)
• Function: Anchors the intraday analysis to the broader market structure using a 12-hour rolling window.
• Interpretation:
◦ Bullish (> +0.5%): Indicates a positive structural bias. Long setups align with the macro flow.
◦ Bearish (< -0.5%): Indicates structural weakness. Short setups are statistically favored.
◦ Neutral: Represents a ranging environment where the Confluence Score becomes the primary weighting factor.
B. Composite Confluence Score (Signal Confidence)
• Definition: A probability metric derived from the synchronization of Volatility (Impulse Core), Momentum (Ribbon), and Trend (Baseline).
• Grading Scale:
Strong Buy/Sell (> 7.0 / < 3.0): Indicates full alignment across all three vectors. Represents a "Prime Setup" eligible for standard position sizing.
Buy/Sell (5.0–7.0 / 3.0–5.0): Indicates a valid trend but with moderate volatility confirmation.
Neutral: Signals conflicting data (e.g., Bullish Momentum vs. Bearish Structure). Trading is not recommended ("No-Trade Zone").
C. Statistical Deviation Status (Mean Reversion)
• Logic: Utilizes Bollinger Band deviation principles to quantify how far price has stretched from the statistical mean (20 SMA).
• Alert States:
Over-Extended (> 2.0 SD): Warning that price is statistically likely to revert to the mean (Elastic Snap-back), even if the trend remains technically valid. New entries are discouraged in this zone.
Normal: Price is within standard distribution limits, suitable for trend-following entries.
D. Volatility Regime Classification
• Metric: Compares current ATR against a 100-period historical baseline to categorize the market state.
• Regimes:
Low Volatility (Lvl < 1.0): Market Compression. Often precedes volatility expansion events.
Mid Volatility (Lvl 1.0 - 1.5): Standard operating environment.
High Volatility (Lvl > 1.5): Elevated market stress. Risk parameters should be adjusted (e.g., reduced position size) to account for increased variance.
E. Performance Telemetry
• Function: Displays the historical reliability of the Trend Baseline for the current asset and timeframe.
• Operational Threshold: If the displayed Win Rate falls below 40%, it suggests the current market behavior is incoherent (choppy) and does not respect trend logic. In such cases, switching assets or timeframes is recommended.
Operational Protocols & Signal Decoding
Visual Interpretation Standards
• Laminar Flow (Trade Confirmation): A valid trend is visually confirmed when the 15-layer SMA Ribbon is fully expanded and parallel. This indicates distributed momentum across timeframes.
• Consolidation (No-Trade): If the ribbon appears twisted, knotted, or compressed, the market lacks a unified directional vector.
• Baseline Interaction: The Triple-Smoothed Baseline acts as a dynamic support/resistance filter. Long positions remain valid only while price sustains above this structure.
System Calibration (Settings)
• Adaptive Signal Filtering (Prev. Anti-Greed): Enabled by default. This logic automatically raises the required trend slope threshold following consecutive wins to mitigate behavioral bias.
• Impulse Sensitivity: Controls the reactivity of the Volatility Core. Higher settings capture faster moves but may introduce more noise.
⚙️ Chapter 6: System Configuration & Alert Guide
This section provides a complete breakdown of every adjustable setting within Impulse Reactor to assist you in tailoring the engine to your specific needs.
🌐 LANGUAGE SETTINGS (Localization)
◦ Select Language (Default: English):
Function: Instantly translates all chart labels, dashboard texts into your preferred language.
Supported: English, Korean, Chinese, Spanish
⚡ IMPULSE CORE SETTINGS (Volatility Engine)
◦ Deviation Lookback (Default: 30): The period used to calculate the standard deviation of volatility.
Role: Sets the baseline for normalizing momentum. Higher values make the core smoother but slower to react.
◦ Fast Pulse Length (Default: 10): The short-term ATR period.
Role: Detects rapid volatility expansion.
◦ Slow Pulse Length (Default: 30): The long-term ATR baseline.
Role: Establishes the background volatility level. The core signal is derived from the divergence between Fast and Slow pulses.
🎯 TP/SL SETTINGS (Risk Management)
◦ SL/TP Fibonacci (Default: 0.786 / 1.618): Selects the Fibonacci ratio used for risk calculation.
◦ SL/TP Multiplier (Default: 1.5 / 2): Applies a multiplier to the ATR-based bands.
Role: Expands or contracts the Take Profit and Stop Loss boxes. Increase these values for higher volatility assets (like Altcoins) to avoid premature stop-outs.
◦ ATR Length (Default: 14): The lookback period for calculating the Average True Range used in risk geometry.
◦ Use Soft Stop (Close Basis):
Role: If enabled, Stop Loss alerts only trigger if a candle closes beyond the invalidation level. This prevents being stopped out by wick manipulations.
🔊 RIBBON SETTINGS (Momentum Visualization)
◦ Show SMA Ribbon: Toggles the visibility of the 15-layer gradient ribbon.
◦ Ribbon Line Count (Default: 15): The number of SMA lines in the ribbon array.
◦ Ribbon Start Length (Default: 2) & Step (Default: 1): Defines the spread of the ribbon.
Role: Controls the "thickness" of the momentum density visualization. A wider step creates a broader ribbon, useful for higher timeframes.
📎 DISPLAY OPTIONS
◦ Show Entry Lines / TP/SL Box / Position Labels / S/R Levels / Dashboard: Toggles individual visual elements on the chart to reduce clutter.
◦ Show SAR+MACD Glow: Enables the secondary confirmation shapes (triangles/circles) above/below candles.
📈 TREND BASELINE (Structural Filter)
◦ Supertrend Factor (Default: 12) & ATR Period (Default: 90): Controls the sensitivity of the underlying Supertrend algorithm used for the baseline calculation.
◦ WMA Length (40) & EMA Length (14): The smoothing periods for the Triple-Smoothed Baseline.
◦ Min Trend Duration (Default: 10): The minimum number of bars the trend must be established before a signal is considered valid.
🧠 SMART EXIT (Dynamic Liquidity)
◦ Use Smart Exit: Enables the momentum exhaustion logic.
◦ Exit Threshold Score (Default: 3): The sensitivity level for triggering a Smart Exit. Lower values trigger earlier exits.
◦ Average Period (168) & Min Hold Bars (5): Defines the rolling window for momentum decay analysis and the minimum duration a trade must be held before Smart Exit logic activates.
🛡️ TRAILING STOP (Step)
◦ Use Trailing Stop: Activates the step-function trailing mechanism.
◦ Step 1 Activation % (0.5) & Offset % (0.5): The price must move 0.5% in your favor to arm the first trail level, which sets a stop 0.5% behind price.
◦ Step 2 Activation % (1) & Offset % (0.2): Once price moves 1%, the trail tightens to 0.2%, securing the position.
🌀 SAR & MACD SETTINGS (Secondary Confirmation)
◦ SAR Start/Increment/Max: Standard Parabolic SAR parameters.
◦ SAR Score Scaling (ATR): Adjusts how much weight the SAR signal has in the overall confluence score.
◦ MACD Fast/Slow/Signal: Standard MACD parameters used for the "Glow" signals.
🔄 ANTI-GREED LOGIC (Behavioral Bias)
◦ Strict Entry after Win: Enables the negative feedback loop.
◦ Strict Multiplier (Default: 1.1): Increases the entry difficulty by 10% after each win.
Role: Prevents overtrading and entering at the top of an extended trend.
🌍 HTF FILTER (Multi-Timeframe)
◦ Use Auto-Adaptive HTF Filter: Automatically selects a higher timeframe (e.g., 1H -> 4H) to filter signals.
◦ Bypass HTF on Steep Trigger: Allows an entry even against the HTF trend if the local momentum slope is exceptionally steep (catch powerful reversals).
📉 RSI PEAK & CHOPPINESS
◦ RSI Peak Exit (Instant): Triggers an immediate exit if a sharp RSI pivot (V-shape) is detected.
◦ Choppiness Filter: Suppresses signals if the Choppiness Index is above the threshold (Default: 60), indicating a flat market.
📐 SLOPE TRIGGER LOGIC
◦ Force Entry on Steep Slope: Overrides other filters if the price angle is extremely vertical (high velocity).
◦ Slope Sensitivity (1.5): The angle required to trigger this override.
⛔ FLAT MARKET FILTER (ADX & ATR)
◦ Use ADX Filter: Blocks signals if ADX is below the threshold (Default: 20), indicating no trend.
◦ Use ATR Flat Filter: Blocks signals if volatility drops below a critical level (dead market).
🔔 Alert Configuration Guide
Impulse Reactor is designed with a comprehensive suite of alert conditions, allowing you to automate your trading or receive real-time notifications for specific market events.
How to Set Up:
Click the "Alert" (Clock) icon in the TradingView toolbar.
Select "Impulse Reactor " from the Condition dropdown.
Choose one of the specific trigger conditions below:
🚀 Entry Signals (Trend Initiation)
Long Entry:
Trigger: Fires when a confirmed Bullish Setup is detected (Momentum + Volatility + Structure align).
Usage: Use this to enter new Long positions.
Short Entry:
Trigger: Fires when a confirmed Bearish Setup is detected.
Usage: Use this to enter new Short positions.
🎯 Profit Taking (Target Levels)
Long TP:
Trigger: Fires when price hits the calculated Take Profit level for a Long trade.
Usage: Automate partial or full profit taking.
Short TP:
Trigger: Fires when price hits the calculated Take Profit level for a Short trade.
Usage: Automate partial or full profit taking.
🛡️ Defensive Exits (Risk Management)
Smart Exit:
Trigger: Fires when the system detects momentum decay or statistical exhaustion (even if the trend hasn't fully reversed).
Usage: Recommended for tightening stops or closing positions early to preserve gains.
Overbought / Oversold:
Trigger: Fires when the ribbon extends into extreme zones.
Usage: Warning signal to prepare for a potential reversal or pullback.
💡 Secondary Confirmation (Confluence)
SAR+MACD Bullish:
Trigger: Fires when Parabolic SAR and MACD align bullishly with the main trend.
Usage: Ideal for Pyramiding (adding to an existing winning position).
SAR+MACD Bearish:
Trigger: Fires when Parabolic SAR and MACD align bearishly.
Usage: Ideal for adding to short positions.
⚠️ Chapter 7: Conclusion & Risk Disclosure
Methodological Synthesis
Impulse Reactor represents a shift from reactive price tracking to proactive energy analysis. By decomposing market activity into its atomic components — Volatility, Momentum, and Structure — and reconstructing them into a coherent decision model, the system aims to provide a quantitative framework for market engagement. It is designed not to predict the future, but to identify high-probability conditions where kinetic energy and trend structure align.
Disclaimer & Risk Warnings
◦ Educational Purpose Only
This indicator, including all associated code, documentation, and visual outputs, is provided strictly for educational and informational purposes. It does not constitute financial advice, investment recommendations, or a solicitation to buy or sell any financial instruments.
◦ No Guarantee of Performance
Past performance is not indicative of future results. All metrics displayed on the dashboard (including "Win Rate" and "P&L") are theoretical calculations based on historical data. These figures do not account for real-world trading factors such as slippage, liquidity gaps, spread costs, or broker commissions.
◦ High-Risk Warning
Trading cryptocurrencies, futures, and leveraged financial products involves a substantial risk of loss. The use of leverage can amplify both gains and losses. Users acknowledge that they are solely responsible for their trading decisions and should conduct independent due diligence before executing any trades.
◦ Software Limitations
The software is provided "as is" without warranty. Users should be aware that market data feeds on analysis platforms may experience latency or outages, which can affect signal generation accuracy.

Direction via Zone Break [by rukich]🟠 OVERVIEW
The indicator shows the direction of movement and zones: SSL, BSL, FVG.
Zones serve as support/resistance and as validation/invalidation of a movement reversal.
🟠 COMPONENTS
The direction of movement is built based on a three-candle swing high (BSL) and swing low (SSL) pattern. If swing high (BSL) and swing low (SSL) are formed, and then an internal swing high/low is formed (depending on the direction of movement), then in case the initial movement continues — for example, in an upward movement — the new swing low (SSL) will be the minimum before the update, i.e., the internal low, while the swing high (BSL) will be formed according to the three-candle pattern.
A change of direction is considered when a candle closes beyond the key swing high/low (BSL/SSL), depending on the direction of movement. For example, in an upward movement, a break occurs when a candle closes beyond the swing low (SSL). After that, the swing high (BSL) will be the nearest fractal (swing high), and the swing low (SSL) will be formed according to the three-candle pattern.
All the above logic also applies to downward movements.
Within each movement, there can be FVG zones, which can act as support/resistance or indicate weakness in the movement direction.
Note: if the movement is upward, only bullish FVG+ will be displayed; if the movement is downward, only bearish FVG- will be displayed.
Weakness of movement direction.
For example, consider an upward impulse with the nearest FVG+ zone. If the price closes beyond the lower boundary of the zone, it will be considered invalidated (inv. FVG-), which in turn indicates weakness in the movement direction and a possible local short, which may subsequently lead to a break of the entire movement.
🟠 HOW TO USE
There are only two visual settings in the configuration:
Show previous SSL/BSL – enables/disables the display of all previous SSL/BSL zones
Show Bullish/Bearish trend – enables/disables background shading between SSL and BSL for visual understanding of the movement direction
On the chart, the following are displayed:
Labels with current SSL/BSL
FVG+- / inv. FVG+- zones, for trading in the movement direction
In case the nearest FVG is invalidated, a label will appear with the text: Weak bullish/bearish & local short/long (this is not a signal, but only indicates the probability of a potential move based on the weakness of the nearest zone)
🟠 CONCLUSION
The indicator helps determine the current movement with zones for trading in the direction, and also indicates movement weakness through invalidation of the nearest zones.

Reversal_Detector//@version=6
indicator("상승 반전 탐지기 (Reversal Detector)", overlay=true)
// ==========================================
// 1. 설정 (Inputs)
// ==========================================
rsiLen = input.int(14, title="RSI 길이")
lbR = input.int(5, title="다이버전스 확인 범위 (오른쪽)")
lbL = input.int(5, title="다이버전스 확인 범위 (왼쪽)")
rangeUpper = input.int(60, title="RSI 과매수 기준")
rangeLower = input.int(30, title="RSI 과매도 기준")
// ==========================================
// 2. RSI 상승 다이버전스 계산 (핵심 로직)
// ==========================================
osc = ta.rsi(close, rsiLen)
// 피벗 로우(Pivot Low) 찾기: 주가의 저점
plFound = na(ta.pivotlow(osc, lbL, lbR)) ? false : true
// 다이버전스 조건 확인
// 1) 현재 RSI 저점이 이전 RSI 저점보다 높아야 함 (상승)
// 2) 현재 주가 저점이 이전 주가 저점보다 낮아야 함 (하락)
showBull = false
if plFound
// 이전 피벗 지점 찾기
oscLow = osc
priceLow = low
// 과거 데이터를 탐색하여 직전 저점과 비교
for i = 1 to 60
if not na(ta.pivotlow(osc, lbL, lbR) ) // 이전에 저점이 있었다면
prevOscLow = osc
prevPriceLow = low
// 다이버전스 조건: 가격은 더 떨어졌는데(Lower Low), RSI는 올랐을 때(Higher Low)
if priceLow < prevPriceLow and oscLow > prevOscLow and oscLow < rangeLower
showBull := true
break // 하나 찾으면 루프 종료
// ==========================================
// 3. 보조 조건 (MACD 골든크로스 & 이평선)
// ==========================================
= ta.macd(close, 12, 26, 9)
macdCross = ta.crossover(macdLine, signalLine) // MACD 골든크로스
ma5 = ta.sma(close, 5)
ma20 = ta.sma(close, 20)
maCross = ta.crossover(ma5, ma20) // 5일선이 20일선 돌파
// ==========================================
// 4. 시각화 (Plotting)
// ==========================================
// 1) 상승 다이버전스 발생 시 (강력한 바닥 신호)
plotshape(showBull,
title="상승 다이버전스",
style=shape.labelup,
location=location.belowbar,
color=color.red,
textcolor=color.white,
text="Bull Div\n(바닥신호)",
size=size.small,
offset=-lbR) // 과거 시점에 표시
// 2) MACD 골든크로스 (추세 확인용)
plotshape(macdCross and macdLine < 0, // 0선 아래에서 골든크로스 날 때만
title="MACD 골든크로스",
style=shape.triangleup,
location=location.belowbar,
color=color.yellow,
size=size.tiny,
text="MACD")
// 3) 이동평균선
plot(ma5, color=color.blue, title="5일선")
plot(ma20, color=color.orange, title="20일선")
// 알림 설정
alertcondition(showBull, title="상승 다이버전스 포착", message="상승 다이버전스 발생! 추세 반전 가능성")

Pin Bar Fib Pullback + Engulfing + Pin Reversal (21 EMA + VWAP)Dear Traders
Pin bar fib pullback continuation (in 0.50–0.618 zone)
Bullish/Bearish engulfing
Pin bar reversals (bottom/top)
Then we ask: did the next candle move at least atrMult × ATR away from the signal close in the right direction?
For a long signal: next high ≥ signal close + ATR * atrMult
For a short signal: next low ≤ signal close − ATR * atrMult
If yes, that signal gets a big circle with text:
BIG ▲ for long
BIG ▼ for short
drawn on the original signal bar (using offset = -1 trick).
You can tune how “big” you want:
Increase ATR length for smoother ATR
Increase ATR * (e.g., from 1.5 → 2.0) to only mark really strong moves.
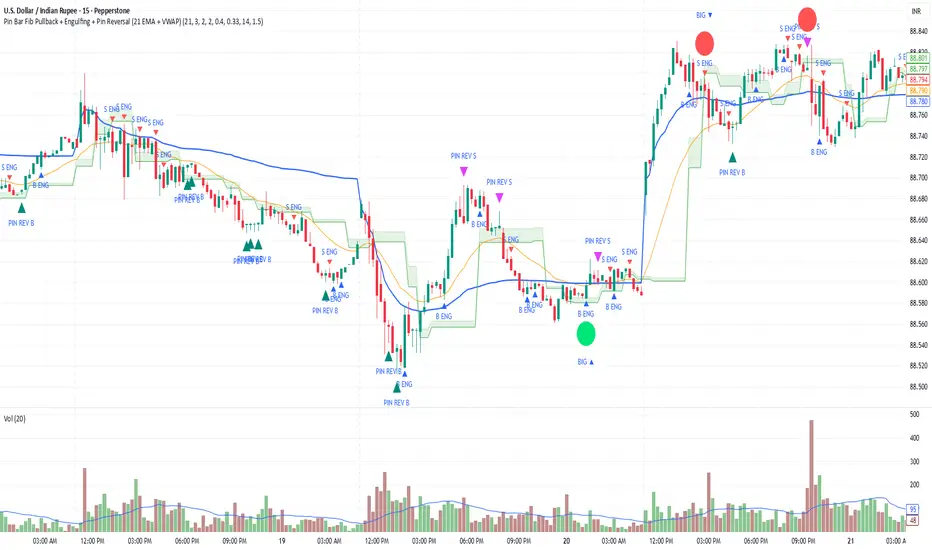
Trend Break + MSB + Fibo Zone [v1.0] dnmSure! Here’s the English translation of your text:
---
Swings are determined based on the HH/LL structure.
If the candle close breaks the swing level, the MSB (Market Structure Break) is confirmed.
After the MSB, the last swing high/low is used to calculate the Fibonacci 0.5 and 0.618 levels.
On the chart, the 0.5–0.618 range is displayed as a colored box.
A green box appears for a bullish break, and a red box appears for a bearish break.
