Turtle Strategy - Triple EMA Trend with ADX and ATRDescription
The Triple EMA Trend strategy is a directional momentum system built on the alignment of three exponential moving averages and a strong ADX confirmation filter. It is designed to capture established trends while maintaining disciplined risk management through ATR-based stops and targets.
Core Logic
The system activates only under high-trend conditions, defined by the Average Directional Index (ADX) exceeding a configurable threshold (default: 43).
A bullish setup occurs when the short-term EMA is above the mid-term EMA, which in turn is above the long-term EMA, and price trades above the fastest EMA.
A bearish setup is the mirror condition.
Execution Rules
Entry:
• Long when ADX confirms trend strength and EMA alignment is bullish.
• Short when ADX confirms trend strength and EMA alignment is bearish.
Exit:
• Stop Loss: 1.8 × ATR below (for longs) or above (for shorts) the entry price.
• Take Profit: 3.3 × ATR in the direction of the trade.
Both parameters are configurable.
Additional Features
• Start/end date inputs for controlled backtesting.
• Selective activation of long or short trades.
• Built-in commission and position sizing (percent of equity).
• Full visual representation of EMAs, ADX, stop-loss, and target levels.
This strategy emphasizes clean trend participation, strict entry qualification, and consistent reward-to-risk structure. Ideal for swing or medium-term testing across trending assets.
"take profit" için komut dosyalarını ara

Seasonality Heatmap [QuantAlgo]🟢 Overview
The Seasonality Heatmap analyzes years of historical data to reveal which months and weekdays have consistently produced gains or losses, displaying results through color-coded tables with statistical metrics like consistency scores (1-10 rating) and positive occurrence rates. By calculating average returns for each calendar month and day-of-week combination, it identifies recognizable seasonal patterns (such as which months or weekdays tend to rally versus decline) and synthesizes this into actionable buy low/sell high timing possibilities for strategic entries and exits. This helps traders and investors spot high-probability seasonal windows where assets have historically shown strength or weakness, enabling them to align positions with recurring bull and bear market patterns.
🟢 How It Works
1. Monthly Heatmap
How % Return is Calculated:
The indicator fetches monthly closing prices (or Open/High/Low based on user selection) and calculates the percentage change from the previous month:
(Current Month Price - Previous Month Price) / Previous Month Price × 100
Each cell in the heatmap represents one month's return in a specific year, creating a multi-year historical view
Colors indicate performance intensity: greener/brighter shades for higher positive returns, redder/brighter shades for larger negative returns
What Averages Mean:
The "Avg %" row displays the arithmetic mean of all historical returns for each calendar month (e.g., averaging all Januaries together, all Februaries together, etc.)
This metric identifies historically recurring patterns by showing which months have tended to rise or fall on average
Positive averages indicate months that have typically trended upward; negative averages indicate historically weaker months
Example: If April shows +18.56% average, it means April has averaged a 18.56% gain across all years analyzed
What Months Up % Mean:
Shows the percentage of historical occurrences where that month had a positive return (closed higher than the previous month)
Calculated as:
(Number of Months with Positive Returns / Total Months) × 100
Values above 50% indicate the month has been positive more often than negative; below 50% indicates more frequent negative months
Example: If October shows "64%", then 64% of all historical Octobers had positive returns
What Consistency Score Means:
A 1-10 rating that measures how predictable and stable a month's returns have been
Calculated using the coefficient of variation (standard deviation / mean) - lower variation = higher consistency
High scores (8-10, green): The month has shown relatively stable behavior with similar outcomes year-to-year
Medium scores (5-7, gray): Moderate consistency with some variability
Low scores (1-4, red): High variability with unpredictable behavior across different years
Example: A consistency score of 8/10 indicates the month has exhibited recognizable patterns with relatively low deviation
What Best Means:
Shows the highest percentage return achieved for that specific month, along with the year it occurred
Reveals the maximum observed upside and identifies outlier years with exceptional performance
Useful for understanding the range of possible outcomes beyond the average
Example: "Best: 2016: +131.90%" means the strongest January in the dataset was in 2016 with an 131.90% gain
What Worst Means:
Shows the most negative percentage return for that specific month, along with the year it occurred
Reveals maximum observed downside and helps understand the range of historical outcomes
Important for risk assessment even in months with positive averages
Example: "Worst: 2022: -26.86%" means the weakest January in the dataset was in 2022 with a 26.86% loss
2. Day-of-Week Heatmap
How % Return is Calculated:
Calculates the percentage change from the previous day's close to the current day's price (based on user's price source selection)
Returns are aggregated by day of the week within each calendar month (e.g., all Mondays in January, all Tuesdays in January, etc.)
Each cell shows the average performance for that specific day-month combination across all historical data
Formula:
(Current Day Price - Previous Day Close) / Previous Day Close × 100
What Averages Mean:
The "Avg %" row at the bottom aggregates all months together to show the overall average return for each weekday
Identifies broad weekly patterns across the entire dataset
Calculated by summing all daily returns for that weekday across all months and dividing by total observations
Example: If Monday shows +0.04%, Mondays have averaged a 0.04% change across all months in the dataset
What Days Up % Mean:
Shows the percentage of historical occurrences where that weekday had a positive return
Calculated as:
(Number of Positive Days / Total Days Observed) × 100
Values above 50% indicate the day has been positive more often than negative; below 50% indicates more frequent negative days
Example: If Fridays show "54%", then 54% of all Fridays in the dataset had positive returns
What Consistency Score Means:
A 1-10 rating measuring how stable that weekday's performance has been across different months
Based on the coefficient of variation of daily returns for that weekday across all 12 months
High scores (8-10, green): The weekday has shown relatively consistent behavior month-to-month
Medium scores (5-7, gray): Moderate consistency with some month-to-month variation
Low scores (1-4, red): High variability across months, with behavior differing significantly by calendar month
Example: A consistency score of 7/10 for Wednesdays means they have performed with moderate consistency throughout the year
What Best Means:
Shows which calendar month had the strongest average performance for that specific weekday
Identifies favorable day-month combinations based on historical data
Format shows the month abbreviation and the average return achieved
Example: "Best: Oct: +0.20%" means Mondays averaged +0.20% during October months in the dataset
What Worst Means:
Shows which calendar month had the weakest average performance for that specific weekday
Identifies historically challenging day-month combinations
Useful for understanding which month-weekday pairings have shown weaker performance
Example: "Worst: Sep: -0.35%" means Tuesdays averaged -0.35% during September months in the dataset
3. Optimal Timing Table/Summary Table
→ Best Month to BUY: Identifies the month with the lowest average return (most negative or least positive historically), representing periods where prices have historically been relatively lower
Based on the observation that buying during historically weaker months may position for subsequent recovery
Shows the month name, its average return, and color-coded performance
Example: If May shows -0.86% as "Best Month to BUY", it means May has historically averaged -0.86% in the analyzed period
→ Best Month to SELL: Identifies the month with the highest average return (most positive historically), representing periods where prices have historically been relatively higher
Based on historical strength patterns in that month
Example: If July shows +1.42% as "Best Month to SELL", it means July has historically averaged +1.42% gains
→ 2nd Best Month to BUY: The second-lowest performing month based on average returns
Provides an alternative timing option based on historical patterns
Offers flexibility for staged entries or when the primary month doesn't align with strategy
Example: Identifies the next-most favorable historical buying period
→ 2nd Best Month to SELL: The second-highest performing month based on average returns
Provides an alternative exit timing based on historical data
Useful for staged profit-taking or multiple exit opportunities
Identifies the secondary historical strength period
Note: The same logic applies to "Best Day to BUY/SELL" and "2nd Best Day to BUY/SELL" rows, which identify weekdays based on average daily performance across all months. Days with lowest averages are marked as buying opportunities (historically weaker days), while days with highest averages are marked for selling (historically stronger days).
🟢 Examples
Example 1: NVIDIA NASDAQ:NVDA - Strong May Pattern with High Consistency
Analyzing NVIDIA from 2015 onwards, the Monthly Heatmap reveals May averaging +15.84% with 82% of months being positive and a consistency score of 8/10 (green). December shows -1.69% average with only 40% of months positive and a low 1/10 consistency score (red). The Optimal Timing table identifies December as "Best Month to BUY" and May as "Best Month to SELL." A trader recognizes this high-probability May strength pattern and considers entering positions in late December when prices have historically been weaker, then taking profits in May when the seasonal tailwind typically peaks. The high consistency score in May (8/10) provides additional confidence that this pattern has been relatively stable year-over-year.
Example 2: Crypto Market Cap CRYPTOCAP:TOTALES - October Rally Pattern
An investor examining total crypto market capitalization notices September averaging -2.42% with 45% of months positive and 5/10 consistency, while October shows a dramatic shift with +16.69% average, 90% of months positive, and an exceptional 9/10 consistency score (blue). The Day-of-Week heatmap reveals Mondays averaging +0.40% with 54% positive days and 9/10 consistency (blue), while Thursdays show only +0.08% with 1/10 consistency (yellow). The investor uses this multi-layered analysis to develop a strategy: enter crypto positions on Thursdays during late September (combining the historically weak month with the less consistent weekday), then hold through October's historically strong period, considering exits on Mondays when intraweek strength has been most consistent.
Example 3: Solana BINANCE:SOLUSDT - Extreme January Seasonality
A cryptocurrency trader analyzing Solana observes an extraordinary January pattern: +59.57% average return with 60% of months positive and 8/10 consistency (teal), while May shows -9.75% average with only 33% of months positive and 6/10 consistency. August also displays strength at +59.50% average with 7/10 consistency. The Optimal Timing table confirms May as "Best Month to BUY" and January as "Best Month to SELL." The Day-of-Week data shows Sundays averaging +0.77% with 8/10 consistency (teal). The trader develops a seasonal rotation strategy: accumulate SOL positions during May weakness, hold through the historically strong January period (which has shown this extreme pattern with reasonable consistency), and specifically target Sunday exits when the weekday data shows the most recognizable strength pattern.

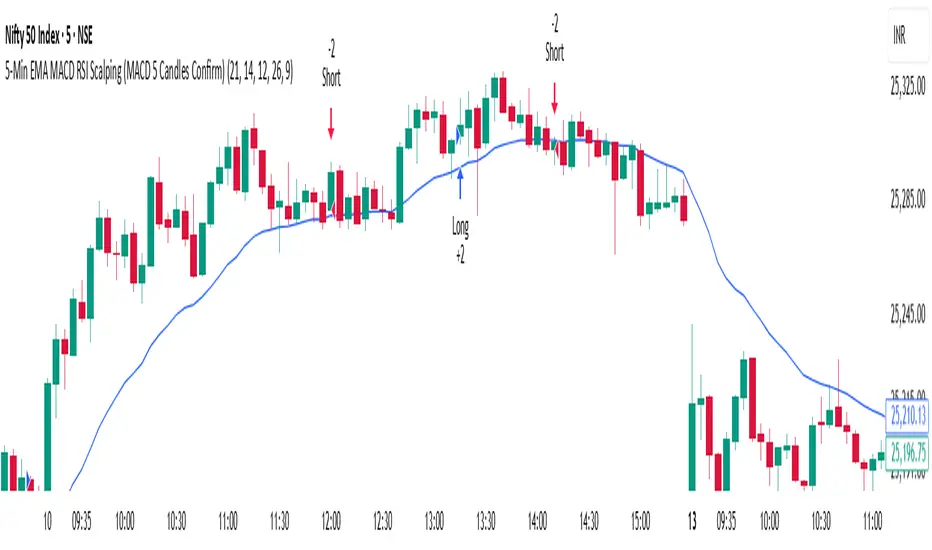
5-Min EMA MACD RSI Scalping (MACD 5 Candles Confirm) - BVK 🔹 5-Min EMA MACD RSI Scalping Strategy – Full Description
The 5-Min EMA MACD RSI Scalping Strategy is a powerful intraday trading technique designed for quick trades on lower timeframes, mainly the 5-minute chart. It combines trend confirmation (EMA), momentum analysis (MACD), and overbought/oversold signals (RSI) to capture short, high-probability price moves in both bullish and bearish markets.
⚙️ Indicators Used:
Exponential Moving Averages (EMA)
EMA 9 – Fast-moving average for entry trigger.
EMA 21 – Medium-term average for trend confirmation.
When EMA 9 crosses above EMA 21 → Bullish bias.
When EMA 9 crosses below EMA 21 → Bearish bias.
MACD (12, 26, 9)
Confirms momentum and possible entry zones.
Bullish confirmation: MACD line crosses above signal line.
Bearish confirmation: MACD line crosses below signal line.
RSI (14-period)
Filters out false signals.
Buy zone: RSI rising above 40–50.
Sell zone: RSI falling below 60–50.
Avoid trades when RSI is near 70 (overbought) or 30 (oversold).
💡 Entry Rules:
Buy Setup (Long Trade):
EMA 9 crosses above EMA 21.
MACD line crosses above signal line (positive momentum).
RSI is above 50 but below 70 (confirming strength).
Enter trade at candle close.
Sell Setup (Short Trade):
EMA 9 crosses below EMA 21.
MACD line crosses below signal line.
RSI is below 50 but above 30 (confirming weakness).
Enter trade at candle close.
🎯 Exit Rules:
Take Profit: 1.5x to 2x of risk or near the opposite EMA crossover.
Stop Loss: Below/above recent swing low/high or 0.3–0.5% away from entry.
Optional trailing stop using EMA 9 for dynamic exits.
📊 Best Timeframes & Assets:
Works best on 5-minute charts.
Suitable for Forex, Indices, Cryptocurrency, and Stocks with good liquidity.
Avoid major news events or low-volume sessions.
⚠️ Tips for Best Results:
Trade only during high-volume market sessions (e.g., London/New York overlap).
Always confirm trend direction on higher timeframes (15m or 1H).
Avoid overtrading—wait for clear signal confluence (EMA + MACD + RSI).
🧠 Strategy Summary:
“EMA gives you the trend, MACD gives you momentum, and RSI keeps you disciplined.”
This strategy is simple yet effective for traders who prefer quick in-and-out trades within minutes, offering a structured approach to scalping with reduced emotional bias.
Lucas' Money GlitchHere's a description you can use to publish your indicator to TradingView:
Title: Triple SuperTrend + RSI + Fib BB + Volume Oscillator
Short Description:
Advanced multi-indicator system combining three SuperTrends, RSI, Fibonacci Bollinger Bands, DEMA filter, and Volume Oscillator for precise trade entry and exit signals.
Full Description:
Overview
This comprehensive trading indicator combines multiple proven technical analysis tools to identify high-probability trade setups with built-in risk management through automated take profit levels.
Key Features
📊 Triple SuperTrend System
Uses three SuperTrend indicators with different ATR periods (10, 11, 12) and multipliers (1.0, 2.0, 3.0)
Requires all three SuperTrends to align before generating signals
Reduces false signals and confirms trend strength
📈 Volume Oscillator Filter
Calculates volume momentum using short and long-term moving averages
Requires volume oscillator to be above 20% threshold for trade entries
Ensures trades only occur during periods of strong volume activity
Displayed as a clean histogram in separate pane (green = bullish, red = bearish)
🎯 RSI Confirmation
7-period RSI must be above 50 for buy signals
RSI must be below 50 for sell signals
Prevents counter-trend entries
🌊 200 DEMA Trend Filter
Double Exponential Moving Average acts as major trend filter
Optional: Only buy above DEMA, only sell below DEMA
Can be toggled on/off based on trading style
📐 Fibonacci Bollinger Bands
Uses 2.618 Fibonacci multiplier (Golden Ratio)
200-period basis
Price touching bands triggers exit signals
Helps identify overextended moves
Entry Signals
BUY Signal (Green Triangle):
All three SuperTrends turn bullish simultaneously
RSI > 50
Price above 200 DEMA (if filter enabled)
Volume Oscillator > 20%
SELL Signal (Red Triangle):
All three SuperTrends turn bearish simultaneously
RSI < 50
Price below 200 DEMA (if filter enabled)
Volume Oscillator > 20%
Exit Signals
Automatic Exits Occur When:
Any of the three SuperTrends changes direction
Price touches Fibonacci Bollinger Band (upper or lower)
Take Profit target is reached (1.5x the distance from entry to ST1)
Exit Labels:
🟠 "TP" = Take Profit hit
🟡 "X" = SuperTrend change or BB touch
Visual Elements
Orange Line: Dynamic take profit level based on SuperTrend distance
Green/Red Lines: Three SuperTrend levels (varying opacity)
Purple Bands: Fibonacci Bollinger Bands with shaded area
Blue Line: 200 DEMA
Background Tint: Green when all bullish, red when all bearish
Volume Histogram: Separate pane showing volume oscillator
Dashboard Display
Real-time information table showing:
Current position status (Long/Short/Flat)
RSI value
Volume Oscillator percentage
Overall trend direction
Alert Conditions
Set up custom alerts for:
Buy signals
Sell signals
Take profit hits
Exit signals
Customizable Parameters
SuperTrend Settings:
Individual ATR periods and multipliers for each SuperTrend
Default: ST1(10,1.0), ST2(11,2.0), ST3(12,3.0)
Volume Oscillator:
Short length (default: 5)
Long length (default: 10)
Threshold percentage (default: 20%)
Toggle filter on/off
Other Filters:
RSI length (default: 7)
DEMA length (default: 200)
Fib BB length and multiplier
Take profit multiplier (default: 1.5x)
Best Use Cases
Trend following strategies
Swing trading
Day trading on higher timeframes (15min+)
Works on all markets: Stocks, Forex, Crypto, Futures
Notes
This is an indicator, not an automated strategy
Signals are for informational purposes only
Always practice proper risk management
Test on historical data before live trading
Works best in trending markets

Triple SuperTrend + RSI + Fib BBTriple SuperTrend + RSI + Fibonacci Bollinger Bands Strategy
📊 Overview
This advanced trading strategy combines the power of three SuperTrend indicators with RSI confirmation and Fibonacci Bollinger Bands to generate high-probability trade signals. The strategy is designed to capture strong trending moves while filtering out false signals through multi-indicator confluence.
🔧 Core Components
Three SuperTrend Indicators
The strategy uses three SuperTrend indicators with progressively longer periods and multipliers:
SuperTrend 1: 10-period ATR, 1.0 multiplier (fastest, most sensitive)
SuperTrend 2: 11-period ATR, 2.0 multiplier (medium sensitivity)
SuperTrend 3: 12-period ATR, 3.0 multiplier (slowest, most stable)
This layered approach ensures that all three timeframe perspectives align before generating a signal, significantly reducing false entries.
RSI Confirmation (7-period)
The Relative Strength Index acts as a momentum filter:
Long signals require RSI > 50 (bullish momentum)
Short signals require RSI < 50 (bearish momentum)
This prevents entries during weak or divergent price action.
Fibonacci Bollinger Bands (200, 2.618)
Uses a 200-period Simple Moving Average with 2.618 standard deviation bands (Fibonacci ratio). These bands serve dual purposes:
Visual representation of price extremes
Automatic exit trigger when price reaches overextended levels
📈 Entry Logic
LONG Entry (BUY Signal)
A LONG position is opened when ALL of the following conditions are met simultaneously:
All three SuperTrend indicators turn green (bullish)
RSI(7) is above 50
This is the first bar where all conditions align (no repainting)
SHORT Entry (SELL Signal)
A SHORT position is opened when ALL of the following conditions are met simultaneously:
All three SuperTrend indicators turn red (bearish)
RSI(7) is below 50
This is the first bar where all conditions align (no repainting)
🚪 Exit Logic
Positions are automatically closed when ANY of these conditions occur:
SuperTrend Color Change: Any one of the three SuperTrend indicators changes direction
Fibonacci BB Touch: Price reaches or exceeds the upper or lower Fibonacci Bollinger Band (2.618 standard deviations)
This dual-exit approach protects profits by:
Exiting quickly when trend momentum shifts (SuperTrend change)
Taking profits at statistical price extremes (Fib BB touch)
🎨 Visual Features
Signal Arrows
Green Up Arrow (BUY): Appears below the bar when long entry conditions are met
Red Down Arrow (SELL): Appears above the bar when short entry conditions are met
Yellow Down Arrow (EXIT): Appears above the bar when exit conditions are met
Background Coloring
Light Green Tint: All three SuperTrends are bullish (uptrend environment)
Light Red Tint: All three SuperTrends are bearish (downtrend environment)
SuperTrend Lines
Three colored lines plotted with varying opacity:
Solid line (ST1): Most responsive to price changes
Semi-transparent (ST2): Medium-term trend
Most transparent (ST3): Long-term trend structure
Dashboard
Real-time information panel showing:
Individual SuperTrend status (UP/DOWN)
Current RSI value and color-coded status
Current position (LONG/SHORT/FLAT)
Net Profit/Loss
⚙️ Customizable Parameters
SuperTrend Settings
ATR periods for each SuperTrend (default: 10, 11, 12)
Multipliers for each SuperTrend (default: 1.0, 2.0, 3.0)
RSI Settings
RSI length (default: 7)
RSI source (default: close)
Fibonacci Bollinger Bands
BB length (default: 200)
BB multiplier (default: 2.618)
Strategy Options
Enable/disable long trades
Enable/disable short trades
Initial capital
Position sizing
Commission settings
💡 Strategy Philosophy
This strategy is built on the principle of confluence trading - waiting for multiple independent indicators to align before taking a position. By requiring three SuperTrend indicators AND RSI confirmation, the strategy filters out the majority of low-probability setups.
The multi-timeframe SuperTrend approach ensures that short-term, medium-term, and longer-term trends are all in agreement, which typically occurs during strong, sustainable price moves.
The exit strategy is equally important, using both trend-following logic (SuperTrend changes) and mean-reversion logic (Fibonacci BB touches) to adapt to different market conditions.
📊 Best Use Cases
Trending Markets: Works best in markets with clear directional bias
Higher Timeframes: Designed for 15-minute to daily charts
Volatile Assets: SuperTrend indicators excel in assets with clear trends
Swing Trading: Hold times typically range from hours to days
⚠️ Important Notes
No Repainting: All signals are confirmed and will not change on historical bars
One Signal Per Setup: The strategy prevents duplicate signals on consecutive bars
Exit Protection: Always exits before potentially taking an opposite position
Visual Clarity: All three SuperTrend lines are visible simultaneously for transparency
🎯 Recommended Settings
While default parameters are optimized for general use, consider:
Crypto/Volatile Markets: May benefit from slightly higher multipliers
Forex: Default settings work well for major pairs
Stocks: Consider longer BB periods (250-300) for daily charts
Lower Timeframes: Reduce all periods proportionally for scalping
📝 Alerts
Built-in alert conditions for:
BUY signal triggered
SELL signal triggered
EXIT signal triggered
Set up notifications to never miss a trade opportunity!
Disclaimer: This strategy is for educational and informational purposes only. Past performance does not guarantee future results. Always backtest thoroughly and practice proper risk management before live trading.

Moon Phases Long/Short StrategyThis is an experiment of Moon Phases, likely buy when full moon and sell when new moon with few changes, like it would buy a day ahead or sometimes sell a day post these events, with Stop loss and take profits, 50% profitable so sounds good to me
Long only good for bitcoin gold, both modes(L+S) better for stocks and alt coins

Adaptive Trend Breaks Adaptive Trend Breaks
## WHAT IT DOES
This script is a modified and enhanced version of "Trendline Breakouts With Targets" concept by ChartPrime.
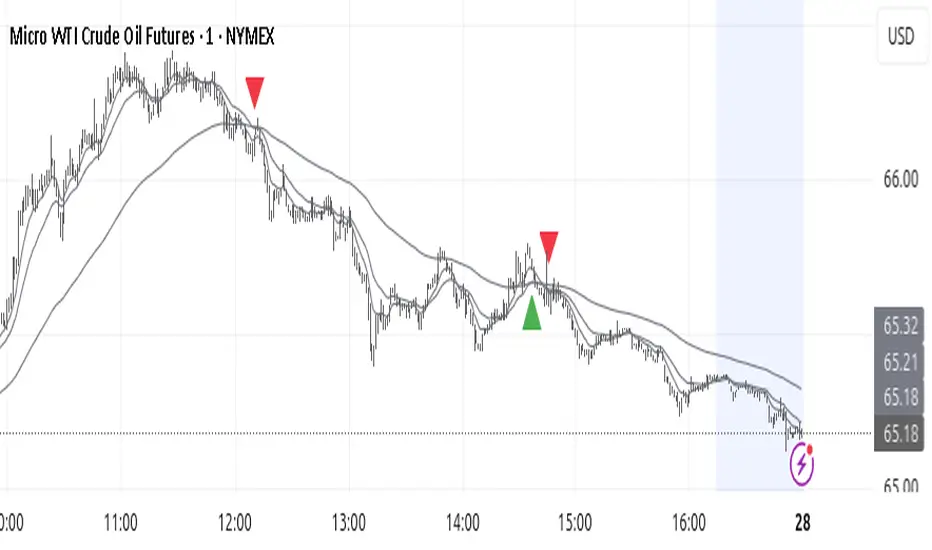
Adaptive Trend Breaks (ATB) is a trendline breakout system optimized for scalping liquid futures contracts. The indicator automatically draws dynamic support and resistance trendlines based on pivot points, then generates trade signals when price breaks through these levels with confirmation filters. It includes automated target and stop-loss placement with real-time P&L tracking in dollars.
## HOW IT WORKS
**Trendline Detection Method:**
The indicator uses pivot high/low detection to identify significant price turning points. When a new pivot forms, it calculates the slope between consecutive pivots to draw dynamic trendlines. These lines extend forward based on the established trend angle, creating actionable support and resistance zones.
**Band System:**
Around each trendline, the script creates a "band" using a volatility-adjusted calculation: `ATR(14) * 0.2 * bandwidth multiplier / 2`. This adaptive band accounts for current market conditions - wider during volatile periods, tighter during quiet markets.
**Breakout Logic:**
A breakout signal triggers when:
1. Price closes beyond the trendline + band zone
2. Volume exceeds the 20-period moving average by your set multiplier (default 1.2x)
3. Price is within Regular Trading Hours (9:30-16:00 EST) if session filter enabled
4. Current ATR meets minimum volatility threshold (prevents trading dead markets)
**Target & Stop Calculation:**
Upon breakout confirmation:
- **Entry**: Trendline breach point
- **Target**: Entry ± (bandwidth × target multiplier) - default 8x for quick scalps
- **Stop**: Entry ± (bandwidth × stop multiplier) - default 8x for 1:1 risk/reward
- Multipliers adjust automatically to market volatility through the ATR-based band
**P&L Conversion:**
The script converts point movements to dollars using:
```
Dollar P&L = (Price Points × Contract Point Value × Quantity)
```
For example, a 10-point NQ move with 2 contracts = 10 × $20 × 2 = $400
## HOW TO USE IT
**Setup:**
1. Select your instrument (NQ/ES/YM/RTY) - point values auto-configure
2. Set contract quantity for accurate dollar P&L
3. Choose pivot period (lower = more signals but more noise, default 5 for scalping)
4. Adjust bandwidth multiplier if trendlines are too tight/loose (1-5 range)
**Filters Configuration:**
- **Volume Filter**: Requires breakout volume > moving average × multiplier. Increase multiplier (1.5-2.0) for higher conviction trades
- **Session Filter**: Enable to trade only RTH. Disable for 24-hour trading
- **ATR Filter**: Prevents signals during low volatility. Increase minimum % for more active markets only
**Risk Management:**
- Set target/stop multipliers based on your risk tolerance
- 8x bandwidth = approximately 1:1 risk/reward for most liquid futures
- Enable trailing stops for trend-following approach (moves stop to protect profits)
- Adjust line length to see targets further into the future
**Statistics Table:**
- Choose timeframe to analyze: all-time, today, this week, custom days
- Monitor win rate, profit factor, and net P&L in dollars
- Track long vs short performance separately
- See real-time unrealized P&L on active trades
**Reading Signals:**
- **Green triangle below bar** = Long breakout (resistance broken)
- **Red triangle above bar** = Short breakout (support broken)
- **White dashed line** = Entry price
- **Orange line** = Take profit target with dollar value
- **Red line** = Stop loss with dollar value
- **Green checkmark (✓)** = Target hit, winning trade
- **Red X (✗)** = Stop hit, losing trade
## WHAT IT DOES NOT DO
**Limitations to Understand:**
- Does not predict future trendline formations - it reacts to breakouts after they occur
- Historical trendlines disappear after breakout (not kept on chart for clarity)
- Requires sufficient volatility - may not signal in extremely quiet markets
- Volume filter requires exchange volume data (not available on all symbols)
- Statistics are indicator-based simulations, not actual trading results
- Does not account for slippage, commissions, or order fills
## BEST PRACTICES
**Recommended Settings by Market:**
- **NQ (Nasdaq)**: Default settings work well, consider volume multiplier 1.3-1.5
- **ES (S&P 500)**: Slightly slower, try period 7-8, volume 1.2
- **YM (Dow)**: Lower volatility, reduce bandwidth to 1.5-2
- **RTY (Russell)**: Higher volatility, increase bandwidth to 3-4
**Risk Management:**
- Never risk more than 2-3% of account per trade
- Use contract quantity calculator: Max Risk $ ÷ (Stop Distance × Point Value)
- Start with 1 contract while learning the system
- Backtest your specific timeframe and instrument before live trading
**Optimization Tips:**
- Increase pivot period (7-10) for fewer but higher-quality signals
- Raise volume multiplier (1.5-2.0) in choppy markets
- Lower target/stop multipliers (5-6x) for tighter profit taking
- Use trailing stops in strong trending conditions
- Disable session filter for overnight gaps and Asia session moves
## TECHNICAL DETAILS
**Key Calculations:**
- Pivot Detection: `ta.pivothigh(high, period, period/2)` and `ta.pivotlow(low, period, period/2)`
- Slope Calculation: `(newPivot - oldPivot) / (newTime - oldTime)`
- Adaptive Band: `min(ATR(14) * 0.2, close * 0.002) * multiplier / 2`
- Breakout Confirmation: Price crosses trendline + 10% of band threshold
**Data Requirements:**
- Minimum bars in view: 500 for proper pivot calculation
- Volume data required for volume filter accuracy
- Intraday timeframes recommended (1min - 15min) for scalping
- Works on any timeframe but optimized for fast execution
**Performance Metrics:**
All statistics calculate based on indicator signals:
- Tracks every signal as a trade from entry to TP/SL
- P&L in actual contract dollar values
- Win rate = (Winning trades / Total trades) × 100
- Profit factor = Gross profit / Gross loss
- Separates long/short performance for bias analysis
## IDEAL FOR
- Futures scalpers and day traders
- Traders who prefer visual trendline breakouts
- Those wanting automated TP/SL placement
- Traders tracking performance in dollar terms
- Multiple timeframe analysis (compare 1min vs 5min signals)
## NOT SUITABLE FOR
- Swing trading (targets too close)
- Stocks/forex without modifying point values
- Extremely low timeframes (<30 seconds) - too much noise
- Markets without volume data if using volume filter
- Illiquid contracts (signals may not execute at shown prices)
---
**Settings Summary:**
- Core: Period, bandwidth, extension, trendline style
- Filters: Volume, RTH session, ATR volatility
- Risk: R:R ratio, target/stop multipliers, trailing stop
- Display: Stats table position, size, colors
- Stats: Timeframe selection (all-time to custom days)
**License:** This indicator is published open-source under Mozilla Public License 2.0. You may use and modify the code with proper attribution.
**Disclaimer:** This indicator is for educational purposes. Past performance does not guarantee future results. Always practice proper risk management and test thoroughly before live trading.
---
## CREDITS & ATTRIBUTION
This script builds upon the "Trendline Breakouts With Targets" concept by ChartPrime with significant enhancements:
**Major Improvements Added:**
- **Futures-Specific Calculations**: Automated dollar P&L conversion using actual contract point values (NQ=$20, ES=$50, YM=$5, RTY=$50)
- **Advanced Statistics Engine**: Comprehensive performance tracking with customizable timeframe analysis (today, week, month, custom ranges)
- **Multi-Layer Filtering System**: Volume confirmation, RTH session filter, and ATR volatility filter to reduce false signals
- **Professional Trade Management**: Enhanced visual trade tracking with separate TP/SL lines, dollar value labels, and optional trailing stops
- **Optimized for Scalping**: Faster pivot periods (5 vs 10), tighter bands, and reduced extension bars for quick entries
Original trendline detection methodology by ChartPrime - used with modification under Mozilla Public License 2.0.

Larry Williams Oops StrategyThis strategy is a modern take on Larry Williams’ classic Oops setup. It trades intraday while referencing daily bars to detect opening gaps and align entries with the prior day’s direction. Risk is managed with day-based stops, and—unlike the original—all positions are closed at the end of the session (or at the last bar’s close), not at a fixed profit target or the first profitable open.
Entry Rules
Long setup (bullish reversion): Today opens below yesterday’s low (down gap) and yesterday’s candle was bearish. Place a buy stop at yesterday’s low + Filter (ticks).
Short setup (bearish reversion): Today opens above yesterday’s high (up gap) and yesterday’s candle was bullish. Place a sell stop at yesterday’s high − Filter (ticks).
Longs are only taken on down-gap days; shorts only on up-gap days.
Protective Stop
If long, stop loss trails the current day’s low.
If short, stop loss trails the current day’s high.
Exit Logic
Positions are force-closed at the end of the session (in the last bar), ensuring no overnight exposure. There is no take-profit; only stop loss or end-of-day flat.
Notes
This strategy is designed for intraday charts (minutes/seconds) using daily data for gaps and prior-day direction.
Longs/shorts can be enabled or disabled independently.

MNQ TopStep 50K | Ultra Quality v3.0MNQ TopStep 50K | Ultra Quality v3.0 - Publish Summary
📊 Overview
A professional-grade trading indicator designed specifically for MNQ futures traders using TopStep funded accounts. Combines 7 technical confirmations with 5 advanced safety filters to deliver high-quality trade signals while managing drawdown risk.
🎯 Key Features
Core Signal System
7-Point Confirmation: VWAP, EMA crossovers, 15-min HTF trend, MACD, RSI, ADX, and Volume
Signal Grading: Each signal is rated A+ through D based on 7 quality factors
Quality Threshold: Adjustable minimum grade requirement (A+, A, B, C, D)
Advanced Safety Filters (Customizable)
Mean Reversion Filter - Prevents chasing extended moves beyond VWAP bands
ATR Spike Filter - Avoids trading during extreme volatility events
EMA Spacing Filter - Ensures proper trend separation (optional)
Momentum Filter - Requires consecutive directional bars (optional)
Multi-Timeframe Confirmation - Aligns with 15-min trend (optional)
TopStep Risk Management
Real-time drawdown tracking
Position sizing calculator based on remaining cushion
Daily loss limit monitoring
Consecutive loss protection
Max trades per day limiter
Visual Components
VWAP with 1σ, 2σ, 3σ bands
EMA 9/21 with cloud fill
15-min EMA 50 for HTF trend
Comprehensive metrics dashboard
Risk management panel
Filter status panel
Detailed trade labels with entry, stops, and targets
⚙️ Default Settings (Balanced for Regular Signals)
Technical Indicators
Fast EMA: 9 | Slow EMA: 21 | HTF EMA: 50 (15-min)
MACD: 10/22/9
RSI: 14 period | Thresholds: 52 (buy) / 48 (sell)
ADX: 14 period | Minimum: 20
ATR: 14 period | Stop: 2x | TP1: 2x | TP2: 3x
Volume: 1.2x average required
Session Settings
Default: 9:30 AM - 11:30 AM ET (adjustable)
Avoids first 15 minutes after market open
Customizable trading hours
Safety Filters (Default Configuration)
✅ Mean Reversion: Enabled (2.5σ max from VWAP)
✅ ATR Spike: Enabled (2.0x threshold)
❌ EMA Spacing: Disabled (can enable for quality)
❌ Momentum: Disabled (can enable for quality)
❌ MTF Confirmation: Disabled (can enable for quality)
Risk Controls
Minimum Signal Quality: C (adjustable to A+ for fewer/better signals)
Min Bars Between Signals: 10
Max Trades Per Day: 5
Stop After Consecutive Losses: 2
📈 Expected Performance
With Default Settings:
Signals per week: 10-15 trades
Estimated win rate: 55-60%
Risk-Reward: 1:2 (TP1) and 1:3 (TP2)
With Aggressive Settings (Min Quality = D, All Filters Off):
Signals per week: 20-25 trades
Estimated win rate: 50-55%
With Conservative Settings (Min Quality = A, All Filters On):
Signals per week: 3-5 trades
Estimated win rate: 65-70%
🚀 How to Use
Basic Setup:
Add indicator to MNQ 5-minute chart
Adjust TopStep account settings in inputs
Set your risk per trade percentage (default: 0.5%)
Configure trading session hours
Set minimum signal quality (Start with C for balanced results)
Signal Interpretation:
Green Triangle (BUY): Long signal - all confirmations aligned
Red Triangle (SELL): Short signal - all confirmations aligned
Label Details: Shows entry, stop loss, take profit levels, position size, and signal grade
Signal Grade: A+ = Elite (6-7 points) | A = Strong (5) | B = Good (4) | C = Fair (3)
Dashboard Monitoring:
Top Right: Technical metrics and market conditions
Top Left: Filter status (which filters are passing/blocking)
Bottom Right: TopStep risk metrics and position sizing
⚡ Customization Tips
For More Signals:
Lower "Minimum Signal Quality" to D
Decrease ADX threshold to 18-20
Lower RSI thresholds to 50/50
Reduce Volume multiplier to 1.1x
Disable additional filters
For Higher Quality (Fewer Signals):
Raise "Minimum Signal Quality" to A or A+
Increase ADX threshold to 25-30
Enable all 5 advanced filters
Tighten VWAP distance to 2.0σ
Increase momentum requirement to 3-4 bars
For TopStep Compliance:
Adjust "Max Total Drawdown" and "Daily Loss Limit" to match your account
Update "Already Used Drawdown" daily
Monitor the Risk Panel for cushion remaining
Use recommended contract sizing
🛡️ Risk Disclaimer
IMPORTANT: This indicator is for educational and informational purposes only.
Past performance does not guarantee future results
All trading involves substantial risk of loss
Use proper risk management and position sizing
Test thoroughly in paper trading before live use
The indicator does not guarantee profitable trades
Adjust settings based on your risk tolerance and trading style
Always comply with your broker's and TopStep's rules

MNQ TopStep 50K | Ultra Quality v3.0MNQ TopStep 50K | Ultra Quality v3.0 - Publish Summary📊 OverviewA professional-grade trading indicator designed specifically for MNQ futures traders using TopStep funded accounts. Combines 7 technical confirmations with 5 advanced safety filters to deliver high-quality trade signals while managing drawdown risk.🎯 Key FeaturesCore Signal System
7-Point Confirmation: VWAP, EMA crossovers, 15-min HTF trend, MACD, RSI, ADX, and Volume
Signal Grading: Each signal is rated A+ through D based on 7 quality factors
Quality Threshold: Adjustable minimum grade requirement (A+, A, B, C, D)
Advanced Safety Filters (Customizable)
Mean Reversion Filter - Prevents chasing extended moves beyond VWAP bands
ATR Spike Filter - Avoids trading during extreme volatility events
EMA Spacing Filter - Ensures proper trend separation (optional)
Momentum Filter - Requires consecutive directional bars (optional)
Multi-Timeframe Confirmation - Aligns with 15-min trend (optional)
TopStep Risk Management
Real-time drawdown tracking
Position sizing calculator based on remaining cushion
Daily loss limit monitoring
Consecutive loss protection
Max trades per day limiter
Visual Components
VWAP with 1σ, 2σ, 3σ bands
EMA 9/21 with cloud fill
15-min EMA 50 for HTF trend
Comprehensive metrics dashboard
Risk management panel
Filter status panel
Detailed trade labels with entry, stops, and targets
⚙️ Default Settings (Balanced for Regular Signals)Technical Indicators
Fast EMA: 9 | Slow EMA: 21 | HTF EMA: 50 (15-min)
MACD: 10/22/9
RSI: 14 period | Thresholds: 52 (buy) / 48 (sell)
ADX: 14 period | Minimum: 20
ATR: 14 period | Stop: 2x | TP1: 2x | TP2: 3x
Volume: 1.2x average required
Session Settings
Default: 9:30 AM - 11:30 AM ET (adjustable)
Avoids first 15 minutes after market open
Customizable trading hours
Safety Filters (Default Configuration)
✅ Mean Reversion: Enabled (2.5σ max from VWAP)
✅ ATR Spike: Enabled (2.0x threshold)
❌ EMA Spacing: Disabled (can enable for quality)
❌ Momentum: Disabled (can enable for quality)
❌ MTF Confirmation: Disabled (can enable for quality)
Risk Controls
Minimum Signal Quality: C (adjustable to A+ for fewer/better signals)
Min Bars Between Signals: 10
Max Trades Per Day: 5
Stop After Consecutive Losses: 2
📈 Expected PerformanceWith Default Settings:
Signals per week: 10-15 trades
Estimated win rate: 55-60%
Risk-Reward: 1:2 (TP1) and 1:3 (TP2)
With Aggressive Settings (Min Quality = D, All Filters Off):
Signals per week: 20-25 trades
Estimated win rate: 50-55%
With Conservative Settings (Min Quality = A, All Filters On):
Signals per week: 3-5 trades
Estimated win rate: 65-70%
🚀 How to UseBasic Setup:
Add indicator to MNQ 5-minute chart
Adjust TopStep account settings in inputs
Set your risk per trade percentage (default: 0.5%)
Configure trading session hours
Set minimum signal quality (Start with C for balanced results)
Signal Interpretation:
Green Triangle (BUY): Long signal - all confirmations aligned
Red Triangle (SELL): Short signal - all confirmations aligned
Label Details: Shows entry, stop loss, take profit levels, position size, and signal grade
Signal Grade: A+ = Elite (6-7 points) | A = Strong (5) | B = Good (4) | C = Fair (3)
Dashboard Monitoring:
Top Right: Technical metrics and market conditions
Top Left: Filter status (which filters are passing/blocking)
Bottom Right: TopStep risk metrics and position sizing
⚡ Customization TipsFor More Signals:
Lower "Minimum Signal Quality" to D
Decrease ADX threshold to 18-20
Lower RSI thresholds to 50/50
Reduce Volume multiplier to 1.1x
Disable additional filters
For Higher Quality (Fewer Signals):
Raise "Minimum Signal Quality" to A or A+
Increase ADX threshold to 25-30
Enable all 5 advanced filters
Tighten VWAP distance to 2.0σ
Increase momentum requirement to 3-4 bars
For TopStep Compliance:
Adjust "Max Total Drawdown" and "Daily Loss Limit" to match your account
Update "Already Used Drawdown" daily
Monitor the Risk Panel for cushion remaining
Use recommended contract sizing
🛡️ Risk DisclaimerIMPORTANT: This indicator is for educational and informational purposes only.
Past performance does not guarantee future results
All trading involves substantial risk of loss
Use proper risk management and position sizing
Test thoroughly in paper trading before live use
The indicator does not guarantee profitable trades
Adjust settings based on your risk tolerance and trading style
Always comply with your broker's and TopStep's rules

Alt buy signal 1H Entry + 4H Confirm (MACD + Stoch RSI + HMA)This indicator is a multi-timeframe (MTF) analysis tool designed for the ALT trading , capturing entry signals on the 1-hour (1H) timeframe and confirming trends on the 4-hour (4H) timeframe. It combines MACD, Stoch RSI, and Hull Moving Average (HMA) to identify precise buy opportunities, particularly at reversal points after a downtrend or during trend shifts. It visually marks both past and current BUY signals for easy reference.
Key Features:
1H Entry Signal (Early Ping): Triggers on a MACD golden cross (below 0) combined with a Stoch RSI oversold cross (below 20), offering an initial buy opportunity.
4H Trend Confirmation (Entry Ready): Validates the trend with a 4H MACD histogram rising (in negative territory) or a golden cross, plus a Stoch RSI turn-up (above 30).
Past BUY Display: Labels past data points where these conditions were met as "1H BUY" or "FULL BUY," facilitating backtesting.
HMA Filter: Optional HMA(16) to confirm price breakouts, enhancing trend validation.
Purpose: Ideal for short-term scalping and swing trading. Supports a two-step strategy: initial partial entry on 1H signals, followed by additional entry on 4H confirmation.
Usage Instructions
Installation: Add the indicator to an IMX/USDT 1H chart on TradingView.
Signal Interpretation:
lime "1H BUY": 1H conditions met, consider initial entry (stop-loss: 3-5% below recent low).
green "FULL BUY": 1H+4H conditions met, confirm trend for additional entry (take-profit: 10% below recent swing high).
Customization: Adjust TF (1H/4H), MACD/Stoch RSI parameters, and HMA usage via the input settings.
Alert Setup: Enable alerts for "ENTRY READY" (1H+4H) or "EARLY PING" (1H only) conditions.
Advantages
Accuracy: Reduces false signals by combining MACD golden cross below 0 with Stoch RSI oversold conditions.
Dual Confirmation: 1H for quick timing and 4H for trend validation, improving risk management.
Visualization: Past BUY points enable easy backtesting and pattern recognition.
Flexibility: 4H confirmation mode adjustable (histogram rise or golden cross).
Limitations
Timeframe Dependency: Optimized for 1H charts; may not work on other timeframes.
Market Conditions: Potential whipsaws in sideways markets; additional filters (e.g., RSI > 50) recommended.
Manual Management: Stop-loss and take-profit require user discretion.

my_strategy_2.0Overview:
This is a high-speed scalping strategy optimized for volatile crypto assets (BTC, ETH, etc.) on timeframes 1m–5m. It combines trend-following SuperTrend with confirmations from MACD, RSI, Bollinger Bands, and volume spikes for precise entries. Focus on quick profits (1–3 ATR) with strict risk control: partial take-profits, stop-loss, and trailing breakeven after the first TP.
Key Signals:
Long: SuperTrend flip up + MACD crossover up + RSI >50 + BB Upper breakout + volume spike + volatility filter (ATR >0.5%).
Short: Similar but downward.
Exits and Risks:
TP: 33% at +1 ATR, 33% at +2 ATR, 34% at +3 ATR (customizable).
SL: Initial at -1 ATR, after TP1 — to breakeven with trailing on BB midline (optional).
Filters: Minimum ATR to avoid flat markets; realistic commissions in backtests.
Recommendations:
Test on 2020–2025 data (out-of-sample 2024+). Expected Win Rate ~55%, Profit Factor >1.8, Drawdown <10%. Ideal for 1–2% risk per trade. Not for beginners — use paper trading.
Disclaimer: Past results do not guarantee future performance. Trade at your own risk.
(Pine v6 code, ready for publication. Author: gopog777 with expert fixes.)

DTM 444 BANDS 🚀DTM 444 BANDS 🚀:
The DTM 444 BANDS 🚀 is a powerful, multi-purpose trading indicator combining Supertrend, Dynamic Band Levels, Breakout Signals, and Volume Confirmation to help traders identify high-probability trade setups across different timeframes.
🔧 Key Features
✅ Multi-Timeframe Support
Analyze price action across any timeframe using the Timeframe input.
All band calculations (High, Low, Midline, and Supertrend) are pulled from a higher timeframe for clearer context.
✅ Dynamic Bands Based on Supertrend
High Band: Rolling highest of Supertrend over hiLen period.
Low Band: Rolling lowest of Supertrend over loLen period.
Midline: Midpoint of the above.
Acts like dynamic support/resistance, ideal for trend-following and breakout strategies.
✅ Dual Signal System
Breakout Signals (Buy and Sell): Triggered when price breaks the bands with volume confirmation.
Supertrend Crossover Signals (Buy1 and Sell1): Classic momentum entries with a confirmation twist.
Exit Signals: Optional take-profit/neutral indicators when price reverses.
✅ Volume Confirmation Filter (Optional)
Only triggers signals if the volume exceeds its 20-period SMA.
Helps filter out false breakouts and weak trends in low-liquidity periods.
✅ Visual Enhancements
Color-coded candles based on band positioning (e.g., red = weak, green = strong, etc.)
On-chart labels for each signal for quick reference.
Real-time Signal Dashboard using Pine Script tables showing:
Current signal
Volume filter status
Live volume vs volume SMA
🧪 Practical Use Cases
Trend Traders: Use the Supertrend cross and band breakouts to ride trends early.
Breakout Traders: Catch high-probability moves outside established ranges.
Swing Traders: Time entries and exits using color-coded bars and exit labels.
Volume-Sensitive Traders: Focus on trades with strong volume backing.
📊 Backtest Snapshot
Based on the example chart for Reliance Industries (RELIANCE.NS) on the weekly timeframe:
Several profitable buy and breakout signals during uptrends.
Timely exits and breakdown alerts before reversals.
Volume filter keeps trades clean and avoids noise.
⚙️ Customizable Parameters
High Length and Low Length (default: 19)
Supertrend Multiplier and ATR Length
Volume Filter: Toggle ON/OFF
Volume SMA Length: Default 20
Custom Timeframe: Choose any higher timeframe for multi-timeframe analysis
📢 Alerts Ready
Fully integrated with TradingView alerts:
Breakout & Breakdown
Supertrend crossovers
All alerts respect the volume filter setting
🏁 Final Thoughts
DTM 444 BANDS 🚀 is a versatile and adaptive trading system that blends trend analysis, volatility bands, and volume validation. Whether you're a trend trader, breakout hunter, or swing trader — this tool gives you a structured edge with clear visual cues and real-time alerts.

Trend TraderThe Trend Trader indicator is a trend-following tool based on a triple EMA (Exponential Moving Average) setup designed to help traders identify market direction and potential reversal zones. It plots three customizable EMAs on the chart to highlight bullish and bearish momentum, then generates trade signals when price shows a strong likelihood of continuing in the direction of the prevailing trend.
EMA Alignment: The indicator checks for bullish stacking (fast EMA above medium, medium above slow) and bearish stacking (fast EMA below medium, medium below slow). This alignment defines the prevailing market trend.
Trend Validation: A user-defined lookback period ensures signals are only taken if the market recently displayed a stacked trend, thus filtering false entries during consolidations.
Signal Generation: Buy signals appear when price dips into the zone between the fast and medium EMAs during a bullish trend. Sell signals appear when price rallies into the zone between the fast and medium EMAs during a bearish trend.
Alerts: Built-in alerts notify traders of new trade opportunities without having to constantly watch the chart.
This indicator is suitable for swing trading and intraday strategies across multiple markets, including forex, stocks, indices, and crypto.
Suggested Strategy for Profitability
This tool is best used as part of a structured trend-trading plan. Below is a suggested framework:
Entry Rules
Long (Buy Trade):
Confirm that EMA alignment is bullish (EMA1 > EMA2 > EMA3).
Wait for a Buy Signal (triangle up below price).
Ensure the higher timeframe (e.g., 4H if trading 1H) trend is also bullish to filter trades.
Short (Sell Trade):
Confirm EMA alignment is bearish (EMA1 < EMA2 < EMA3).
Wait for a Sell Signal (triangle down above price).
Higher timeframe should also be bearish to increase probability.
Stop Loss
For long positions, place the stop loss just below EMA3 or the most recent swing low.
For short positions, place the stop loss just above EMA3 or the most recent swing high.
Take Profit
Conservative: Set TP at 1.5x to 2x the stop loss distance.
Aggressive: Trail stop loss below EMA2 (for longs) or above EMA2 (for shorts) to capture larger trends.
Risk Management
Use no more than 1–2% of account risk per trade.
Trade only when the signal aligns with overall market context (higher timeframe, support/resistance, or volume confirmation).
This indicator is very similar to the indicator "Trend Scalper" by the same developer, the difference is this indicator is used to just find the trade and hold the trade or to find the reversal of a trend instead of triggering alerts every time price enters between EMA1 and EMA2.
Trader Marks Trailing SL + TP (BE @ 60%)This script provides a unique stop-loss and take-profit management tool designed for swing traders.
It introduces a two-stage stop-loss logic that is not available in standard TradingView tools:
Break-Even Protection: Once a defined profit threshold (e.g. 66%) is reached, the stop-loss automatically moves to break-even.
ATR-Based Trailing Stop: After a chosen delay (e.g. 12 hours), the script activates a dynamic trailing stop that follows market volatility using the ATR.
Flexible Ratchet Mechanism: The stop-loss can be locked at new profit levels and will never move backwards.
This combination allows traders to secure profits while still giving the trade room to develop. The indicator is especially useful for swing trading on 4H and daily timeframes but can be applied to other styles as well.
How to use:
Enter your entry price, stop-loss, and take-profit levels.
Choose your trailing mode: Exact S/L+ (simple) or Advanced (Delay + BE + Ratchet).
Adjust parameters such as ATR length or activation delay to match your strategy.
The script helps you balance risk and reward by ensuring that once the trade moves in your favor, you cannot lose the initial risk, while still benefiting from extended market moves.

Apex Edge – Wolfe Wave HunterApex Edge – Wolfe Wave Hunter
The modern Wolfe Wave, rebuilt for the algo era
This isn’t just another Wolfe Wave indicator. Classic Wolfe detection is rigid, outdated, and rarely tradable. Apex Edge – Wolfe Wave Hunter re-engineers the pattern into a modern, SMC-driven model that adapts to today’s liquidity-dominated markets. It’s not about drawing pretty shapes – it’s about extracting precision entries with asymmetric risk-to-reward potential.
🔎 What it does
Automatic Wolfe Wave Detection
Identifies bullish and bearish Wolfe Wave structures using pivot-based logic, symmetry filters, and slope tolerances.
Channel Glow Zones
Highlights the Wolfe channel and projects it forward into the future (bars are user-defined). This allows you to see the full potential of the trade before price even begins its move.
Stop Loss (SL) & Entry Arrow
At the completion of Wave 5, the algo prints a Stop Loss line and a tiny entry arrow (green for bullish, red for bearish). but the colours can be changed in user settings. This is the “execution point” — where the Wolfe setup becomes tradable.
Target Projection Lines
TP1 (EPA): Derived from the traditional 1–4 line projection.
TP2 (1.272 Fib): Optional secondary profit target.
TP3 (1.618 Fib): Optional extended target for large runners.
All TP lines extend into the future, so you can track them as price evolves.
Volume Confirmation (optional)
A relative volume filter ensures Wave 5 is formed with meaningful market participation before a setup is confirmed.
Alerts (ready out of the box)
Custom alerts can be fired whenever a bullish or bearish Wolfe Wave is confirmed. No need to babysit the charts — let the script notify you.
⚙️ Customisation & User Control
Every trader’s market and style is different. That’s why Wolfe Wave Hunter is fully customisable:
Arrow Colours & Size
Works on both light and dark charts. Choose your own bullish/bearish entry arrow colours for maximum visibility.
Tolerance Levels
Adjust symmetry and slope tolerance to refine how strict the channel rules are.
Tighter settings = fewer but cleaner zones.
Looser settings = more frequent setups, but with slightly lower structural quality.
Channel Glow Projection
Define how many bars forward the channel is drawn. This controls how far into the future your Wolfe zones are extended.
Stop Loss Line Length
Keep the SL visible without it extending infinitely across your chart.
Take Profit Line Colors
Each TP projection can be styled to your preference, allowing you to clearly separate TP1, TP2, and TP3.
This isn’t a one-size-fits-all tool. You can shape Wolfe detection logic to match the pairs, timeframes, and market conditions you trade most.
🚀 Why it’s different
Classic Wolfe waves are rare — this script adapts the model into something practical and tradeable in modern markets.
Liquidity-aligned — many setups align with structural sweeps of Wave 3 liquidity before driving into profit.
Entry built-in — most Wolfe scripts only draw the structure. Wolfe Wave Hunter gives you a precise entry point, SL, and projected TPs.
Backtest-friendly — you’ll quickly discover which assets respect Wolfe waves and which don’t, creating your own high-probability Wolfe watchlist.
⚠️ Limitations & Disclaimer
Not all markets respect Wolfe Waves. Some FX pairs, metals, and indices respect the structure beautifully; others do not. Backtest and create your own shortlist.
No guaranteed sweeps. Many entries occur after a liquidity sweep of Wave 3, but not all. The algo is designed to detect Wolfe completion, not enforce textbook liquidity rules.
Probabilistic, not predictive. Wolfe setups don’t win every time. Always use risk management.
High-RR focus. This is not a high-frequency tool. It’s designed for precision, asymmetric setups where risk is small and reward potential is large.
✅ The Bottom Line
Apex Edge – Wolfe Wave Hunter is a modern reimagination of the Wolfe Wave. It blends structural geometry, liquidity dynamics, and algo-driven execution into a single tool that:
Detects the pattern automatically
Provides SL, entry, and TP levels
Offers alerts for hands-off trading
Allows deep customisation for different markets
When it hits, it delivers outstanding risk-to-reward. Backtest, refine your tolerances, and build your watchlist of assets where Wolfe structures consistently pay.
This isn’t just Wolfe detection — it’s Wolfe trading, rebuilt for the modern trader.
Developer Notes - As always with the Apex Edge Brand, user feedback and recommendations will always be respected. Simply drop us a message with your comments and we will endeavour to address your needs in future version updates.

Estrategia Cava - IndicadorSimplified Criteria of the Cava Strategy
Below is the logic behind the Cava strategy, broken down into conditions for a buy operation:
Variables and Necessary Data
EMA 55: 55-period Exponential Moving Average.
MACD: Two lines (MACD Line and Signal Line) and the histogram.
RSI: Relative Strength Index.
Stochastic: Two lines (%K and %D).
Closing Price: The closing price of the current period.
Previous Closing Price: The closing price of the previous period.
Entry Logic (Buy Operation)
Trend Condition (EMA 55):
The price must be above the EMA 55.
The EMA 55 must have a positive slope (or at least not a negative one). This can be checked if the current EMA 55 is greater than the previous period's EMA 55.
Momentum Conditions (Oscillators):
MACD: The MACD line must have crossed above the signal line. For a strong signal, this cross should occur near or above the zero line.
RSI: The RSI must have exited the "oversold" zone (generally below 30) and be rising.
Stochastic: The Stochastic must have crossed upwards from the "oversold" zone (generally below 20).
Confirmation Condition (Price):
The current closing price must be higher than the previous closing price. This confirms the strength of the signal.
Position Management (Exit)
Take Profit: An exit can be programmed at a predetermined price target (e.g., the next resistance level) or when the momentum of the move begins to decrease.
Stop Loss: A stop loss should be placed below a significant support level or the entry point to limit losses in case the trade does not evolve as expected. The Cava strategy focuses on dynamic stop-loss management, moving it in the trader's favor as the price moves.
In summary, the strategy is a filtering system. If all conditions are met, the trade is considered high probability. If only some are met, the signal is discarded, and you wait for the next one. It's crucial to understand that discipline and risk management are just as important as the indicators themselves.

SMA Cross 5/50 with Trend Filter & Risk Management by JuggiDThe basic SMA (5/50) crossover strategy can be enhanced to improve profitability by adding filters and risk management. For example, a long entry is triggered only when the fast SMA (5) crosses above the slow SMA (50) **and** the price is above the SMA (200), ensuring trades align with the major trend. Similarly, a short entry requires the crossover confirmation plus the price staying below the SMA (200). To reduce false signals and protect capital, stop-loss and take-profit levels can be set automatically (e.g., 2% loss, 5% gain), while additional confirmation tools such as volume spikes, RSI above 50, or MACD momentum can be applied to validate stronger signals. This approach helps avoid whipsaws in sideways markets and allows trades to capture larger moves while minimizing downside risk.

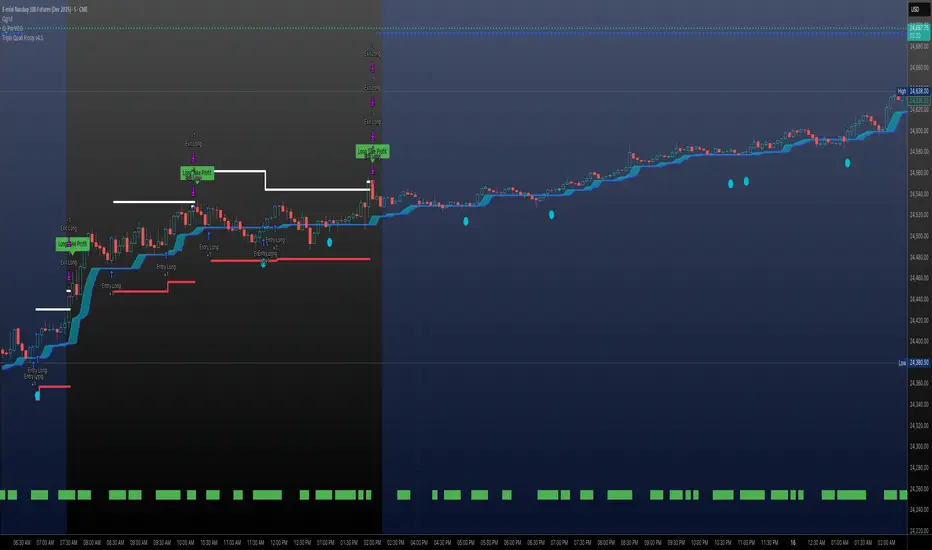
Triple Quad Frosty v4.5Triple Quad Frosty v4.5 is a Renko-friendly strategy that lets you trade from up to four signal sources per side. Orders are only placed when your chosen conditional filters (A/B/C) agree, giving you full control over when entries are valid. You decide how signals must line up — from simple single-source triggers to majority or full agreement across all four.
Renko-based, with customizable static stops, take profits, and trailing stops. Time/day filters, daily trade limits, and forced closures let you restrict trading to specific windows.
The HTF filters in Triple Quad Frosty v4.5 use a higher-timeframe Hull Moving Average (HMA) to confirm trend direction, while slope and distance settings on the local HMA help filter out weak or choppy setups. Longs only trigger when price is above the HTF HMA and meets slope/distance requirements, and shorts only when the opposite is true.
Color-coded labels mark each exit as a win or loss, with reversal trades labeled separately for clarity. Conditional bars plotted above and below the chart show when the A/B/C filters align on a long or short bias, giving clear visual confirmation of entry conditions. Stop loss and take profit levels are plotted directly on the chart with guide lines, so you can easily track active trade management in real time.
Gann Trading Strategy📈 Simple & Powerful Gann-Based Trading System
This indicator automatically calculates key Gann support and resistance levels based on W.D. Gann's mathematical principles. Simply input either the highest price (for bearish setups) or lowest price (for bullish setups), and the indicator automatically generates all trading levels.
🎯 Key Features:
Automatic Level Calculation - Just select High/Low price projection basis
Complete Trading Framework - Entry zone, 3 Take Profit levels, and Exit level
Visual Trading Zones - Color-coded zones around each level for better entry/exit timing
Smart Alerts - Get notified when price reaches key levels
Bullish & Bearish Setups - Works for both long and short trading strategies
Customizable Display - Show/hide levels, adjust colors, line styles, and zone widths
🚀 How to Use:
Select "Lowest Price" for bullish setup or "Highest Price" for bearish setup
Input the relevant high or low price from your analysis
The indicator automatically calculates and displays all trading levels
Use the green entry zone for entries, blue levels for take profits, red level for exits
📊 Perfect for:
Swing trading
Position sizing and risk management
Support/resistance analysis
Multi-timeframe analysis
Uses time-tested Gann principles to automatically find key price levels for trading.

Wickless Heikin Ashi B/S [CHE]Wickless Heikin Ashi B/S \
Purpose.
Wickless Heikin Ashi B/S \ is built to surface only the cleanest momentum turns: it prints a Buy (B) when a bullish Heikin-Ashi candle forms with virtually no lower wick, and a Sell (S) when a bearish Heikin-Ashi candle forms with no upper wick. Optional Lock mode turns these into one-shot signals that hold the regime (bull or bear) until the opposite side appears. The tool can also project dashed horizontal lines from each signal’s price level to help you manage entries, stops, and partial take-profits visually.
How it works.
The indicator computes standard Heikin-Ashi values from your chart’s OHLC. A bar qualifies as bullish if its HA close is at or above its HA open; bearish if below. Then the wick on the relevant side is compared to the bar’s HA range. If that wick is smaller than your selected percentage threshold (plus a tiny tick epsilon to avoid rounding noise), the raw condition is considered “wickless.” Only one side can fire; on the rare occasion both raw conditions would overlap, the bar is ignored to prevent false dual triggers. When Lock is enabled, the first valid signal sets the active regime (background shaded light green for bull, light red for bear) and suppresses further same-side triggers until the opposite side appears, which helps reduce overtrading in chop.
Why wickless?
A missing wick on the “wrong” side of a Heikin-Ashi candle is a strong hint of persistent directional pressure. In practice, this filters out hesitation bars and many mid-bar flips. Traders who prefer entering only when momentum is decisive will find wickless bars useful for timing entries within an established bias.
Visuals you get.
When a valid buy appears, a small triangle “B” is plotted below the bar and a green dashed line can extend to the right from the signal’s HA open price. For sells, a triangle “S” above the bar and a red dashed line do the same. These lines act like immediate, price-anchored references for stop placement and profit scaling; you can shift the anchor left by a chosen number of bars if you prefer the line to start a little earlier for visual alignment.
How to trade it
Establish context first.
Pick a timeframe that matches your style: intraday index or crypto traders often use 5–60 minutes; swing traders might prefer 2–4 hours or daily. The tool is agnostic, but the cleanest results occur when the market is already trending or attempting a fresh breakout.
Entry.
When a B prints, the simplest rule is to enter long at or just after bar close. A conservative variation is to require price to take out the high of the signal bar in the next bar(s). For S, invert the logic: enter short on or after close, or only if price breaks the signal bar’s low.
Stop-loss.
Place the stop beyond the opposite extreme of the signal HA bar (for B: under the HA low; for S: above the HA high). If you prefer a static reference, use the dashed line level (signal HA open) or an ATR buffer (e.g., 1.0–1.5× ATR(14)). The goal is to give the trade enough room that normal noise does not immediately knock you out, while staying small enough to keep the risk contained.
Take-profit and management.
Two pragmatic approaches work well:
R-multiple scaling. Define your initial risk (distance from entry to stop). Scale out at 1R, 2R, and let a runner go toward 3R+ if structure holds.
Trailing logic. Trail behind a short moving average (e.g., EMA 20) or progressive swing points. Many traders also exit on the opposite signal when Lock flips, especially on faster timeframes.
Position sizing.
Keep risk per trade modest and consistent (e.g., 0.25–1% of account). The indicator improves timing; it does not replace risk control.
Settings guidance
Max lower wick for Bull (%) / Max upper wick for Bear (%).
These control how strict “wickless” must be. Tighter values (0.3–1.0%) yield fewer but cleaner signals and are great for strong trends or low-noise instruments. Looser values (1.5–3.0%) catch more setups in volatile markets but admit more noise. If you notice too many borderline bars triggering during high-volatility sessions, increase these thresholds slightly.
Lock (one-shot until opposite).
Keep Lock ON when you want one decisive signal per leg, reducing noise and signal clusters. Turn it OFF only if your plan intentionally scales into trends with multiple entries.
Extended lines & anchor offset.
Leave lines ON to maintain a visual memory of the last trigger levels. These often behave like near-term support/resistance. The offset simply lets you start that line one or more bars earlier if you prefer the look; it does not change the math.
Colors.
Use distinct bull/bear line colors you can read easily on your theme. The default lime/red scheme is chosen for clarity.
Practical examples
Momentum continuation (long).
Price is above your baseline (e.g., EMA 200). A B prints with a tight lower wick filter. Enter on close; stop under the signal HA low. Price pushes up in the next bars; you scale at 1R, trail the rest with EMA 20, and finally exit when a distant S appears or your trail is hit.
Breakout confirmation (short).
Following a range, price breaks down and prints an S with no upper wick. Enter short as the bar closes or on a subsequent break of the signal bar’s low. If the next bar immediately rejects and prints a bullish HA bar, your stop above the signal HA high limits damage. Otherwise, ride the move, harvesting partials as the red dashed line remains unviolated.
Alerts and automation
Set alerts to “Once Per Bar Close” for stability.
Bull ONE-SHOT fires when a valid buy prints (and Lock allows it).
Bear ONE-SHOT fires for sells analogously.
With Lock enabled, you avoid multiple pings in the same direction during a single leg—useful for webhooks or mobile notifications.
Reliability and limitations
The script calculates from completed bars and does not use higher-timeframe look-ahead or repainting tricks. Heikin-Ashi smoothing can lag turns slightly, which is expected and part of the design. In narrow ranges or whipsaw conditions, signals naturally thin out; if you must trade ranges, either tighten the wick filters and keep Lock ON, or add a trend/volatility filter (e.g., trade B only above EMA 200; S only below). Remember: this is an indicator, not a strategy. If you want exact statistics, port the triggers into a strategy and backtest with your chosen entry, stop, and exit rules.
Final notes
Wickless Heikin Ashi B/S \ is a precision timing tool: it waits for decisive, wickless HA bars, provides optional regime locking to reduce noise, and leaves clear price anchors on your chart for disciplined management. Use it with a simple framework—trend bias, fixed risk, and a straightforward exit plan—and it will keep your execution consistent without cluttering the screen or your decision-making.
Disclaimer: This indicator is for educational use and trade assistance only. It is not financial advice. You alone are responsible for your risk and results.
Enhance your trading precision and confidence with Wickless Heikin Ashi B/S ! 🚀
Happy trading
Chervolino

Nirvana True Duel전략 이름
열반의 진검승부 (영문: Nirvana True Duel)
컨셉과 철학
“열반의 진검승부”는 시장 소음은 무시하고, 확실할 때만 진입하는 전략입니다.
EMA 리본으로 추세 방향을 확인하고, 볼린저 밴드 수축/확장으로 변동성 돌파를 포착하며, OBV로 거래량 확인을 통해 가짜 돌파를 필터링합니다.
전략 로직
매수 조건 (롱)
20EMA > 50EMA (상승 추세)
밴드폭 수축 후 확장 시작
종가가 상단 밴드 돌파
OBV 상승 흐름 유지
매도 조건 (숏)
20EMA < 50EMA (하락 추세)
밴드폭 수축 후 확장 시작
종가가 하단 밴드 이탈
OBV 하락 흐름 유지
진입·청산
손절: ATR × 1.5 배수
익절: 손절폭의 1.5~2배에서 부분 청산
시간 청산: 설정한 최대 보유 봉수 초과 시 강제 청산
장점
✅ 추세·변동성·거래량 3중 필터 → 노이즈 최소화
✅ 백테스트·알람 지원 → 기계적 매매 가능
✅ 5분/15분 차트에 적합 → 단타/스윙 트레이딩 활용 가능
주의점
⚠ 횡보장에서는 신호가 적거나 실패 가능
⚠ 수수료·슬리피지 고려 필요
📜 Nirvana True Duel — Strategy Description (English)
Name:
Nirvana True Duel (a.k.a. Nirvana Cross)
Concept & Philosophy
The “Nirvana True Duel” strategy focuses on trading only meaningful breakouts and avoiding unnecessary noise.
Nirvana: A calm, patient state — waiting for the right opportunity without emotional trading.
True Duel: When the signal appears, enter decisively and let the market reveal the outcome.
In short: “Ignore market noise, trade only high-probability breakouts.”
🧩 Strategy Components
Trend Filter (EMA Ribbon): Stay aligned with the main market trend.
Volatility Squeeze (Bollinger Band): Detect volatility contraction & expansion to catch explosive moves early.
Volume Confirmation (OBV): Filter out false breakouts by confirming with volume flow.
⚔️ Entry & Exit Conditions
Long Setup:
20 EMA > 50 EMA (uptrend)
BB width breaks out from recent squeeze
Close > Upper Bollinger Band
OBV shows positive flow
Short Setup:
20 EMA < 50 EMA (downtrend)
BB width breaks out from recent squeeze
Close < Lower Bollinger Band
OBV shows negative flow
Risk Management:
Stop Loss: ATR × 1.5 below/above entry
Take Profit: 1.5–2× stop distance, partial take-profit allowed
Time Stop: Automatically closes after max bars held (e.g. 8h on 5m chart)
✅ Strengths
Triple Filtering: Trend + Volatility + Volume → fewer false signals
Mechanical & Backtestable: Ideal for objective trading & performance validation
Adaptable: Works well on Bitcoin, Nasdaq futures, and other high-volatility markets (5m/15m)
⚠️ Things to Note
Low signal frequency or higher failure rate in sideways/range markets
Commission & slippage should be factored in, especially on lower timeframes
ATR multiplier and R:R ratio should be optimized per asset

RSI MA Cross + Divergence Signal (V2) Core Logic
RSI + Moving Average
The script calculates a standard RSI (default 14).
It then overlays a moving average (SMA/EMA/WMA, default 9).
When RSI crosses above its MA → bullish momentum.
When RSI crosses below its MA → bearish momentum.
Divergence Filter
Signals are only valid if there’s confirmed divergence:
Bullish divergence: Price makes a lower low, RSI makes a higher low.
Bearish divergence: Price makes a higher high, RSI makes a lower high.
Overbought / Oversold Filter
Optional extra:
Bullish signals only valid if RSI ≤ 30 (oversold).
Bearish signals only valid if RSI ≥ 70 (overbought).
This ensures signals happen in “stretched” conditions.
Risk & Trade Management
Entries taken only when all conditions align.
Exits can be managed with ATR stops, partial take-profits, breakeven moves, and trailing stops (we coded these in the strategy version).
Cooldown, session filters, and daily loss guard to keep risk tight.
🔹 Strengths
✅ High selectivity: Combining RSI cross + divergence + OB/OS means signals are rare but higher quality.
✅ Great at catching reversals: Divergence highlights where price may be running out of steam.
✅ Risk management baked in: ATR stops + partial exits smooth out equity curve.
✅ Works across markets: ES, FX, crypto — anywhere RSI divergences are respected.
✅ Flexible: You can loosen/tighten filters depending on aggressiveness.
🔹 Weaknesses
❌ Lag from pivots: Divergence only confirms after a few bars → you enter late sometimes.
❌ Choppy in ranges: In sideways markets, RSI divergences appear often and whipsaw.
❌ Filters reduce signals: With all filters ON (divergence + OB/OS + trend + session), signals can be very rare — may under-trade.
❌ Not standalone: Needs higher-timeframe context (trend, liquidity pools) to avoid counter-trend entries.
🔹 Best Ways to Trade It
Use Higher Timeframe Bias
Run the strategy on 15m/1H, but only trade in direction of higher timeframe trend (e.g., 4H EMA).
Example: If daily is bullish → only take bullish divergences.
Pair With Structure
Look for signals at key zones: HTF support/resistance, VWAP, or FVGs.
Divergence + RSI cross inside an FVG is a strong entry trigger.
Adjust OB/OS for Volatility
For crypto/FX: use 35/65 instead of 30/70 (markets trend harder).
For ES/S&P: 30/70 works fine.
Risk Management Is King
Use partial exits: take profit at 1R, trail rest.
Size by % of equity (we coded this into the strategy).
Avoid News Spikes
Divergences break down around CPI, NFP, Fed announcements — stay flat.
🔹 When It Shines
Trending markets that make extended pushes → clean divergences.
Reversal zones (oversold → bullish bounce, overbought → bearish fade).
Swing trading (15m–4H) — less noise than 1m/5m scalping.
🔹 When to Avoid
Low volatility chop → lots of false divergences.
During high-impact news → RSI swings wildly.
In strong one-way trends without pullbacks — divergence keeps calling tops/bottoms too early.
✅ Summary:
This is a reversal-focused RSI divergence strategy with strict filters. It’s powerful when combined with higher-timeframe bias + structure confluence, but weak if traded blindly in choppy or news-driven conditions. Best to treat it as a precision entry trigger, not a full system — layer it on top of your FVG/ORB framework for maximum edge.
