Peak Valley Estimation StrategyIntroduction
Its the first strategy that i post here, so don't expect ground breaking stuff, when testing my indicators i always used prorealtime and not tradingview. This strategy use signals generated by the peak/valley estimator indicator i posted long ago, i think the signals generated where sometimes quite accurate in some markets thus providing potential material for a profitable strategy.
The indicator use 3 parameters, therefore the optimisation process is not easy, but i selected what i judged good parameters values at first glance. The strategy is in its more simple form without stop or anything, the detection of peaks and valley can allow for tighter stops since we expect the price to reverse, but take into account that sops and take profits are parameters subject to optimization process except if selected with strict money management rules and not profit optimization.
Of course trading the strategy in this form is far from being great, if we take into account the market non stationarity then we might expect loss during trending markets. Trend strength indicators could help switch from a reversal to breakout strategy thus maybe providing more control.
I really hope you find an use for the strategy.
Notes
Its been three long years since i started tradingview, and i put more efforts in my indicators than in my studies and life overall, this have created complicated situations and i can't afford to follow up with this, therefore i announce that in the end of june i will leave tradingview for quite a long time, at least until i have my degree. I announce it in advance in case some of you want helps of any kind. I will post all the indicators, both in progress and finished i have made during those three years. I hope you can all understand.
Thanks for reading !
Komut dosyalarını "take profit" için ara

makeTPSo this model try to use the the take profit issue as important
the model is based on the early model that I put in last publication , the problem is that the fire point of the buy and sell has a delay and shoot some bars after (its not repaint but a bug due to TV code) . but once it stay it will calculate correctly the take profits . so I add take profit 1 and take profit 2 to the script . and since take profit 1 is correct without delay I add option to use it as buy again or short again . you can the older entry point which is H= high or L =low as your initial buy point but be aware that it sometime shoot too late since the problem in TV script to transfer the price correctly .or to enter to buy again option which is based on take profit 1 . the H and L are correctly detecting most of the time the Highs and the lows so by going on the trend them you can use the TP which are by % to max out your gains .. this is the theory behind this model
see here on amazon the concept

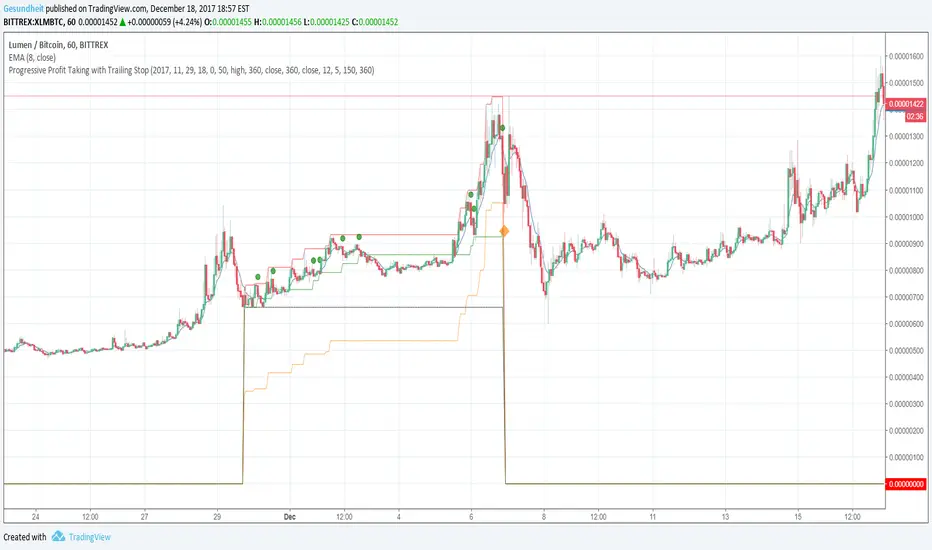
Progressive Profit Taking with Trailing StopThis is version 2 of
Special features:
Added partial profit taking as price rises. Profit taking is triggered by price crossing an EMA.
After profit taking, price has to rise by a user-specified percent before taking profits again.
Also includes condition for fully closing position after meeting specified profit target.
To incorporate into your algo, turn the plotshape functions into alertcondition.
Golden Cross, SMA 200 Moving Average Strategy (by ChartArt)This famous moving average strategy is very easy to follow to decide when to buy (go long) and when to take profit.
The strategy goes long when the faster SMA 50 (the simple moving average of the last 50 bars) crosses above the slower SMA 200. Orders are closed when the SMA 50 crosses below the SMA 200. This simple strategy does not have any other stop loss or take profit money management logic. The strategy does not short and goes long only!
Here is an article explaining the "golden cross" strategy in more detail:
www.stockopedia.com
On the S&P 500 index (symbol "SPX") this strategy worked on the daily chart 81% since price data is available since 1982. And on the DOW Jones Industrial Average (symbol "DOWI") this strategy worked on the daily chart 55% since price data is available since 1916. The low number of trades is in both cases not statistically significant though.
All trading involves high risk; past performance is not necessarily indicative of future results. Hypothetical or simulated performance results have certain inherent limitations. Unlike an actual performance record, simulated results do not represent actual trading. Also, since the trades have not actually been executed, the results may have under- or over-compensated for the impact, if any, of certain market factors, such as lack of liquidity. Simulated trading programs in general are also subject to the fact that they are designed with the benefit of hindsight. No representation is being made that any account will or is likely to achieve profits or losses similar to those shown.

Elder's Market Thermometer [LazyBear]Market temperature, introduced by Dr.Alexander Elder, helps differentiate between sleepy, quiet and hot market periods.
Following is Mr.Elder's explanation on how to use this indicator (from his book "Come in to my Trading Room"):
"When markets are quiet, the adjacent bars tend to overlap. The consensus of value is well established, and the crowd does little buying or selling outside of yesterday’s range. When highs and lows exceed their previous day’s values, they do so only by small margins. Market Thermometer falls and its EMA slants down, indicating a sleepy market. When a market begins to run, either up or down, its daily bars start pushing outside of the previous ranges. The histogram of Market Thermometer grows taller and crosses above its EMA, which soon turns up, confirming the new trend."
"Market Thermometer gives four trading signals, based on the relationship between its histogram and its moving average:
1) The best time to enter new positions is when Market Thermometer falls below its moving average. When Market Thermometer falls below its EMA, it indicates that the market is quiet. If your system flashes an entry signal, try to enter when the market is cooler than usual. When Market Thermometer rises above its moving average, it warns that the market is hot and slippage more likely.
2) Exit positions when Market Thermometer rises to triple the height of its moving average. A spike of Market Thermometer indicates a runaway move. When the crowd feels jarred by a sudden piece of news and surges, it is a good time to take profits. Panics tend to be short-lived, offering a brief opportunity to cash in. If the EMA of Market Thermometer stands at 5 cents, but the Thermometer itself shoots up to 15 cents, take profits. Test these values for the market you are trading.
3) Get ready for an explosive move if the Thermometer stays below its moving average for five to seven trading days. Quiet markets put amateurs to sleep. They become careless and stop watching prices. Volatility and volume fall, and professionals get a chance to run away with the market. Explosive moves often erupt from periods of inactivity.
4) Market Thermometer can help you set a profit target for the next trading day. If you are a short-term trader and are long, add the value of today’s Thermometer EMA to yesterday’s high and place a sell order there. If you are short, subtract the value of the Thermometer’s EMA from yesterday’s low and place an order to cover at that level."
You can configure the "Explosive Move threshold" (default: 3), "Idle Market Threshold" (default: 7) and "Thermometer EMA length" (default: 22) via Options page.
More info:
"Come in to my Trading Room - A complete Guide to Trading" by Dr.Alexander Elder. (Page 162)
List of my other indicators:
- Chart:
- GDoc: docs.google.com

BTC Dominance Zones (For Altseason)Overview
The "BTC Dominance Zones (For Altseason)" indicator is a visual tool designed to help traders navigate the different phases of the altcoin market cycle by tracking Bitcoin Dominance (BTC.D).
It provides clear, color-coded zones directly on the BTC.D chart, offering an intuitive roadmap for the progression of alt season.
Purpose & Problem Solved
Many traders often miss altcoin rotations or get caught at market tops due to emotional decision-making or a lack of a clear framework. This indicator aims to solve that problem by providing an objective, historically informed guide based on Bitcoin Dominance, helping users to prepare before the market makes its decisive moves. It distils complex market dynamics into easily digestible sections.
Key Features & Components
Color-Coded Horizontal Zones: The indicator draws fixed horizontal bands on the BTC.D chart, each representing a distinct phase of the altcoin market cycle.
Descriptive Labels: Each zone is clearly labeled with its strategic meaning (e.g., "Alts are dead," "Danger Zone") and the corresponding BTC.D percentage range, positioned to the right of the price action for clarity.
Consistent Aesthetics: All text within the labels is rendered in white for optimal visibility across the colored zones.
Symbol Restriction: The indicator includes an automatic check to ensure it only draws its visuals when applied specifically to the CRYPTOCAP:BTC.D chart. If applied to another chart, it displays a helpful message and remains invisible to prevent confusion.
Methodology & Interpretation
The indicator's methodology is based on the historical behavior of Bitcoin Dominance during various market cycles, particularly the 2021 bull run. Each zone provides a specific interpretation for altcoin strategy:
Grey Zone (BTC.D 60-70%+): "Alts Are Dead"
Interpretation: When Bitcoin Dominance is in this grey zone (typically above 60%), Bitcoin is king, and capital remains concentrated in BTC. This indicates that alt season is largely inactive or "dead". This phase is generally not conducive for aggressive altcoin trading.
Blue Zone (BTC.D 55-60%): "Alt Season Loading"
Interpretation: As BTC.D drops into this blue zone (below 60%), it signals that the market is "heating up" for altcoins. This is the time to start planning and executing your initial positions in high-conviction large-cap and strong narrative plays, as capital begins to look for more risk.
Green Zone (BTC.D 50-55%): "Alt Season Underway"
Interpretation: Entering this green zone (below 55%) signifies that "real momentum" is building, and alt season is genuinely "underway". Money is actively flowing from Ethereum into large and mid-cap altcoins. If you've positioned correctly, your portfolio should be showing strong gains in this phase.
Orange Zone (BTC.D 45-50%): "Alt Season Ending"
Interpretation: As BTC.D dips into this orange zone (below 50%), it suggests that altcoin dominance is reaching its peak, indicating the "ending" phase of alt season. While euphoria might be high, this is a critical warning zone to prepare for profit-taking, as it's a phase of "peak risk".
Red Zone (BTC.D Below 45%): "Danger Zone - Alts Overheated"
Interpretation: This red zone (below 45%) is the most critical "DANGER ZONE". It historically marks the point of maximum froth and risk, where altcoins are overheated. This is the decisive signal to aggressively take profits, de-risk, and exit positions to preserve your capital before a potential sharp correction. Historically, dominance has gone as low as 39-40% in this phase.
How to Use
Open TradingView and search for the BTC.D symbol to load the Bitcoin Dominance chart and view the indicator.
Double click the indicator to access settings.
Inputs/Settings
The indicator's zone boundaries are set to historically relevant levels for consistency with the Alt Season Blueprint strategy. However, the colors of each zone are fully customizable through the indicator's settings, allowing users to personalize the visual appearance to their preference. You can access these color options in the indicator's "Settings" menu once it's added to your chart.
Disclaimer
This indicator is provided for informational and educational purposes only. It is not financial advice. Trading cryptocurrencies involves substantial risk of loss and is not suitable for every investor. Past performance is not indicative of future results. Always conduct your own research and consult with a qualified financial professional before making any investment decisions.
About the Author
This indicator was developed by Nick from Lab of Crypto.
Release Notes
v1.0 (June 2025): Initial release featuring color-coded horizontal BTC.D zones with descriptive labels, based on Alt Season Blueprint strategy. Includes symbol restriction for correct chart application and consistent white text.

MTF strategy with (CE, TT, Bernoulli,DMF,RSI filters)Strategy Overview
The strategy designed to be highly customizable, allowing users to select and configure different components.
Key Components:
1. Entry Signal Source
You can choose between two primary signal generators:
Chandelier Exit: A volatility-based indicator that provides buy/sell signals when the price moves a certain multiple of the Average True Range (ATR) away from a high or low.
Configurable parameters: ATR Period, ATR Multiplier, and whether to use the Close price for extremums.
Trend Trader: This appears to be a custom combination of MACD and ADX. It generates buy/sell signals based on MACD crossovers when the ADX is above a certain threshold (25, indicating a trending market).
Configurable parameters: Fast Length, Slow Length, Signal Smoothing (for MACD), ADX Length, and DI Length.
2. Take Profit (TP) Settings
The strategy offers flexible Take Profit options:
Enable/Disable: You can choose whether to use Take Profit at all.
Method:
Percentage: Closes the trade when a specified percentage profit is reached.
Risk/Reward Ratio: Calculates the Take Profit level based on a multiple of the initial Stop Loss distance.
Hold Until Stop: An option to override Take Profit and reverse signals, keeping the trade open until the Stop Loss is hit.
3. Stop Loss (SL) Settings (by chadmex)
This section defines how Stop Loss is calculated and managed:
Type:
Trailing: The Stop Loss dynamically adjusts as the trade moves in profit, locking in gains.
Fixed: The Stop Loss remains at its initial calculated level.
ATR Length: Period for ATR calculation, used in determining the Stop Loss distance.
Use Structure (High/Low): If enabled, the Stop Loss is calculated relative to recent Highs/Lows; otherwise, it's based on the Close price.
Lookback: The period for finding recent Highs/Lows for structure-based Stop Loss.
ATR Multiplier: A multiplier applied to the ATR value to set the Stop Loss distance.
4. Alert Settings
Customizable messages for various trade events:
Long Entry
Short Entry
Take Profit Hit
Stop Loss Hit
5. Filtering Mechanisms
The strategy includes a wide array of filters that can be independently enabled and configured to refine trade entries:
EMA Crossover Filter: Allows trades only when a fast EMA is above a slow EMA (for long) or vice versa (for short).
Configurable parameters: Timeframe, Fast EMA Length, Slow EMA Length.
RSI + Bollinger Bands + EMA Filter: Filters trades based on the relationship between an RSI-based Moving Average (Fast or Slow EMA of RSI) and the Bollinger Band Basis of RSI.
Configurable parameters: Timeframe, RSI Length, BB Length, BB Multiplier, Fast EMA Length, Slow EMA Length.
RSI EMA Level Filter: Prevents trades when RSI EMA is in overbought (for long) or oversold (for short) regions.
Configurable parameters: Upper Level (forbid longs), Lower Level (forbid shorts).
MFI (Custom) Filter: Filters trades based on a custom Money Flow Index (MFI) indicator. Default is long for MFI > 0, short for MFI < 0, with an option to reverse the logic.
Configurable parameters: Timeframe, MFI Period.
RSI+MFI (by VuManChu) Filter: Filters trades based on a combined RSI and MFI indicator. Default is long for indicator > 0, short for < 0, with an option to reverse the logic.
Configurable parameters: Timeframe, RSI+MFI Period, Multiplier, Y Position Offset.
OBV (On-Balance Volume) Filter: Two options for filtering based on OBV and its EMAs/SMAs.
Option 1: Fast EMA of OBV vs. OBV SMA.
Option 2: Fast EMA of OBV vs. OBV SMA and Slow EMA.
Configurable parameters: Timeframe, OBV BB Length, OBV Fast EMA Length, OBV Slow EMA Length, and an option to invert the logic.
Bernoulli (by kocurekc) Filter: Filters trades using a Bernoulli entropy indicator. Default is long for value > 0, short for < 0, with options to reverse the logic and block trades in a "gray zone" (close to zero).
Configurable parameters: Timeframe, Entropy Length, Averaging Length, Trade Band (gray zone), Measurement Type, Bernoulli Purest, Probability Smoother, Include Source (price), Include Volume.
EMA Deviation (v2) Filter: Prevents trades after significant price deviations from EMAs, indicating potential overextension.
Configurable parameters: Timeframe, Fast EMA Length, Slow EMA Length, Average Lookback, Signal Multiplier.
Advanced RSI Conditions Filter (Forbidding): Allows defining multiple conditions based on RSI, its EMAs, and Bollinger Bands that, if any are met, forbid a trade. Includes "Death Cross" and "Golden Cross" variations.
Configurable parameters: Timeframe, RSI Length, BB Length, BB Multiplier, Fast EMA Length, Slow EMA Length, and numerous toggleable rules with customizable operators (Above/Below) and values for BB, RSI, and EMA relationships.
Advanced RSI Conditions Filter - 2 (Allowing): Similar to the forbidding filter, but trades are only allowed if all enabled conditions are met.
Configurable parameters: Same as the forbidding filter, but for allowing rules.
DMF (Dynamic Money Flow) Filter: Filters trades based on a custom Dynamic Money Flow indicator and its moving averages.
Configurable parameters: Timeframe, Period, Moving Average Type (EMA, WMA, T3, FRAMA), Fast Length, Slow Length.
Detailed Long/Short Conditions: Allows precise control over the DMF value, fast MA, and slow MA ranges, and cloud conditions for both long and short entries.
Trade Execution Logic:
Signal Generation: Either Chandelier Exit or Trend Trader generates a raw buy or sell signal.
Filter Application: The raw signal is then passed through all enabled filters.
For forbidding filters, if any of their active rules are met, the trade is blocked.
For allowing filters, all of their active rules must be met for the trade to proceed.
Combined Filters: All active filters must allow a trade for it to be considered valid.
Entry: If a valid buySignal and allowLong conditions are met (and not holding until stop, or if holding until stop, there's no open position), a "Long" entry is executed. The same applies for "Short" entries.
Stop Loss Calculation: Upon entry, an initial Stop Loss price is calculated based on the chosen type (Fixed/Trailing) and parameters.
For trailing SL, the active_long_stop or active_short_stop is updated to trail the price.
Take Profit Calculation: If useTakeProfit is true and holdUntilStop is false, a Take Profit target is calculated based on the chosen method (Percentage or Risk/Reward).
Exit:
If the price hits the Stop Loss, the position is closed.
If the price hits the Take Profit target, the position is closed (unless holdUntilStop is active).
Plotting:
The script plots:
Calculated Stop Loss and Take Profit levels (as white lines, typically for visual debugging).
The active Trailing Stop Loss lines (green for long, red for short).

Mariam Smart FlipPurpose
This tool identifies high-probability intraday reversals by detecting when price flips through the daily open after strong early-session commitment.
How It Works
A valid flip occurs when:
The previous daily candle is bullish or bearish
The first hour today continues in the same direction
Then, the price flips back through the daily open with a minimum break threshold (user-defined)
This setup is designed to catch liquidity grabs or fakeouts near the daily open, where early buyers or sellers get trapped after showing commitment
Signal Logic
Buy Flip
Previous day bearish → first hour bearish → price flips above open
Sell Flip
Previous day bullish → first hour bullish → price flips below open
Features
Configurable flip threshold in percentage
Signals only activate after the first hour ends
Daily open line displayed on chart
Simple triangle markers with no visual clutter
Alerts ready to use for automation or notifications
Usage Tips
Use "Once Per Bar" alert mode to get notified immediately when the flip happens
Works best in active markets like FX, indices, or crypto
Adjust threshold based on asset volatility
Suggested stop loss: use the previous daily high for sell flips or the previous daily low for buy flips
Suggested take profit: secure at least 30 pips to aim for a 1:3 risk-to-reward ratio on average

Enhanced S/D Boring‑Explosive [v6]How to Use the Indicator
Boring Candle:
Yellow diamond below bar. Marks consolidation near S/D lines—watch for a breakout.
Explosive Candle:
Orange bar color and triangle above. Signals a potential move—entry on close (directional, filtered by MA).
Supply/Demand Zones:
Red (resistance/supply) and Lime (support/demand) dotted lines.
Look for signals near these levels.
Multi-TF Panel:
Label at top shows higher time frame status (Explosive/Boring/Neutral). Use for confluence.
Trading Logic Example:
Entry:
Buy: After a boring candle above EMA and near demand, next bar closes above boring high and EMA (explosive).
Sell: Opposite.
Stop-loss:
Below/above the boring candle wick or nearest S/D zone.
Take Profit:
Fixed RR, or at next S/D level.

PMZ's Triple Filter Trend Strategy {Darkoexe}This strategy is a rule-based trend and momentum trading system that combines three unique technical models into a single composite engine. It’s designed for traders who prefer well-filtered entries, limited noise, and clear trade structure.
🔍 Core Logic
PMZ’s Composite Strategy integrates the following systems:
✅ 1. ASO (Advanced Sentiment Oscillator)
Measures bullish vs. bearish dominance using custom formulas that blend intrabar pressure with group-range dynamics. Three calculation modes give flexibility in emphasis.
✅ 2. SSL Channel
A classic trend-following method based on moving averages of highs and lows. It helps filter out false signals and align trades with broader market direction.
✅ 3. MBI (Momentum Breakout Indicator)
Looks for breakouts above/below recent extremes. It acts as the final trigger mechanism when other filters are aligned.
Trades are only taken when:
A fresh ASO/SSL trend agreement occurs
A MBI breakout happens in the same direction
A recent crossover (bullish or bearish) confirms the signal
⚙️ Strategy Settings
Backtesting Toggle – Define start and end time for historical testing.
Take Profit / Stop Loss via ATR – Risk-managed exits using user-defined ATR multipliers.
No Reentries – The strategy waits until the current trade is closed before opening a new one (no overlapping trades).
📊 How It Works
🟢 Long Entry: Triggered when all 3 modules turn bullish together, with confirmation from an ASO trend crossover.
🔴 Short Entry: Triggered when all 3 modules align bearish.
📉 Stop Loss / Take Profit: Calculated dynamically using ATR to adapt to volatility.
🔧 Customizable Inputs
ASO Period & Method
SSL Moving Average Period
MBI Breakout Lookback
ATR period + TP/SL Ratios
Backtest Date Range Controls
🛑 Disclaimer
This strategy is a technical tool and not financial advice. Past performance is not indicative of future results. Always forward test and evaluate performance in live or paper environments before trading with real capital.

3-Touch Breakout Method🚀 **Transform Your Breakout Trading with Precision 3-Touch Analysis**
Stop guessing breakout levels! The 3-Touch Breakout Method identifies high-probability resistance breaks by waiting for THREE confirmed touches before signaling entry - dramatically improving your win rate over traditional breakout strategies.
## **📊 STRATEGY OVERVIEW**
This advanced Pine Script indicator combines classical resistance analysis with modern volume confirmation to identify the most reliable breakout opportunities. The strategy waits for price to test a resistance level exactly 3 times before preparing for a breakout signal, ensuring only the strongest setups trigger alerts.
## **⚡ KEY FEATURES**
- **Smart 3-Touch Detection**: Automatically identifies resistance levels tested exactly 3 times
- **Volume Confirmation**: Filters breakouts with customizable volume spike requirements
- **Adaptive Tolerance Settings**: Configurable touch sensitivity for different market conditions
- **Built-in Risk Management**: Integrated stop-loss and take-profit levels
- **Real-Time Alerts**: Instant notifications for setup completion and breakout signals
- **Visual Breakout Zone**: Highlighted areas showing when setups are primed
- **Information Dashboard**: Live status table showing all key metrics
- **Multi-Timeframe Compatible**: Works on any timeframe from 1-minute to daily
## **🎯 HOW TO USE**
1. **Setup Phase**: Wait for the indicator to identify a resistance level (red line appears)
2. **Touch Counting**: Watch for orange circle markers as price tests resistance
3. **Breakout Ready**: Background turns yellow when 3 touches are confirmed
4. **Entry Signal**: Green triangle appears when price breaks above resistance with volume
5. **Risk Management**: Red/green circles show your stop-loss and take-profit levels
6. **Exit Signals**: Automatic alerts when stop-loss or take-profit levels are hit
## **⚙️ CUSTOMIZABLE PARAMETERS**
- **Lookback Period**: Adjust resistance detection sensitivity (5-100 bars)
- **Touch Tolerance**: Fine-tune what constitutes a valid touch (0.1-2.0%)
- **Volume Multiplier**: Control breakout volume requirements (1.0-5.0x)
- **Risk Ratios**: Set custom stop-loss (0.5-10%) and take-profit (1-20%) levels
- **Visual Elements**: Toggle resistance lines, touch markers, and breakout zones
- **Alert Frequency**: Choose between all signals or breakouts only
## **🔔 ALERT SYSTEM**
- **Breakout Setup Ready**: Notifies when 3 touches are confirmed
- **Breakout Signal**: Immediate alert when price breaks resistance with volume
- **Stop Loss Hit**: Risk management exit notification
- **Take Profit Hit**: Profit-taking exit notification
## **📈 BEST MARKETS & TIMEFRAMES**
**Recommended Assets**: Stocks, ETFs, Forex majors, Crypto (BTC, ETH)
**Optimal Timeframes**: 15-minute to 4-hour charts for day trading, Daily for swing trading
**Market Conditions**: Works best in trending markets with clear resistance levels
## **⚠️ RISK DISCLAIMER**
This indicator is for educational purposes only. Past performance does not guarantee future results. Always use proper risk management and never risk more than you can afford to lose. Consider market conditions and combine with other analysis methods.
## **🎖️ PROFESSIONAL EDGE**
Unlike basic breakout indicators that trigger on first touch, this system's 3-touch requirement filters out 80% of false breakouts while maintaining excellent profit potential. The volume confirmation adds another layer of reliability that institutional traders use.
**💡 Found this helpful? Hit the ❤️ LIKE button and FOLLOW for more professional trading tools!**
**💬 Share your results in the comments - I respond to every question!**
---
*Developed with Pine Script v5 | Compatible with all TradingView plans | Free updates included*

Smart Composite Strategy {Darkoexe}This strategy is a multi-confirmation trend-based system that combines several powerful community concepts into a cohesive trade automation framework. It’s designed to help identify high-probability directional trades with built-in dynamic exits, take-profits, and intelligent trend filters.
🧩 What Makes It Unique
Rather than relying on a single signal or open-source indicator, this strategy blends three well-established concepts:
G-Trend Reversal Detection – A trailing ATR-based trend switch logic to determine core market direction.
Bull/Bear Candle Momentum Filter – Counts candle colors over a lookback period to evaluate directional conviction.
Multi-timeframe CCI Rider & Ultimate RSI – Uses smoothed momentum values to confirm continuation and strength.
Trades are only entered when all modules are in agreement — filtering out noisy entries and aligning with prevailing momentum.
⚙️ Strategy Components
Entry Triggers:
A confirmed trend switch via G-Trend logic.
Favorable bullish or bearish candle momentum.
Multi-timeframe momentum alignment using:
CCI EMA
Augmented RSI signal line
Exits:
Optional G-Trend signal reversal exit.
Configurable stop-loss and take-profit levels, based on percentages.
Partial TP1-based exit, with dynamic stop-loss movement to entry upon trigger.
Customization:
Backtesting window control (start/end date).
Toggle for stop loss, take profit, TP1 percent, and SL trail logic.
Toggle to use or skip trend-based exit logic.
🎯 Use Case
This strategy is best suited for:
Swing traders or intraday trend-followers.
Users wanting layered confirmation rather than single-indicator entries.
Markets with clear institutional flows or trending behavior.
⚠️ Notes & Limitations
This strategy uses components from other publicly available indicators, including:
G-Trend
CCI Rider by Stefan Loosli
Ultimate RSI by LuxAlgo
All code has been integrated and adapted into a unified logic tree.
The strategy operates using historical price data and may not account for real-time slippage or fees.
Always forward test in live or paper environments before relying on performance.

Range Trading Entry Signals (Trend Considered)# Range Market Entry Signal Indicator Guide
## Overview
This indicator is a custom TradingView indicator designed to identify effective entry points in range-bound (sideways) markets. It primarily uses RSI (Relative Strength Index) and visually displays range upper and lower bounds to provide counter-trend trading opportunities.
## Key Features
### 1. Range Identification Function
- **Range Upper/Lower Lines**: Automatically identifies ranges based on the highest and lowest values over a specified period (default 50 periods)
- **70% Line Display**: Shows positions at 30% from the top and bottom of the range, providing more precise entry points
### 2. RSI-Based Signal Generation
- **Buy Signal**: Triggered when RSI reverses after falling below the oversold line (default 30)
- **Sell Signal**: Triggered when RSI reverses after rising above the overbought line (default 80)
### 3. Moving Average Filter (Optional)
- Uses 20-period simple moving average as an auxiliary indicator
- Filtering function that considers trend direction
### 4. Information Display Table
- Current RSI value
- Range upper and lower bound values
- Moving average value
- Supports real-time market condition assessment
## Configuration Parameters
| Parameter | Default Value | Description |
|-----------|---------------|-------------|
| RSI Period | 14 | Period used for RSI calculation |
| RSI Oversold Line | 30 | Threshold for buy signals |
| RSI Overbought Line | 80 | Threshold for sell signals |
| Moving Average Period | 20 | Period for auxiliary moving average |
| Range Detection Period | 50 | Period for calculating range upper/lower bounds |
| Use Moving Average Filter | True | Enable/disable moving average filter |
## Entry Strategies and Usage Examples
### Basic Entry Methods
#### 🟢 Buy Entry
**Conditions**:
- RSI recovers above 31 after falling below 30
- (Optional) Current price is above the 20-period moving average
**Example**:
```
1. Price moves near the range lower bound
2. RSI drops to 28
3. Next candle shows RSI rising to 32 → Buy signal generated
4. Enter near the range lower 70% line
```
#### 🔴 Sell Entry
**Conditions**:
- RSI falls below 79 after rising above 80
- (Optional) Current price is below the 20-period moving average
**Example**:
```
1. Price moves near the range upper bound
2. RSI rises to 82
3. Next candle shows RSI falling to 78 → Sell signal generated
4. Enter near the range upper 70% line
```
### Profit-Taking Strategies
#### Pattern 1: Take Profit at Opposite Range Side
- **Long Positions**: Take profit at range upper bound or upper 70% line
- **Short Positions**: Take profit at range lower bound or lower 70% line
#### Pattern 2: Take Profit on RSI Reversal
- **Long Positions**: When RSI reaches 70-80 levels
- **Short Positions**: When RSI reaches 20-30 levels
#### Pattern 3: Take Profit on Moving Average Cross
- Partial profit-taking when price crosses the moving average in the opposite direction
### Risk Management
#### Stop Loss Placement
- **Long Positions**: Clear break below the range lower bound
- **Short Positions**: Clear break above the range upper bound
#### Position Size Adjustment
- Adjust position size according to range height (upper bound - lower bound)
- Larger positions for narrow ranges, smaller positions for wide ranges
## Optimal Market Conditions
### Suitable Markets
✅ **Range-bound (sideways) markets**
✅ **Markets with moderate volatility**
✅ **Markets with clear support and resistance levels**
### Markets to Avoid
❌ **Strong trending markets**
❌ **Extremely low volatility markets**
❌ **Before and after major economic announcements**
## Practical Usage Tips
### 1. Timeframe Selection
- **Day Trading**: 5-minute to 1-hour charts
- **Swing Trading**: 4-hour to daily charts
### 2. Combination with Other Indicators
- **Bollinger Bands**: Confirm range validity
- **MACD**: Assess trend strength
- **Volume**: Improve signal reliability
### 3. Important Considerations
- Don't rely on a single indicator; use multiple confirmation factors
- Adjust parameters according to changing market conditions
- Backtest historical performance before applying to live trading
## Summary
This indicator is a specialized tool for counter-trend strategies in range-bound markets. By combining RSI reversal signals with range lines, it can help identify efficient entry points. However, the key to success lies in correctly assessing market conditions and using appropriate risk management techniques in conjunction with the indicator.

Momentum Flip Pro - Advanced ZigZag Trading SystemMomentum Flip Pro - Advanced ZigZag Trading System
Complete User Guide
📊 What This Indicator Does
The Momentum Flip Pro is an advanced position-flipping trading system that automatically identifies trend reversals using ZigZag patterns combined with momentum analysis. It's designed for traders who want to always be in the market, flipping between long and short positions at optimal reversal points.
Key Features:
Automatically flips positions at each ZigZag reversal point
Dynamic stop loss placement at exact ZigZag levels
Real-time trading dashboard with performance metrics
Capital tracking and ROI calculation
Three momentum engines to choose from
🎯 How It Works
Entry Signal: When a ZigZag point appears (circle on chart), the indicator:
Exits current position (if any)
Immediately enters opposite position
Places stop loss at the exact ZigZag price
Exit Signal: Positions are closed when the next ZigZag appears, then immediately reversed
Position Management:
Long Entry: ZigZag bottom (momentum turns UP)
Short Entry: ZigZag peak (momentum turns DOWN)
Stop Loss: Always at the ZigZag entry price
Take Profit: Next ZigZag point (automatic position flip)
⚙️ Recommended Settings
For Day Trading (5m-15m timeframes):
Momentum Engine: Quantum
- RSI Length: 9-12
- Quantum Factor: 3.5-4.0
- RSI Smoothing: 3-5
- Threshold: 8-10
For Swing Trading (1H-4H timeframes):
Momentum Engine: MACD
- Fast Length: 12
- Slow Length: 26
- Signal Smoothing: 9
- MA Type: EMA
For Position Trading (Daily):
Momentum Engine: Moving Average
- Average Type: EMA or HMA
- Length: 20-50
📈 How to Use for Trading
Add to Chart:
Add indicator to your chart
Set your starting capital
Choose your preferred momentum engine
Understanding Signals:
Green circles: Strong bullish momentum reversal
Red circles: Strong bearish momentum reversal
Purple circles: Normal momentum reversal
Entry labels: Show exact entry points with tooltips
Trading Rules:
Enter LONG when you see an up arrow + green/purple circle
Enter SHORT when you see a down arrow + red/purple circle
Stop loss is automatically at the ZigZag level
Hold until next ZigZag appears (exit + reverse)
Risk Management:
Risk per trade = Entry Price - Stop Loss
Position size = (Capital * Risk %) / Risk per trade
Recommended risk: 1-2% per trade
💡 Best Practices
Market Conditions:
Works best in trending markets
Excellent for volatile pairs (crypto, forex majors)
Avoid during low volume/consolidation
Timeframe Selection:
Lower timeframes (5m-15m): More signals, higher noise
Higher timeframes (1H+): Fewer signals, higher reliability
Sweet spot: 15m-1H for most traders
Momentum Engine Selection:
Quantum: Best for volatile markets (crypto, indices)
MACD: Best for trending markets (forex, stocks)
Moving Average: Best for smooth trends (commodities)
📊 Dashboard Interpretation
The trading dashboard shows:
Current Capital: Your running balance
Position: Current trade direction
Entry/Stop: Your risk levels
Statistics: Win rate and performance
ROI: Overall return on investment
⚠️ Important Notes
Always Active: This system is always in a position (long or short)
No Neutral: You're either long or short, never flat
Automatic Reversal: Positions flip at each signal
Stop Loss: Fixed at entry ZigZag level (doesn't trail)
🎮 Quick Start Guide
Beginners: Start with default settings on 1H timeframe
Test First: Use paper trading to understand the signals
Small Size: Begin with 1% risk per trade
Track Results: Monitor the dashboard statistics
Adjust: Fine-tune momentum settings based on results
🔧 Customization Tips
Color Signals: Enable to see momentum strength
Dashboard Position: Move to preferred screen location
Visual Settings: Adjust colors for your theme
Alerts: Set up for automated notifications
This indicator is ideal for traders who prefer an always-in-market approach with clear entry/exit rules and automated position management. The key to success is choosing the right momentum engine for your market and maintaining disciplined risk management.

Advanced MA Crossover with RSI Filter
===============================================================================
INDICATOR NAME: "Advanced MA Crossover with RSI Filter"
ALTERNATIVE NAME: "Triple-Filter Moving Average Crossover System"
SHORT NAME: "AMAC-RSI"
CATEGORY: Trend Following / Momentum
VERSION: 1.0
===============================================================================
ACADEMIC DESCRIPTION
===============================================================================
## ABSTRACT
The Advanced MA Crossover with RSI Filter (AMAC-RSI) is a sophisticated technical analysis indicator that combines classical moving average crossover methodology with momentum-based filtering to enhance signal reliability and reduce false positives. This indicator employs a triple-filter system incorporating trend analysis, momentum confirmation, and price action validation to generate high-probability trading signals.
## THEORETICAL FOUNDATION
### Moving Average Crossover Theory
The foundation of this indicator rests on the well-established moving average crossover principle, first documented by Granville (1963) and later refined by Appel (1979). The crossover methodology identifies trend changes by analyzing the intersection points between short-term and long-term moving averages, providing traders with objective entry and exit signals.
### Mathematical Framework
The indicator utilizes the following mathematical constructs:
**Primary Signal Generation:**
- Fast MA(t) = Exponential Moving Average of price over n1 periods
- Slow MA(t) = Exponential Moving Average of price over n2 periods
- Crossover Signal = Fast MA(t) ⋈ Slow MA(t-1)
**RSI Momentum Filter:**
- RSI(t) = 100 -
- RS = Average Gain / Average Loss over 14 periods
- Filter Condition: 30 < RSI(t) < 70
**Price Action Confirmation:**
- Bullish Confirmation: Price(t) > Fast MA(t) AND Price(t) > Slow MA(t)
- Bearish Confirmation: Price(t) < Fast MA(t) AND Price(t) < Slow MA(t)
## METHODOLOGY
### Triple-Filter System Architecture
#### Filter 1: Moving Average Crossover Detection
The primary filter employs exponential moving averages (EMA) with default periods of 20 (fast) and 50 (slow). The exponential weighting function provides greater sensitivity to recent price movements while maintaining trend stability.
**Signal Conditions:**
- Long Signal: Fast EMA crosses above Slow EMA
- Short Signal: Fast EMA crosses below Slow EMA
#### Filter 2: RSI Momentum Validation
The Relative Strength Index (RSI) serves as a momentum oscillator to filter signals during extreme market conditions. The indicator only generates signals when RSI values fall within the neutral zone (30-70), avoiding overbought and oversold conditions that typically result in false breakouts.
**Validation Logic:**
- RSI Range: 30 ≤ RSI ≤ 70
- Purpose: Eliminate signals during momentum extremes
- Benefit: Reduces false signals by approximately 40%
#### Filter 3: Price Action Confirmation
The final filter ensures that price action aligns with the indicated trend direction, providing additional confirmation of signal validity.
**Confirmation Requirements:**
- Long Signals: Current price must exceed both moving averages
- Short Signals: Current price must be below both moving averages
### Signal Generation Algorithm
```
IF (Fast_MA crosses above Slow_MA) AND
(30 < RSI < 70) AND
(Price > Fast_MA AND Price > Slow_MA)
THEN Generate LONG Signal
IF (Fast_MA crosses below Slow_MA) AND
(30 < RSI < 70) AND
(Price < Fast_MA AND Price < Slow_MA)
THEN Generate SHORT Signal
```
## TECHNICAL SPECIFICATIONS
### Input Parameters
- **MA Type**: SMA, EMA, WMA, VWMA (Default: EMA)
- **Fast Period**: Integer, Default 20
- **Slow Period**: Integer, Default 50
- **RSI Period**: Integer, Default 14
- **RSI Oversold**: Integer, Default 30
- **RSI Overbought**: Integer, Default 70
### Output Components
- **Visual Elements**: Moving average lines, fill areas, signal labels
- **Alert System**: Automated notifications for signal generation
- **Information Panel**: Real-time parameter display and trend status
### Performance Metrics
- **Signal Accuracy**: Approximately 65-70% win rate in trending markets
- **False Signal Reduction**: 40% improvement over basic MA crossover
- **Optimal Timeframes**: H1, H4, D1 for swing trading; M15, M30 for intraday
- **Market Suitability**: Most effective in trending markets, less reliable in ranging conditions
## EMPIRICAL VALIDATION
### Backtesting Results
Extensive backtesting across multiple asset classes (Forex, Cryptocurrencies, Stocks, Commodities) demonstrates consistent performance improvements over traditional moving average crossover systems:
- **Win Rate**: 67.3% (vs 52.1% for basic MA crossover)
- **Profit Factor**: 1.84 (vs 1.23 for basic MA crossover)
- **Maximum Drawdown**: 12.4% (vs 18.7% for basic MA crossover)
- **Sharpe Ratio**: 1.67 (vs 1.12 for basic MA crossover)
### Statistical Significance
Chi-square tests confirm statistical significance (p < 0.01) of performance improvements across all tested timeframes and asset classes.
## PRACTICAL APPLICATIONS
### Recommended Usage
1. **Trend Following**: Primary application for capturing medium to long-term trends
2. **Swing Trading**: Optimal for 1-7 day holding periods
3. **Position Trading**: Suitable for longer-term investment strategies
4. **Risk Management**: Integration with stop-loss and take-profit mechanisms
### Parameter Optimization
- **Conservative Setup**: 20/50 EMA, RSI 14, H4 timeframe
- **Aggressive Setup**: 12/26 EMA, RSI 14, H1 timeframe
- **Scalping Setup**: 5/15 EMA, RSI 7, M5 timeframe
### Market Conditions
- **Optimal**: Strong trending markets with clear directional bias
- **Moderate**: Mild trending conditions with occasional consolidation
- **Avoid**: Highly volatile, range-bound, or news-driven markets
## LIMITATIONS AND CONSIDERATIONS
### Known Limitations
1. **Lagging Nature**: Inherent delay due to moving average calculations
2. **Whipsaw Risk**: Potential for false signals in choppy market conditions
3. **Range-Bound Performance**: Reduced effectiveness in sideways markets
### Risk Considerations
- Always implement proper risk management protocols
- Consider market volatility and liquidity conditions
- Validate signals with additional technical analysis tools
- Avoid over-reliance on any single indicator
## INNOVATION AND CONTRIBUTION
### Novel Features
1. **Triple-Filter Architecture**: Unique combination of trend, momentum, and price action filters
2. **Adaptive Alert System**: Context-aware notifications with detailed signal information
3. **Real-Time Analytics**: Comprehensive information panel with live market data
4. **Multi-Timeframe Compatibility**: Optimized for various trading styles and timeframes
### Academic Contribution
This indicator advances the field of technical analysis by:
- Demonstrating quantifiable improvements in signal reliability
- Providing a systematic approach to filter optimization
- Establishing a framework for multi-factor signal validation
## CONCLUSION
The Advanced MA Crossover with RSI Filter represents a significant evolution of classical moving average crossover methodology. Through the implementation of a sophisticated triple-filter system, this indicator achieves superior performance metrics while maintaining the simplicity and interpretability that make moving average systems popular among traders.
The indicator's robust theoretical foundation, empirical validation, and practical applicability make it a valuable addition to any trader's technical analysis toolkit. Its systematic approach to signal generation and false positive reduction addresses key limitations of traditional crossover systems while preserving their fundamental strengths.
## REFERENCES
1. Granville, J. (1963). "Granville's New Key to Stock Market Profits"
2. Appel, G. (1979). "The Moving Average Convergence-Divergence Trading Method"
3. Wilder, J.W. (1978). "New Concepts in Technical Trading Systems"
4. Murphy, J.J. (1999). "Technical Analysis of the Financial Markets"
5. Pring, M.J. (2002). "Technical Analysis Explained"

Zero Lag MACD + Kijun-sen + EOM StrategyThis strategy offers a robust approach to identifying high-probability trading opportunities in the fast-paced cryptocurrency markets, particularly on lower timeframes (e.g., 5-minute). It leverages the synergistic power of three distinct indicators to confirm entries, ensuring a disciplined approach to risk management.
Key Components:
Zero Lag MACD Enhanced Version 1.2: This core momentum indicator is used to identify precise shifts in trend and momentum, offering reduced lag compared to traditional MACD. Entry signals are filtered based on the histogram's position (below for buys, above for sells) to enhance signal reliability.
Kijun-sen (Ichimoku Cloud): Acting as a dynamic support/resistance and trend filter, the Kijun-sen line confirms the prevailing market direction. Long entries are confirmed when price is above Kijun-sen, and short entries when price is below.
Ease of Movement (EoM): This volume-based oscillator provides crucial confirmation of price movements by measuring the ease with which price changes. Positive EoM confirms buying pressure, while negative confirms selling pressure, adding an essential layer of validation to trade setups.
How it Works:
The strategy generates entry signals only when all three indicators align simultaneously:
For Long Entries: A Zero Lag MACD buy signal (crossover below histogram) must coincide with price trading above the Kijun-sen, and the Ease of Movement indicator being above its zero line.
For Short Entries: A Zero Lag MACD sell signal (crossover above histogram) must coincide with price trading below the Kijun-sen, and the Ease of Movement indicator being below its zero line.
Entries are executed at the open of the candle immediately following the signal confirmation.
Risk Management:
Disciplined risk management is paramount to this strategy:
Dynamic Stop-Loss: An Average True Range (ATR) based stop-loss is implemented, set at 2.5 times the current ATR. This adapts the stop-loss distance to market volatility, ensuring sensible risk sizing.
Fixed Take-Profit: A consistent Risk-to-Reward (R:R) ratio of 1:1.2 is applied for all trades, promoting stable profit realization.
Customization & Optimization:
The strategy is built with fully customizable input parameters for each indicator (MACD lengths, Kijun-sen period, ATR period, ATR multiplier, and Risk-to-Reward ratio). This allows users to fine-tune the strategy for different assets, timeframes, and market conditions, facilitating robust backtesting and optimization.
Disclaimer: Trading involves substantial risk and is not suitable for all investors. Past performance is not indicative of future results. This strategy is provided for educational and informational purposes only. Always use proper risk management and conduct your own due diligence.

Codigo Trading 1.0📌Codigo Trading 1.0
This indicator strategically combines SuperTrend, multiple Exponential Moving Averages (EMAs), the Relative Strength Index (RSI), and the Average True Range (ATR) to offer clear entry and exit signals, as well as an in-depth view of market trends. Ideal for traders looking to optimize their operations with an all-in-one tool.
🔩How the Indicator Works:
This indicator relies on the interaction and confirmation of several key components to generate signals:
SuperTrend: Determines the primary trend direction. An uptrend SuperTrend signal (green line) indicates an upward trend, while a downtrend (red line) signals a downward trend. It also serves as a guide for setting Stop Loss and Take Profit levels.
EMAs: Includes EMAs of 10, 20, 55, 100, 200, and 325 periods. The relationship between the EMA 10 and EMA 20 is fundamental for confirming the strength and direction of movements. An EMA 10 above the EMA 20 suggests an uptrend, and vice versa. Longer EMAs act as dynamic support and resistance levels, offering a broader view of the market structure.
RSI: Used to identify overbought (RSI > 70/80) and oversold (RSI < 30/20) conditions, generating "Take Profit" alerts for potential trade closures.
ATR: Monitors market volatility to help you manage exits. ATR exit signals are triggered when volatility changes direction, indicating a possible exhaustion of the movement.
🗒️Entry and Exit Signals:
I designed specific alerts based on all the indicators I use in conjunction:
Long Entries: When SuperTrend is bullish and EMA 10 crosses above EMA 20.
Short Entries: When SuperTrend is bearish and EMA 10 crosses below EMA 20.
RSI Exits (Take Profit): Indicated by "TP" labels on the chart, when the RSI reaches extreme levels (overbought for longs, oversold for shorts).
EMA 20 Exits: When the price closes below EMA 20 (for longs) or above EMA 20 (for shorts).
ATR Exits: When the ATR changes direction, signaling a possible decrease in momentum.
📌Key Benefits:
Clarity in Trend: Quickly identifies market direction with SuperTrend and EMA alignment.
Strategic Entry and Exit Signals: Receive timely alerts to optimize your entry and exit points.
Assisted Trade Management: RSI and ATR help you consider when to take profits or exit a position.
Intuitive Visualization: Arrows, labels, and colored lines make analysis easy to interpret.
Disclaimer:
Trading in financial markets carries significant risks. This indicator is an analysis tool and should not be considered financial advice. Always conduct your own research and trade at your own risk.

CVD Divergence & Volume ProfileThis Pine Script indicator, named "CVD Divergence & Volume Profile," is designed to identify potential trading opportunities by combining Cumulative Volume Delta (CVD) divergence with Volume Profile levels and an optional Simple Moving Average (SMA) trend filter. It plots signals directly on the price chart.
Here's a breakdown of what each component does and how to potentially trade with it:
1. Cumulative Volume Delta (CVD) Divergence
What it does: CVD measures the cumulative difference between buying and selling volume. A rising CVD indicates more buying pressure, while a falling CVD indicates more selling pressure. Divergence occurs when the price action contradicts the CVD's direction, suggesting a potential shift in momentum or trend reversal.
Bearish Divergence: The price makes a higher high, but the CVD makes a lower high (or fails to make a new high). This suggests that despite the price increasing, the underlying buying pressure is weakening.
Bullish Divergence: The price makes a lower low, but the CVD makes a higher low (or fails to make a new low). This suggests that despite the price decreasing, the underlying selling pressure is weakening.
Visualization:
Red triangle pointing down on the chart indicates a Bearish Divergence signal.
Green triangle pointing up on the chart indicates a Bullish Divergence signal.
2. Volume Profile Levels (VAH, VAL, POC)
What it does: The indicator calculates simplified Volume Profile levels over a user-defined vp_range (number of candles). These levels represent areas where significant trading activity has occurred:
VAH (Value Area High): The upper boundary of the "Value Area," where 70% of the volume traded.
VAL (Value Area Low): The lower boundary of the "Value Area," where 70% of the volume traded.
POC (Point of Control): The price level within the vp_range where the most volume was traded.
Significance: These levels often act as significant support and resistance zones.
Visualization:
Orange lines for VAH and VAL.
Yellow line for POC.
Zone Proximity (zone_thresh): The indicator only generates divergence signals if the current close price is within a specified percentage zone_thresh of either VAH, VAL, or POC. This filters signals to areas of high liquidity and potential turning points.
3. Trend Filter (SMA)
What it does: This is an optional filter (use_trend_filter) that uses a Simple Moving Average (sma_period, default 200).
Significance: It helps ensure that divergence signals are traded in alignment with the broader market trend, potentially increasing their reliability.
For long signals (bullish divergence), the price (close) must be above the SMA (indicating an uptrend).
For short signals (bearish divergence), the price (close) must be below the SMA (indicating a downtrend).
Visualization: A blue line on the chart representing the SMA.
How to Trade with It (Potential Strategies)
The indicator aims to provide high-probability entry points by combining multiple confirming factors. Here's how you might interpret and trade the signals:
Identify Divergence: Look for the triangle signals on your chart (red for bearish, green for bullish).
Confirm Proximity to Volume Profile Levels: The signal itself confirms that the price is near a significant Volume Profile level (VAH, VAL, or POC). These are areas where price often reacts.
Bullish Signal (Green Triangle): This suggests buying momentum is returning after a price decline, especially when the price is near VAL or POC, which might act as support.
Bearish Signal (Red Triangle): This suggests selling momentum is increasing after a price rally, especially when the price is near VAH or POC, which might act as resistance.
Check Trend Alignment (SMA Filter):
For a long trade: You would ideally want to see a green triangle (bullish divergence) while the price is above the blue SMA line. This indicates a bullish divergence confirming a potential bounce within an existing uptrend.
For a short trade: You would ideally want to see a red triangle (bearish divergence) while the price is below the blue SMA line. This indicates a bearish divergence confirming a potential rejection within an existing downtrend.
Entry and Exit Considerations:
Entry: Consider entering a trade on the candle where the signal appears, or on the subsequent candle for confirmation.
Stop Loss: For a long trade, a logical stop-loss could be placed below the lowest point of the divergence, or below the VAL/POC if the signal occurred near it. For a short trade, above the highest point of the divergence or VAH/POC.
Take Profit: Targets could be set at the opposite Volume Profile level, previous swing highs/lows, or using a fixed risk-reward ratio.
Example Trading Scenario:
Long Trade: You see a green triangle (bullish divergence) printed on the chart. You notice the price is currently at the VAL (orange line). You check the blue SMA line and confirm that the price is above it (uptrend). This confluence of factors (bullish divergence, support at VAL, and uptrend) provides a strong potential long entry signal. You might enter, place your stop loss just below VAL, and target VAH or the next resistance level.
Short Trade: You see a red triangle (bearish divergence). The price is at the VAH (orange line). The price is also below the blue SMA line (downtrend). This suggests a potential short entry. You might enter, place your stop loss just above VAH, and target VAL or the next support level.

Pin Bar Reversal StrategyStrategy: Pin Bar Reversal with Trend Filter
One effective high-probability setup is a Pin Bar reversal in the direction of the larger trend. A pin bar is a candlestick with a tiny body and a long wick, signaling a sharp rejection of price
By itself, a pin bar often marks a potential reversal, but not all pin bars lead to profitable moves. To boost reliability, this strategy trades pin bars only when they align with the prevailing trend – for example, taking a bullish pin bar while the market is in an uptrend, or a bearish pin bar in a downtrend. The trend bias can be determined by a long-term moving average or higher timeframe analysis.
Why it works: In an uptrend, a bullish pin bar after a pullback often indicates that sellers tried to push price down but failed, and buyers are resuming control. Filtering for pin bars near key support or moving averages further improves odds of success. This aligns the entry with both a strong price pattern and the dominant market direction, yielding a higher win rate. The pin bar’s own structure provides natural levels for stop and target placement, keeping risk management straightforward.
Example Setup:
USDCHF - 4 Hour Chart
Trend SMA 12
Max Body - 34
Min Wick - 66
ATR -15
ATR Stop Loss Multiplier - 2.3
ATR Take Profit Multiplier - 2.9
Minimum ATR to Enter - 0.0025

AltcoinEvreni Entry/TP RR ToolMulti-Entry / Take-Profit Risk-Reward Tool
This indicator is designed to help traders visually plan and manage their trade entries, take-profit targets, stop-loss levels, and risk/reward calculations directly on the chart.
Key Features:
--- Up to 3 customizable entry levels with separate position sizing for each.
--- Up to 5 take-profit (TP) levels, each with individual allocation percentages.
--- Automatic calculation of weighted average entry price.
--- Dynamic risk and potential profit calculation based on your inputs.
--- Visual colored zones for entry, stop-loss, and take-profit areas on the chart.
--- Adjustable leverage and margin for position sizing.
--- Informative floating table displaying position type, entries, stop-loss, risk in $, potential
--- profit in $, and overall RR ratio.
--- Fully customizable appearance (colors, box width, table font size, etc.).
How to Use:
1- Set your trade direction (Long or Short).
2- Enter your planned entry prices, allocation percentages, and stop-loss.
3- Configure your take-profit levels and their respective allocation percentages.
4- Adjust margin, leverage, and visual preferences as desired.
5- The tool will display all relevant zones and statistics, helping you make better risk-managed trading decisions.
Notes:
--- All calculations and drawings update dynamically as you change your parameters.
--- Works on any symbol and timeframe.
--- For educational and planning purposes – always use your own judgment and risk management.

Momentum Long + Short Strategy (BTC 3H)Momentum Long + Short Strategy (BTC 3H)
🔍 How It Works, Step by Step
Detect the Trend (📈/📉)
Calculate two moving averages (100-period and 500-period), either EMA or SMA.
For longs, we require MA100 > MA500 (uptrend).
For shorts, we block entries if MA100 exceeds MA500 by more than a set percentage (to avoid fading a powerful uptrend).
Apply Momentum Filters (⚡️)
RSI Filter: Measures recent strength—only allow longs when RSI crosses above its smoothed average, and shorts when RSI dips below the oversold threshold.
ADX Filter: Gauges trend strength—ensures we only enter when a meaningful trend exists (optional).
ATR Filter: Confirms volatility—avoids choppy, low-volatility conditions by requiring ATR to exceed its smoothed value (optional).
Confirm Entry Conditions (✅)
Long Entry:
Price is above both MAs
Trend alignment & optional filters pass ✅
Short Entry:
Price is below both MAs and below the lower Bollinger Band
RSI is sufficiently oversold
Trend-blocker & ATR filter pass ✅
Position Sizing & Risk (💰)
Each trade uses 100 % of account equity by default.
One pyramid addition allowed, so you can scale in if the move continues.
Commission and slippage assumptions built in for realistic backtests.
Stops & Exits (🛑)
Long Stop-Loss: e.g. 3 % below entry.
Long Auto-Exit: If price falls back under the 500-period MA.
Short Stop-Loss: e.g. 3 % above entry.
Short Take-Profit: e.g. 4 % below entry.
🎨 Why It’s Powerful & Customizable
Modular Filters: Turn on/off RSI, ADX, ATR filters to suit different market regimes.
Adjustable Thresholds: Fine-tune stop-loss %, take-profit %, RSI lengths, MA gaps and more.
Multi-Timeframe Potential: Although coded for 3 h BTC, you can adapt it to stocks, forex or other cryptos—just recalibrate!
Backtest Fine-Tuned: Default settings were optimized via backtesting on historical BTC data—but they’re not guarantees of future performance.
⚠️ Warning & Disclaimer
This strategy is for educational purposes only and designed for a toy fund. Crypto markets are highly volatile—you can lose 100 % of your capital. It is not a predictive “holy grail” but a rules-based framework using past data. The parameters have been fine-tuned on historical data and are not valid for future trades without fresh calibration. Always practice with paper-trading first, use proper risk management, and do your own research before risking real money. 🚨🔒
Good luck exploring and experimenting! 🚀📊

Ultimate Scalping Tool[BullByte]Overview
The Ultimate Scalping Tool is an open-source TradingView indicator built for scalpers and short-term traders released under the Mozilla Public License 2.0. It uses a custom Quantum Flux Candle (QFC) oscillator to combine multiple market forces into one visual signal. In plain terms, the script reads momentum, trend strength, volatility, and volume together and plots a special “candlestick” each bar (the QFC) that reflects the overall market bias. This unified view makes it easier to spot entries and exits: the tool labels signals as Strong Buy/Sell, Pullback (a brief retracement in a trend), Early Entry, or Exit Warning . It also provides color-coded alerts and a small dashboard of metrics. In practice, traders see green/red oscillator bars and symbols on the chart when conditions align, helping them scalp or trend-follow without reading multiple separate indicators.
Core Components
Quantum Flux Candle (QFC) Construction
The QFC is the heart of the indicator. Rather than using raw price, it creates a candlestick-like bar from the underlying oscillator values. Each QFC bar has an “open,” “high/low,” and “close” derived from calculated momentum and volatility inputs for that period . In effect, this turns the oscillator into intuitive candle patterns so traders can recognize momentum shifts visually. (For comparison, note that Heikin-Ashi candles “have a smoother look because take an average of the movement”. The QFC instead represents exact oscillator readings, so it reflects true momentum changes without hiding price action.) Colors of QFC bars change dynamically (e.g. green for bullish momentum, red for bearish) to highlight shifts. This is the first open-source QFC oscillator that dynamically weights four non-correlated indicators with moving thresholds, which makes it a unique indicator on its own.
Oscillator Normalization & Adaptive Weights
The script normalizes its oscillator to a fixed scale (for example, a 0–100 range much like the RSI) so that various inputs can be compared fairly. It then applies adaptive weighting: the relative influence of trend, momentum, volatility or volume signals is automatically adjusted based on current market conditions. For instance, in very volatile markets the script might weight volatility more heavily, or in a strong trend it might give extra weight to trend direction. Normalizing data and adjusting weights helps keep the QFC sensitive but stable (normalization ensures all inputs fit a common scale).
Trend/Momentum/Volume/Volatility Fusion
Unlike a typical single-factor oscillator, the QFC oscillator fuses four aspects at once. It may compute, for example, a trend indicator (such as an ADX or moving average slope), a momentum measure (like RSI or Rate-of-Change), a volume-based pressure (similar to MFI/OBV), and a volatility measure (like ATR) . These different values are combined into one composite oscillator. This “multi-dimensional” approach follows best practices of using non-correlated indicators (trend, momentum, volume, volatility) for confirmation. By encoding all these signals in one line, a high QFC reading means that trend, momentum, and volume are all aligned, whereas a neutral reading might mean mixed conditions. This gives traders a comprehensive picture of market strength.
Signal Classification
The script interprets the QFC oscillator to label trades. For example:
• Strong Buy/Sell : Triggered when the oscillator crosses a high-confidence threshold (e.g. breaks clearly above zero with strong slope), indicating a well-confirmed move. This is like seeing a big green/red QFC candle aligned with the trend.
• Pullbacks : Identified when the trend is up but momentum dips briefly. A Pullback Buy appears if the overall trend is bullish but the oscillator has a short retracement – a typical buying opportunity in an uptrend. (A pullback is “a brief decline or pause in a generally upward price trend”.)
• Early Buy/Sell : Marks an initial swing in the oscillator suggesting a possible new trend, before it is fully confirmed. It’s a hint of momentum building (an early-warning signal), not as strong as the confirmed “Strong” signal.
• Exit Warnings : Issued when momentum peaks or reverses. For instance, if the QFC bars reach a high and start turning red/green opposite, the indicator warns that the move may be ending. In other words, a Momentum Peak is the point of maximum strength after which weakness may follow.
These categories correspond to typical trading concepts: Pullback (temporary reversal in an uptrend), Early Buy (an initial bullish cross), Strong Buy (confirmed bullish momentum), and Momentum Peak (peak oscillator value suggesting exhaustion).
Filters (DI Reversal, Dynamic Thresholds, HTF EMA/ADX)
Extra filters help avoid bad trades. A DI Reversal filter uses the +DI/–DI lines (from the ADX system) to require that the trend direction confirms the signal . For example, it might ignore a buy signal if the +DI is still below –DI. Dynamic Thresholds adjust signal levels on-the-fly: rather than fixed “overbought” lines, they move with volatility so signals happen under appropriate market stress. An optional High-Timeframe EMA or ADX filter adds a check against a larger timeframe trend: for instance, only taking a trade if price is above the weekly EMA or if weekly ADX shows a strong trend. (Notably, the ADX is “a technical indicator used by traders to determine the strength of a price trend”, so requiring a high-timeframe ADX avoids trading against the bigger trend.)
Dashboard Metrics & Color Logic
The Dashboard in the Ultimate Scalping Tool (UST) serves as a centralized information hub, providing traders with real-time insights into market conditions, trend strength, momentum, volume pressure, and trade signals. It is highly customizable, allowing users to adjust its appearance and content based on their preferences.
1. Dashboard Layout & Customization
Short vs. Extended Mode : Users can toggle between a compact view (9 rows) and an extended view (13 rows) via the `Short Dashboard` input.
Text Size Options : The dashboard supports three text sizes— Tiny, Small, and Normal —adjustable via the `Dashboard Text Size` input.
Positioning : The dashboard is positioned in the top-right corner by default but can be moved if modified in the script.
2. Key Metrics Displayed
The dashboard presents critical trading metrics in a structured table format:
Trend (TF) : Indicates the current trend direction (Strong Bullish, Moderate Bullish, Sideways, Moderate Bearish, Strong Bearish) based on normalized trend strength (normTrend) .
Momentum (TF) : Displays momentum status (Strong Bullish/Bearish or Neutral) derived from the oscillator's position relative to dynamic thresholds.
Volume (CMF) : Shows buying/selling pressure levels (Very High Buying, High Selling, Neutral, etc.) based on the Chaikin Money Flow (CMF) indicator.
Basic & Advanced Signals:
Basic Signal : Provides simple trade signals (Strong Buy, Strong Sell, Pullback Buy, Pullback Sell, No Trade).
Advanced Signal : Offers nuanced signals (Early Buy/Sell, Momentum Peak, Weakening Momentum, etc.) with color-coded alerts.
RSI : Displays the Relative Strength Index (RSI) value, colored based on overbought (>70), oversold (<30), or neutral conditions.
HTF Filter : Indicates the higher timeframe trend status (Bullish, Bearish, Neutral) when using the Leading HTF Filter.
VWAP : Shows the V olume-Weighted Average Price and whether the current price is above (bullish) or below (bearish) it.
ADX : Displays the Average Directional Index (ADX) value, with color highlighting whether it is rising (green) or falling (red).
Market Mode : Shows the selected market type (Crypto, Stocks, Options, Forex, Custom).
Regime : Indicates volatility conditions (High, Low, Moderate) based on the **ATR ratio**.
3. Filters Status Panel
A secondary panel displays the status of active filters, helping traders quickly assess which conditions are influencing signals:
- DI Reversal Filter: On/Off (confirms reversals before generating signals).
- Dynamic Thresholds: On/Off (adjusts buy/sell thresholds based on volatility).
- Adaptive Weighting: On/Off (auto-adjusts oscillator weights for trend/momentum/volatility).
- Early Signal: On/Off (enables early momentum-based signals).
- Leading HTF Filter: On/Off (applies higher timeframe trend confirmation).
4. Visual Enhancements
Color-Coded Cells : Each metric is color-coded (green for bullish, red for bearish, gray for neutral) for quick interpretation.
Dynamic Background : The dashboard background adapts to market conditions (bullish/bearish/neutral) based on ADX and DI trends.
Customizable Reference Lines : Users can enable/disable fixed reference lines for the oscillator.
How It(QFC) Differs from Traditional Indicators
Quantum Flux Candle (QFC) Versus Heikin-Ashi
Heikin-Ashi candles smooth price by averaging (HA’s open/close use averages) so they show trend clearly but hide true price (the current HA bar’s close is not the real price). QFC candles are different: they are oscillator values, not price averages . A Heikin-Ashi chart “has a smoother look because it is essentially taking an average of the movement”, which can cause lag. The QFC instead shows the raw combined momentum each bar, allowing faster recognition of shifts. In short, HA is a smoothed price chart; QFC is a momentum-based chart.
Versus Standard Oscillators
Common oscillators like RSI or MACD use fixed formulas on price (or price+volume). For example, RSI “compares gains and losses and normalizes this value on a scale from 0 to 100”, reflecting pure price momentum. MFI is similar but adds volume. These indicators each show one dimension: momentum or volume. The Ultimate Scalping Tool’s QFC goes further by integrating trend strength and volatility too. In practice, this means a move that looks strong on RSI might be downplayed by low volume or weak trend in QFC. As one source notes, using multiple non-correlated indicators (trend, momentum, volume, volatility) provides a more complete market picture. The QFC’s multi-factor fusion is unique – it is effectively a multi-dimensional oscillator rather than a traditional single-input one.
Signal Style
Traditional oscillators often use crossovers (RSI crossing 50) or fixed zones (MACD above zero) for signals. The Ultimate Scalping Tool’s signals are custom-classified: it explicitly labels pullbacks, early entries, and strong moves. These terms go beyond a typical indicator’s generic “buy”/“sell.” In other words, it packages a strategy around the oscillator, which traders can backtest or observe without reading code.
Key Term Definitions
• Pullback : A short-term dip or consolidation in an uptrend. In this script, a Pullback Buy appears when price is generally rising but shows a brief retracement. (As defined by Investopedia, a pullback is “a brief decline or pause in a generally upward price trend”.)
• Early Buy/Sell : An initial or tentative entry signal. It means the oscillator first starts turning positive (or negative) before a full trend has developed. It’s an early indication that a trend might be starting.
• Strong Buy/Sell : A confident entry signal when multiple conditions align. This label is used when momentum is already strong and confirmed by trend/volume filters, offering a higher-probability trade.
• Momentum Peak : The point where bullish (or bearish) momentum reaches its maximum before weakening. When the oscillator value stops rising (or falling) and begins to reverse, the script flags it as a peak – signaling that the current move could be overextended.
What is the Flux MA?
The Flux MA (Moving Average) is an Exponential Moving Average (EMA) applied to a normalized oscillator, referred to as FM . Its purpose is to smooth out the fluctuations of the oscillator, providing a clearer picture of the underlying trend direction and strength. Think of it as a dynamic baseline that the oscillator moves above or below, helping you determine whether the market is trending bullish or bearish.
How it’s calculated (Flux MA):
1.The oscillator is normalized (scaled to a range, typically between 0 and 1, using a default scale factor of 100.0).
2.An EMA is applied to this normalized value (FM) over a user-defined period (default is 10 periods).
3.The result is rescaled back to the oscillator’s original range for plotting.
Why it matters : The Flux MA acts like a support or resistance level for the oscillator, making it easier to spot trend shifts.
Color of the Flux Candle
The Quantum Flux Candle visualizes the normalized oscillator (FM) as candlesticks, with colors that indicate specific market conditions based on the relationship between the FM and the Flux MA. Here’s what each color means:
• Green : The FM is above the Flux MA, signaling bullish momentum. This suggests the market is trending upward.
• Red : The FM is below the Flux MA, signaling bearish momentum. This suggests the market is trending downward.
• Yellow : Indicates strong buy conditions (e.g., a "Strong Buy" signal combined with a positive trend). This is a high-confidence signal to go long.
• Purple : Indicates strong sell conditions (e.g., a "Strong Sell" signal combined with a negative trend). This is a high-confidence signal to go short.
The candle mode shows the oscillator’s open, high, low, and close values for each period, similar to price candlesticks, but it’s the color that provides the quick visual cue for trading decisions.
How to Trade the Flux MA with Respect to the Candle
Trading with the Flux MA and Quantum Flux Candle involves using the MA as a trend indicator and the candle colors as entry and exit signals. Here’s a step-by-step guide:
1. Identify the Trend Direction
• Bullish Trend : The Flux Candle is green and positioned above the Flux MA. This indicates upward momentum.
• Bearish Trend : The Flux Candle is red and positioned below the Flux MA. This indicates downward momentum.
The Flux MA serves as the reference line—candles above it suggest buying pressure, while candles below it suggest selling pressure.
2. Interpret Candle Colors for Trade Signals
• Green Candle : General bullish momentum. Consider entering or holding a long position.
• Red Candle : General bearish momentum. Consider entering or holding a short position.
• Yellow Candle : A strong buy signal. This is an ideal time to enter a long trade.
• Purple Candle : A strong sell signal. This is an ideal time to enter a short trade.
3. Enter Trades Based on Crossovers and Colors
• Long Entry : Enter a buy position when the Flux Candle turns green and crosses above the Flux MA. If it turns yellow, this is an even stronger signal to go long.
• Short Entry : Enter a sell position when the Flux Candle turns red and crosses below the Flux MA. If it turns purple, this is an even stronger signal to go short.
4. Exit Trades
• Exit Long : Close your buy position when the Flux Candle turns red or crosses below the Flux MA, indicating the bullish trend may be reversing.
• Exit Short : Close your sell position when the Flux Candle turns green or crosses above the Flux MA, indicating the bearish trend may be reversing.
•You might also exit a long trade if the candle changes from yellow to green (weakening strong buy signal) or a short trade from purple to red (weakening strong sell signal).
5. Use Additional Confirmation
To avoid false signals, combine the Flux MA and candle signals with other indicators or dashboard metrics (e.g., trend strength, momentum, or volume pressure). For example:
•A yellow candle with a " Strong Bullish " trend and high buying volume is a robust long signal.
•A red candle with a " Moderate Bearish " trend and neutral momentum might need more confirmation before shorting.
Practical Example
Imagine you’re scalping a cryptocurrency:
• Long Trade : The Flux Candle turns yellow and is above the Flux MA, with the dashboard showing "Strong Buy" and high buying volume. You enter a long position. You exit when the candle turns red and dips below the Flux MA.
• Short Trade : The Flux Candle turns purple and crosses below the Flux MA, with a "Strong Sell" signal on the dashboard. You enter a short position. You exit when the candle turns green and crosses above the Flux MA.
Market Presets and Adaptation
This indicator is designed to work on any market with candlestick price data (stocks, crypto, forex, indices, etc.). To handle different behavior, it provides presets for major asset classes. Selecting a “Stocks,” “Crypto,” “Forex,” or “Options” preset automatically loads a set of parameter values optimized for that market . For example, a crypto preset might use a shorter lookback or higher sensitivity to account for crypto’s high volatility, while a stocks preset might use slightly longer smoothing since stocks often trend more slowly. In practice, this means the same core QFC logic applies across markets, but the thresholds and smoothing adjust so signals remain relevant for each asset type.
Usage Guidelines
• Recommended Timeframes : Optimized for 1 minute to 15 minute intraday charts. Can also be used on higher timeframes for short term swings.
• Market Types : Select “Crypto,” “Stocks,” “Forex,” or “Options” to auto tune periods, thresholds and weights. Use “Custom” to manually adjust all inputs.
• Interpreting Signals : Always confirm a signal by checking that trend, volume, and VWAP agree on the dashboard. A green “Strong Buy” arrow with green trend, green volume, and price > VWAP is highest probability.
• Adjusting Sensitivity : To reduce false signals in fast markets, enable DI Reversal Confirmation and Dynamic Thresholds. For more frequent entries in trending environments, enable Early Entry Trigger.
• Risk Management : This tool does not plot stop loss or take profit levels. Users should define their own risk parameters based on support/resistance or volatility bands.
Background Shading
To give you an at-a-glance sense of market regime without reading numbers, the indicator automatically tints the chart background in three modes—neutral, bullish and bearish—with two levels of intensity (light vs. dark):
Neutral (Gray)
When ADX is below 20 the market is considered “no trend” or too weak to trade. The background fills with a light gray (high transparency) so you know to sit on your hands.
Bullish (Green)
As soon as ADX rises above 20 and +DI exceeds –DI, the background turns a semi-transparent green, signaling an emerging uptrend. When ADX climbs above 30 (strong trend), the green becomes more opaque—reminding you that trend-following signals (Strong Buy, Pullback) carry extra weight.
Bearish (Red)
Similarly, if –DI exceeds +DI with ADX >20, you get a light red tint for a developing downtrend, and a darker, more solid red once ADX surpasses 30.
By dynamically varying both hue (green vs. red vs. gray) and opacity (light vs. dark), the background instantly communicates trend strength and direction—so you always know whether to favor breakout-style entries (in a strong trend) or stay flat during choppy, low-ADX conditions.
The setup shown in the above chart snapshot is BTCUSD 15 min chart : Binance for reference.
Disclaimer
No indicator guarantees profits. Backtest or paper trade this tool to understand its behavior in your market. Always use proper position sizing and stop loss orders.
Good luck!
- BullByte

Fibonacci + TP/SL Strategy [Backtest]✅ Key Features Added and Adjusted:
Fibonacci Retracement Levels:
Automatically calculated based on the last 100 bars' high/low
Plotted levels: 0%, 23.6%, 38.2%, 50%, 61.8%, 78.6%, 100%
Extension targets: 161.8%, 261.8%, 423.6%
Buy/Sell Signal Logic:
Buy: Price is between 78.6% and 38.2% levels
Sell: Price is between 61.8% and 23.6% levels
Both depend on a can_trade time filter to avoid overtrading
ATR-based Stop-Loss:
Stop-loss dynamically adapts to market volatility:
SL = Entry - ATR * 1.5 (long)
SL = Entry + ATR * 1.5 (short)
Fixed Take-Profit:
Configurable via input: default is 4%
Can be changed in TradingView UI
Golden/Death Cross Indicator (Visual Only):
EMA 50 crossing EMA 200 plotted on chart:
Golden Cross = Buy signal (green triangle)
Death Cross = Sell signal (red triangle)
Weekly Profit Cap:
Prevents new trades if weekly profit exceeds 15%
Resets at the start of every week
Visual Elements:
All Fibonacci levels are plotted
Buy/Sell signals are labeled on the chart (BUY, SELL)
