IsAlgo - Support & Resistance Strategy► Overview:
The Support & Resistance Strategy is designed to identify critical support and resistance levels and execute trades when the price crosses these levels. Utilizing a combination of a moving average, ATR indicator, and the highest and lowest prices, this strategy aims to accurately pinpoint entry and exit points for trades based on market movements.
► Description:
The Support & Resistance Strategy leverages the ATR (Average True Range) and a moving average to identify key support and resistance levels. The strategy calculates these levels by measuring the distance between the current market price and the moving average. This distance is continuously compared with each new candle to provide an estimate of the support and resistance levels.
The ATR is utilized to determine the width of these levels, ensuring they adjust to market volatility. To validate these levels, the strategy counts how often a candle’s low or high touches the estimated support or resistance and then bounces back. A higher frequency of such touches indicates a stronger, more reliable level.
Once the levels are confirmed, the strategy waits for a candle to close above the resistance level or below the support level. A candle closing above the resistance triggers a long entry, while a candle closing below the support triggers a short entry.
The strategy incorporates multiple stop-loss options to manage risk effectively. These options include setting stop-loss levels based on fixed pips, ATR calculations, or the highest/lowest prices of previous candles. Up to three take-profit levels can be set using fixed pips, ATR, or risk-to-reward ratios. A trailing stop feature adjusts the stop loss as the trade moves into profit, and a break-even feature moves the stop loss to the entry price once a certain profit level is reached.
Additionally, the strategy can close trades if the price crosses the opposite support or resistance level or if a candle moves significantly against the trade direction.
↑ Long Entry Example:
↓ Short Entry Example:
► Features & Settings:
⚙︎ Levels: Configure the length, width, and ATR period for support and resistance levels.
⚙︎ Moving Average: Use an Exponential Moving Average (EMA) to confirm trend direction. This can be enabled or disabled.
⚙︎ Entry Candle: Define the minimum and maximum body size and the body-to-candle size ratio for entry candles.
⚙︎ Trading Session: Specify the trading hours during which the strategy operates.
⚙︎ Trading Days: Select which days of the week the strategy is active.
⚙︎ Backtesting: Set a backtesting period with start and end dates. This feature can be deactivated.
⚙︎ Trades: Customize trade direction (long, short, or both), position sizing (fixed or percentage-based), maximum open trades, and daily trade limits.
⚙︎ Trades Exit: Choose from various exit methods, including profit/loss limits, trade duration, or crossing the opposite support/resistance level.
⚙︎ Stop Loss: Set stop-loss levels using fixed pips, ATR-based calculations, or the highest/lowest price within a specified number of previous candles.
⚙︎ Break Even: Adjust the stop loss to break-even once certain profit conditions are met.
⚙︎ Trailing Stop: Automatically adjust the stop loss as the trade moves into profit.
⚙︎ Take Profit: Define up to three take-profit levels using fixed pips, ATR, or risk-to-reward ratios based on the stop loss.
⚙︎ Alerts: Receive alerts for significant actions such as trade openings and closings, with support for dynamic values.
⚙︎ Dashboard: A visual display on the chart providing detailed information about ongoing and past trades.
► Backtesting Details:
Timeframe: 1-hour US30 chart
Initial Balance: $10,000
Order Size: 5 Units
Commission: $0.5 per contract
Slippage: 5 ticks
Stop Loss: Based on the opposite support/resistance level or break-even adjustments
"take profit" için komut dosyalarını ara

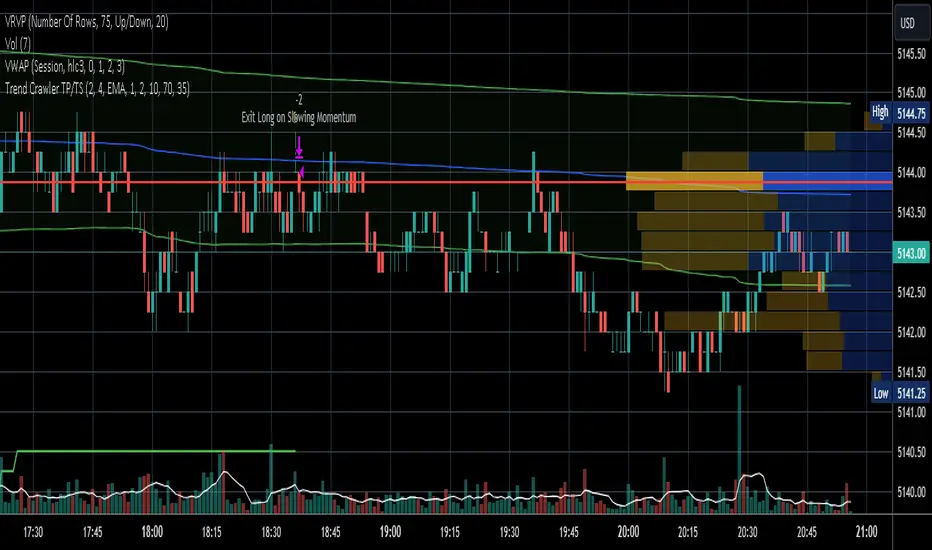
Trend Crawler with Dynamic TP and Trailing Stop### Description of "Trend Crawler with Dynamic TP and Trailing Stop"
#### Overview
The "Trend Crawler with Dynamic TP and Trailing Stop" is a comprehensive trading strategy designed for medium-frequency trading on various timeframes and markets. It utilizes a combination of trend identification and volatility analysis to determine optimal entry and exit points, aiming to maximize profitability by adapting to changing market conditions.
#### Strategy Mechanics
1. **Moving Averages**: Users can select between Simple Moving Average (SMA) and Exponential Moving Average (EMA) to define the trend. The strategy uses two moving averages (fast and slow) to identify the trend direction. A crossover of the fast MA above the slow MA signals a potential bullish trend, while a crossunder signals a bearish trend.
2. **Volume Analysis**: The strategy incorporates volume analysis to confirm the strength of the trend. It calculates a standard deviation of volume from its moving average to detect significant increases in trading activity, which supports the trend direction indicated by the MAs.
3. **Price Spread and RSI**: It uses the price spread (difference between the close and open of each bar) and the Relative Strength Index (RSI) to filter entries based on market momentum and overbought/oversold conditions. This helps in refining the entries to avoid weak or overly extended moves.
4. **Dynamic Take Profit and Trailing Stop**:
- **Trailing Stop**: As the position moves into profit, the strategy adjusts the stop loss dynamically to protect gains, using a trailing stop mechanism.
- **Dynamic Take Profit**: The take profit levels are adjusted based on the volatility (measured by the standard deviation of the price spread) to capture maximum profit from significant moves.
#### Usage
To use the strategy:
- Set the desired moving average type and lengths according to the asset and timeframe being traded.
- Adjust the RSI thresholds to match the market's volatility and trading style.
- Set the base take profit and stop loss levels along with the trailing stop distance based on risk tolerance and trading objectives.
#### Justification for Originality
While the use of moving averages, RSI, and volume analysis may be common, the integration of these elements with dynamic adjustments for take profit and trailing stops based on real-time volatility analysis offers a unique approach. The strategy adapts not just to trend direction but also to the market's momentum and volatility, providing a tailored trading solution that goes beyond standard indicator-based strategies.
#### Strategy Results and Settings
Backtesting should be conducted with realistic account sizes and include considerations for commission and slippage to ensure that the results are not misleading. Risk per trade should be kept within a sustainable range (ideally less than 5% of account equity), and the strategy should be tested over a sufficient sample size (at least 100 trades) to validate its effectiveness.
#### Chart Presentation
The script’s output includes:
- Colored backgrounds to indicate bullish or bearish market conditions.
- Plots of trailing stops to visually manage risk.
- Entry points are marked with shapes on the chart, providing clear visual cues for trading decisions.
#### Conclusion
This strategy offers traders a robust framework for trend following with enhanced risk management through dynamic adjustments based on real-time market analysis. It's designed to be versatile and adaptable to a wide range of markets and trading styles, providing traders with a tool that not only follows trends but also adapts to market changes to secure profits and reduce losses.
[Support and Resistance with Trend Lines] with Backtest (TSO) with Backtest (TSO)
===========================================================================
===========================================================================
This indicator serves as a comprehensive full-cycle trading system, providing alerts at each stage of the trade, from opening to closure. The algorithm uses most recent and historical S&R (Support and Resistance) levels with most recent and historical Trend Lines, generating signals for trades when Breaks/Bounces occur (Trade Open Signal triggers can be configured via very customizable indicator Input "Signal Trigger Matrix" settings). With signal for trade open, TP (Take Profit and SL (Stop Loss) levels are calculated as well and marked on the chart including alerts for each action of the trade. The indicator offers a variety of automated approaches for TP (Take-Profit) and SL (Stop-Loss) settings. These include static current/historical S&R (Support and Resistance) levels or S&R/Trend Lines dynamic breaks for TP (Take-Profit) and various SL (Stop-Loss) approaches, including ATR Trailing SL, opposite S&R (Support and Resistance) levels SL, opposite Trend Lines SL and more. This diverse set of tools ensure flexibility in tailoring TP (Take-Profit) and SL (Stop-Loss) parameters to different market conditions, contributing to a more adaptive and robust trading system. Additionally, a series of signal analysis tools, including market sentiment, candle bar analysis, divergence, and volume, enhance the precision of trading signals.
* Works with popular timeframes: 1M, 3M, 5M, 15M, 30M, 45M, 1H.
* Works well with Futures and Indices, can be used to trade Stocks, Crypto and FOREX.
* Includes LIVE alert/labels Breakouts and Bounces signal trigger feature, which can be used for scalping (NOTE: This approach cannot be backtested).
* Every action of the trade is calculated on a confirmed closed candle bar state (barstate.isconfirmed), so the indicator will never repaint.
==============================================================
Indicator examples:
---------------------------------------------------------------------------
Strategy Config: SRTL_MES_15M3Y_EODoff_ALL
Here is a nice example of MES (Micro E-Mini S&P 500 Index Futures) configuration, which uses S&R (Support and Resistance) breakouts as signal trigger with Elliot Wave confirmation and previous S&R historical levels for TP (Take-Profit).
---------------------------------------------------------------------------
An example of an intraday Tesla trade. Also the green arrows will be displayed IMMEDIATELY when Breakout/Reverse Bounce occurs (same an Alert will be triggered immediately).
===========================================================================
Trading open/close/TP/SL labels, plots and colors explanations:
---------------------------------------------------------------------------
>>> S&R (Support and Resistance) levels/lines: orange - support, blue - resistance (can be hidden).
>>> Trend Lines: yellow - support, green - resistance (can be hidden).
>>> Blue labels show resistance breakouts and bounces, light-blue - bullish, dark-blue - bearish
>>> Yellow labels show resistance breakouts and bounces, light-yellow - bullish, dark-yellow - bearish
>>> Green/Red arrows on top/bottom of candle bar will show LIVE breakouts (if turned on)
>>>>> LONG open: green "house" looking arrow below candle bar.
>>>>> SHORT open: red "house" looking arrow above candle bar.
>>>>> LONG/SHORT take-profit target: green/red circles (multi-profit > TP2/3/4/5 smaller circles).
>>>>> LONG/SHORT stop-loss target: green/red + crosses.
>>>>> LONG/SHORT take-profit hits: green/red diamonds.
>>>>> LONG/SHORT stop-loss hits: green/red X-crosses.
>>>>> LONG/SHORT EOD (End of Day | Intraday style) close (profitable trade): green/red squares.
>>>>> LONG/SHORT EOD (End of Day | Intraday style) close (loss trade): green/red PLUS(+)-crosses.
===========================================================================
STATS TABLE ///////////////////////////////////////////////////////////////
---------------------------------------------------------------------------
>>> Trading STATS table on the chart showing current trade direction, Last TP (Take-Profit) Taken, Current Trade PL (profit/loss in price difference from trade open to the very current state).
---------------------------------------------------------------------------
CUSTOM TRADING DATE RANGE /////////////////////////////////////////////////
---------------------------------------------------------------------------
>>>>> This feature can be used to manually set indicator trading range from and to a specific date and time. NOTE: This is not intended for a very long date range backtesting, utilize TradingView Strategy Tester for that.
* Use TradingView “Strategy Tester” to see Backtesting results
NOTE: If Strategy Tester does not show any results with Date Ranged fully unchecked, there may be an issue where a script opens a trade, but there is not enough TradingView power to set the Take-Profit and Stop-Loss and somehow an open trade gets stuck and never closes, so there are “no trades present”. In such case - manually check “Start”/“End” dates or use “Deep Backtesting” feature!
---------------------------------------------------------------------------
INTRADAY ACTIVE TRADING SESSION CONFIGURATION /////////////////////////////
---------------------------------------------------------------------------
>>> Regional Active Trading Session Hours Schedule: If selected - trades will only open during regional active trading session, if 'OFF', there will be no trading schedule and trades will open 24/7.
>>> EOD(End of Day) Close - On/Off: Close the trade if it's still open at the end of active trading session (on the very last candle bar). NOTE: If no region is selected at 'Regional Active Trading Session Schedule' - there will be no EOD(End of Day) Close and trades will run overnight until either SL(Stop-Loss) or TP(Take-Profit) is hit!
>>>>> EOD(End of Day) Close - 1 candle bar before last: This is specifically for stocks as while usually indices can be closed 15minutes after the market closes, for stocks - the last candle bar closes at the same time with the market active trading session, which if closed - trades can't be closed until next day/session! Enable this setting for the trade to close/alert 1 candle bar before the last one, so there is still time to close the trade at the Broker (NOTE: depending on the timeframe, 1 candle bar can be: 15sec, 30sec, 1min, 3min, 5min, 15min, 30min, 45min, 1h).
---------------------------------------------------------------------------
SIGNAL TRIGGER MATRIX ////////////////////////////////////////////////
---------------------------------------------------------------------------
>>> Trading Engine: This setting turns on TradingView Strategy trading engine for backtesting.
>>> Market Session Only: With this setting turned on, all signal trigger Breaks/Bounces will be hidden during Pre/Post market time.
>>> Plot S&R Levels/Lines: Plot S&R (Support and Resistance) on chart. Note: historical levels/lines will only be plotted if hit (Break/Bounce).
>>> Plot Trend Lines Levels/Lines: Plot Trend Lines levels/lines on chart. Note: historical levels/lines will only be plotted if hit (Break/Bounce).
>>> Use S&R Current Levels | Use S&R Historical Levels | Use Trend Lines Current Levels | Use Trend Lines Historical Levels |: Choose which levels should be used for Breaks/Bounces to be captured on. If all triggers are turned on/checked - whatever happens 1st wins the trigger.
>>> Breaks | Bounces: 'Breaks': Turn on Breaks through levels/lines signal trigger. | 'Bounces': Turn on Bounces off levels/lines signal trigger.
>>> Signal: Regular | Signal: S&R Combo | Signal: TL Combo | Signal: S&R + TL Combo | Signal: Repeat Action |: Trade open signal trigger execution approach MATRIX (If 1 or more turned on at the same time - whatever comes first will be the trade signal trigger). 'Regular': A single Break/Bounce must occur on a closed bar for signal trigger. 'S&R Combo': A combination of 2 Current + Historical S&R (Support and Resistance) Break/Bounce must happen in the same direction on same bar for signal trigger. 'TL Combo': A combination of 2 Current + Historical Trend Lines Break/Bounce must happen in the same direction on same bar for signal trigger. 'S&R + TL Combo': a combination of ANY S&R and Trend Line Break/Bounce must happen in the same direction on same bar for signal trigger. 'Repeat Action': Initial and then confirmation (2nd/3rd/etc. consecutive occurence) Break/Bounce must occur on same level/line for signal trigger.
>>> Historical - Look Back (# of days): How far back (in # of days) will historical S&R/Trend Lines will be used for Trade Open signals/TP/SL/etc.
>>> Historical - Look Back Invalidation (# of days): IF THERE IS TOO MUCH HISTORICAL LEVELS/LINES ON CHART - LOWER THIS SETTING + MAKE SURE IT'S SMALLER THAN 'Historical - Look Back (# of days)'. With big Look back period (5+ days) - it can become very messy with too many historical levels/lines. To clear oldest historical levels/lines - set Look Back Invalidation # of days to less than Historical Look Back # of days. (After X # of Look Back Invalidation days - older levels/lines will become invalidated and no longer used for opening trades/TP (Take-Profit)/SL (Stop-Loss), while newer levels/lines will still be discovered.
>>> S&R/Trend Lines - Support/Resistance combined into 1 entity: Every level or a line becomes simply a level or a line, regardless if it originally was a support or resistance. By default, depending on the level/line originally being support or resistance - the signal direction will be such as: Resistance is broken > LONG / bounced > SHORT; Support is broken > SHORT / bounced > LONG; with this setting on, either level or line can be both broken or bounced off in ANY direction, trade open direction will depend on current market sentiment only.
---------------------------------------------------------------------------
S&R CONFIGURATION ////////////////////////////////////////////////
---------------------------------------------------------------------------
>>> S&R Search - Left Bars (current): This setting is for calculating optimal S&R (Support and Resistance) levels (in combination with below - Right Bars).
>>> S&R Search - Right Bars (current): This setting is for calculating optimal S&R (Support and Resistance) levels (in combination with above - Left Bars).
>>> S&R Search - Custom Resolution (current): This is a custom timeframe setting specifically for S&R Search, it disregards current chart timeframe. This is great to use for scalping, for example: with main chart set to 1min and the custom timeframe set to 3min or 5min - there will be stronger support/resistance levels with more detailed price action.
>>> S&R Search - Left Bars (historical): This setting is for calculating optimal S&R (Support and Resistance) levels (in combination with below - Right Bars).
>>> S&R Search - Right Bars (historical): This setting is for calculating optimal S&R (Support and Resistance) levels (in combination with above - Left Bars).
>>> S&R Search - Custom Resolution (historical): This is a custom timeframe setting specifically for S&R Search, it disregards current chart timeframe. This is great to use for scalping, for example: with main chart set to 1min and the custom timeframe set to 3min or 5min - there will be stronger support/resistance levels with more detailed price action.
>>> S&R - Historical S&R Levels - Extend to the right: Extend all S&R lines to the right.
>>> S&R (Current/Historical) - Live Breakout/Bounce - ALERT/SHOW: NOTE: Alert wlil trigger immediately at price Breaking thru or Bouncing off level/line and an arrow above /below the bar will show the direction of breakout/bounce. If on that same live bar - price comes back causing the Breakout/Bounce become no longer valid - the arrow will disappear as the condition of the Break/Bounce will no longer be valid.
---------------------------------------------------------------------------
TREND LINES CONFIGURATION ////////////////////////////////////////////////
---------------------------------------------------------------------------
>>> Show: Trend Line development (where it 'did not exist' yet): It takes 2 pivots to develop a trend line, pivot is established at least 3 candle bars later from where the pivot is. With this setting turned on - it will plot dashed lines where trend lines originated connecting the 1st and 2nd pivot point up to where the trend line became established (where in reality you would now be able to draw a certain trend line). Established already generated trend line are plotted with a solid line.
>>> Trend Lines - Line Slope Confirmation: LONG breakout will only be shown if trend line is goind downslope \. SHORT breakout will only be shown if trend line is goind upslope /.
>>> Trend Lines - Search - Left Bars (current): This setting is for calculating optimal Trend Lines.
>>> Trend Lines - Search - Right Bars (current): This setting is for calculating optimal Trend Lines.
>>> Trend Lines - Custom Resolution (current): This is a custom timeframe setting specifically for S&R Search, it disregards current chart timeframe. This is great to use for scalping, for example: with main chart set to 1min and the custom timeframe set to 3min or 5min - there will be stronger support/resistance levels with more detailed price action.
>>> Trend Lines - Search - Left Bars (historical): This setting is for calculating optimal Trend Lines.
>>> Trend Lines - Search - Right Bars (historical): This setting is for calculating optimal Trend Lines.
>>> Trend Lines - Custom Resolution (historical): This is a custom timeframe setting specifically for S&R Search, it disregards current chart timeframe. This is great to use for scalping, for example: with main chart set to 1min and the custom timeframe set to 3min or 5min - there will be stronger support/resistance levels with more detailed price action.
>>> Trend Lines - Historical Trend Lines - Extend to the right: Extend all Trend Lines to the right.
>>> Trend Lines (Current/Historical) - Live Breakout/Bounce - ALERT/SHOW: NOTE: Alert will trigger immediately at price Breaking thru or Bouncing off level/line and an arrow above /below the bar will show the direction of breakout/bounce. If on that same live bar - price comes back causing the Breakout/Bounce become no longer valid - the arrow will disappear as the condition of the Break/Bounce will no longer be valid.
---------------------------------------------------------------------------
TAKE-PROFIT/STOP-LOSS CONFIGURATION ///////////////////////////////////////
---------------------------------------------------------------------------
>>> TP (Take-Profit) System: 'S&R Static Current/Historical': TP (Take-Profit) is calculated using current/historical S&R (Support & Resistance) levels at trade open and remains static. 'S&R/Trend Lines Dynamic Breaks': TP (Take-Profit) is fully dynamic and will be trigger at price above trade open price and with Breakout occurence (S&R or Trend Line current/historical breakout).
>>> TP (Take-Profit) # of targets: It is wise to divide the trade into several profit targets. With this setting - up to 5 TP (Take-Profit) targets can be approached. The trade will be equally divided up by the selected # of TP (Take-Profit) targets.
>>> SL (Stop-Loss) System: 'ATR-Trailing-SL': SL (Stop-Loss) is trail-following the ATR (Average True Range) line, NOTE: If at signal trigger, ATR will be against the trade direction - trade open signal will be skipped; 'S&R-Static-SL': SL (Stop-Loss) is set at trade open per optimal most recent S&R level and remains there until trade closes; 'TrendLines-Static-SL': SL (Stop-Loss) is set at trade open per optimal most recent trend line and remains there until trade closes; 'TrendLines-Dynamic-SL': SL (Stop-Loss) will be set per current opposite trend line and follow it until trade is open.; 'Oppos-Sig-Trd-in-Loss': SL (Stop-Loss) will trigger at opposite signal with trade currently at loss.
>>> SL (Stop-Loss) - On/Off: Without SL (Stop-Loss), unless EOD (End of Day) Close is turned on - there will be no SL (Stop-Loss) at all!
---------------------------------------------------------------------------
MARKET SENTIMENT CONFIRMATION ///////////////////////////////////////
---------------------------------------------------------------------------
>>> Market Sentiment: Signal is confirmed per Market Sentiment direction. If Market Sentiment is turned off - whatever signal comes 1st will be the trade open trigger.
---------------------------------------------------------------------------
SIGNAL ANALYSIS AND CLEANUP ///////////////////////////////////////////////
---------------------------------------------------------------------------
>>> Signal Cleanup - Bar Color: Include Bar Color (bullish/bearish) confirmation, LONG signal will only be opened if signal bar is green/bullish, SHORT if red/bearish.
>>> Signal Cleanup - Bar Directional Structure: Skip opposite bar structure types signals (For example: bearish green hammer).
>>> Signal Cleanup - Bar Doji Skip: Skip doji (indecisive) candles signals.
>>> Signal Cleanup - EWO (Elliott Wave Oscillator): Include EWO (Elliott Wave Oscillator), LONG will only be opened if EWO is bullish / SHORT if EWO is bearish.
>>> Signal Cleanup - VWAP (Volume-Weighted Average Price): Include VWAP (Volume-Weighted Average Price), LONG will only be opened if price is above VWAP / SHORT if price is below VWAP.
>>> Signal Cleanup - MA (Moving Average) Confirmation: Include MA (Moving Average), LONG will only be opened if MA is bullish / SHORT if MA is bearish.
>>> Signal Cleanup - ATR (Average True Range): Include ATR (Average True Range) confirmation, LONG will only be opened if ATR is bullish / SHORT if ATR is bearish.
>>> Signal Cleanup - Divergence(RSI + MACD): Include Divergence (RSI + MACD ) confirmation, LONG will only be opened if Divergence is bullish / SHORT if Divergence is bearish.
>>> Signal Cleanup - Volume % Strength: Include Volume strength/percentage confirmation, LONG/SHORT will only be opened with strong Volume matching the signal direction | By default, strong Volume percentage is set to 150% and weak to 50%.
>>> Signal Cleanup - Volume Above Average: Include Volume Above Moving Average (Volume closing bar closes above volume moving average) confirmation, LONG/SHORT will only be opened with Volume above average - Volume closed bar color must match the closed price color (bullish/bearish direction) + Volume bar must be closed above volume MA line).
---------------------------------------------------------------------------
===========================================================================
||||||||||||||||||||||||||||||||||| *** ||||||||||||||||||||||||||||||||||| *** |||||||||||||||||||||||||||||||||||
||||||||||||||||||||||||||||||||||| *** ||||||||||||||||||||||||||||||||||| *** |||||||||||||||||||||||||||||||||||
TP System - VERY IMPORTANT INFO!
-------------------------------------------------------------------------------------------------------------------
"TP PERCENTAGE" - amount by which current trade/position needs to be reduced/partially closed/sold.
-------------------------------------------------------------------------------------------------------------------
TP System: Dynamic
"TP PERCENTAGE" - will always be the same amount (trade/position size divided by the # of take-profit(TP) targets) and percentage to be closed will always be of the ORIGINAL trade/position.
-------------------------------------------------------------------------------------------------------------------
TP System: Static
"TP PERCENTAGE" - will always be the same amount IF take-profit(TP) targets are hit 1-by-1 (TP1 > TP2 > TP3 > TP4 > TP5), otherwise it will vary and unless it is a 1st take-profit(TP1), the REMAINING trade/position size will always be smaller than original and therefore the percentage to be closed will always be of the REMAINING trade/position and NOT the original one!
-------------------------------------------------------------------------------------------------------------------
"TP PERCENTAGE" CheatSheet (these are the only percentages you may see)
-----------------------------------------------------------------------
TP PERCENTAGE---Close/Sell Amount-------------Example (trade size: 50 stocks)
20%-------------trade size * 0.2--------------50 * 0.2 = 10 stocks
25%-------------trade size * 0.25-------------50 * 0.25 = 12.5(~13) stocks
34%-------------trade size * 0.34-------------50 * 0.34 = 17 stocks
40%-------------trade size * 0.4--------------50 * 0.4 = 20 stocks
50%-------------trade size * 0.5--------------50 * 0.5 = 25 stocks
60%-------------trade size * 0.6--------------50 * 0.6 = 30 stocks
66%-------------trade size * 0.66-------------50 * 0.66 = 33 stocks
75%-------------trade size * 0.75-------------50 * 0.75 = 37.5(~38) stocks
80%-------------trade size * 0.8--------------50 * 0.8 = 40 stocks
100%------------trade size--------------------50 = 50 stocks
-----------------------------------------------------------------------
If for any reason a portion of the current/remaining trade closed at such occurrence was slightly wrong, it is not an issue. Such occurrences are rare and with slight difference in partial TP closed is not significant to overall performance of our algorithms.
||||||||||||||||||||||||||||||||||| *** ||||||||||||||||||||||||||||||||||| *** |||||||||||||||||||||||||||||||||||
||||||||||||||||||||||||||||||||||| *** ||||||||||||||||||||||||||||||||||| *** |||||||||||||||||||||||||||||||||||
===========================================================================
Alert Settings (you don’t have to touch this section unless you will be using TradingView alerts through a Webhook to use with trading bot)
---------------------------------------------------------------------------
Here is how a LONG OPEN alert looks like.
NOTE: Each label , , etc. is customizable, you can change the text of it within indicator Input settings.
ALERT >>>>>>>>>>>>>>>>>>>>>>>>>>>>>>>>>>>>>>>>>>>>>>>
COIN: BTCUSD
TIMEFRAME: 15M
LONG: OPEN
ENTRY: 20000
TP1: 20500
TP2: 21000
TP3: 21500
TP4: 22500
TP5: 23500
SL: 19000
Leverage: 0
---------------------------------------------------------------------------
Here is how a TP1 alert will look with 5 TPs breakdown of the trade.
NOTE1: Next to TP1 taken it will show at which price it was triggered.
NOTE2: Next to "TP Percentage" it shows how much of the CURRENT/ACTIVE/REMAINING trade needs to be closed.
NOTE2: If TP2/3/4/5 comes before TP1 - the alert will tell you exactly how many percent of the trade needs to be closed!
ALERT >>>>>>>>>>>>>>>>>>>>>>>>>>>>>>>>>>>>>>>>>>>>>>>
COIN: BTCUSD
TIMEFRAME: 15M
LONG: TP1
TP1: 20500
TP Percentage: 20%
---------------------------------------------------------------------------
Here is how an alert will look for LONG - STOP-LOSS.
ALERT >>>>>>>>>>>>>>>>>>>>>>>>>>>>>>>>>>>>>>>>>>>>>>>
COIN: BTCUSD
TIMEFRAME: 15M
ENTRY: 20000
LONG: SL
SL: 19000
---------------------------------------------------------------------------
Here is how an alert will look for LONG - EOD (End of Day) In Profit close.
ALERT >>>>>>>>>>>>>>>>>>>>>>>>>>>>>>>>>>>>>>>>>>>>>>>
COIN: BTCUSD
TIMEFRAME: 15M
LONG: EOD-Close (profit)
ENTRY: 20000
EOD-Close: 21900
===========================================================================
Adding Alerts in TradngView
---------------------------------------------------------------------------
-Add indicator to chart and make sure the correct strategy is configured (check Backtesting results)
-Right-click anywhere on the TradingView chart
-Click on Add alert
-Condition: Select this indicator by it’s name
-Immediately below, change it to "alert() function calls only", as other wise there will be 2 alerts for every alert!
-Expiration: Open-ended (that may require higher tier TradingView account, otherwise the alert will need to be occasionally re-triggered)
-Alert name: Whatever you desire
-Hit “Create”
-Note: If you change ANY Settings within the indicator – you must DELETE the current alert and create a new one per steps above, otherwise it will continue triggering alerts per old Settings!
===========================================================================
Good Luck! (NOTE: Trading is very risky, past performance is not necessarily indicative of future results, so please trade responsibly!)
---------------------------------------------------------------------------
NOTE: There seems to be a strange glitch when strategy is running live, it will show "double-take" take-profits labels on the chart. This is not affecting the script logic and backtesting results, if you simply change the timeframe real quick to something else then back - it will no longer show the duplicate orders... this must be some sort of a glitch as every alert was thoroughly tested to make sure everything is working!

Divergent Bar Strategy [declarative] v0.2Divergent Bar Strategy v0.2
Divergent Bar is a price action that signals potential trend reversal.
This strategy uses repeating divergent bars during a bearish local trend as signals to issue multiple averaging long orders in the direction of potentially emerging bullish trend. As the local trend reverses from bearish to bullish, position could become profitable and is closed by an opposite signal.
As an averaging strategy, this strategy can accumulate substantial order sizes, so this implementation uses a stop loss which is adjusted dynamically according to the current position size to protect deposit.
What you see on a chart:
Greenish background under the divergent bars. This designates detected divergent signals.
Alligator Fast Period and Required Bar Amplitude affect the amount of divergent bars detected.
Red green and blue alligator lines display the alligator indicator used as part of divergent bar detection. In general, you don’t need to see it, you can color the lines transparent in the Style section.
Green triangles designate placed long orders. Required Divergents for Long Cummulative Signal parameter affects those signals.
Parameters and default values:
Alligator Fast Period, default 9.
Length of the alligator fast EMA. The alligator indicator used to filter a divergent bar. A bar is considered divergent only if it is located below the alligator for bollish signal and above for a bearish. In general you can leave default value, as the period 9 corresponds to a reasonable value for an alligator, used for bars on a specific timeframe.
Required Bar Amplitude (%), default 0.4.
This is an important parameter that needs to be adjusted for different timeframes. It specifies minimum size of candle shadow used to detect divergent bars. Higher values produce more false signals, lower values tend produce only strong signals. Be careful, because it also filters out bearish signals used to close the trades, so you need a bearish signal to appear. If you filter small signals you risk ending up with a trade that does not close in profit. You need to find a balance here.
Required Divergents for Long Cummulative Signal, default 3.
Divergent bar does not necessarily signal an immidiate trend reversal. Sometimes several signals need to accumulate. This parameter specifies the count at which the orders start. If you increase this count, orders are only placed after the count is achieved, so your position has bigger chance to go in profit sooner. It does not necessarily mean the most profitable position.
Required Divergents for Short Cummulative Signal, default 1.
It is the same as for long positions, but the opposite.
These signals are used to close the trades. Higher value can mean that a take profit signal would happen at potentially higher price, but be aware that it could also lead to missign oportunity to take profit if there is not enough signals in the sequence.
Long Order Size (%), default 5.0.
Percentage of deposit used for the first order in sequence. Actual order size is comuted dynamically, it depends on Reinvest and parameter. In case Reinvest is turned on, it is computed relative to the current equity, that is initial deposit and netprofit combined.
Reinvest (only for backtesting), default - turned off.
Affects Long Order Size. If turned off, order size is computed according to percentage of total equity, that is initial deposit + net profit. In an automated strategy, you should not turn this parameter on, because this way you can’t control the position size, as it growith or reduces during the actual period of the study.
Martingale, default 1.0.
Affects dynamically computed order size. First order is calculated in percentage from deposit or equity, as specified by Long Order Size and Reinvest parameters.
Order will be scaled by the following values:
Martingale = 0.0 - only the first order would be placed.
Martingale = 1.0 - equal orders will be placed in sequence, with leads to unlimited position growth.
Martingale = 1.3 - orders will be scaled by 1.3, 1.69, 2.197 etc. That is geometric increasing sequnce, which leads to unlimited position growth.
Sequential long order size is multiplied by the martingale value.
Martingale < 1.0 - orders will be scaled by geometrically decreasing sequence, resulting in limited growth of position.
Long Stop Loss (%), default 10.0.
Dynamically adjusted stop loss, which is computed according to the current average position price, so the value potentially lost is proportional to the percentage specified.
Show Long Stop Loss Line, default is off.
Draws a graph line corresponding to the dynamic stop loss on the chart.
Bullish Line Visual Offset (% of price), default -10
For convenience, the count of sequential orders is drawn as a green line over a black EMA on the same chart, offset from an EMA. This is just a visual aid to visualize the strength of long signal as divergent bars accumulate in sequence. EMA is just used so the visual cue is always displayed somewhere close the price graph.

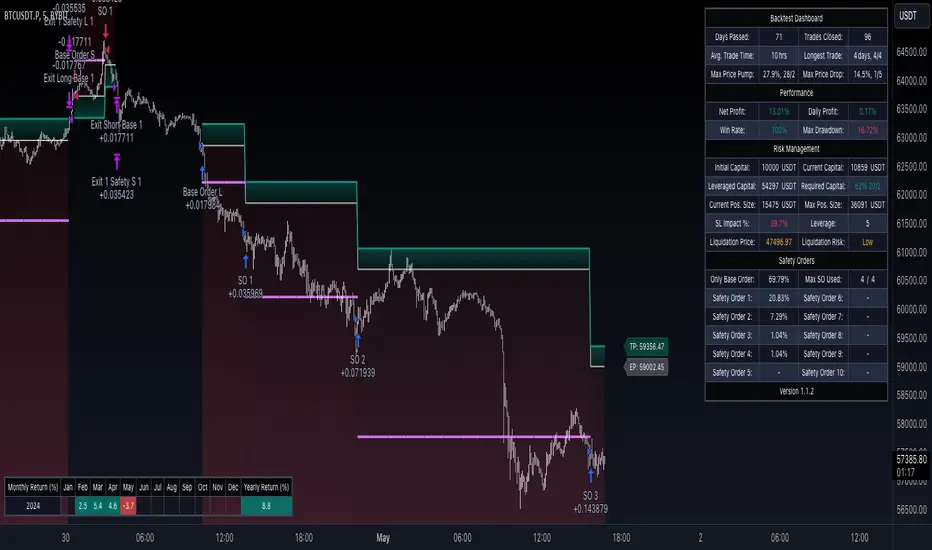
CryptoGraph Dynamic DCAA system to backtest and automate comprehensive trading strategies
═════════════════════════════════════════════════════════════════════════
🟣 Supporting Your Trades
CryptoGraph Dynamic DCA serves as a comprehensive tool on TradingView, designed to refine your approach to cryptocurrency trading. It utilises dynamic dollar-cost averaging (DCA), based on external indicator sources, to provide structured market entry and exit strategies. Suitable for both short-term trading and long-term portfolio management, CryptoGraph Dynamic DCA can offer a methodical way to support your trading decisions.
The tool offers an intuitive interface with inputs for strategy customisation, visualised preferences, and bot alert configurations. It can assist traders seeking precision, adaptability, and control in their trading activities. In the example on the chart above, we use the CryptoGraph Entry Builder (part of CryptoGraph Dynamic DCA package) as an external source for our initial entry (base order) and our safety orders, as well as an external source for our second take profit, which can be configured to be signal based.
🟣 Features
External Entry/Exit sources: The strategy is designed to assist with accurate market entries and exits by utilising signals from external indicators. It offers the flexibility to tailor your trading approach, providing an opportunity to leverage the analytical capabilities of various indicators available on TradingView.
Strategic Direction Control: Configure your strategy to go long, short, or both, adapting to market trends and your trading style.
Leverage Customisation: Tailor your leverage settings for isolated or cross margin to align with your risk tolerance, a liquidation estimation level is plotted on the chart, based on your input settings.
Diverse Entry Points: Utilise base orders and safety orders to diversify your entry points, reducing risk and enhancing potential returns.
Tailored Order Size: Fine-tune your order sizes using margin percentages or fixed contract sizes to fit your strategy’s requirements.
Profit Taking & Loss Prevention: Set take profit levels and stop losses with percentage or ATR-based parameters to secure profits and minimise losses. Options for moving the stop loss to entry after Take Profit 1, with an adjustable buffer, give you control over your risk management.
Max Safety Orders Count: Determine the maximum number of safety orders to manage risk effectively.
Price Deviation for DCA Orders: Specify the minimum price deviation percentage to trigger DCA orders, ensuring strategic order placement.
DCA Size Method: Choose from scaling or fixed-size DCA orders to align with your capital allocation strategy.
Visualisation & Alerts: Analyse your strategy’s performance with a backtest results table and configure bot alerts for automated trading. Auto configuration methods are integrated for multiple automated trading platforms.
🟣 Features Impression
🟣 Usage Guide
1. Strategy Configuration:
Select the appropriate cryptocurrency pair and exchange that corresponds to your trading preferences.
Choose your desired chart timeframe to align with your trading strategy’s temporal scope.
Ensure that you’re utilising the regular candle type for consistent and reliable data interpretation.
Pick an external entry source to trigger your trades based on predefined indicators or conditions.
Determine your take profit and stop loss levels to manage risks and secure earnings effectively.
Configure your DCA (Dollar-Cost Averaging) settings, including safety orders and the scaling method, to enhance entry points and manage investment distribution.
Always consult the tooltips next to each strategy input, to better understand their functions.
2. Backtest and Analysis:
Run backtests with your configured parameters to assess the strategy’s potential performance.
Review the backtest results and statistics tables to understand the strategy’s effectiveness, risk profile, and profitability.
3. Automated Trading Platform Integration:
Connect the strategy to a compatible automated trading platform to enable real-time execution of trades.
Within the trading platform, ensure the proper API setup of the bot’s configuration to align with the signals from the tool.
4. Alert Configuration in TradingView:
Set up the alert conditions in the TradingView tool to match your strategy triggers for entry, exit, take profit, and stop loss.
Configure the connection parameters within the tool to communicate effectively with your chosen automated trading platform
Activate the alerts, ensuring they are set to trigger actions such as order placement, adjustments, or closures as per your strategy’s logic.
5. Capital Management:
Confirm that your initial capital and order size are logically set, keeping in mind that the sum of all deals, especially when using pyramiding with safety orders, should not exceed your initial capital to avoid overexposure.
🟣 Trade Example
A clear example of a trade. Base order entry, safety order 1 fills, take profit 1 hits at 1%, the remainder of the position runs until the exit signal fires.
🟣 Warning
This tool has been developed to support your trading analysis, yet it’s important to acknowledge the inherent risks associated with trading. It is advisable to perform thorough research, assess your risk tolerance, and utilise this tool as one element of an overall trading strategy. Ensure that you only trade with capital that you are prepared to risk. In addition, due to the complexity of the tool, bugs may be found. Please alert us whenever you think you have found a bug in the system.
Ichimoku Clouds Strategy Long and ShortOverview:
The Ichimoku Clouds Strategy leverages the Ichimoku Kinko Hyo technique to offer traders a range of innovative features, enhancing market analysis and trading efficiency. This strategy is distinct in its combination of standard methodology and advanced customization, making it suitable for both novice and experienced traders.
Unique Features:
Enhanced Interpretation: The strategy introduces weak, neutral, and strong bullish/bearish signals, enabling detailed interpretation of the Ichimoku cloud and direct chart plotting.
Configurable Trading Periods: Users can tailor the strategy to specific market windows, adapting to different market conditions.
Dual Trading Modes: Long and Short modes are available, allowing alignment with market trends.
Flexible Risk Management: Offers three styles in each mode, combining fixed risk management with dynamic indicator states for versatile trade management.
Indicator Line Plotting: Enables plotting of Ichimoku indicator lines on the chart for visual decision-making support.
Methodology:
The strategy utilizes the standard Ichimoku Kinko Hyo model, interpreting indicator values with settings adjustable through a user-friendly menu. This approach is enhanced by TradingView's built-in strategy tester for customization and market selection.
Risk Management:
Our approach to risk management is dynamic and indicator-centric. With data from the last year, we focus on dynamic indicator states interpretations to mitigate manual setting causing human factor biases. Users still have the option to set a fixed stop loss and/or take profit per position using the corresponding parameters in settings, aligning with their risk tolerance.
Backtest Results:
Operating window: Date range of backtests is 2023.01.01 - 2024.01.04. It is chosen to let the strategy to close all opened positions.
Commission and Slippage: Includes a standard Binance commission of 0.1% and accounts for possible slippage over 5 ticks.
Maximum Single Position Loss: -6.29%
Maximum Single Profit: 22.32%
Net Profit: +10 901.95 USDT (+109.02%)
Total Trades: 119 (51.26% profitability)
Profit Factor: 1.775
Maximum Accumulated Loss: 4 185.37 USDT (-22.87%)
Average Profit per Trade: 91.67 USDT (+0.7%)
Average Trade Duration: 56 hours
These results are obtained with realistic parameters representing trading conditions observed at major exchanges such as Binance and with realistic trading portfolio usage parameters. Backtest is calculated using deep backtest option in TradingView built-in strategy tester
How to Use:
Add the script to favorites for easy access.
Apply to the desired chart and timeframe (optimal performance observed on the 1H chart, ForEx or cryptocurrency top-10 coins with quote asset USDT).
Configure settings using the dropdown choice list in the built-in menu.
Set up alerts to automate strategy positions through web hook with the text: {{strategy.order.alert_message}}
Disclaimer:
Educational and informational tool reflecting Skyrex commitment to informed trading. Past performance does not guarantee future results. Test strategies in a simulated environment before live implementation

RSI & Backed-Weighted MA StrategyRSI & MA Strategy :
INTRODUCTION :
This strategy is based on two well-known indicators that work best together: the Relative Strength Index (RSI) and the Moving Average (MA). We're going to use the RSI as a trend-follower indicator, rather than a reversal indicator as most are used to. To the signals sent by the RSI, we'll add a condition on the chart's MA, filtering out irrelevant signals and considerably increasing our winning rate. This is a medium/long-term strategy. There's also a money management method enabling us to reinvest part of the profits or reduce the size of orders in the event of substantial losses.
RSI :
The RSI is one of the best-known and most widely used indicators in trading. Its purpose is to warn traders when an asset is overbought or oversold. It was designed to send reversal signals, but we're going to use it as a trend indicator by increasing its length to 20. The RSI formula is as follows :
RSI (n) = 100 - (100 / (1 + (H (n)/L (n))))
With n the length of the RSI, H(n) the average of days closing above the open and L(n) the average of days closing below the open.
MA :
The Moving Average is also widely used in technical analysis, to smooth out variations in an asset. The SMA formula is as follows :
SMA (n) = (P1 + P2 + ... + Pn) / n
where n is the length of the MA.
However, an SMA does not weight any of its terms, which means that the price 10 days ago has the same importance as the price 2 days ago or today's price... That's why in this strategy we use a RWMA, i.e. a back-weighted moving average. It weights old prices more heavily than new ones. This will enable us to limit the impact of short-term variations and focus on the trend that was dominating. The RWMA used weights :
The 4 most recent terms by : 100 / (4+(n-4)*1.30)
The other oldest terms by : weight_4_first_term*1.30
So the older terms are weighted 1.30 more than the more recent ones. The moving average thus traces a trend that accentuates past values and limits the noise of short-term variations.
PARAMETERS :
RSI Length : Lenght of RSI. Default is 20.
MA Type : Choice between a SMA or a RWMA which permits to minimize the impact of short term reversal. Default is RWMA.
MA Length : Length of the selected MA. Default is 19.
RSI Long Signal : Minimum value of RSI to send a LONG signal. Default is 60.
RSI Short signal : Maximum value of RSI to send a SHORT signal. Default is 40.
ROC MA Long Signal : Maximum value of Rate of Change MA to send a LONG signal. Default is 0.
ROC MA Short signal : Minimum value of Rate of Change MA to send a SHORT signal. Default is 0.
TP activation in multiple of ATR : Threshold value to trigger trailing stop Take Profit. This threshold is calculated as multiple of the ATR (Average True Range). Default value is 5 meaning that to trigger the trailing TP the price need to move 5*ATR in the right direction.
Trailing TP in percentage : Percentage value of trailing Take Profit. This Trailing TP follows the profit if it increases, remaining selected percentage below it, but stops if the profit decreases. Default is 3%.
Fixed Ratio : This is the amount of gain or loss at which the order quantity is changed. Default is 400, which means that for each $400 gain or loss, the order size is increased or decreased by a user-selected amount.
Increasing Order Amount : This is the amount to be added to or subtracted from orders when the fixed ratio is reached. The default is $200, which means that for every $400 gain, $200 is reinvested in the strategy. On the other hand, for every $400 loss, the order size is reduced by $200.
Initial capital : $1000
Fees : Interactive Broker fees apply to this strategy. They are set at 0.18% of the trade value.
Slippage : 3 ticks or $0.03 per trade. Corresponds to the latency time between the moment the signal is received and the moment the order is executed by the broker.
Important : A bot has been used to test the different parameters and determine which ones maximize return while limiting drawdown. This strategy is the most optimal on BITSTAMP:ETHUSD with a timeframe set to 6h. Parameters are set as follows :
MA type: RWMA
MA Length: 19
RSI Long Signal: >60
RSI Short Signal : <40
ROC MA Long Signal : <0
ROC MA Short Signal : >0
TP Activation in multiple ATR : 5
Trailing TP in percentage : 3
ENTER RULES :
The principle is very simple:
If the asset is overbought after a bear market, we are LONG.
If the asset is oversold after a bull market, we are SHORT.
We have defined a bear market as follows : Rate of Change (20) RWMA < 0
We have defined a bull market as follows : Rate of Change (20) RWMA > 0
The Rate of Change is calculated using this formula : (RWMA/RWMA(20) - 1)*100
Overbought is defined as follows : RSI > 60
Oversold is defined as follows : RSI < 40
LONG CONDITION :
RSI > 60 and (RWMA/RWMA(20) - 1)*100 < -1
SHORT CONDITION :
RSI < 40 and (RWMA/RWMA(20) - 1)*100 > 1
EXIT RULES FOR WINNING TRADE :
We have a trailing TP allowing us to exit once the price has reached the "TP Activation in multiple ATR" parameter, i.e. 5*ATR by default in the profit direction. TP trailing is triggered at this point, not limiting our gains, and securing our profits at 3% below this trigger threshold.
Remember that the True Range is : maximum(H-L, H-C(1), C-L(1))
with C : Close, H : High, L : Low
The Average True Range is therefore the average of these TRs over a length defined by default in the strategy, i.e. 20.
RISK MANAGEMENT :
This strategy may incur losses. The method for limiting losses is to set a Stop Loss equal to 3*ATR. This means that if the price moves against our position and reaches three times the ATR, we exit with a loss.
Sometimes the ATR can result in a SL set below 10% of the trade value, which is not acceptable. In this case, we set the SL at 10%, limiting losses to a maximum of 10%.
MONEY MANAGEMENT :
The fixed ratio method was used to manage our gains and losses. For each gain of an amount equal to the value of the fixed ratio, we increase the order size by a value defined by the user in the "Increasing order amount" parameter. Similarly, each time we lose an amount equal to the value of the fixed ratio, we decrease the order size by the same user-defined value. This strategy increases both performance and drawdown.
Enjoy the strategy and don't forget to take the trade :)

[blackcat] L1 MartinGale Scalping Strategy**MartinGale Strategy** is a popular money management strategy used in trading. It is commonly applied in situations where the trader aims to recover from a losing streak by increasing the position size after each loss.
In the MartinGale Strategy, after a losing trade, the trader doubles the position size for the next trade. This is done in the hopes that a winning trade will eventually occur, which will not only recover the previous losses but also generate a profit.
The idea behind the MartinGale Strategy is to take advantage of the law of averages. By increasing the position size after each loss, the strategy assumes that eventually, a winning trade will occur, which will not only cover the previous losses but also generate a profit. This can be especially appealing for traders looking for a quick recovery from a losing streak.
However, it is important to note that the MartinGale Strategy carries significant risks. If a trader experiences a prolonged losing streak or lacks sufficient capital, the strategy can lead to substantial losses. The strategy's reliance on the assumption of a winning trade can be dangerous, as there is no guarantee that a winning trade will occur within a certain timeframe.
Traders considering implementing the MartinGale Strategy should carefully assess their risk tolerance and thoroughly understand the potential drawbacks. It is crucial to have a solid risk management plan in place to mitigate potential losses. Additionally, traders should be aware that the strategy may not be suitable for all market conditions and may require adjustments based on market volatility.
In summary, the MartinGale Strategy is a money management strategy that involves increasing the position size after each loss in an attempt to recover from a losing streak. While it can offer the potential for quick recovery, it also comes with significant risks that traders should carefully consider before implementing it in their trading approach.
The MartinGale Scalping Strategy is a trading strategy designed to generate profits through frequent trades. It utilizes a combination of moving average crossovers and crossunders to generate entry and exit signals. The strategy is implemented in TradingView's Pine Script language.
The strategy begins by defining input variables such as take profit and stop loss levels, as well as the trading mode (long, short, or bidirectional). It then sets a rule to allow only long entries if the trading mode is set to "Long".
The strategy logic is defined using SMA (Simple Moving Average) crossover and crossunder signals. It calculates a short-term SMA (SMA3) and a longer-term SMA (SMA8), and plots them on the chart. The crossoverSignal and crossunderSignal variables are used to track the occurrence of the crossover and crossunder events, while the crossoverState and crossunderState variables determine the state of the crossover and crossunder conditions.
The strategy execution is based on the current position size. If the position size is zero (no open positions), the strategy checks for crossover and crossunder events. If a crossover event occurs and the trading mode allows long entries, a long position is entered. The entry price, stop price, take profit price, and stop loss price are calculated based on the current close price and the SMA8 value. Similarly, if a crossunder event occurs and the trading mode allows short entries, a short position is entered with the corresponding price calculations.
If there is an existing long position and the current close price reaches either the take profit price or the stop loss price, and a crossunder event occurs, the long position is closed. The entry price, stop price, take profit price, and stop loss price are reset to zero.
Likewise, if there is an existing short position and the current close price reaches either the take profit price or the stop loss price, and a crossover event occurs, the short position is closed and the price variables are reset.
The strategy also plots entry and exit points on the chart using plotshape function. It displays a triangle pointing up for a buy entry, a triangle pointing down for a buy exit, a triangle pointing down for a sell entry, and a triangle pointing up for a sell exit.
Overall, the MartinGale Scalping Strategy aims to capture small profits by taking advantage of short-term moving average crossovers and crossunders. It incorporates risk management through take profit and stop loss levels, and allows for different trading modes to accommodate different market conditions.

Long-Only Opening Range Breakout (ORB) with Pivot PointsIntraday Trading Strategy: Long-Only Opening Range Breakout (ORB) with Pivot Points
Background:
Opening Range Breakout (ORB) is a popular long-only trading strategy that capitalizes on the early morning volatility in financial markets. It's based on the idea that the initial price movements during the first few minutes or hours of the trading day can set the tone for the rest of the session. The strategy involves identifying a price range within which the asset trades during the opening period and then taking long positions when the price breaks out to the upside of this range.
Pivot Points are a widely used technical indicator in trading. They represent potential support and resistance levels based on the previous day's price action. Pivot points are calculated using the previous day's high, low, and close prices and can help traders identify key price levels for making trading decisions.
How to Use the Script:
Initialization: This script is written in Pine Script, a domain-specific language for trading strategies on the TradingView platform. To use this script, you need to have access to TradingView.
Apply the Script: You can do this by adding it to your favorites, then selecting the script in the indicators list under favorites or by searching for it by name under community scripts.
Customize Settings: The script allows you to customize various settings through the TradingView interface. These settings include:
Opening Session: You can set the time frame for the opening session.
Max Trades per Day: Specify the maximum number of long trades allowed per trading day.
Initial Stop Loss Type: Choose between using a percentage-based stop loss or the previous candles low for stop loss calculations.
Stop Loss Percentage: If you select the percentage-based stop loss, specify the percentage of the entry price for the stop loss.
Backtesting Start and End Time: Set the time frame for backtesting the strategy.
Strategy Signals:
The script will display pivot points in blue (R1, R2, R3, R4, R5) and half-pivot points in gray (R0.5, R1.5, R2.5, R3.5, R4.5) on your chart.
The green line represents the opening range.
The script generates long (buy) signals based on specific conditions:
---The open price is below the opening range high (h).
---The current high price is above the opening range high.
---Pivot point R1 is above the opening range high.
---It's a long-only strategy designed to capture upside breakouts.
---It also respects the maximum number of long trades per day.
The script manages long positions, calculates stop losses, and adjusts long positions according to the defined rules.
Trailing Stop Mechanism
The script incorporates a dynamic trailing stop mechanism designed to protect and maximize profits for long positions. Here's how it works:
1. Initialization:
The script allows you to choose between two types of initial stop loss:
---Percentage-based: This option sets the initial stop loss as a percentage of the entry price.
---Previous day's low: This option sets the initial stop loss at the previous day's low.
2. Setting the Initial Stop Loss (`sl_long0`):
The initial stop loss (`sl_long0`) is calculated based on the chosen method:
---If "Percentage" is selected, it calculates the stop loss as a percentage of the entry price.
---If "Previous Low" is selected, it sets the stop loss at the previous day's low.
3. Dynamic Trailing Stop (`trail_long`):
The script then monitors price movements and uses a dynamic trailing stop mechanism (`trail_long`) to adjust the stop loss level for long positions.
If the current high price rises above certain pivot point levels, the trailing stop is adjusted upwards to lock in profits.
The trailing stop levels are calculated based on pivot points (`r1`, `r2`, `r3`, etc.) and half-pivot points (`r0.5`, `r1.5`, `r2.5`, etc.).
The script checks if the high price surpasses these levels and, if so, updates the trailing stop accordingly.
This dynamic trailing stop allows traders to secure profits while giving the position room to potentially capture additional gains.
4. Final Stop Loss (`sl_long`):
The script calculates the final stop loss level (`sl_long`) based on the following logic:
---If no position is open (`pos == 0`), the stop loss is set to zero, indicating there is no active stop loss.
---If a position is open (`pos == 1`), the script calculates the maximum of the initial stop loss (`sl_long0`) and the dynamic trailing stop (`trail_long`).
---This ensures that the stop loss is always set to the more conservative of the two values to protect profits.
5. Plotting the Stop Loss:
The script plots the stop loss level on the chart using the `plot` function.
It will only display the stop loss level if there is an open position (`pos == 1`) and it's not a new trading day (`not newday`).
The stop loss level is shown in red on the chart.
By combining an initial stop loss with a dynamic trailing stop based on pivot points and half-pivot points, the script aims to provide a comprehensive risk management mechanism for long positions. This allows traders to lock in profits as the price moves in their favor while maintaining a safeguard against adverse price movements.
End of Day (EOD) Exit:
The script includes an "End of Day" (EOD) exit mechanism to automatically close any open positions at the end of the trading day. This feature is designed to manage and control positions when the trading day comes to a close. Here's how it works:
1. Initialization:
At the beginning of each trading day, the script identifies a new trading day using the `is_newbar('D')` condition.
When a new trading day begins, the `newday` variable becomes `true`, indicating the start of a new trading session.
2. Plotting the "End of Day" Signal:
The script includes a plot on the chart to visually represent the "End of Day" signal. This is done using the `plot` function.
The plot is labeled "DayEnd" and is displayed as a comment on the chart. It signifies the EOD point.
3. EOD Exit Condition:
When the script detects that a new trading day has started (`newday == true`), it triggers the EOD exit condition.
At this point, the script proceeds to close all open positions that may have been active during the trading day.
4. Closing Open Positions:
The `strategy.close_all` function is used to close all open positions when the EOD exit condition is met.
This function ensures that any remaining long positions are exited, regardless of their current profit or loss.
The function also includes an `alert_message`, which can be customized to send an alert or notification when positions are closed at EOD.
Purpose of EOD Exit
The "End of Day" exit mechanism serves several essential purposes in the trading strategy:
Risk Management: It helps manage risk by ensuring that positions are not left open overnight when markets can experience increased volatility.
Capital Preservation: Closing positions at EOD can help preserve trading capital by avoiding potential adverse overnight price movements.
Rule-Based Exit: The EOD exit is rule-based and automatic, ensuring that it is consistently applied without emotions or manual intervention.
Scalability: It allows the strategy to be applied to various markets and timeframes where EOD exits may be appropriate.
By incorporating an EOD exit mechanism, the script provides a comprehensive approach to managing positions, taking profits, and minimizing risk as each trading day concludes. This can be especially important in volatile markets like cryptocurrencies, where overnight price swings can be significant.
Backtesting: The script includes a backtesting feature that allows you to test the strategy's performance over historical data. Set the start and end times for backtesting to see how the long-only strategy would have performed in the past.
Trade Execution: If you choose to use this script for live trading, make sure you understand the risks involved. It's essential to set up proper risk management, including position sizing and stop loss orders.
Monitoring: Monitor the long-only strategy's performance over time and be prepared to make adjustments as market conditions change.
Disclaimer: Trading carries a risk of capital loss. This script is provided for educational purposes and as a starting point for your own long-only strategy development. Always do your own research and consider seeking advice from a qualified financial professional before making trading decisions.

MMI Auto Backtesting StrategyDescription:
A strategy based on ATR with auto-backtesting capabilities, Take Profit and Stop Loss (either Normal or Trailing). It allows you to select ranges of values and step for each parameter, and backtest the strategy on a multitude of input combinations at once. You can alternatively use a constant value for each parameter. The backtesting results strive to be as close as possible to those given by Tradingview Strategy Tester.
The strategy displays a table with results for different input combinations. This has columns showing current input combination as well as the following stats: Net Profit, Number of trades, % of Profitable trades, Profit Factor, Max Drawdown, Max Runup, Average Trade and Average number of bars in a trade.
You can sort the table by any column (including sorting by multiple columns at the same time) to find, for example, input combination that gives highest Net Profit (or, if sorting by multiple columns, to find input combination with the best balance of Net Profit and % of Profitable trades). You can filter by any column as well (or multiple columns at the same time), using logical expressions like "< value", "> value", "<= value", ">= value". And you can use logical expressions like "< value%" for Net Profit, Max Drawdown, Max Runup and Average trade to filter by percentage value. You will see a "↓" symbol in column's header if that column is sorted from Highest to Lowest, a "↑" symbol if it's sorted from Lowest to Highest and a "𐕢" symbol if that column is being filtered.
The table has customisable styles (like text color, background color of cells, etc.), and can show the total number of backtested combinations with the time taken to test them. You can also change Initial Capital and Position Size (either Contracts, Currency or % of Equity).
Parameters:
The following parameters are located in the "INPUTS (USUAL STRATEGY)" group, and control the behaviour of strategy itself (not the auto-backtesting functionality):
- Period: ATR Length
- Multiplier: ATR Multiplier
- DPO: length of the filtering moving average
- SL: stop loss
- TP: take profit
- Use Stop Loss: enable stop loss
- Stop Loss Mode: stop loss mode (either Normal or Trailing)
- Use Take Profit: enable take profit
- Wicks: use high & low price, or close price
The strategy also has various parameters separated by different groups:
- INPUTS (AUTO-BACKTESTING): has the same parameters as the "INPUTS (USUAL STRATEGY)" group, but controls the input combinations for auto-backtesting; all the numeric parameters have 3 values: F/V (from), T (to) and S (step); if the checkbox to the left of F/V parameter is off, the value of F/V will indicate the constant value used for that parameter (if the checkbox is on, the values will be from F/V to T using step S)
- STRATEGY: contains strategy related parameters like Initial Capital and Position Size
- BACKTESTING: allows you to display either Percentage, Absolute or Both values in the table and has checkboxes that allow you to exclude certain columns from the table
- SORTING: allows you to select sorting mode (Highest to Lowest or vice versa) and has checkboxes in case you want to sort by multiple columns at the same time
- FILTERING: has a text field for each column of the strategy where you can type logical expressions to filter the values
- TABLE: contains styling parameters
Many parameters have the "(i)" description marker, so hover over it to see more details.
Problems:
- The script works best on lower timeframes and continuous markets (trades 24/7), in other cases the backtesting results may vary from those that Tradingview shows
- The script shows closest results when Take Profit and Stop Loss are not used
- Max Runup percentage value is often wrong
Limitations:
- As we are limited by the maximum time a script can be running (which is 20s for Free plan and 40s for Paid plans), we can only backtest several hundreds of combinations within that timeframe (though it depends on the parameters, market and timeframe of the chart you use)

[tradinghook] - Renko Trend Reversal Strategy V2Title: Renko Trend Reversal Strategy
Short Title: - Renko TRS
> Special thanks to for manually calculating `renkoClose` and `renkoOpen` values in order to remove the infamous repaint issue
Description:
The Renko Trend Reversal Strategy ( - Renko TRS) is a powerful and original trading approach designed to identify trend reversals in financial markets using Renko charts. Renko charts differ from traditional time-based charts, as they focus solely on price movements and ignore time, resulting in a clearer representation of market trends. This strategy leverages Renko charts in conjunction with the Average True Range (ATR) to capture trend reversals with high precision and effectiveness.
Key Concepts:
Renko Charts: Renko charts are unique chart types that only plot price movements beyond a predefined brick size, ignoring time and noise. By doing so, they provide a more straightforward depiction of market trends, eliminating insignificant price fluctuations and making it easier to spot trend reversals.
Average True Range (ATR): The strategy utilizes the ATR indicator, which measures market volatility and provides valuable insights into potential price movements. By setting the brick size of the Renko chart based on the ATR, the strategy adapts to changing market conditions, ensuring optimal performance across various instruments and timeframes.
How it Works:
The Renko Trend Reversal Strategy is designed to identify trend reversal points and generate buy or sell signals based on the following principles:
Renko Brick Generation: The strategy calculates the ATR over a user-defined period (ATR Length) and utilizes this value to determine the size of Renko bricks. Larger ATR values result in bigger bricks, capturing higher market volatility, while smaller ATR values create smaller bricks for calmer market conditions.
Buy and Sell Signals: The strategy generates buy signals when the Renko chart's open price crosses below the close price, indicating a potential bullish trend reversal. Conversely, sell signals are generated when the open price crosses above the close price, suggesting a bearish trend reversal. These signals help traders identify potential entry points to capitalize on market movements.
Stop Loss and Take Profit Management: To manage risk and protect profits, the strategy incorporates dynamic stop-loss and take-profit levels. The stop-loss level is calculated as a percentage of the Renko open price, ensuring a fixed risk amount for each trade. Similarly, the take-profit level is set as a percentage of the Renko open price to secure potential gains.
How to Use:
Inputs: Before using the strategy, traders can customize several parameters to suit their trading preferences. These inputs include the ATR Length, Stop Loss Percentage, Take Profit Percentage, Start Date, and End Date. Adjusting these settings allows users to optimize the strategy for different market conditions and risk tolerances.
Chart Setup: Apply the - Renko TRS script to your desired financial instrument and timeframe on TradingView. The Renko chart will dynamically adjust its brick size based on the ATR Length parameter.
Buy and Sell Signals: The strategy will generate green "Buy" labels below bullish reversal points and red "Sell" labels above bearish reversal points on the Renko chart. These labels indicate potential entry points for long and short trades, respectively.
Risk Management: The strategy automatically calculates stop-loss and take-profit levels based on the user-defined percentages. Traders can ensure proper risk management by using these levels to protect their capital and secure profits.
Backtesting and Optimization: Before implementing the strategy live, traders are encouraged to backtest it on historical data to assess its performance across various market conditions. Adjust the input parameters through optimization to find the most suitable settings for specific instruments and timeframes.
Conclusion:
The - Renko Trend Reversal Strategy is a unique and versatile tool for traders looking to identify trend reversals with greater accuracy. By combining Renko charts and the Average True Range (ATR) indicator, this strategy adapts to market dynamics and provides clear entry and exit signals. Traders can harness the power of Renko charts while effectively managing risk through stop-loss and take-profit levels. Before using the strategy in live trading, backtesting and optimization will help traders fine-tune the parameters for optimal performance. Start exploring trend reversals with the - Renko TRS and take your trading to the next level.
(Note: This description is for illustrative purposes only and does not constitute financial advice. Traders are advised to thoroughly test the strategy and exercise sound risk management practices when trading in real markets.)

[tradinghook] - Renko Trend Reversal Strategy - Renko Trend Reversal Strategy
Short Title: - Renko TRS
Description:
The Renko Trend Reversal Strategy ( - Renko TRS) is a powerful and original trading approach designed to identify trend reversals in financial markets using Renko charts. Renko charts differ from traditional time-based charts, as they focus solely on price movements and ignore time, resulting in a clearer representation of market trends. This strategy leverages Renko charts in conjunction with the Average True Range (ATR) to capture trend reversals with high precision and effectiveness.
Key Concepts:
Renko Charts: Renko charts are unique chart types that only plot price movements beyond a predefined brick size, ignoring time and noise. By doing so, they provide a more straightforward depiction of market trends, eliminating insignificant price fluctuations and making it easier to spot trend reversals.
Average True Range (ATR): The strategy utilizes the ATR indicator, which measures market volatility and provides valuable insights into potential price movements. By setting the brick size of the Renko chart based on the ATR, the strategy adapts to changing market conditions, ensuring optimal performance across various instruments and timeframes.
How it Works:
The Renko Trend Reversal Strategy is designed to identify trend reversal points and generate buy or sell signals based on the following principles:
Renko Brick Generation: The strategy calculates the ATR over a user-defined period (ATR Length) and utilizes this value to determine the size of Renko bricks. Larger ATR values result in bigger bricks, capturing higher market volatility, while smaller ATR values create smaller bricks for calmer market conditions.
Buy and Sell Signals: The strategy generates buy signals when the Renko chart's open price crosses below the close price, indicating a potential bullish trend reversal. Conversely, sell signals are generated when the open price crosses above the close price, suggesting a bearish trend reversal. These signals help traders identify potential entry points to capitalize on market movements.
Stop Loss and Take Profit Management: To manage risk and protect profits, the strategy incorporates dynamic stop-loss and take-profit levels. The stop-loss level is calculated as a percentage of the Renko open price, ensuring a fixed risk amount for each trade. Similarly, the take-profit level is set as a percentage of the Renko open price to secure potential gains.
How to Use:
Inputs: Before using the strategy, traders can customize several parameters to suit their trading preferences. These inputs include the ATR Length, Stop Loss Percentage, Take Profit Percentage, Start Date, and End Date. Adjusting these settings allows users to optimize the strategy for different market conditions and risk tolerances.
Chart Setup: Apply the - Renko TRS script to your desired financial instrument and timeframe on TradingView. The Renko chart will dynamically adjust its brick size based on the ATR Length parameter.
Buy and Sell Signals: The strategy will generate green "Buy" labels below bullish reversal points and red "Sell" labels above bearish reversal points on the Renko chart. These labels indicate potential entry points for long and short trades, respectively.
Risk Management: The strategy automatically calculates stop-loss and take-profit levels based on the user-defined percentages. Traders can ensure proper risk management by using these levels to protect their capital and secure profits.
Backtesting and Optimization: Before implementing the strategy live, traders are encouraged to backtest it on historical data to assess its performance across various market conditions. Adjust the input parameters through optimization to find the most suitable settings for specific instruments and timeframes.
Conclusion:
The - Renko Trend Reversal Strategy is a unique and versatile tool for traders looking to identify trend reversals with greater accuracy. By combining Renko charts and the Average True Range (ATR) indicator, this strategy adapts to market dynamics and provides clear entry and exit signals. Traders can harness the power of Renko charts while effectively managing risk through stop-loss and take-profit levels. Before using the strategy in live trading, backtesting and optimization will help traders fine-tune the parameters for optimal performance. Start exploring trend reversals with the - Renko TRS and take your trading to the next level.
(Note: This description is for illustrative purposes only and does not constitute financial advice. Traders are advised to thoroughly test the strategy and exercise sound risk management practices when trading in real markets.)

CCI+EMA Strategy with Percentage or ATR TP/SL [Alifer]This is a momentum strategy based on the Commodity Channel Index (CCI), with the aim of entering long trades in oversold conditions and short trades in overbought conditions.
Optionally, you can enable an Exponential Moving Average (EMA) to only allow trading in the direction of the larger trend. Please note that the strategy will not plot the EMA. If you want, for visual confirmation, you can add to the chart an Exponential Moving Average as a second indicator, with the same settings used in the strategy’s built-in EMA.
The strategy also allows you to set internal Stop Loss and Take Profit levels, with the option to choose between Percentage-based TP/SL or ATR-based TP/SL.
The strategy can be adapted to multiple assets and timeframes:
Pick an asset and a timeframe
Zoom back as far as possible to identify meaningful positive and negative peaks of the CCI
Set Overbought and Oversold at a rough average of the peaks you identified
Adjust TP/SL according to your risk management strategy
Like the strategy? Give it a boost!
Have any questions? Leave a comment or drop me a message.
CAUTIONARY WARNING
Please note that this is a complex trading strategy that involves several inputs and conditions. Before using it in live trading, it is highly recommended to thoroughly test it on historical data and use risk management techniques to safeguard your capital. After backtesting, it's also highly recommended to perform a first live test with a small amount. Additionally, it's essential to have a good understanding of the strategy's behavior and potential risks. Only risk what you can afford to lose .
USED INDICATORS
1 — COMMODITY CHANNEL INDEX (CCI)
The Commodity Channel Index (CCI) is a technical analysis indicator used to measure the momentum of an asset. It was developed by Donald Lambert and first published in Commodities magazine (now Futures) in 1980. Despite its name, the CCI can be used in any market and is not just for commodities. The CCI compares current price to average price over a specific time period. The indicator fluctuates above or below zero, moving into positive or negative territory. While most values, approximately 75%, fall between -100 and +100, about 25% of the values fall outside this range, indicating a lot of weakness or strength in the price movement.
The CCI was originally developed to spot long-term trend changes but has been adapted by traders for use on all markets or timeframes. Trading with multiple timeframes provides more buy or sell signals for active traders. Traders often use the CCI on the longer-term chart to establish the dominant trend and on the shorter-term chart to isolate pullbacks and generate trade signals.
CCI is calculated with the following formula:
(Typical Price - Simple Moving Average) / (0.015 x Mean Deviation)
Some trading strategies based on CCI can produce multiple false signals or losing trades when conditions turn choppy. Implementing a stop-loss strategy can help cap risk, and testing the CCI strategy for profitability on your market and timeframe is a worthy first step before initiating trades.
2 — AVERAGE TRUE RANGE (ATR)
The Average True Range (ATR) is a technical analysis indicator that measures market volatility by calculating the average range of price movements in a financial asset over a specific period of time. The ATR was developed by J. Welles Wilder Jr. and introduced in his book “New Concepts in Technical Trading Systems” in 1978.
The ATR is calculated by taking the average of the true range over a specified period. The true range is the greatest of the following:
The difference between the current high and the current low.
The difference between the previous close and the current high.
The difference between the previous close and the current low.
The ATR can be used to set stop-loss orders. One way to use ATR for stop-loss orders is to multiply the ATR by a factor (such as 2 or 3) and subtract it from the entry price for long positions or add it to the entry price for short positions. This can help traders set stop-loss orders that are more adaptive to market volatility.
3 — EXPONENTIAL MOVING AVERAGE (EMA)
The Exponential Moving Average (EMA) is a type of moving average (MA) that places a greater weight and significance on the most recent data points.
The EMA is calculated by taking the average of the true range over a specified period. The true range is the greatest of the following:
The difference between the current high and the current low.
The difference between the previous close and the current high.
The difference between the previous close and the current low.
The EMA can be used by traders to produce buy and sell signals based on crossovers and divergences from the historical average. Traders often use several different EMA lengths, such as 10-day, 50-day, and 200-day moving averages.
The formula for calculating EMA is as follows:
Compute the Simple Moving Average (SMA).
Calculate the multiplier for weighting the EMA.
Calculate the current EMA using the following formula:
EMA = Closing price x multiplier + EMA (previous day) x (1-multiplier)
STRATEGY EXPLANATION
1 — INPUTS AND PARAMETERS
The strategy uses the Commodity Channel Index (CCI) with additional options for an Exponential Moving Average (EMA), Take Profit (TP) and Stop Loss (SL).
length : The period length for the CCI calculation.
overbought : The overbought level for the CCI. When CCI crosses above this level, it may signal a potential short entry.
oversold : The oversold level for the CCI. When CCI crosses below this level, it may signal a potential long entry.
useEMA : A boolean input to enable or disable the use of Exponential Moving Average (EMA) as a filter for long and short entries.
emaLength : The period length for the EMA if it is used.
2 — CCI CALCULATION
The CCI indicator is calculated using the following formula:
(src - ma) / (0.015 * ta.dev(src, length))
src is the typical price (average of high, low, and close) and ma is the Simple Moving Average (SMA) of src over the specified length.
3 — EMA CALCULATION
If the useEMA option is enabled, an EMA is calculated with the given emaLength .
4 — TAKE PROFIT AND STOP LOSS METHODS
The strategy offers two methods for TP and SL calculations: percentage-based and ATR-based.
tpSlMethod_percentage : A boolean input to choose the percentage-based method.
tpSlMethod_atr : A boolean input to choose the ATR-based method.
5 — PERCENTAGE-BASED TP AND SL
If tpSlMethod_percentage is chosen, the strategy calculates the TP and SL levels based on a percentage of the average entry price.
tp_percentage : The percentage value for Take Profit.
sl_percentage : The percentage value for Stop Loss.
6 — ATR-BASED TP AND SL
If tpSlMethod_atr is chosen, the strategy calculates the TP and SL levels based on Average True Range (ATR).
atrLength : The period length for the ATR calculation.
atrMultiplier : A multiplier applied to the ATR to set the SL level.
riskRewardRatio : The risk-reward ratio used to calculate the TP level.
7 — ENTRY CONDITIONS
The strategy defines two conditions for entering long and short positions based on CCI and, optionally, EMA.
Long Entry: CCI crosses below the oversold level, and if useEMA is enabled, the closing price should be above the EMA.
Short Entry: CCI crosses above the overbought level, and if useEMA is enabled, the closing price should be below the EMA.
8 — TP AND SL LEVELS
The strategy calculates the TP and SL levels based on the chosen method and updates them dynamically.
For the percentage-based method, the TP and SL levels are calculated as a percentage of the average entry price.
For the ATR-based method, the TP and SL levels are calculated using the ATR value and the specified multipliers.
9 — EXIT CONDITIONS
The strategy defines exit conditions for both long and short positions.
If there is a long position, it will be closed either at TP or SL levels based on the chosen method.
If there is a short position, it will be closed either at TP or SL levels based on the chosen method.
Additionally, positions will be closed if CCI crosses back above oversold in long positions or below overbought in short positions.
10 — PLOTTING
The script plots the CCI line along with overbought and oversold levels as horizontal lines.
The CCI line is colored red when above the overbought level, green when below the oversold level, and white otherwise.
The shaded region between the overbought and oversold levels is plotted as well.

[SMA Cross + HHLL] Signal Clean Up Analysis with Backtest (TSO) This is a DEMO indicator with a simple 2 SMAs cross for signals + HHLL for TP/SL. It mainly demonstrates chained (NOTE: You can select several or ALL of the features, this is not limited to either one) signal cleanup and analysis approach with scheduling and alerting capabilities. Works with most popular timeframes: 1M, 5M, 15M, 1H, 4H, D.
===========================================================================
Here are some pre-set examples with nice Backtesting results (try em out!):
---------------------------------------------------------------------------
>>> Indexes – SPY (INTRADAY SETUP ): Timeframe: 5M | Trading Schedule: ON, 10:00-15:45 ET, EOD: At Market Close | Trading System: Open Until Closed by TP or SL | MULTIPROFIT: TP (take profit) System: Dynamic | MULTIPROFIT: SL (stop loss) System (This is only for “Dynamic” TP System ONLY!!!): Dynamic | # of TPs: 5 | Skip opposite candle types in signals, which are opposite to direction of candle color (for example: bearish green hammer) | Everything else: Default
>>> Bitcoin – BTCUSD (24/7 SETUP): Timeframe: 1H | Trading Schedule: OFF, End of Day (EOD): OFF | Trading System: Open Until Closed by TP or SL | MULTIPROFIT: TP (take profit) System: Dynamic | MULTIPROFIT: SL (stop loss) System (This is only for “Dynamic” TP System ONLY!!!): Dynamic | # of TPs: 3 | TP(s) Offset: on, TP(s) offset amount: 50 | ATR confirmation | Everything else: Default
===========================================================================
Explanation of all the Features | Configuration Guide | Indicator Settings
---------------------------------------------------------------------------
---------------------------------------------------------------------------
Signal cleanup analysis:
---------------------------------------------------------------------------
>>> Customizable Backtesting for a specific date range, results via TradingView strategy, which includes “Deep Backtesting” for largest amounts of data on trading results.
>>> Trading Schedule with customizable trading daily time range, automatic closing/alert trades before Power Hour or right before market closes or leave it open until next day.
>>> 3 Trading Systems.
>>> Static/Dynamic Take-Profit setups (HILIGHT: momentum catch dynamic Take-Profit approach).
>>> Static/Dynamic Stop-Loss setups (HIGHLIGHT: smart trailing Stop-Loss which minimizes risk).
>>> Single or Multiple profit targets (up to 5).
>>> Take-Profit customizable offset feature (set your Take-Profit targets slightly before everyone is expecting it!).
>>> Candle bar signal analysis (skip opposite structured and/or doji candle uncertain signals).
>>> Additional analysis of VWAP/EMA/ATR/EWO (Elliot Wave Oscillator)/Divergence MACD+RSI signal confirmation (clean up your chart with indicator showing only the best potential signals!).
>>> Advanced Alerts setup, which can be potentially setup with a trading bot over TradingView Webhook (NOTE: This will require advanced programming knowledge).
>>> Customize your signal SOURCE and your Take-Profit/Stop-Loss SOURCES as you desire.
===========================================================================
Labels, plots, colors explanations:
---------------------------------------------------------------------------
>>>>> Signal SOURCE: SMA crossings (green and red BIG circles) .
>>>>> Take-profit/Stop-loss SOURCE: HHLL (Highest High Lowest Low) .
>>>>> LONG open: green arrow below candle bar.
>>>>> SHORT open: red arrow above candle bar.
>>>>> LONG/SHORT take-profit target: green/red circles (multi-profit > TP2/3/4/5 smaller circles).
>>>>> LONG/SHORT take-profit hits: green/red diamonds.
>>>>> LONG/SHORT stop-loss target: green/red + crosses.
>>>>> LONG/SHORT stop-loss hits: green/red X-crosses.
>>>>> LONG/SHORT EOD close (profitable trade): green/red squares.
>>>>> LONG/SHORT EOD close (loss trade): green/red PLUS(+)-crosses.
===========================================================================
Date Range and Trading Schedule Settings
---------------------------------------------------------------------------
>>>>> Date Range: Select your start and/or end dates (uncheck “End” for indicator to show results up to the very moment and to use for LIVE trading) for backtesting results, if not using backtesting – uncheck “Start”/“End” to turn it off.
---------------------------------------------------------------------------
>>>>> Use TradingView “Strategy Tester” to see backtesting results
---------------------------------------------------------------------------
NOTE: If Strategy Tester does not show any results with Date Ranged fully unchecked, there may be an issue where a script opens a trade, but there is not enough TradingView power to set the Take-Profit and Stop-Loss and somehow an open trade gets stuck and never closes, so there are “no trades present”. In such case you will need to manually check “Start”/“End” dates or use “Depp Backtesting” feature!
---------------------------------------------------------------------------
>>>>> Trading Schedule: This is where you can setup Intraday Session or any custom session schedule you wish. Turn it ON. Select trading hours. Select EOD (End of Day) setting (NOTE: If it will be OFF, the indicator will assume you are holding your position open until next day!).
>>>>> Trading System: 1) Open Until Closed by TP or SL – once the trade is open, it can only be closed by Take-Profit, Stop-Loss or at EOD (if turned on) ||| 2) OCA – Opposite Trade will Open Closing Current Trade – Same as 1), except that when and if an OPPOSITE signal is received > indicator will close current trade immediately (profit or loss) and open a new one(NOTE: This will only happen with an OPPOSITE direction trade!) ||| 3) Open Until Opposite Signal or EOD (if turned on) – This approach is the simplest one, there are no Take-Profits or Stop-Losses, the trade is open until an OPPOSITE signal is received or until EOD (if turned on).
Take-Profit, Stop-Loss and Multi-Profit Settings
>>>>> MULTIPROFIT | TP (Take-Profit) System: 1) Static – Once the trade is open, all Take-Profit target(s) are immediately calculated and set for the trade > once the target(s) is hit > trade will be partially closed (if candle bar closes beyond several Take-Profit targets > trade will be reduced accordingly to the amount of how many Take-Profit targets were hit) ||| 2) Dynamic – Once the trade is open, only the 1st Take-Profit target is calculated, once the 1st Take-Profit is hit > next Take-Profit distance is calculated based on the distance from trade Entry to where 1st Take-Profit was taken, once 2nd Take-Profit is taken > 3rd Take-Profit is calculated per same logic, these are good for price momentum as with price speeding up – profits increase as well!
NOTE: Below 2 settings, each correspond to only 1 setting of the TP (Take-Profit) System, please pay attention to the above TP system setting before changing SL settings!
>>>>> MULTIPROFIT | SL (Stop-Loss) System : 1) Static – Once the trade is open, Stop-Loss is calculated and set for the remaining of the trade ||| 2) Dynamic – At trade open, Stop-Loss is calculated and set the same way, however once 1st Take-Profit is taken > Stop-Loss is moved to Entry, reducing the risk.
>>>>> MULTIPROFIT | SL (Stop-Loss) System : 1) Static - Once the trade is open, Stop-Loss is calculated and set for the remaining of the trade ||| 2) Dynamic – At trade open, Stop-Loss is calculated and set the same way, however with each Take-Profit taken, Stop-Loss will be moved to previous Take-Profit (TP1 taken > SL:Entry | TP2 taken > SL:TP1 | TP3 taken > SL:TP2 | TP4 taken > SL:TP3 | TP5 taken > trade closed), this is basically a smart Stop-Loss trailing system!
>>>>> # of TPs (number of take profit targets): Just like it is named, this is where you select the number of Take-Profit targets for your trading system (NOTE: If “3) Open Until Opposite Signal or EOD (if turned on)” Trading System is selected, this setting won’t do anything, since there are no TP or SLs for that system).
>>>>> TP(s) offset: This is a special feature for all Take-Profit targets, where you can turn on a customizable offset, so that if the price is almost hitting the Take-Profit target, but never actually touches it > you will capture it. This is good to use with HHLL (Highest High Lowest Low), which is pretty much a Support/Resistance as often the price will nearly touch these strong areas and turn around…
---------------------------------------------------------------------------
Dynamic/Static Take-Profit and Stop-Loss visual examples:
1) Fully Dynamic Take-Profit and Stop-Loss setup for BTCUSD
See how Take-Profit distances increase with price momentum and how Stop-Loss is following the trade reducing the risk!
2) Static/Dynamic, Static Take-Profit and Dynamic Stop-Loss setup for SPY (S&P500 ETF TRUST)
You can see a static Take-Profit set at position open, while Stop-Loss is semi-dynamic adjusting to Entry once TP1 target is taken!
3) Fully Static Take-Profit and Stop-Loss setup for SPY (S&P500 ETF TRUST)
This one is a fully static setup for both Take-Profit and Stop-Loss, you can also observe how trade is closed right before the Power Hour (trade can be closed right before Power Hour or right before Market Closes or left overnight as you desire).
---------------------------------------------------------------------------
Trade Analysis and Cleanup Settings
>>>>> Candle Analysis | Candle Color signal confirmation: If closed candle bar color does not match the signal direction > no trade will be open.
>>>>> Candle Analysis | Skip opposite candle signals: If closed candle bar color will match the signal direction, but candle structure will be opposite (for example: bearish green hammer, long high stick on top of a small green square) > no trade will be open.
>>>>> Candle Analysis | Skip doji candle signals: If closed candle bar will be the uncertain doji > no trade will be open.
>>>>> Divergence/Oscillator Analysis | EWO (Elliot Wave Oscillator) signal confirmation: LONG will only be open if at signal, EWO is green or will be at bullish slope (you can select which setting you desire), SHORT if EWO is red or will be at bearish slope.
>>>>> Divergence/Oscillator Analysis | VWAP signal confirmation: LONG will only be open if at signal, the price will be above VWAP, SHORT if below.
>>>>> Divergence/Oscillator Analysis | Moving Average signal confirmation: LONG will only be open if at signal, the price will be above selected Moving Average, SHORT if below.
>>>>> Divergence/Oscillator Analysis | ATR signal confirmation: LONG will only be open if at signal, the price will be above ATR, SHORT if below.
>>>>> Divergence/Oscillator Analysis | RSI + MACD signal confirmation: LONG will only be open if at signal, RSI + MACD will be bullish, SHORT if RSI + MACD will be bearish.
===========================================================================
Alert Settings (you don’t have to touch this section unless you will be using TradingView alerts through a Webhook to use with trading bot)
---------------------------------------------------------------------------
Here is how a LONG OPEN alert looks like (each label is customizable + I can add up more items/labels if needed):
COIN: BTCUSD
TIMEFRAME: 15M
LONG: OPEN
ENTRY: 20000
TP1: 20500
TP2: 21000
TP3: 21500
SL: 19000
Leverage: 0
===========================================================================
Trade Open Signal SOURCE + Take-Profit/Stop-Loss SOURCE
---------------------------------------------------------------------------
>>> Customize your signal SOURCE, Take-Profit and Stop-Loss SOURCE as desired (NOTE: These are pre-configured and should be usable on majority of markets, however feel free to play around with these settings as there is nearly an infinite amount of setups out there!
===========================================================================
Adding Alerts in TradngView
---------------------------------------------------------------------------
-Right-click anywhere on the TradingView chart
-Click on Add alert
-Condition: Select this indicator by it’s name
-Alert name: Whatever you want
-Hit “Create”
-Note: If you change ANY Settings within the indicator – you must DELETE the current alert and create a new one per steps above, otherwise it will continue triggering alerts per old Settings!
===========================================================================
If you have any questions or issues with the indicator, please message me directly via TradingView.
---------------------------------------------------------------------------
Good Luck! (NOTE: Trading is very risky, so please trade responsibly!)

Cyatophilum SmartStrategy MakerThis indicator allows you to use any other indicator from the TradingView library and create complex entry and exit conditions with ease thanks to several external inputs. Add risk management to your strategy and backtest it before creating alerts!
Key Features:
1 — Entry Conditions: Traders can define their entry conditions using up to three sources. They can choose from several options such as "Cross," "Crossover," "Crossunder," "Above," "Below," or "Equal" for comparing the selected sources.
2 — Entry Gates: Users can set logical gates (e.g., "AND," "OR," "XOR," "NAND," "XNOR") to combine multiple entry conditions.
3 — Exit Conditions: Similar to entry conditions, traders can define exit conditions based on two sources and select from various comparison options.
4 — Stop Loss: The indicator allows users to enable or disable a stop-loss feature. The stop-loss value is calculated based on a percentage of the base order price.
5 — Take Profit: Traders can set multiple take-profit levels by specifying the number of take profits, a base percentage, and a step value. Take profits can be defined as a percentage from the total volume or the base order.
6 — Safety Orders (DCA): The indicator supports the use of safety orders (Dollar Cost Averaging) to help manage risks. Users can set the number of safety orders, price deviation, step scale, and volume scale.
7 — Backtest Settings: Traders can define the start and end periods for backtesting their strategy. This feature allows them to analyze the performance of their strategy within specific timeframes.
8 — Alerts: The indicator provides the option to create alerts for entry, exit, stop loss, take profit, and safety orders. Users can customize the alert messages using placeholders for dynamic values like price, symbol, and order size.

DLX-NationThis Strategy is based on 8 EMAs and the RSI ( 14 Length )
Its algorism check for the trend of the market using crossover EMAs, then it waits for a 38% - 50% pullback. During this Pullback it checks the behaviour of the EMAs by making sure consolidation is coming to and end by checking if the red EMA cuts through certain candle bodies. Then it detects a takeover in the market, meaning during a pullback ( in case of a buy ) it calculates the selling volume and waits to confirm that buyers retake over the Market by calculating the candle sizes making sure the current candle is bigger than the previous candle using the 3rd EMA (if 50 EMA is below market price) then finally It checks if there is enough buying Strength ( in case of a buy ) or enough selling strength ( in case of a sell) by checking the RSI level over a certain period of time. When all these confirmations are done, it then analyses previous supports and resistence, and only sends a signal if there is not resistance for a buy and no support for a sell.
Its best for a strong bullish or bearish 1min, 5mins and 15mins market, thats why it only available on US30 and NAS100 for now. Its best when all the EMAs are spreading out or in other words the distance between the EMAs are increasing.
In case of a consolidation, you will see all EMAs moving together and in this case you shouldnt take any signal called. Following EMAs should guide you identifying a consilidation
50 EMA = Aqua
90 EMA = Green
150 EMA = Purple
200 EMA = Gray
400 EMA = Orange
800 EMA = Blue
Note: If you see all these EMA coming closer to each other, it indicates a long going consolidation and during these moments you shouldnt execute any signal. These is the reason why we decided to plot them on the Chart. We understand trading with a clean Chart is important, moreover using certain tools to be more profitable is essential. In case the 50 EMA ( Aqua ) Crosses over or below the 150 EMA ( Green ) and 200 EMA (Gray), this will indicate end of the consolidation and the signals will have more liquidity and movement.
Lastly when a signal is being called make sure the last candle is clearly bigger than the previous candles, this indicates that the buyer ( in case of a buy candle ) are clearly taking over the market or the sellers ( in case of a sell candle ) are clearly taking over the market giving you more volume and liquidity.
To optain the max Profit:
After adding the Strategy / Indicator on your Chart go to Settings -> Properties and set the Pyramiding to 30. These implies that we can have 30 consecutive buy signals in a row or sell signals in a row. We recommend an initail Balance of 2000$, but mininum 1000% and a lotsize of 10cent per pip (0.1). Strickly follow the Take Profit (100pips) and StopLoss (500pips) level that will be provided in this case also risk only 1% of your account per trade and maximun 5% per running trades.
Keep in mind, the smaller the TImeframe the more trades you will recieve and the stronger the momentum the more profitable the trade will be.

Reinforced RSI - The Quant Science This strategy was designed and written with the goal of showing and motivating the community how to integrate our 'Probabilities' module with their own script.
We have recreated one of the simplest strategies used by many traders. The strategy only trades long and uses the overbought and oversold levels on the RSI indicator.
We added stop losses and take profits to offer more dynamism to the strategy. Then the 'Probabilities' module was integrated to create a probabilistic reinforcement on each trade.
Specifically, each trade is executed, only if the past probabilities of making a profitable trade is greater than or equal to 51%. This greatly increased the performance of the strategy by avoiding possible bad trades.
The backtesting was calculated on the NASDAQ:TSLA , on 15 minutes timeframe.
The strategy works on Tesla using the following parameters:
1. Lenght: 13
2. Oversold: 40
3. Overbought: 70
4. Lookback: 50
5. Take profit: 3%
6. Stop loss: 3%
Time period: January 2021 to date.
Our Probabilities Module, used in the strategy example:

[SPOILED]SuperTrench - ETH Super ScalperHi Traders,
I'm republishing this script as I finally polished it to perfection IMO. The script uses 5 coding sections: entry, trend filter, pivot filter, take profit, and stop loss. The script mainly uses trailing as take profit; this is probably the easiest way to make a profitable scalper strategy.
Backtest capital is set to 1000 USDT, 35% equity, 0.04% commission, limited backtest date from Jan 2022 to now, backtested on ETH/USDT prep contracts 15m timeframe, result as shown below.
It looks unreal right? Hell no, I actually tested this strategy on Binance from Dec 06 to Dec 10. I got 8.29% return with 4x leverage, 50% equity setup; 75% win rate,1.58 profit factor, with 4.3% max drawdown, it is amazingly close to the backtest result.
User Manual
Entry >>> Stoch RSI:
I added 5 MA types to the Stoch RSI which is HMA/VWMA/WMA/EMA/SMA, HMA with Length setting of 5, 8 seems to be most efficient, VWMA and WMA with 8, 13 will generate less entry signals but with less entry risks.
Entry >>> R Style:
It based on price action, with candlestick makes a U turn, after 2nd candlestick confirmed, it generates entry signal, this will give you some extra entries, better leave it enabled.
Entry >>> Price Step:
This probably is the core feature of this strategy; also my secret ingredient to making this strategy this efficient. It is recommended to enable step 1-5, more steps basically means more entries, but they are not necessarily profitable.
Trend Filter >>> Price Step:
I couldn't tell you much details about how this indicator works, but it is a reliable indicator, based on price action, and I got some ideas from Demark9 indicator. The bigger the level, the stronger the filter is, please note that if 'Price Step Entries' less than Price Step Trend, entries will be ignored.
Pivot Filter >>> RSI Pivot & Pinbar Pivot:
RSI Pivot detects if the RSI signal line making U turn in certain condition, Pinbar detection combines R Style entry when price action U turn took place, these 2 pivot filter will close the trade once it is counter trend, so it better enable and leave it as is.
Trend Filter >>> Trend Magic:
Trend Magic uses CCI and ATR to calculate trend status, green means uptrend, red means downtrend, pretty straight forward, the best value for this indicator would be, 21, 34, 55, 89.
Trend Filter >>> Alpha:
This filter combines R style pivot, price step, EMA all together to detects consolidation area, because EMA was involved, so the best look back period would be around 15-35, it is best to use default value IMO, in another hands, if you need stronger filter, feel free to use 10, 18, 20, 25, 30, 35, make sure look back period should increase or decrease by 5 every time.
Take Profit and Stop Loss:
The default value for tp is set to 0.4%, but I also give you option to switch to ATR TP; you can adjust in the ATR multiplier, default ATR trailing stop loss uses 1 ATR, but you can adjust it for better drawdown tolerance. Fixed ATR SL is also given when fixed ATR is enabled. There will be a failsafe SL default set to 1% if price moves counter direction of opened position, it will close trade no matter what happens.
Enjoy :)

Miyagi BacktesterMiyagi: The attempt at mastering something for the best results.
Miyagi indicators combine multiple trigger conditions and place them in one toolbox for traders to easily use, produce alerts, backtest, reduce risk and increase profitability.
The Miyagi Backtester is a standalone backtester which is to be applied to the chart after the Miyagi indicator to be backtested.
The backtester can only backtest one script at a time, and is meant to backtest ONCE PER BAR CLOSE entries.
It is currently not possible to backtest ONCE PER BAR entries.
The backtester will allow users to all Miyagi Indicators using DCA strategies to show returns over a selectable time period.
The backtester allows leverage, and as such users should be aware of the Maximum Amount for Bot Usage and Leverage Required Calculations.
The DCA Selector switch will allow users to backtest with, or without DCA.
Static DCA is used within the backtester and allows users to see DCA Statistics on closed trades.
How to use the Miyagi Backtester
Step 1: Apply the Miyagi Indicator of Choice to backtest (4in1/10in1/Strend).
DATE AND TIME RANGE:
-Date and time range to backtest.
TRADE:
-Entry source to backtest. Please select the "Outbound Entry Signal Sender"
-Trade Direction to backtest. This can be helpful to backtest according to your strategy (long or short).
-Take Profit % to backtest. This is the percent take profit to backtest. Slippage can be accounted for on the "Properties" tab.
-Stoploss % to backtest. This is the percent stoploss to backtest.
DCA:
DCA Checkbox: Enable the DCA Checkbox to backtest with DCA. Disable it to backtest without DCA.
Leverage: Input the Leverage you will trade with.
Base Order Size (% Equity): This is the Base order (BO) size to backtest in % of equity.
Safety Order Size (% Equity): This is the Safety order (SO) size to backtest in % of equity.
Number of DCA Orders: This is the maximum amount of DCA orders to place, or total DCA orders.
Price Deviation (% from initial order): This is the percent at which the first safety is placed.
Safety Order Step Scale: This is the scale at which is applied to the deviation for the step calculation to determine next SO placement.
Safety Order Volume Scale: This is the scale at which is applied to the safety orders for the volume calculation to determine SO Volume.
Real world DCA Example:
The process is as follows.
Base Order: This is your initial order size, $100 used for Base Order
Safety Order: This is your first safety order size, which is placed at the deviation. $100 Safety Order, it is good to keep the same size as your BO for your scaling to be effective.
Price deviation: This is the deviation at which your first Safety order is placed. 0.3-0.75% used by most of our members.
Safety Order Volume Scale: This is the scale at which is applied to the safety orders for the volume calculation. Scale of 2 used, which means that SO2 = (SO1) * 2, or $200. This scaling is typical for all following orders and as such SO3 = (SO2) *2, or $400.
Safety Order Step Scale: This is the scale at which is applied to the deviation for the step calculation. This is similar to the volume scale however the last order percentage is added.
Scale of 2 used, which means that SO2 % = ((Deviation) * 2) + (SO1%). (0.5% *2) + (0.5) = 1.5%.
This scaling is typical for all following orders except that the prior deviation is used and as such SO3 = ((Prior%) * 2) + (Deviation). (1.5% * 2) +(0.5%) or 3.5%.
Total SO Number: The calculations will continue going until the last SO. It is helpful to understand the amount of SO’s and scaling determines how efficient your DCA is.
Backtester Outputs include:
Net Profit to display net profit
Daily Net Profit to estimate
Percent Profitable which shows ratio of winning trades to losing trades.
Total Trades
Winning Trades
Losing Trades (only applicable if stoploss is used)
Buy & Hold Return (of the backtested asset) to compare if the strategy used beats buy & hold return.
Avg Trade Time is very helpful to see average trade time.
Max Trade Time is very helpful to see the maximum trade time.
Total Backtested Time will return total backtested time.
Initial Capital which is taken from the Properties tab.
Max amount for Bot Usage which can be helpful to see bot usage.
Leverage Required will show you the leverage required to sustain the DCA configuration.
Total SO Deviation will allow users to see the drop coverage their DCA provides.
Max Spent which is a % of total account spent on one trade.
Max Drawdown which displays the maximum drawdown of any trade.
Max % distance from entry shows the maximum distance price went away from entry prior to the trade closing.
Max SO Used which shows the maximum number of SO's used on a single trade
Avg SO Used which shows the average number of SO's used in all closed trades.
Deals closing with BO Only calculation will show how many trades are closed without DCA.
Deals closing with 1-7 SOs calculation will show how many trades are closed with DCA, and allow for fine-tuning.
Happy Trading!
This script will be effective to backtest and produce the best settings for each timeframe and pair across all STP Scripts.
This will take a lot of the manual work out of backtesting for our users while improving profit potential.
Happy Trading!

Polaris [Loxx]Polaris is a lower timeframe, high-leverage scalping indicator. It works by scanning for volatility spikes and then calculation the likelihood that those spikes will break market structure to the upside or downside.
Settings
Volatility Type: ATR or TRD , these types will be expanded in future releases.
Volatility Multiplier: How much volatility for market structure break
Filter and source: Proprietary moving average filter period and source type
Equity Calculation Method: Fixed or compounded. This determines trade size. If fixed, then the strategy uses the same quantity per trade, if compounded the strategy uses a percentage of cash on hand as that cash grows or shrinks
% Risk Per Trade: How much you'd like to risk per trade.
Leverage Multiple: How much leverage you'd like to use
% Maintenance Margin: You can find this value posted on the exchange you use
Enabled Forced Liquidation Stop-loss?: If enabled, the strategy will liquidate at measures of leverage automatically. 10x leverage liquidates at 10% opposite move for the trade, for example. This number will be adjusted by the % Maintenance Margin determined by the exchange.
% Minimum Take Profit Cutoff: This controls whether you wish to take trades only over XX% volatility . Since this indicator is to be used for small tight scalps, this keeps you out of trades that are too small to be useful for your desired trading style
Activate Long Pullback Rule?: This controls how the trade is entered. If activated, then the entry won't occur until a pullback happens after market structure break
Activate Short Pullback Rule?: This controls how the trade is entered. If activated, then the entry won't occur until a pullback happens after market structure break
Activate Trend Flip Exits?: Force strategy to exit when trend flips from short to long and long to short
Number of Take Profits: How many take profits levels. 1-5
Activate Trailing Take Profit?: Allows you to set a trailing stop loss after TP2 his hit
Trailing Take Profit Offset Multipler: This determines when the trailing stoploss hits. It's a multiple of volatility
Activate Moving Stop-loss?: Forces the stop loss to move up as targets are reached
Where to Move Stop-loss: At which Take Profit level do we begin to move stoplosses upward with targets
Show dip buying levels: If you have a high risk appetite, these are levels where you could increase your investment size, this has no effect on the strategy but is included for if you wish to manually add to your position size
Activate Longs?: Toggles on/off Longs
Activate Longs?: Toggles on/off Shorts
The remaining settings are multiples of volatility for Take Profits and dip buying levels
UI components
Big green and red plus signs means an entry point. PTF with green and red arrows means "prepare for trend flip". Not every PTF will actually flip the trend. These are just warning shots to make you aware that a possible trend flip is coming. Labels nest to market structure breaks with numbers are the ideal entry level. You can set limit orders at these levels so as to incur less exchange fees on Binance or Bybit for example. The data window provides useful information about the current trade and targets and stoploss of the next upcoming trade giving the current price action of the asset.
Other things to note
this is an extremely high risk strategy depending on how you tune the settings. You can tune down the settings to make it less risky at the cost of profit and hit rate, but that's up to you and your trading style. This can be used all all timeframes, but is meant for timeframes below 4 hours.
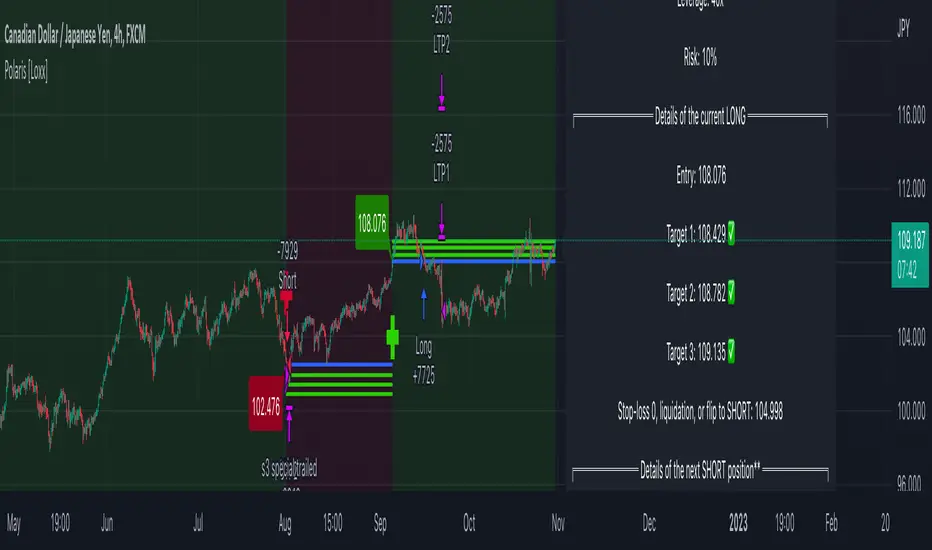
ATR Trend Run - Signals Alerts SL and TP by Tech Store OnThe script uses several ATR formulas for entering/exiting trades, support/resistance lines to take TP1 (take profit 1) and another ATR formula for TP2 (take profit 2). Everything is fully configurable to your preference, and you can back-test it via TradingView. You can also configure the indicator for signals during US trading sessions (with or without power hour), as well as taking profits/stop-loss session time(s), as well as to close a position at the end of the trading session no matter what. Also, you can turn all of that off, so there are no trading session/end of day limits and each trade will run until it either hits SL, TP1, TP1 > back to entry, TP2. Note: indicator is set to skip consecutive/opposite signals, while you currently have a trade open > if you hit a trend – ride it to the end!
For example: If you will be day trading SPY and you wish to close your positions no matter what right before the market closes (3:45PM ET > 15min before closes): Make sure to checkbox “Intraday – Close Position Before Market Closes” in the strategy/indicator Settings, so that you are alerted soon before the market closes, if you wish to continue holding the position – leave this checkbox unchecked.
SL: SL is set to be slightly above/below the signal candle, which is best suited for this strategy.
Strategy Take Profit Approach
While the initial position open and SL hit is always based on a closed candle bar (can’t do otherwise, as otherwise you will have 10s of fake signal alerts), there are 2 ways on trading this strategy in terms of TP1 and TP1 taken > back to Entry, which is based off Alert type.
You can switch this as you like within the indicator settings, “Checked: TP1 taken > back to Entry per Price Touch | Unchecked: per Candle Close”.
Candle Close vs Price Touch: with the Default method - Candle Close for an alert for TP1 or if price comes back to Entry after TP1 is taken will only be triggered once candle bar fully closes crossing the area, while Price Touch will alert when price touches the area before candle bar closes.
For example: your trade is running well, you grab TP1 and the price reverses and hits your trade Entry area. With Price Touch – you are immediately alerted to close your trade with no loss and with TP1 profit. With Candle Close - you will receive an alert only once candle bar fully closes on top of the Entry crossing it backwards, meaning it may lower your TP1 profit or even completely reverse the trade into loss in case it will be a huge candle bar for any reason. However, it may touch the Entry area, looking like the price is reversing, but then continue per initial trade direction, sometimes becoming a trend. So, while Price Touch seem like a more conservative approach, Candle Close can give you much bigger profits if you catch a trend, but you can always change it via the Settings.
Note: TradingView back-testing engine does not have a feature to open/close orders IMMEDIATELY via Price Touch trigger, but only when the candle closes after price touches the scripted area/line/etc., so you for the most accurate results, test your strategy out via Candle Close setting. Otherwise, decide yourself. I personally like more Candle Close since I can test it out via back-testing with the most accurate results.
TP2 is set per Candle Close as often the ATR trailing stop line will be hit and bounced off, so it’s best to wait until candle actually breaks it/closes through it.
Note: If you will be observing the strategy LIVE, during LIVE candle bar movement – it will look weird, like it’s placing an order after order during any trigger – this seem like a TradingView bug, but is only observational, once the candle bar is closed and you refresh TradingView it will all look correct.
Back-Testing
If you wish to do some back-testing, just modify the strategy/indicator Settings:
-----1) STRATEGY: This is for back-testing/experimenting with the script inputs.
----------a. You can setup a start date (date, month, year) from which it will start opening back-test trades, select a position size and select TP1 size, the idea here is to close half (or whatever you choose) portion of the trade once you hit your TP1, then to either close at small profit or to catch a trend and close the second portion of the position long way ahead from Entry, otherwise it will alert you to close the position at TP2, if price comes back to Entry, at reversal signal or at the end of US trading session if the option for it is checked. If you wish to close the whole position at TP1, just enter the same amount for TP1 to match backtest position size. Otherwise you can experiment with TP1 sizing – try it out!
-----2) Feel free to experiment with ATR settings and with S&R Left/Right bars, you may be amazed how results will differ and find some really cool combinations!
-----3) Make sure you select/de-select “Intraday – Close Position Before Market Closes” setting depending on what you are back-testing and on which conditions
-----4) Note: If you wish to do some deep back-testing (1+ years), use the “Deep Backtesting” feature within Strategy Tester on the TradingView as otherwise it may show wrong results or even fail to compute the results
Add the alerts
-----Right-click anywhere on the TradingView chart
-----Click on Add alert
-----Condition: ATR Trend Run - Signals Alerts SL and TP, by Tech Store On
----------o Right underneath the condition click on the drop-down menu and select “alert() function calls only”
-----Expiration time: Whatever you wish
-----Alert actions: Whatever notifications you wish
-----Alert name: DO NOT TOUCH THIS
-----Hit “Create”
-----Note: If you change ANY Settings within the indicator – you must DELETE the current alert and create a new one per steps above, otherwise it will continue triggering alerts per old Settings!
- Note: If you add the alert while the script is currently “In Position” it will not know that. So either wait when there will be no position open at all or close your position partially if the bot opens it twice bigger or so in case per script the bot will think it is already in position.
Note: Because of the slippage and the order processing time between TradingView, AutoView and the Broker (it’s usually about a second or so), it is suggested to not use a timeframe lower than 1min. The script is working really well with 1M/3M/5M/H1/H4 timeframes per my back-testing, but feel free to explore via Strategy Back-testing what’s best for the instrument you wish to trade.
If you wish to try this out for a week or so – please reach out and I will give you access.

Andromeda [Loxx]Andromeda is a lower timeframe, high-leverage scalping indicator tuned to Cryptocurrency futures trading. It works by scanning for volatility spikes and then calculation the likelihood that those spikes will break market structure to the upside or downside.
Settings
Volatility Type: ATR or TRD, these types will be expanded in future releases.
Signal Speed: How quickly you'd like signals to flow in
Equity Calculation Method: Fixed or compounded. This determines trade size. If fixed, then the strategy uses the same quantity per trade, if compounded the strategy uses a percentage of cash on hand as that cash grows or shrinks
% Risk Per Trade: How much you'd like to risk per trade.
Leverage Multiple: How much leverage you'd like to use
% Maintenance Margin: You can find this value posted on the exchange you use
Enabled Forced Liquidation Stop-loss?: If enabled, the strategy will liquidate at measures of leverage automatically. 10x leverage liquidates at 10% opposite move for the trade, for example. This number will be adjusted by the % Maintenance Margin determined by the exchange.
% Minimum Take Profit Cutoff: This controls whether you wish to take trades only over XX% volatility. Since this indicator is to be used for small tight scalps, this keeps you out of trades that are too small to be useful for your desired trading style
Activate Long Pullback Rule?: This controls how the trade is entered. If activated, then the entry won't occur until a pullback happens after market structure break
Activate Short Pullback Rule?: This controls how the trade is entered. If activated, then the entry won't occur until a pullback happens after market structure break
Activate Trend Flip Exits?: Force strategy to exit when trend flips from short to long and long to short
Number of Take Profits: How many take profits levels. 1-5
Activate Trailing Take Profit?: Allows you to set a trailing stop loss after TP2 his hit
Trailing Take Profit Offset Multipler: This determines when the trailing stoploss hits. It's a multiple of volatility
Activate Moving Stop-loss?: Forces the stop loss to move up as targets are reached
Where to Move Stop-loss: At which Take Profit level do we begin to move stoplosses upward with targets
Show dip buying levels: If you have a high risk appetite, these are levels where you could increase your investment size, this has no effect on the strategy but is included for if you wish to manually add to your position size
Activate Longs?: Toggles on/off Longs
Activate Longs?: Toggles on/off Shorts
The remaining settings are multiples of volatility for Take Profits and dip buying levels
UI components
Big green and red plus signs means an entry point. PTF with green and red arrows means "prepare for trend flip". Not every PTF will actually flip the trend. These are just warning shots to make you aware that a possible trend flip is coming. Labels nest to market structure breaks with numbers are the ideal entry level. You can set limit orders at these levels so as to incur less exchange fees on Binance or Bybit for example. The data window provides useful information about the current trade and targets and stoploss of the next upcoming trade giving the current price action of the asset.
Other things to note
this is an extremely high risk strategy depending on how you tune the settings. You can tune down the settings to make it less risky at the cost of profit and hit rate, but that's up to you and your trading style. This can be used all all timeframes, but is meant for timeframes below 4 hours.

MACD with Support and Resistance - Signals, Alerts, TP and SLMACD with Support and Resistance - Signals Alerts SL and TP by Tech Store On
The script uses MACD for entering/exiting trades and support/resistance lines to take TP1 (take profit 1). Both MACD and support/resistance lines are fully configurable to your preference, and you can back-test it via TradingView. Once TP1 is taken, you can either set the indicator to close the trade at the end of the US trading session day (4PM ET) or you can continue taking partial profits where you wish or just wait until reversal signal alert.
For example: If you will be day trading SPY and you wish to close your positions no matter what right before the market closes (3:45PM ET > 15min before closes): Make sure to checkbox “Intraday – Close Position Before Market Closes” in the strategy/indicator Settings, so that you are alerted soon before the market closes, if you wish to continue holding the position – leave this checkbox unchecked.
SL: SL is set to be slightly above/below the MACD signal candle, which is best suited for this strategy from manual backtesting.
Strategy Take Profit Approach
While the initial position open and SL hit is always based on a closed candle bar (can’t do otherwise, as otherwise you will have 10s of fake signal alerts), there are 2 ways on trading this strategy in terms of TP1 / TP1 taken > back to Entry, which is based off Alert type.
You can switch this as you like within the indicator settings, “Checked: TP1/TP1 taken > back to Entry per Price Touch | Unchecked: per Candle Close”.
Candle Close vs Price Touch: with the Default method - Candle Close for an alert for TP1 or if price comes back to Entry after TP1 is taken will only be triggered once candle bar fully closes crossing the area, while Price Touch will alert when price touches the area before candle bar closes.
For example: your trade is running well, you grab TP1 and the price reverses and hits your trade Entry area. With Price Touch – you are immediately alerted to close your trade with no loss and with TP1 profit. With Candle Close - you will receive an alert only once candle bar fully closes on top of the Entry crossing it backwards, meaning it may lower your TP1 profit or even completely reverse the trade into loss in case it will be a huge candle bar for any reason. However, it may touch the Entry area, looking like the price is reversing, but then continue per initial trade direction, sometimes becoming a trend. So, while Price Touch seem like a more conservative approach, Candle Close can give you much bigger profits if you catch a trend, but you can always change it via the Settings.
Note: TradingView back-testing engine does not have a feature to open/close orders IMMEDIATELY via Price Touch trigger, but only when the candle closes after price touches the scripted area/line/etc., so you for the most accurate results, test your strategy out via Candle Close setting. Otherwise, decide yourself. I personally like more Candle Close since I can test it out via back-testing with the most accurate results.
Note: If you will be observing the strategy LIVE, during LIVE candle bar movement – it will look weird, like it’s placing an order after order during any trigger – this seem like a TradingView bug, but is only observational, once the candle bar is closed and you refresh TradingView it will all look correct.
Back-Testing
If you wish to do some back-testing, just modify the strategy/indicator Settings:
-----1) STRATEGY: This is for back-testing/experimenting with the script inputs.
----------a. You can setup a start date (date, month, year) from which it will start opening back-test trades, select a position size and select TP1 size, the idea here is to close half (or whatever you choose) portion of the trade once you hit your TP1, then to either close at small profit or to catch a trend and close the second portion of the position long way ahead from Entry, otherwise it will alert you to close the position if price comes back to Entry, at reversal signal or at the end of US trading session if the option for it is checked. If you wish to close the whole position at TP1, just enter the same amount for TP1 to match backtest position size. Otherwise you can experiment with TP1 sizing – try it out!
-----2) Feel free to experiment with MACD settings and with S&R Left/Right bars, you may be amazed how results will differ and find some really cool combinations!
-----3) Make sure you select/de-select “Intraday – Close Position Before Market Closes” setting depending on what you are back-testing and on which conditions
-----4) Note: If you wish to do some deep back-testing (1+ years), use the “Deep Backtesting” feature within Strategy Tester on the TradingView as otherwise it may show wrong results or even fail to compute the results
Add the alerts
-----Right-click anywhere on the TradingView chart
-----Click on Add alert
-----Condition: MACD with Support and Resistance - Signals
----------o Right underneath the condition click on the drop-down menu and select “alert() function calls only”
-----Expiration time: Whatever you wish
-----Alert actions: Whatever notifications you wish
-----Alert name: DO NOT TOUCH THIS
-----Hit “Create”
-----Note: If you change ANY Settings within the indicator – you must DELETE the current alert and create a new one per steps above, otherwise it will continue triggering alerts per old Settings!
- Note: If you add the alert while the script is currently “In Position” it will not know that. So either wait when there will be no position open at all or close your position partially if the bot opens it twice bigger or so in case per script the bot will think it is already in position.
Note: Because of the slippage and the order processing time between TradingView, AutoView and the Broker (it’s usually about a second or so), it is suggested to not use a timeframe lower than 1min. The script is working really well with 15M/H1 timeframes per my back-testing, but feel free to explore via Strategy Back-testing what’s best for the instrument you wish to trade.
