Multiple MAsHere's a well-written description in English for your "Multiple MAs" indicator that you can use when publishing on TradingView. It’s concise, professional, and highlights the key features of the indicator while explaining its purpose for traders.
---
### Multiple MAs Indicator
#### Overview
The **Multiple MAs** indicator is a versatile and straightforward tool designed to help traders visualize price trends using multiple Simple Moving Averages (SMAs) on a single chart. By plotting six SMAs with customizable lengths (MA5, MA10, MA20, MA50, MA100, and MA200), this indicator provides a clear view of short-term, medium-term, and long-term trends, making it ideal for trend-following strategies, crossover analysis, and identifying potential support/resistance levels.
#### Features
- **Customizable MA Lengths**: Adjust the periods of all six moving averages (MA5, MA10, MA20, MA50, MA100, MA200) to suit your trading style and timeframe.
- **Distinct Visuals**: Each MA is plotted with a unique color and line width for easy identification:
- MA5 (Dodger Blue, 1px)
- MA10 (Green, 1px)
- MA20 (Red, 2px)
- MA50 (Purple, 3px)
- MA100 (Gray, 3px)
- MA200 (White, 3px)
- **Overlay on Price Chart**: The indicator overlays directly on the price chart, allowing for seamless integration with other technical analysis tools.
- **High Precision**: Displays values with 8-decimal precision, ensuring accuracy for assets with small price movements (e.g., forex pairs or cryptocurrencies).
#### How to Use
1. **Trend Identification**: Use the longer MAs (e.g., MA100, MA200) to determine the overall trend direction. If the price is above these MAs, the trend is likely bullish; if below, it’s likely bearish.
2. **Crossover Signals**: Look for crossovers between shorter MAs (e.g., MA5 crossing MA20) for potential entry or exit signals. For example:
- A bullish signal occurs when a shorter MA crosses above a longer MA.
- A bearish signal occurs when a shorter MA crosses below a longer MA.
3. **Support and Resistance**: MAs often act as dynamic support or resistance levels. Watch for price reactions around these lines, especially the MA50, MA100, and MA200.
4. **Divergence Analysis**: Compare the slope of different MAs to identify potential trend reversals or weakening momentum.
#### Settings
- **MA5 Length**: Default is 5 bars.
- **MA10 Length**: Default is 10 bars.
- **MA20 Length**: Default is 20 bars.
- **MA50 Length**: Default is 50 bars.
- **MA100 Length**: Default is 100 bars.
- **MA200 Length**: Default is 200 bars.
#### Best Practices
- **Timeframe**: This indicator works on any timeframe but is particularly effective on daily, 4-hour, and 1-hour charts for swing trading or trend-following strategies.
- **Combine with Other Tools**: Pair the Multiple MAs with other indicators like RSI, MACD, or volume analysis to confirm signals and avoid false breakouts.
- **Adjust for Volatility**: For highly volatile assets, consider increasing the MA lengths to reduce noise and focus on broader trends.
#### Notes
- The indicator is lightweight and optimized for performance, ensuring it runs smoothly even on lower timeframes.
- Colors and line widths are pre-set for clarity but can be customized in the indicator settings if needed.
#### Credits
Created by kosar_v. Feedback and suggestions are welcome to improve this tool for the TradingView community!
"swing trading" için komut dosyalarını ara

[TehThomas] - ICT Inversion Fair value Gap (IFVG) The Inversion Fair Value Gap (IFVG) indicator is a powerful tool designed for traders who utilize ICT (Inner Circle Trader) strategies. It focuses on identifying and displaying Inversion Fair Value Gaps, which are critical zones that emerge when traditional Fair Value Gaps (FVGs) are invalidated by price action. These gaps represent key areas where price often reacts, making them essential for identifying potential reversals, trend continuations, and liquidity zones.
What Are Inversion Fair Value Gaps?
Inversion Fair Value Gaps occur when price revisits a traditional FVG and breaks through it, effectively flipping its role in the market. For example:
A bullish FVG that is invalidated becomes a bearish zone, often acting as resistance.
A bearish FVG that is invalidated transforms into a bullish zone, serving as support.
These gaps are significant because they often align with institutional trading activity. They highlight areas where large orders have been executed or where liquidity has been targeted. Understanding these gaps provides traders with a deeper insight into market structure and helps them anticipate future price movements with greater accuracy.
Why This Strategy Works
The IFVG concept is rooted in ICT principles, which emphasize liquidity dynamics, market inefficiencies, and institutional order flow. Traditional FVGs represent imbalances in price action caused by gaps between candles. When these gaps are invalidated, they become inversion zones that can act as magnets for price. These zones frequently serve as high-probability areas for price reversals or trend continuations.
This strategy works because it aligns with how institutional traders operate. Inversion gaps often mark areas of interest for "smart money," making them reliable indicators of potential market turning points. By focusing on these zones, traders can align their strategies with institutional behavior and improve their overall trading edge.
How the Indicator Works
This indicator simplifies the process of identifying and tracking IFVGs by automating their detection and visualization on the chart. It scans the chart in real-time to identify bullish and bearish FVGs that meet user-defined thresholds for inversion. Once identified, these gaps are dynamically displayed on the chart with distinct colors for bullish and bearish zones.
The indicator also tracks whether these gaps are mitigated or broken by price action. When an IFVG is broken, it extends the zone for a user-defined number of bars to visualize its potential role as a new support or resistance level. Additionally, alerts can be enabled to notify traders when new IFVGs form or when existing ones are broken, ensuring timely decision-making in fast-moving markets.
Key Features
Automatic Detection: The indicator automatically identifies bullish and bearish IFVGs based on user-defined thresholds.
Dynamic Visualization: It displays IFVGs directly on the chart with customizable colors for easy differentiation.
Real-Time Updates: The status of each IFVG is updated dynamically based on price action.
Zone Extensions: Broken IFVGs are extended to visualize their potential as support or resistance levels.
Alerts: Notifications can be set up to alert traders when key events occur, such as the formation or breaking of an IFVG.
These features make the tool highly efficient and reduce the need for manual analysis, allowing traders to focus on execution rather than tedious chart work.
Benefits of Using This Indicator
The IFVG indicator offers several advantages that make it an indispensable tool for ICT traders. By automating the detection of inversion gaps, it saves time and reduces errors in analysis. The clearly defined zones improve risk management by providing precise entry points, stop-loss levels, and profit targets based on market structure.
This tool is also highly versatile and adapts seamlessly across different timeframes. Whether you’re scalping lower timeframes or swing trading higher ones, it provides actionable insights tailored to your trading style. Furthermore, by aligning your strategy with institutional logic, you gain a significant edge in anticipating market movements.
Practical Applications
This indicator can be used across various trading styles:
Scalping: Identify quick reversal points on lower timeframes using real-time alerts.
Day Trading: Use inversion gaps as key levels for intraday support/resistance or trend continuation setups.
Swing Trading: Analyse higher timeframes to identify major inversion zones that could act as critical turning points in larger trends.
By integrating this tool into your trading routine, you can streamline your analysis process and focus on executing high-probability setups.
Conclusion
The Inversion Fair Value Gap (IFVG) indicator is more than just a technical analysis tool—it’s a strategic ally for traders looking to refine their edge in the markets. By automating the detection and tracking of inversion gaps based on ICT principles, it simplifies complex market analysis while maintaining accuracy and depth. Whether you’re new to ICT strategies or an experienced trader seeking greater precision, this indicator will elevate your trading game by aligning your approach with institutional behavior.
If you’re serious about improving your trading results while saving time and effort, this tool is an essential addition to your toolkit. It provides clarity in chaotic markets, enhances precision in trade execution, and ensures you never miss critical opportunities in your trading journey.
__________________________________________
Thanks for your support!
If you found this idea helpful or learned something new, drop a like 👍 and leave a comment, I’d love to hear your thoughts! 🚀
Make sure to follow me for more price action insights, free indicators, and trading strategies. Let’s grow and trade smarter together! 📈

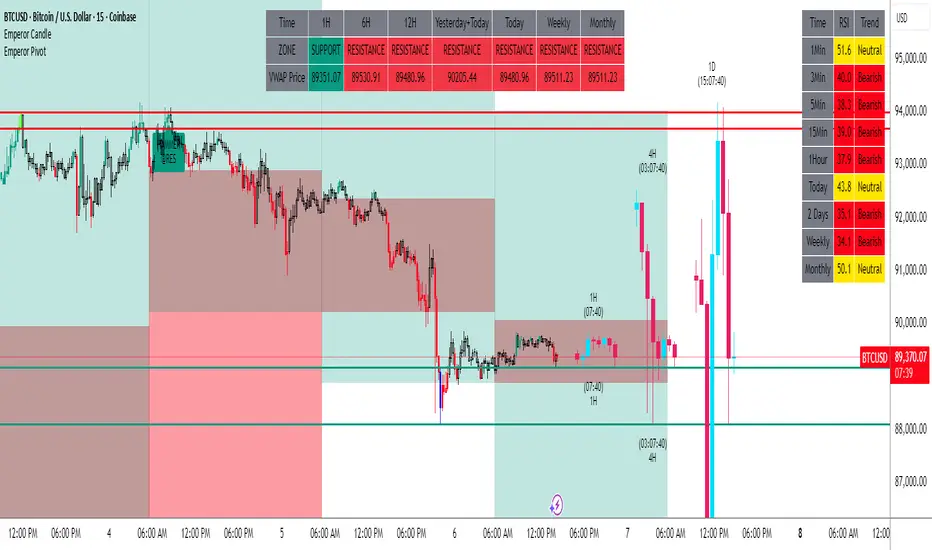
Emperor RSI CandleDescription:
The Emperor RSI Candle is a real-time, non-lagging trading indicator that colors candles based on RSI (Relative Strength Index) levels. It offers instant visual feedback on market momentum, making it easy to identify trend strength, overbought/oversold zones, and potential reversals with precision.
Unlike traditional RSI indicators, which display RSI values in a separate panel, Emperor RSI Candle integrates RSI signals directly into the candles, providing a cleaner, more intuitive charting experience. Its multi-timeframe RSI box shows RSI values across different timeframes, offering confluence confirmation for better trade decisions.
🔥 Emperor RSI Candle is original because it includes a multi-timeframe RSI box that displays RSI values from:
1 min → Monthly timeframes simultaneously.
📊 How this is unique:
Traders can instantly compare RSI values across different timeframes.
This helps them spot confluence and divergences, which is not possible with standard RSI indicators.
The multi-timeframe confluence feature makes the indicator highly effective for both short-term and long-term traders.
🚀 What the script does:
Real-time candle coloring based on RSI levels.
Multi-timeframe RSI box for confluence insights.
Customizable RSI settings for adaptability.
How it benefits traders:
Instant visual feedback for momentum and reversals.
No lag signals for precise trading decisions.
Flexible customization for different trading styles.
Unique visual signals:
Green, red, parrot green, and blue candles → Clearly indicating bullish/bearish momentum and overbought/oversold zones.
Multi-timeframe RSI box → For cross-timeframe confluence.
⚡️ 🔥 UNIQUE FEATURES 🔥:
✅ Multi-Timeframe RSI Box:
Displays RSI values from 1 min to monthly timeframes, helping traders confirm confluence across different timeframes.
✅ Fully Customizable RSI Levels & Display:
Modify RSI thresholds, source, and appearance to fit your trading style.
✅ Dynamic Candle Borders for Weak Signals:
Green border → Weak bullishness (RSI between 50-60).
Red border → Weak bearishness (RSI between 40-50).
✅ Lag-Free, Real-Time Accuracy:
No repainting or delay—instant visual signals for accurate decisions.
✅ Scalable for Any Trading Style:
Perfect for both intraday scalping and positional trading.
📊 🔥 HOW IT WORKS 🔥:
The indicator dynamically colors candles based on RSI values, providing real-time visual signals:
🟢 Above 60 RSI → Green candle:
Indicates bullish momentum, signaling potential upward continuation.
🟩 Above 80 RSI → Parrot green candle:
Overbought zone → Possible reversal or profit booking.
🟥 Below 40 RSI → Red candle:
Signals bearish momentum, indicating potential downward continuation.
🔵 Below 20 RSI → Blue candle:
Oversold zone → Possible reversal opportunity.
🔲 Neutral candles:
50-60 RSI → Green border: Weak bullishness.
40-50 RSI → Red border: Weak bearishness.
📊 🔥 MULTI-TIMEFRAME RSI BOX 🔥:
The Emperor RSI Candle includes an RSI box displaying multi-timeframe RSI values from 1 min to monthly. This provides:
✅ Confluence confirmation:
Compare RSI across multiple timeframes to strengthen trade conviction.
✅ Spot divergences:
Identify hidden trends by comparing smaller and larger timeframes.
✅ Validate trade entries/exits:
Use higher timeframe RSI to confirm smaller timeframe signals
⚙️ 🔥 HOW TO USE IT 🔥:
To maximize the accuracy and clarity of Emperor RSI Candle, follow these steps:
🔧 STEP 1: Chart Settings Configuration
Go to Chart Settings → Symbols
Uncheck the following options:
Body
Borders
Wick
✅ This ensures that only the Emperor Candle colors are visible, making the signals clear and distinct.
🔧 STEP 2: Style Settings for Emperor Candle
After applying the Emperor RSI Candle:
Go to Settings → Style tab
Wick section:
Select Color 2 and Color 3 → Set Opacity to 100%.
Border section:
Select Color 2 and Color 3 → Set Opacity to 100%.
✅ This ensures the candles display with full visibility and accurate colors.
⚙️ 🔥 CUSTOMIZATION OPTIONS 🔥:
Emperor RSI Candle offers full flexibility to match your trading style:
✅ RSI Length:
Modify the period used for RSI calculation (default: 10).
✅ Top & Bottom Levels:
Adjust the overbought (default: 80) and oversold (default: 20) thresholds.
✅ Intermediate Levels:
Up Level: Default: 60 → Bullish RSI threshold.
Down Level: Default: 40 → Bearish RSI threshold.
Mid Level: Default: 50 → Neutral zone.
✅ RSI Source:
Select the price source for RSI calculation (Close, Open, High, Low).
✅ RSI Period:
Customize the RSI calculation period (default: 10).
✅ Font Size:
Adjust the RSI box font size for better visibility.
✅ Box Position:
Choose where to display the RSI box:
Top Left / Top Center / Top Right
Bottom Left / Bottom Center / Bottom Right
💡 🔥 HOW IT IMPROVES TRADING 🔥:
✅ Clear trend identification:
Instantly recognize bullish, bearish, or neutral conditions through candle colors.
✅ Precise entries and exits:
Spot overbought and oversold zones with visual clarity.
✅ Multi-timeframe confirmation:
Validate trades with RSI confluence across multiple timeframes.
✅ No lag, real-time accuracy:
Immediate visual signals for faster and more reliable trade decisions.
✅ Customizable settings:
Tailor the indicator to fit your trading strategy and preferences.
✅ Works for all trading styles:
Suitable for scalping, day trading, and swing trading.
🔥How Traders Can Use Emperor RSI Candle for Trading:
🟢 Green Candles (Above 60 RSI) → Bullish Momentum:
Indicates strong upward movement → Ideal for long entries.
Traders can hold until RSI approaches 80 for profit booking.
🟥 Red Candles (Below 40 RSI) → Bearish Momentum:
Signals strong downward movement → Ideal for short trades.
Traders can exit or book profits near RSI 20.
2. Spotting Overbought and Oversold Zones for Reversals:
🟩 Parrot Green Candles (Above 80 RSI) → Overbought Zone:
Indicates potential for reversals or profit booking.
Traders can tighten stop-losses or exit positions.
🔵 Blue Candles (Below 20 RSI) → Oversold Zone:
Signals a potential reversal opportunity.
Traders can look for buy signals with confluence confirmation.
3. Catching Weak Bullish and Bearish Trends with Border Colors:
🟢 Green Border (RSI 50-60) → Weak Bullishness:
Indicates mild upward momentum.
Traders can consider cautious long entries.
🔴 Red Border (RSI 40-50) → Weak Bearishness:
Indicates mild downward pressure.
Traders can consider cautious short entries.
4. Using the RSI Multi-Timeframe Box for Confluence:
✅ Displays RSI values from 1 min to monthly timeframes.
Usage:
Confluence confirmation:
Multiple timeframes showing bullish RSI → Strong uptrend → Reliable buy signals.
Multiple timeframes showing bearish RSI → Strong downtrend → Reliable sell signals.
Spotting divergences:
If lower timeframes are bullish but higher timeframes are bearish, it indicates a potential reversal.
5. Customization Tips for Different Trading Styles:
✅ For Scalping:
Use a smaller RSI period (9-10) for faster signals.
Check the multi-timeframe RSI box to confirm signals quickly.
✅ For Swing Trading:
Use the default RSI period (14-15) for more accurate signals.
Focus on higher timeframes (1 hr, 4 hr, daily) for stronger trend confirmation.
Enhanced Bar Count IndicatorThe Enhanced Bar Count Indicato r is a versatile tool designed for traders who follow price action methodologies, particularly those inspired by Al Brooks. Built for TradingView and optimized for 5-minute charts during Regular Trading Hours, this indicator combines bar counting with multiple analytical features to help traders identify key market moments, trends, and potential reversal points. While it excels on intraday timeframes, its customizable settings make it adaptable to various trading styles and timeframes.
Key Features
Bar Counting and Diamond Placement
At its core, the indicator numbers each bar starting from the beginning of the trading day, helping traders keep track of bar sequences without manual counting. It highlights specific bars—such as the 7th, 18th, 40th, 48th, 67th, and 73rd bars—with colored diamonds. These bars are significant in Al Brooks’ trading approach for identifying potential reversals or key price action setups:
Bar 7 (Purple Diamond): Occurring around 35 minutes into the session, this bar often marks the end of the initial market open phase, signaling potential opening reversals or the formation of double tops/bottoms.
Bar 18 (Green Diamond): Statistically significant for marking the high or low of the day, making it a critical point for assessing potential trend reversals.
Bar 40 (Red Diamond): Positioned around midday, this bar is often associated with reversal opportunities as the market shifts from morning to afternoon trading.
Bar 48 (Purple Diamond): Around 11:50 AM EST, this bar signals the start of the afternoon swing setup, offering opportunities for midday swing trades.
Bar 67 (Purple Diamond): Appearing in the last hour (around 2:35 PM EST), this bar is key for late-day swing setups, often used for end-of-day strategies like buy-the-close or sell-the-close.
Bar 73 (Purple Diamond): Tied to a 12:30 PM PDT (3:30 PM EST) setup, this bar is significant for US market traders as a late-session decision point for trend continuation or reversal.
This feature allows traders to spot these critical bars at a glance, aligning with Al Brooks’ methodology for intraday trading.
Customizable 10-Period EMA for Scalping
A customizable 10-period Exponential Moving Average (EMA) is included to help scalpers quickly assess short-term trends. By default, it’s set to 10 periods, but users can adjust both the period and color to suit their strategy. When the price is above the EMA, it suggests an uptrend; below it, a downtrend. Scalpers can use pullbacks to the EMA as potential entry points in the direction of the trend. While optimized for 2-minute charts, it also provides valuable context on 5-minute charts for intraday traders.
Multi-Timeframe 20-Period EMAs
To provide a broader trend perspective, the indicator plots 20-period EMAs from three different timeframes—5-minute, 15-minute, and 60-minute—directly on the chart. This allows traders to see how the trend aligns across multiple timeframes, which is crucial for confirming the strength and direction of a move. Each EMA is toggleable and color-coded:
Green for 5m
Orange for 15m
Red for 60m
For instance, if all three EMAs are sloping upwards, it reinforces a strong uptrend, increasing the probability of successful trades in that direction.
Inside/Outside Bar Detection
The indicator automatically detects and marks inside bars with an 'i' and outside bars with an 'O' above the respective bars. Inside bars (where the high is lower than the previous high and the low is higher than the previous low) often signal consolidation and potential breakouts. Outside bars (where the high is higher and the low is lower than the previous bar) indicate increased volatility and possible trend reversals or continuations. These markers help traders quickly spot these patterns, which are essential for timing entries and exits in both range-bound and trending markets.
50% Pullback Retracement
Dynamic support and resistance levels are provided through the 50% retracement (midpoint) of the current and previous day’s price ranges. These levels are plotted as horizontal lines:
A solid line for the current day’s midpoint.
A dashed line for the previous day’s midpoint.
The lines are color-coded—green if below the current price and red if above—helping traders visualize potential reversal or continuation zones. This feature aligns with Fibonacci retracement principles and is particularly useful for intraday traders looking to identify areas where price might stall or reverse.
Customization and Usage
All features in the indicator are toggleable, allowing traders to enable or disable them based on their preferences. The settings are organized into groups—such as 'Bar Counting,' '10 EMA Scalp,' and 'Multi-Timeframe EMAs'—for easy navigation. This flexibility ensures that the indicator can be tailored to various trading styles, from scalping to swing trading. Traders can experiment with different combinations of features to find what works best for their strategy.
The Enhanced Bar Count Indicator is a comprehensive tool that brings together bar counting, trend analysis, pattern recognition, and dynamic support/resistance levels. Inspired by Al Brooks’ price action methodology, it offers traders a multifaceted approach to analyzing the markets. With its customizable and toggleable features, it adapts to different trading styles and timeframes, making it a valuable addition to any trader’s toolkit. Best of all, it’s available for free to the TradingView community—feel free to explore, customize, and integrate it into your trading strategy.

ICT Concepts [SB]ICT Market Structure Shift (MSS) Alert Indicator
This indicator identifies Market Structure Shifts (MSS) based on ICT concepts, helping traders spot key reversal or continuation points in price action.
Features:
✅ Detects bullish and bearish MSS using swing highs and swing lows.
✅ Customizable lookback period to fine-tune structure identification.
✅ Alerts for confirmed MSS when price breaks structure with momentum.
✅ Option to filter MSS by higher timeframe bias for confluence.
✅ Highlights liquidity sweeps before a shift to confirm smart money activity.
✅ Works on all timeframes and asset classes, including Forex, Stocks, Crypto, and Futures.
How It Works:
Bullish MSS: Occurs when price breaks above a recent swing high after taking out a previous swing low (liquidity grab).
Bearish MSS: Occurs when price breaks below a recent swing low after taking out a previous swing high.
Can be used standalone or combined with FVGs, Order Blocks, and Premium/Discount zones for high-probability setups.
Best Usage:
Scalping: 1m–5m timeframe for intraday reversals.
Intraday Trading: 15m–1H for session-based structure shifts.
Swing Trading: 4H–Daily for macro trend reversals.
Look for retest of MSS for entries after they fail as appears in chart highlighted by green horizontal lines or FVG to support after shifts.
Perfect for traders who use ICT, Smart Money Concepts (SMC), and Market Structure-based strategies.
CandelaCharts - Fractal Range Model📝 Overview
The Fractal Range Model (FRM) is an all-encompassing and sophisticated trading framework that incorporates multiple market dynamics to provide a deeper understanding of price movements.
This model is built around several key principles, including Market Swing Points, Sweeps, Candle Mean, and Change in State of Delivery (CISD), which together offer a nuanced and effective approach to trading.
At its core, the model focuses on Market Swing Points, which represent crucial turning points in the market where price action shifts direction.
These points provide insight into potential reversals and momentum changes, allowing traders to identify key support and resistance areas.
Recognizing these swings is critical in anticipating future price movements and understanding the market’s underlying structure.
The Fractal Range Model (FRM) is a versatile trading strategy that adapts to various styles, whether you're into scalping, day trading, swing trading, or long-term investment. Its flexibility makes it suitable for traders with different time horizons and risk preferences, allowing it to be effectively applied across multiple market conditions.
📦 Features
Timeframe Alignment: This indicator reveals lower Timeframe movements within higher Timeframe candles, offering insights into micro trends, structure shifts, and key entry points.
Bias Selection: This feature lets analysts control bias and setup detection, viewing bullish, bearish, or neutral formations to align with higher Timeframe trends.
Double Purge Sweeps: A double purge is a type of Sweep where the price exceeds both the high and low of the previous candle (via wicks) and then closes within the range of the prior candle.
Time Filters: Sync Time and price by selecting custom Time windows to focus on relevant formations.
Higher Timeframe Candles: The Fractal Range Model integrates ICT Power of Three, helping traders spot key turning points and market transitions across Timeframes.
Higher Timeframe PD Arrays: The HTF PD Arrays (FVG, IFVG) are key points of interest that indicate significant market levels where valid sweeps are likely to occur.
Lower Timeframe PD Arrays: The LTF PD Arrays (FVG, IFVG), on the other hand, are used for identifying entry points.
Smart Money Technique: In the context of the Fractal Range Model (FRM), the SMT (Smart Money Technique) serves as a crucial confluence indicator that strengthens the reliability of a formed model.
Info Panel: Display a customizable table with key details like timeframe pairing, time to next candle close, bias, and time filter settings, with full control over size, location, and borders.
Suitable for any Market: Ideal for all markets - stocks, forex, crypto, futures, commodities and more - delivering consistent results and insights across diverse trading environments.
⚙️ Settings
Core
Status: Filter models based on status
Bias: Controls what model type will be displayed, bullish or bearish
Fractal: Controls the timeframe pairing will be used
Mean: Plots the equilibrium of the previous HTF candle
Liquidity: Displays the liquidity levels that belongs to the model
Sweep: Shows the sweep that forms a model
I-sweep: Controls the visibility of invalidated sweeps
D-purge: Plots the double purge sweeps
CISD: Displays the Change In State of Delivery for a model
Labels: Adjust the HTF candle label size
C-area: Highlights the region between current candle open and previous candle equilibrium
History
History: Controls the mount of past models displayed on the chart
Filters
Asia: Filter models based on Asia Killzone hours
London: Filter models based on London Killzone hours
NY AM: Filter models based on NY AM Killzone hours
NY Launch: Filter models based on NY Launch Killzone hours
NY PM: Filter models based on NY PM Killzone hours
Custom: Filter models based on user Custom hours
HTF
Candles: Controls the number of HTF candles that will be visible on the chart
Open: Highlights with a line the open price of current HTF candle
Show True Day Open: Display True Day Open line
Offset: Controls the distance of HTF from the current chart
Space: Controls the space between HTF candles
Size: Controls the size of HTF candles
PD Array: Displays ICT PD Arrays
CE Line: Style the equilibrium line of PD Array
Border: Style the border of PD Array
LTF
H/L Line: Displays on the LTF chart High and Low of each HTF candle
O/C Line: Displays on the LTF chart Open and Close of each HTF candle
PD Array: Displays ICT PD Arrays
CE Line: Style the equilibrium line of PD Array
Border: Style the border of PD Array
Projections
StDev: Controls standard deviation available levels
Labels: Controls the size of standard deviation levels
Anchor: Controls the anchor point of standard deviation levels (wick, body)
Lines: Controls the line widths and color of standard deviation levels
SMT
Show: Display SMT
Symbol: Symbol 1
Symbol: Symbol 2
Style: Controls the color of Bearish and Bullish SMTs
Dashboard
Panel: Display information about current model
💡 Framework
The model includes the following timeframe parings:
15s - 5m
1m - 15m
1m - 30m
2m - 20m
3m - 30m
3m - 60m
5m - 1H
15m - 4H
15m - 8H
30m - 9H
30m - 12H
1H - 1D
2H - 2D
3H - 3D
4H - 1W
8H - 2W
12H - 3W
1D - 1M
2D - 2M
1W - 3M
2W - 6M
3W - 9M
1M - 12M
The Fractal Range Model follows a specific lifecycle, which highlights the current state of the model and determines whether a trade opportunity is valid.
The model's lifecycle includes the following statuses:
Formation (grey)
Invalidation (red)
Success (green)
1. Formation
The Formation phase marks the initial setup of the Fractal Range Model. During this stage, the model identifies and plots key components, such as:
Sweeps: Market movements that indicate a potential reversal or strong shift in trend.
CISD (Change In State of Delivery): A structural change that provides insight into trend shifts.
Once these components are detected, the model automatically calculates and displays Projections and Liquidity Levels , offering insights into potential price action movements.
At this stage, the model also identifies and displays the following key elements:
HTF PD Arrays (Higher-Timeframe Price Delivery Arrays)
LTF PD Arrays (Lower-Timeframe Price Delivery Arrays)
Smart Money Technique (SMT)
If any of these elements are present, they will be automatically displayed on the chart.
2. Invalidation
A Fractal Range Model is considered invalidated when the price does not reach the 2 Standard Deviation level or the first identified liquidity level, and when the price breaks above the high that formed the Sweep.
Invalidation signals that the original setup is no longer reliable, and traders should avoid taking action based on the model's original parameters.
Key invalidation conditions:
Price fails to reach the 2 Standard Deviation level.
Price fails to reach the first liquidity level.
Price breaks the high/low that initiated the Sweep.
A potentially invalidated model is marked with a purple color above the label, indicating the sweep is invalidated by the next candle, but not the high that formed the sweep.
3. Success
A Fractal Range Model is considered successful when the price reaches the 2 Standard Deviation level or the first identified liquidity level. This indicates that the model's predictions align with actual market movements, confirming the setup's validity and providing a potential trading signal.
At this stage, alongside Projections and Liquidity levels, you'll also notice the C-area — the region between the current candle's open and the previous candle's mean. If respected, price action will follow the model's direction.
Key success conditions:
Price reaches the 2 Standard Deviation level.
Price reaches the first liquidity level.
By leveraging these phases, Formation, Invalidation, and Success, traders can effectively manage their positions, minimize risk, and capitalize on high-probability setups based on the Fractal Range Model.
⚡️ Showcase
Introducing Fractal Range Model is a powerful trading tool designed to elevate your market analysis and boost your trading success. Built with precision and advanced algorithms, this indicator helps you identify key trends, potential entry and exit points, and optimize your strategy for better decision-making.
History
HTF Candles
HTF PD Arrays
LTF PD Arrays
SMT
Unlock your full trading potential and experience the difference with Fractal Range Model — your ultimate tool for smarter, more informed trading decisions.
🚨 Alerts
This script offers alert options for all model types. The alerts need to be setup manually from Tradingview.
Bearish Model
A bearish model alert is triggered when a model forms, signaling a high sweep and CISD.
Bullish Model
A bullish model alert is triggered when a model forms, signaling a low sweep and CISD.
⚠️ Disclaimer
These tools are exclusively available on the TradingView platform.
Our charting tools are intended solely for informational and educational purposes and should not be regarded as financial, investment, or trading advice. They are not designed to predict market movements or offer specific recommendations. Users should be aware that past performance is not indicative of future results and should not rely on these tools for financial decisions. By using these charting tools, the purchaser agrees that the seller and creator hold no responsibility for any decisions made based on information provided by the tools. The purchaser assumes full responsibility and liability for any actions taken and their consequences, including potential financial losses or investment outcomes that may result from the use of these products.
By purchasing, the customer acknowledges and accepts that neither the seller nor the creator is liable for any undesired outcomes stemming from the development, sale, or use of these products. Additionally, the purchaser agrees to indemnify the seller from any liability. If invited through the Friends and Family Program, the purchaser understands that any provided discount code applies only to the initial purchase of Candela's subscription. The purchaser is responsible for canceling or requesting cancellation of their subscription if they choose not to continue at the full retail price. In the event the purchaser no longer wishes to use the products, they must unsubscribe from the membership service, if applicable.
We do not offer reimbursements, refunds, or chargebacks. Once these Terms are accepted at the time of purchase, no reimbursements, refunds, or chargebacks will be issued under any circumstances.
By continuing to use these charting tools, the user confirms their understanding and acceptance of these Terms as outlined in this disclaimer.

MTF Fibonacci Pivots with Mandelbrot FractalsMTF Fibonacci Pivots with Mandelbrot Fractals: Advanced Market Structure Analysis
Overview
The MTF Fibonacci Pivots with Mandelbrot Fractals indicator represents a significant advancement in technical analysis by combining multi-timeframe Fibonacci pivot levels with sophisticated fractal pattern recognition. This powerful tool identifies key support and resistance zones while predicting potential price reversals with remarkable accuracy.
Key Capabilities
This indicator provides traders with three distinct layers of market structure analysis:
Automatic Timeframe Adaptation: The primary pivot set automatically adjusts to your chart's timeframe, ensuring relevant support and resistance levels for your specific trading horizon.
1-Year Fibonacci Pivots: The second layer displays yearly pivots that reveal long-term market cycles and institutional price levels that often act as significant reversal points.
3-Year Fibonacci Pivots: The third layer unveils major market structure zones that typically remain relevant for extended periods, offering strategic context for position trading and long-term investment decisions.
Predictive Technology
What truly distinguishes this indicator is its advanced predictive capability powered by:
Mandelbrot Fractal Pattern Recognition: The indicator implements a sophisticated fractal detection algorithm that identifies recurring price patterns across multiple timeframes. Unlike conventional fractal indicators, it incorporates noise filtering and adaptive sensitivity to market volatility.
Tesla's 3-6-9 Principle Integration: The system incorporates Nikola Tesla's mathematical principle through a cubic Mandelbrot equation (Z_{n+1} = Z_n^3 + C where Z_0 = 0), creating a unique approach to pattern recognition that aligns with natural market rhythms.
Historical Pattern Matching: When a current price pattern exhibits strong similarity to historical formations, the indicator generates predictive targets with confidence ratings. Each prediction undergoes rigorous validation against multiple parameters including trend alignment, volatility context, and mathematical coherence.
Visual Intelligence System
The indicator's visual presentation enhances trading decision-making through:
Confidence-Based Visualization: Predictions display with intuitive star ratings, percentage confidence scores, and contextual information including price movement magnitude and estimated time to target.
Adaptive Color Harmonization: The color system intelligently adjusts to provide optimal visibility while maintaining a professional appearance suitable for any chart setup.
Trend Alignment Indicators: Each prediction includes references to the broader trend context, helping traders avoid counter-trend trades unless the reversal signal carries exceptional strength.
Strategic Applications
This indicator excels in multiple trading scenarios:
Intraday Trading: Identify high-probability reversal zones with precise timing
Swing Trading: Anticipate significant market turns at key structural levels
Position Trading: Recognize major cycle shifts for strategic entry and exit
The automatic 1-year and 3-year Fibonacci pivots provide institutional-grade reference points that typically define major market movements. These longer timeframes reveal critical zones that might be invisible on shorter-term analysis, giving you a significant edge in understanding where price is likely to encounter substantial buying or selling pressure.
This innovative approach to market analysis combines classical Fibonacci mathematics with cutting-edge fractal theory to create a comprehensive market structure visualization system that illuminates both present support/resistance levels and future price targets with exceptional clarity.
Setting Up MTF Fibonacci Pivots with Mandelbrot Fractals
Initial Setup
Adding this indicator to your TradingView charts is straightforward:
Navigate to the "Indicators" button on your chart toolbar
Search for "MTF Fibonacci Pivots with Mandelbrot Fractals"
Select the indicator to add it to your chart
A configuration panel will appear with various setting categories
Recommended Settings
The indicator comes pre-configured with optimal default settings, but you may want to adjust them based on your trading style:
For Day Trading (Timeframes 1-minute to 1-hour)
Pivots Timeframe 1: Auto (automatically adapts to your chart)
Pivots Timeframe 2: Daily
Pivots Timeframe 3: Weekly
Fractal Sensitivity: 2-3
Fractal Lookback Period: 20
Prediction Strength: 2
Color Theme: High Contrast or Dark Mode
For Swing Trading (Timeframes 4-hour to Daily)
Pivots Timeframe 1: Daily
Pivots Timeframe 2: Weekly
Pivots Timeframe 3: Monthly
Fractal Sensitivity: 1-2
Fractal Lookback Period: 30
Prediction Strength: 2-3
Color Theme: Default or Dimmed
For Position Trading (Timeframes Daily to Weekly)
Pivots Timeframe 1: Weekly
Pivots Timeframe 2: Monthly
Pivots Timeframe 3: Quarterly
Fractal Sensitivity: 1
Fractal Lookback Period: 50
Prediction Strength: 1
Color Theme: Monochrome or Pastel
Restoring Default Settings
If you've adjusted settings and wish to return to the defaults:
Right-click on the indicator name on your chart
Select "Settings" from the context menu
In the settings dialog, look for the "Reset All" button at the bottom
Confirm the reset when prompted
Alternatively, you can remove the indicator and add it again for a fresh start with default settings.
Advanced Settings Guidance
Visual Appearance
Use Gradient Colors: Enable for better visual differentiation between pivot levels
Color Transparency: 15% provides an optimal balance between visibility and chart clutter
Line Width: 1-2 for cleaner charts, 3+ for enhanced visibility
Fractal Analysis
Enable Fractal Analysis: Keep enabled for prediction capabilities
Fractal Box Spacing: Higher values (5-10) for cleaner displays, lower values (1-3) for more signals
Maximum Forecast Bars: 20 is optimal for most timeframes, adjust higher for longer predictions
Performance Considerations
Enable Self-Optimization: Keep enabled to maintain smooth chart performance
Resource Priority: Use "Balanced" for most computers, "Performance" for older systems
Force Pivot Display: Enable only when checking specific historical periods
Common Setup Mistakes to Avoid
Setting all timeframes too close together (e.g., Daily, Daily, Weekly) reduces the multi-timeframe advantage
Using high fractal sensitivity (4+) on noisy markets creates excessive signals
Setting fractal box spacing too low causes cluttered prediction boxes
Disabling self-optimization may cause performance issues on complex charts
Using incompatible color themes for your chart background reduces visibility
The indicator's power comes from its default 1-year and 3-year Fibonacci pivot settings, which highlight institutional levels while the auto-timeframe setting adapts to your trading horizon. These carefully balanced defaults provide an excellent starting point for most traders.
For optimal results, I recommend making minimal adjustments at first, then gradually customizing settings as you become familiar with the indicator's behavior in your specific markets and timeframes.
Screenshots:

EBP Candle Marker### **EBP Candle Marker – TradingView Indicator**
The **EBP Candle Marker** is a specialized TradingView indicator designed to identify and highlight potential liquidity sweep candles. This indicator visually emphasizes key price action patterns where the market sweeps previous highs or lows and closes in the opposite direction, often signaling potential reversals or liquidity grabs.
---
### 📊 **Indicator Logic:**
1. **Bullish Sweep:**
- The current candle’s **low** is lower than the previous candle’s **low** (indicating a liquidity sweep).
- The **close** is above both the **open** and **close** of the previous candle.
2. **Bearish Sweep:**
- The current candle’s **high** is higher than the previous candle’s **high** (indicating a liquidity sweep).
- The **close** is below both the **open** and **close** of the previous candle.
---
### 🎨 **Visual Representation:**
- **Yellow Candle Body:** Highlights any candle meeting the bullish or bearish sweep conditions.
---
### 🔔 **Alert Functionality:**
The indicator supports setting custom alerts in TradingView for:
- **Bullish Sweep Detected** – Notifies when a bullish sweep occurs.
- **Bearish Sweep Detected** – Notifies when a bearish sweep occurs.
These alerts are compatible across any timeframe, providing flexibility to monitor key market conditions.
---
### 📈 **Use Cases:**
- **Liquidity Sweep Detection:** Identify areas where the market may be triggering stop-loss orders or liquidity hunts.
- **Reversal Confirmation:** Enhance trade confirmation by identifying potential reversal zones.
- **Scalping & Swing Trading:** Suitable for both short-term and long-term trading strategies across multiple timeframes.

Pipnotic Supply and DemandDescription
The Pipnotic Supply and Demand Indicator was originally developed in 2011 for another trading platform and is currently being rewritten for TradingView due to user demand. It is a powerful tool designed for traders who utilize supply and demand concepts in technical analysis. This script automatically detects and highlights key supply and demand zones (as well as buy and sell zones) on the chart, enabling traders to identify potential reversal points, trend continuations, and price imbalances. We will continue to actively develop this indicator for existing and this new version for TradingView.
How It Works
The indicator follows a structured methodology to analyse price action and identify high-probability supply and demand zones:
Zone Identification:
Detects accumulation and distribution phases using volatility and range conditions.
Identifies zones where price imbalances occur, signalling potential trading opportunities.
Expansion and Confirmation:
Assesses whether the price expands away from a zone significantly enough to validate it as a supply or demand zone.
Uses a risk-to-reward ratio to ensure zones meet predefined trading criteria, adjustable via the configuration.
Visualization and Management:
Plots supply (bearish) and demand (bullish) zones directly on the chart.
Labels the percentage of expansion from the zone, giving traders insights into the strength of the imbalance.
Updates zones dynamically, marking tested and consumed levels and preventing outdated information from cluttering the chart.
Key Features & Inputs
Customizable Zone Display: Traders can adjust the maximum number of supply and demand zones shown on the chart.
Dynamic Volatility Sampling: Uses the ATR (Average True Range) to adapt to changing market conditions.
Flexible Risk Management: Allows traders to define a minimum zone size and a risk-to-reward ratio for filtering zones.
Enhanced Visualization:
Adjustable colours for bullish and bearish zones.
Configurable border width for zone clarity.
Optional display of consumed zones to avoid redundant signals, but to also identify price sensitive zones on the flip side of the book when zones are consumed.
Swing Significance Detection: Enables boxing of significant price swings to refine the accuracy of identified zones.
Benefits of Using the Pipnotic Supply and Demand Indicator
Automates Supply and Demand Analysis: Eliminates the need for manual zone drawing, saving time and reducing subjectivity.
Enhances Trade Decision-Making: By providing precise entry and exit points based on supply and demand principles, traders can optimize their strategies.
Adapts to Market Conditions: The indicator dynamically adjusts to price movements, ensuring relevant zones are displayed.
Works Across All Timeframes: Suitable for scalping, swing trading, and long-term investing.
Compatible with Multiple Trading Strategies: Can be used alongside trend-following, breakout, and reversal strategies for improved trade confirmation.

MTF Fractals [RunRox]🔽 MTF Fractals is a powerful indicator designed to visualize fractals from multiple timeframes directly on your chart, highlight liquidity sweeps at these fractal levels, and provide several additional features we’ll cover in detail below.
We created this indicator because we couldn’t find a suitable tool that met our specific needs on TradingView. Therefore, we decided to develop a valuable indicator for the entire TradingView community, combining simplicity and versatility.
⁉️ WHAT IS A FRACTALS?
In trading, a fractal is a technical analysis pattern composed of five consecutive candles, typically highlighting local market turning points. Specifically, a fractal high is formed when a candle’s high is higher than the highs of the two candles on either side, whereas a fractal low occurs when a candle’s low is lower than the lows of the two adjacent candles on both sides.
Traders use fractals as reference points for identifying significant support and resistance levels, potential reversal areas, and liquidity zones within price action analysis. Below is a screenshot illustrating clearly formed fractals on the chart.
📙 FRACTAL FORMATION
Here’s how fractals form depending on your chosen setting (3, 5, 7, or 9):
▶️ 3-bar fractal – forms when the central candle is higher (for highs) or lower (for lows) than one candle on each side.
▶️ 5-bar fractal – forms when the central candle is higher or lower than two candles on both sides.
▶️ 7-bar fractal – forms when the central candle is higher or lower compared to the three candles on each side.
▶️ 9-bar fractal – forms similarly but requires four candles on each side, making the fractal significantly more reliable and robust.
A higher number of bars ensures stronger fractal levels, highlighting more significant potential reversal points on the chart.
Now that we’ve covered the theory behind fractal formation, let’s explore the indicator’s functionality in more detail.
Below, I’ll explain each feature clearly and illustrate how you can effectively utilize this indicator in your trading.
🕐 MULTI-TIMEFRAME FRACTALS
We realized that displaying fractals only from the current timeframe isn’t always convenient, so we’ve introduced Multi-Timeframe Fractals into this indicator.
Now you can easily display fractals from higher timeframes directly on your current chart, providing you with broader market context and clearer trading signals.
Fractals from Current Timeframe – Fractals identified directly on the chart’s current timeframe.
Fractals from Higher Timeframes – Fractals sourced from higher timeframes and displayed clearly on your current chart for enhanced market perspective.
📈 FRACTAL LINES
Since fractals represent areas of high liquidity, we’ve added an option to extend fractal levels horizontally as Fractal Lines across your chart.
This feature allows you to clearly visualize critical liquidity areas from higher timeframes, directly on your current timeframe chart, as demonstrated in the screenshot below.
With this approach, you can clearly visualize significant fractal levels from higher timeframes directly on your current chart - for example, projecting fractals from the 1-hour (1H) timeframe onto a 3-minute (3m) chart. ✅ This helps you easily identify critical liquidity areas and potential reversal zones without the need to switch between multiple timeframes.
💰 LIQUDITY SWEEP (LIQUDITY GRAB)
To enhance your trading experience, we’ve introduced a feature that clearly identifies liquidity sweeps of fractal levels.
A Liquidity Sweep occurs when a candle closes beyond a fractal line, leaving a wick that pierces through it, signaling that liquidity has been collected at this level.
Below, you’ll find two examples illustrating this functionality:
▶️ Fractal lines from the current timeframe
▶️ Fractal lines projected from higher timeframes
The first example illustrates liquidity being swept from fractals on the current timeframe .
Here, the candle clearly closes beyond the fractal line, leaving a wick through it. This indicates a liquidity sweep at the fractal level, visually highlighting a potential reversal or continuation opportunity directly on your chart.
In the second example, fractals from the higher timeframe are projected onto your current chart.
When a candle on your current timeframe closes beyond an HTF fractal line - leaving a wick through this level - the indicator highlights it clearly. This signals to traders a potential reversal zone, indicating that liquidity has been swept, and price may reverse or significantly react from this area.
You can also enable the display of additional labels on the chart. These labels clearly mark liquidity sweeps at fractal levels, making it easier to visually identify potential reversal points directly on your chart.
⚙️ SETTINGS
Below are the indicator settings with detailed explanations for each parameter.
🔷 Bars in Fractal – Number of candles to the right and left required to form a fractal.
🔷 Fractal Timeframe – Select the timeframe from which you want to display fractals on the current chart.
🔷 Max Age, bars – Number of bars during which the fractal will remain active.
🔷 Show Fractal Line – Display or hide fractal lines.
🔷 Line Style – Choose the style of the line displayed on the chart.
🔷 Line Width – Thickness of the fractal line.
🔷 High Fractal – Style and color of bearish fractals.
🔷 Low Fractal – Style and color of bullish fractals.
🔷 Fractal Label Size – Select the size of fractal labels.
🔷 Show Sweep Labels – Option to display labels when a liquidity sweep occurs.
🔷 Label Color – Color and transparency of the area marked on the chart during a sweep.
🔷 Shade Sweep Area – Show or hide the sweep area shading.
🔷 Area Color – Color and transparency settings for the sweep area.
🔶 We’d love to hear your feedback and any suggestions for additional features you’d like to see in this indicator. We’ll be happy to consider your ideas and continue improving the indicator!

GRID EXTENSIONGRID EXTENSION
Overview
The GRID EXTENSION is a simple grid-based indicator for TradingView, built with Pine Script v6. It plots horizontal price levels starting from a user-defined anchor price, with spacing set by a tick increment. Use it to identify key support, resistance, or price zones on charts for Crypto, Forex, or Futures.
Key Features
Custom Grid Levels: Plot up to 22 levels (e.g., 0, 0.25, 1.25, -2.50) with options to show/hide, set values, and choose colors.
Market-Specific Tick Increments: Select your asset type (Crypto, Forex, Futures) and choose from a range of tick increments tailored for each market:
Crypto: 1 to 5000 ticks (e.g., 100 ticks = $0.001 on ADA/USD, 5000 ticks = $50 on BTC/USD).
Forex: 5 to 5000 ticks (e.g., 100 ticks = 1 pip on EUR/USD, 5000 ticks = 50 pips).
Futures: 1 to 2500 ticks (e.g., 25 ticks = 6.25 points on E-mini S&P 500, $312.50 per contract).
Visual Options:
Extend lines to the right.
Show price and level labels (as values or percentages).
Place labels on the left or right.
Adjust background transparency for filled areas between levels.
How to Use
Set Asset Type: Choose "Crypto," "Forex," or "Futures" to match your chart.
Set Anchor Price: Enter a starting price for the grid.
Pick Tick Increment: Select a tick increment from the dropdown, following the guidance for your asset type (see Key Features).
Customize Levels: Turn levels on/off, set values, and pick colors.
Add to Chart: Apply the indicator to see the grid on your chart.
Tips
Use levels to mark support/resistance zones for entries or exits.
Extend lines to project future price zones.
Choose smaller increments (e.g., 5 ticks) for scalping, or larger ones (e.g., 1000 ticks) for swing trading.
Combine with indicators like moving averages for better signals.
Settings
Asset Type: Select "Crypto," "Forex," or "Futures" (default: "Crypto").
Anchor Price: Starting price for the grid (default: 0.0).
Tick Increment: Space between levels (options: 1, 5, 10, 25, 50, 100, 250, 500, 1000, 2500, 5000). Choose based on asset type.
Extend Right: Extend lines to the right (default: true).
Show Prices: Show price labels (default: true).
Show Levels: Show level values or percentages (default: true).
Format: Display levels as "Values" or "Percent" (default: "Values").
Labels Position: Place labels on "Left" or "Right" (default: "Left").
Background Transparency: Set transparency for filled areas (default: 100, range 0-100).
Level Options: Enable/disable levels, set values, and choose colors.
Notes
Set the anchor price to a key level (like a recent high or low) for best results.
Check the tick increment tooltip to ensure the spacing suits your market type.
Works on any chart, best for clear price trends or ranges.
Acknowledgments
Made with Pine Script v6 for TradingView. This is v1.0—feedback welcome for future updates!

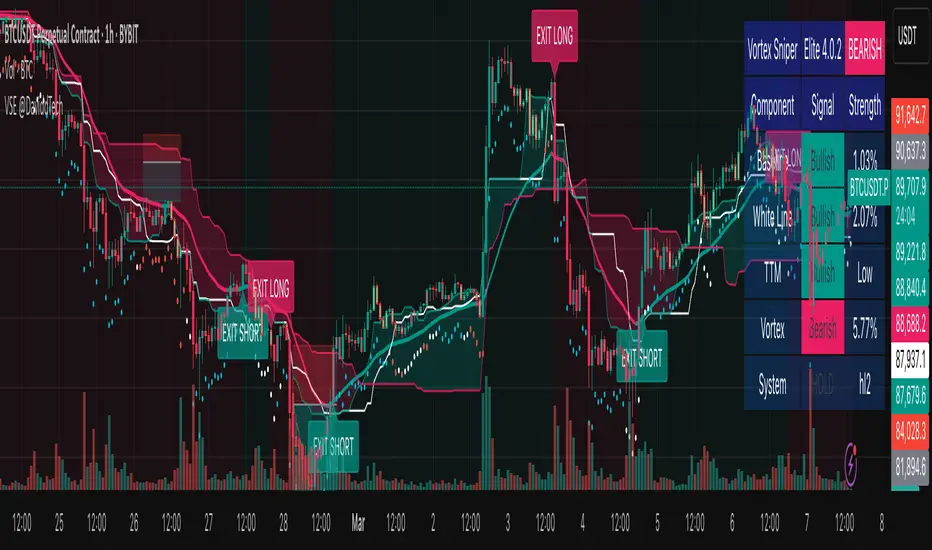
Vortex Sniper Elite @DaviddTechVortex Sniper Elite @DaviddTech
Vortex Sniper Elite @DaviddTech is a comprehensive trading system designed to deliver high-probability trade setups across all market conditions. By seamlessly integrating adaptive baseline detection, squeeze momentum analysis, and advanced vortex filtering, this indicator provides traders with a complete edge-based approach to market analysis.
🔥 Key Features:
Complete Model Integration:
Baseline: Advanced McGinley Dynamic indicator for superior trend detection
Confirmation #1: Enhanced TTM Squeeze for momentum and volatility analysis
Confirmation #2: Dual Tether Line system for dynamic market structure mapping
Volatility Filter: Specialized Vortex indicator for precision entry timing
Adaptive Stop Loss: Proprietary trailing stop system based on ATR calculations
Advanced Visual Dashboard:
Real-time component analysis with strength metrics
Color-coded signal status for immediate trade assessment
Squeeze state monitoring with visual confirmation
Vortex divergence strength percentage for optimal entries
Premium Signal Detection:
Multi-timeframe compatible system for scaling strategies
Automated buy/sell signals at optimal entry points
Clear exit signals for risk management
Squeeze momentum visualization for timing precision
DaviddTech Alpha Edge System:
Gradient transparency algorithm for visual trend strength confirmation
Bar coloring system based on momentum direction
Background highlighting for active signal states
Dashboard for ease of understanding
💰 Trading Applications:
Sniper Entries: Utilize the Vortex confirmation to pinpoint precise entry points
Trend Alignment: McGinley baseline establishes the primary market direction
Volatility Awareness: TTM Squeeze identifies optimal market conditions
Risk Management: Set stops based on the adaptive trailing stop system
Position Management: Monitor dashboard metrics for changing market conditions
Vortex Sniper Elite @DaviddTech represents the culmination of the DaviddTech methodology in one cohesive system. Whether you're a day trader seeking precise entries or a swing trader looking for significant market moves, this indicator delivers the structured approach needed to consistently extract profits from any market condition.
DaviddTech Trading System Explained:
The DaviddTech methodology follows a strict component-based approach:
The Baseline establishes the primary trend direction, acting as your first filter
Confirmation Indicators validate potential trade setups only when aligned with the baseline
The Volatility/Volume Indicator ensures you only enter trades with sufficient directional momentum
A Trailing Stop System provides mathematically optimized exit points
Vortex Sniper Elite integrates all these components into a visually intuitive system that eliminates guesswork and enforces disciplined trading decisions.
Recommended Settings:
This indicator comes pre-configured with optimized parameters, but feel free to adjust based on your timeframe:
For day trading: Reduce Baseline and TTM lengths by 30-40%
For swing trading: Consider increasing Tether and Trail Stop lengths by 25-50%
For scalping: Focus on Vortex confirmation with shorter timeframes
Best Practices:
Wait for all components to align before entering trades
Use the dashboard to evaluate the strength of each signal
Monitor squeeze states for potential volatility expansion
Let the trailing stop system handle your exits
Backtest across multiple timeframes to find your optimal settings
High Timeframe POCIntroducing the High Timeframe POC (HTF POC) Indicator
What It Does
The HTF POC Indicator is a powerful tool that helps traders identify key price levels on your chart based on the Point of Control (POC)—the price level where the most trading activity (volume or time) occurred over a specific timeframe. Think of it as a "magnet" where price tends to return or bounce off. This indicator works across multiple timeframes (1-hour, 4-hour, 6-hour, weekly, monthly, and custom periods like 3M or 6M), giving you a clear view of significant support and resistance levels from both short-term and long-term perspectives.
Key Features:
Displays POC lines for different timeframes (e.g., 1H, 4H, 6H) as horizontal lines on your chart.
Limits the number of lines per timeframe (default 5, adjustable) to avoid clutter.
Allows customizable line lengths (e.g., 1 day for 1H, 7 days for 6H) and label positioning to keep your chart clean.
Highlights developing POCs (current price action) and optional Value Area (VA) levels for added context.
Removes crossed POC lines automatically to focus on relevant levels.
Why It Matters
Traders use POCs because they act as support (price floor) or resistance (price ceiling) zones. By seeing POCs from multiple timeframes, you can:
Spot where price is likely to reverse or consolidate.
Align your trades with both short-term (1H, 4H) and longer-term (6H, monthly) trends.
Avoid overcomplicating your chart with too many lines, thanks to customizable settings.
How to Use It
Here are practical ways to leverage the HTF POC Indicator in your trading:
Identify Entry and Exit Points:
Look for price approaching a POC line (e.g., a 4H POC in green). If price bounces off this level, it’s a potential buy (support) or sell (resistance) signal.
Example: If the 1H POC is near current price and price respects it, enter a trade in the direction of the bounce.
Combine Timeframes for Confirmation:
Use shorter timeframes (1H, 4H) for precise entries and longer timeframes (6H, monthly) for trend direction.
Example: If a 6H POC aligns with a monthly POC and price holds, it’s a stronger signal to trade in that direction.
Set Stop Losses and Targets:
Place your stop loss just beyond the POC level (e.g., 1-2% below a support POC).
Set your profit target at the next POC level (e.g., the next 4H POC above your entry).
Spot Reversal Zones:
Watch for price stalling or reversing at multiple POC alignments (e.g., 1H and 6H POCs stacking). This is a high-probability reversal zone.
Example: If price drops to a 1H POC and a 4H POC at the same level, consider it a key area to watch.
Adjust for Clarity:
Tweak the “Max lines to display” (e.g., set 1H to 3 lines) and “Line length” (e.g., 1 day for 1H) in the settings to focus on the most recent and relevant levels.
Move labels (left for 1H, right for 6H) to avoid overlap and keep your chart readable.
Quick Tips
Enable Timeframes: Turn on 1H, 4H, or 6H based on your trading style (short-term or swing).
Color Coding: Red for 1H, Green for 4H, Blue for 6H—easy to distinguish on the chart.
Test It: Apply it on a daily chart and adjust settings to see how POCs align with past price action.
Get Started
Add the HTF POC Indicator to your TradingView chart, customize the settings to match your strategy, and watch how POC levels guide your trades. Whether you’re scalping or swing trading, this tool helps you stay ahead by highlighting where the market “remembers” its past!

AlgoCados x ICT ToolkitAlgoCados x ICT Toolkit is a TradingView tool designed to integrate ICT (Inner Circle Trader) Smart Money Concepts (SMC) into a structured trading framework.
It provides traders with institutional liquidity insights, precise price level tracking, and session-based analysis, making it an essential tool for intraday, swing, and position trading.
Optimized for Forex, Futures, and Crypto, this toolkit offers multi-timeframe liquidity tracking, killzone mapping, RTH analysis, standard deviation projections, and dynamic price level updates, ensuring traders stay aligned with institutional market behavior.
# Key Features
Multi-Timeframe Institutional Price Levels
The indicator provides a structured approach to analyzing liquidity and market structure across different time horizons, helping traders understand institutional order flow.
- Previous Day High/Low (PDH/PDL) – Tracks the Previous Day’s High/Low, crucial for intraday liquidity analysis.
- Previous Week High/Low (PWH/PWL) – Monitors the Previous Week’s High/Low, aiding in higher timeframe liquidity zone tracking.
- Previous Month High/Low (PMH/PML) – Highlights the Previous Month’s High/Low, critical for swing trading and long-term bias confirmation.
- True Day Open (TDO) – Marks the NY Midnight Opening Price, providing a reference point for intraday bias and liquidity movements.
- Automatic Level Cleanup – When enabled. pxHigh/pxLow levels gets automatically deleted when raided, keeping the chart clean and focused on valid liquidity zones.
- Monthly, Weekly, Daily Open Levels – Identifies HTF price action context, allowing traders to track institutional order flow and potential liquidity draws.
# Regular Trading Hours (RTH) High, Low & Mid-Equilibrium (EQ)
For futures traders, the toolkit accurately identifies RTH liquidity zones to align with institutional trading behavior.
- RTH High/Low (RTH H/L) – Defines the RTH Gap high and low dynamically, marking key liquidity levels.
- RTH Equilibrium (EQ) – Calculates the midpoint of the RTH range, acting as a mean reversion level where price often reacts.
# Killzones & Liquidity Mapping
The indicator provides a time-based liquidity structure that helps traders anticipate market movements during high-impact trading windows.
ICT Killzones (Visible on 30-minute timeframe or lower)
- Asia Killzone (Asia) – Tracks overnight liquidity accumulation.
- London Open Killzone (LOKZ) – Marks early European liquidity grabs.
- New York Killzone (NYKZ) – Captures US session volatility.
- New York PM Session (PMKZ) – Available only for futures markets, tracking late-day liquidity shifts.
Forex-Specific Killzones (Visible on 30-minute timeframe or lower)
- London Close Killzone (LCKZ) – Available only for Forex, marks the European end of Day liquidity Points of Interests (POI).
- Central Bank Dealers Range (CBDR) – Available only for Forex, providing a liquidity framework used by central banks.
- Flout (CBDR + Asian Range) – Available only for Forex, extending CBDR with Asian session liquidity behavior.
- Killzone History Option – When enabled, Killzones remain visible beyond the current day; otherwise, they reset daily.
- Customizable Killzone Boxes – Modify opacity, colors, and border styles for seamless integration into different trading styles.
CME_MINI:NQH2025 FOREXCOM:EURUSD
# Standard Deviation (STDV) Liquidity Projections
A statistical approach to forecasting price movements based on Standard Deviations of HOTD (High of the Day) and LOTD (Low of the Day).
- Asia, CBDR, and Flout STDV Calculations (Visible on 30-minute timeframe or lower) – Predicts liquidity grabs based on price expansion behavior.
- Customizable Display Modes – Choose between Compact (e.g., "+2.5") or Verbose (e.g., "Asia +2.5") labels.
- Real-Time STDV Updates – Projections dynamically adjust as new price data is formed, allowing traders to react to developing market conditions.
CME_MINI:NQH2025
# Daily Session Dividers
- Visualizes Trading Days (Visible on 1-hour timeframe or lower) – Helps segment the trading session for better structure analysis.
- Daily Divider History Option – When enabled, dividers remain visible beyond the current trading week; otherwise, they reset weekly.
# Customization & User Experience
- Flexible Label Options – Adjust label size, font type, and color for improved readability.
- Intraday-Optimized Data – Killzones (30m or lower), STDV (30m or lower), and Daily Dividers (1H or lower) ensure efficient use of chart space.
- Configurable Line Styles – Customize solid, dotted, or dashed styles for various levels, making charts aesthetically clean and data-rich.
# Usage & Configurations
The AlgoCados x ICT Toolkit is designed to seamlessly fit different trading methodologies.
Scalping & Intraday Trading
- Track PDH/PDL levels for liquidity sweeps and market reversals.
- Utilize Killzones & Session Open levels to identify high-probability entry zones.
- Analyze RTH High/Low & Mid-EQ for potential liquidity targets and reversals.
- Enable STDV projections for potential price expansion and reversals.
Swing & Position Trading
- Use PWH/PWL and PMH/PML levels to determine HTF liquidity shifts.
- Monitor RTH Gap, TDO, and session liquidity markers for trade confirmation.
- Combine HTF bias with LTF liquidity structures for optimized entries and exits.
# Inputs & Configuration Options
Customizable Parameters
- Offset Adjustment – Allows users to shift displayed data horizontally for better visibility.
- Killzone Box Styling – Customize colors, opacity, and border styles for session boxes.
- Session Dividers – Modify line styles and colors for better time segmentation.
- Killzone & Daily Divider History Toggle – Enables users to view past killzones and dividers instead of resetting them daily/weekly.
- Label Formatting – Toggle between Compact and Verbose display modes for streamlined analysis.
# Advanced Features
Real-Time Data Processing & Dynamic Object Management
- Auto Cleanup of pxLevels – Prevents clutter by removing invalidated levels upon liquidity raids.
- Session History Control – Users can toggle historical data for daily dividers and killzones to maintain a clean chart layout.
- Daily & Weekly Resets – Ensures accurate session tracking by resetting daily dividers at the start of each new trading week.
CME_MINI:NQH2025
# Example Use Cases
- Day Traders & Scalpers – Utilize Killzones, PDH/PDL, DO and TDO levels for precise liquidity-based trading opportunities.
- Swing Traders – Leverage HTF Open Levels, PWH/PWL liquidity mapping, and TDO for trend-based trade execution.
- Futures Traders – Optimize trading with RTH High/Low, Mid-EQ, and PMKZ for session liquidity tracking.
- Forex Traders – Use CBDR, Flout, and session liquidity mapping to align with institutional order flow.
CME_MINI:ESH2025
"By integrating institutional concepts, liquidity mapping, and smart money methodologies, the AlgoCados x ICT Toolkit empowers traders with a data-driven approach to market inefficiencies and liquidity pools."
# Disclaimer
This tool is designed to assist in trading decisions but should be used in conjunction with other analysis methods and proper risk management. Trading involves significant risk, and traders should ensure they understand market conditions before executing trades.

Advanced Support and Resistance Levels[MAP]Advanced Support and Resistance Levels Indicator
Author
Developed by:
Overview
The "Advanced Support and Resistance Levels" indicator, created, is a sophisticated tool designed for TradingView's Pine Script v6 platform. It identifies and plots key support and resistance levels on a price chart, enhancing technical analysis by incorporating pivot strength, volume weighting, and level decay. The indicator overlays lines, zones, and labels on the chart, providing a visual representation of significant price levels where the market has historically reversed or consolidated.
Purpose
This indicator, authored by , aims to:
Detect significant pivot points (highs and lows) with customizable strength requirements.
Track and rank support/resistance levels based on their recency, volume, and number of touches.
Display these levels as lines and optional zones, with strength-based visual cues (e.g., line thickness and opacity).
Offer flexibility through user-configurable settings to adapt to different trading styles and market conditions.
Features
Pivot Detection:
Identifies high and low pivots using a strength parameter, requiring a specified number of bars on either side where no higher highs or lower lows occur.
Incorporates closing price checks and SMA-based trend confirmation to filter out noise and ensure pivots align with the broader market direction.
Level Management:
Maintains a dynamic array of levels with attributes: price, type (support/resistance), bars since last touch, strength, and volume.
Merges nearby levels within a tolerance percentage, updating prices with a strength-weighted average.
Prunes weaker or older levels when exceeding the maximum allowed, prioritizing those with higher calculated strength.
Strength Calculation:
Combines the number of touches (strength), volume (if enabled), and age decay (if enabled) into a single metric.
Volume weighting uses a logarithmic scale to emphasize high-volume pivots without over-amplifying extreme values.
Age decay reduces the importance of older levels over time, ensuring relevance to current price action.
Visualization:
Draws horizontal lines at each level, with thickness reflecting the number of touches (up to a user-defined maximum).
Optional price zones around levels, sized as a percentage of the price, to indicate areas of influence.
Labels display the level type (S for support, R for resistance), price, and strength score, with position (left or right) customizable.
Line opacity varies with strength, providing a visual hierarchy of level significance.
Plots small triangles at detected pivot points for reference.
Inputs
Lookback Period (lookback, default: 20): Number of bars to consider for trend confirmation via SMA. Range: 5–100.
Pivot Strength (strength, default: 2): Number of bars required on each side of a pivot to confirm it. Range: 1–10.
Price Tolerance % (tolerance, default: 0.5): Percentage range for merging similar levels. Range: 0.1–5.
Max Levels to Show (maxLevels, default: 10): Maximum number of levels displayed. Range: 2–50.
Zone Size % (zoneSizePercent, default: 0.1): Size of the S/R zone as a percentage of the price. Range: 0–1.
Line Width (lineWidth, default: 1): Maximum thickness of level lines. Range: 1–5.
Show Labels (showLabels, default: true): Toggle visibility of level labels.
Label Position (labelPos, default: "Right"): Position of labels ("Left" or "Right").
Level Strength Decay (levelDecay, default: true): Enable gradual reduction in strength for older levels.
Volume Weighting (volumeWeight, default: true): Incorporate volume into level strength calculations.
Support Color (supportColor, default: green): Color for support levels.
Resistance Color (resistColor, default: red): Color for resistance levels.
How It Works
Pivot Detection:
Checks for pivots only after enough bars (2 * strength) have passed.
A high pivot requires strength bars before and after with no higher highs or closes, and a short-term SMA above a long-term SMA.
A low pivot requires strength bars before and after with no lower lows or closes, and a short-term SMA below a long-term SMA.
Level Tracking:
New pivots create levels with initial strength and volume.
Existing levels within tolerance are updated: strength increases, volume takes the maximum value, and price adjusts via a weighted average.
Levels older than lookback * 4 bars with strength below 0.5 are removed.
If the number of levels exceeds maxLevels, the weakest (by calculated strength) are pruned using a selection sort algorithm.
Drawing:
Updates on the last confirmed bar or in real-time.
Lines extend lookback bars left and right from the current bar, with thickness based on touches.
Zones (if enabled) are drawn symmetrically around the level price.
Labels show detailed info, with opacity tied to strength.
Usage
Add to Chart: Apply the indicator to any TradingView chart via the Pine Script editor, as designed by .
Adjust Settings: Customize inputs to match your trading strategy (e.g., increase strength for stronger pivots, adjust tolerance for tighter level merging).
Interpret Levels: Focus on thicker, less transparent lines for stronger levels; use zones to identify potential reversal areas.
Combine with Other Tools: Pair with trend indicators or oscillators for confluence in trading decisions.
Notes
Performance: The indicator uses arrays and sorting, which may slow down on very long charts with many levels. Keep maxLevels reasonable for efficiency.
Accuracy: Enhanced by trend confirmation and volume weighting, making it more reliable than basic S/R indicators, thanks to 's design.
Limitations: Real-time updates may shift levels as new pivots form; historical levels are more stable.
Example Settings
For day trading: lookback=10, strength=1, tolerance=0.3, maxLevels=5.
For swing trading: lookback=50, strength=3, tolerance=0.7, maxLevels=10.
Credits
Author: – Creator of this advanced support and resistance tool, blending precision and customization for traders.

EMA Adaptive Trailing StopThe EMA Adaptive Trailing Stop Strategy is a versatile and comprehensive Pine Script designed for TradingView. This script provides an adaptive trailing stop mechanism that leverages the Exponential Moving Average (EMA) to adjust trailing stops based on market conditions. The strategy dynamically switches between trending and ranging markets by utilizing both Average True Range (ATR) and Average Directional Index (ADX) to detect market conditions.
Key Features:
EMA-Based Trailing Stop:
The script uses the EMA value to set trailing stops precisely. The EMA offers a more responsive calculation to price changes, ensuring closer and more accurate trailing stops that follow market movements effectively.
Market Condition Detection:
The script employs ATR and ADX to distinguish between trending and ranging markets. ATR measures market volatility, while ADX gauges trend strength. The combination of these two indicators provides a more accurate market condition detection.
Customizable Settings:
The script offers various flexible parameters to adjust EMA length, multipliers, and ATR length. Users can customize these settings according to their preferences and trading strategy.
Two Modes:
The script adapts to market conditions by providing two modes: trending mode and ranging mode. In trending mode, the trailing stop is tighter to follow price movements closely, whereas in ranging mode, the trailing stop is looser to accommodate lower volatility.
Entry and Exit Conditions:
The script detects market conditions to set buy and sell signals. These conditions include the calculations of EMA, ATR, and ADX to ensure the signals generated are valid and profitable.
Alerts:
The script provides buy and sell signals through alert conditions for efficient trade management. Users can enable these alerts to get real-time notifications when valid buy or sell signals are detected.
Suitable for Scalping and Swing Trading:
The script is well-suited for both scalping and swing trading strategies. Scalpers can benefit from the responsive and tighter trailing stops during trending conditions, while swing traders can take advantage of the adaptive and looser trailing stops during ranging conditions, allowing them to capture larger price movements.
Explanation of Mode 1 and Mode 2:
Mode 1: Trending Market:
In this mode, the market is identified as trending based on the ADX and ATR values.
LONG 1: This label indicates a buy signal in the trending market mode. It signifies that the trailing stop has been activated and a long position (buy) should be taken when the market is trending.
SHORT 1: This label indicates a sell signal in the trending market mode. It signifies that the trailing stop has been activated and a short position (sell) should be taken when the market is trending.
Mode 2: Ranging Market:
In this mode, the market is identified as ranging based on the ADX and ATR values.
LONG 2: This label indicates a buy signal in the ranging market mode. It signifies that the trailing stop has been activated and a long position (buy) should be taken with a looser trailing stop when the market is ranging.
SHORT 2: This label indicates a sell signal in the ranging market mode. It signifies that the trailing stop has been activated and a short position (sell) should be taken with a looser trailing stop when the market is ranging.
Technical Usage:
Variable Initialization:
The script initializes variables to store values such as trailing stop, long position status, and short position status.
Market Condition Detection:
The script calculates ATR and ADX values to detect whether the market is trending or ranging. This includes the use of f_adx function to calculate ADX values and determine market conditions.
EMA-Based Trailing Stop Calculation:
The script adjusts the trailing stop based on EMA values and ATR. The calculation involves customizable multipliers and parameters that influence the trailing stop's precision.
Plot Trailing Stop:
The script displays the trailing stop on the chart for clear visualization. This includes plotting the trailing stop line with appropriate colors to indicate long and short positions.
Entry and Exit Conditions:
The script determines the entry (buy) and exit (sell) conditions based on market condition detection and trailing stop settings. These conditions are crucial for generating valid buy or sell signals.
Plotshape and Alert:
The script provides plotshapes for buy and sell signals and sets up alert conditions for real-time notifications when a valid buy or sell signal is detected.
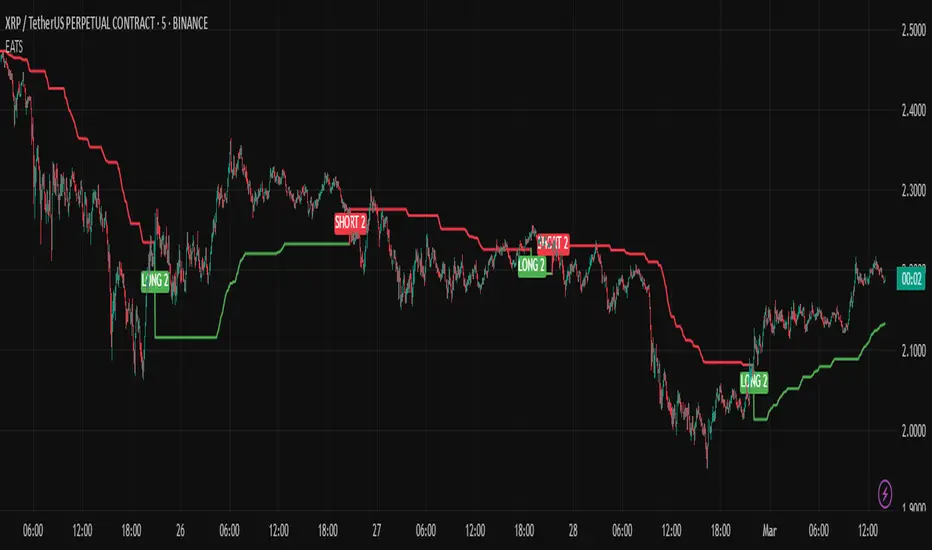
Mile Runner - Swing Trade LONGMile Runner - Swing Trade LONG Indicator - By @jerolourenco
Overview
The Mile Runner - Swing Trade LONG indicator is designed for swing traders who focus on LONG positions in stocks, BDRs (Brazilian Depositary Receipts), and ETFs. It provides clear entry signals, stop loss, and take profit levels, helping traders identify optimal buying opportunities with a robust set of technical filters. The indicator is optimized for daily candlestick charts and combines multiple technical analysis tools to ensure high-probability trades.
Key Features
Entry Signals: Visualized as green triangles below the price bars, indicating a potential LONG entry.
Stop Loss and Take Profit Levels: Automatically plotted on the chart for easy reference.
Stop Loss: Based on the most recent pivot low (support level).
Take Profit: Calculated using a Fibonacci-based projection from the entry price to the stop loss.
Trend and Momentum Filters: Ensures trades align with the prevailing trend and have sufficient momentum.
Volume and Volatility Confirmation: Verifies market interest and price movement potential.
How It Works
The indicator uses a combination of technical tools to filter and confirm trade setups:
Exponential Moving Averages (EMAs):
A short EMA (default: 9 periods) and a long EMA (default: 21 periods) identify the trend.
A bullish crossover (EMA9 crosses above EMA21) signals a potential upward trend.
Money Flow Index (MFI):
Confirms buying pressure when MFI > 50.
Average True Range (ATR):
Ensures sufficient volatility by checking if ATR exceeds its 20-period moving average.
Volume:
Confirms market interest when volume exceeds its 20-period moving average.
Pivot Lows:
Identifies recent support levels (pivot lows) to set the stop loss.
Ensures the pivot low is recent (within the last 10 bars by default).
Additional Trend Filter:
Confirms the long EMA is rising, reinforcing the bullish trend.
Inputs and Customization
The indicator is highly customizable, allowing traders to tailor it to their strategies:
EMA Periods: Adjust the short and long EMA lengths.
ATR and MFI Periods: Modify lookback periods for volatility and momentum.
Pivot Lookback: Control the sensitivity of pivot low detection.
Fibonacci Level: Adjust the Fibonacci retracement level for take profit.
Take Profit Multiplier: Fine-tune the aggressiveness of the take profit target.
Max Pivot Age: Set the maximum bars since the last pivot low for relevance.
Usage Instructions
Apply the Indicator:
Add the "Mile Runner - Swing Trade LONG" indicator to your TradingView chart.
Best used on daily charts for swing trading.
Look for Entry Signals:
A green triangle below the price bar signals a potential LONG entry.
Set Stop Loss and Take Profit:
Stop Loss: Red dashed line indicating the stop loss level.
Take Profit: Purple dashed line showing the take profit level.
Monitor the Trade:
The entry price is marked with a green dashed line for reference.
Adjust trade management based on the plotted levels.
Set Alerts:
Use the built-in alert condition to get notified of new LONG entry signals.
Important Notes
For LONG Positions Only : Designed exclusively for swing trading LONG positions.
Timeframe: Optimized for daily charts but can be tested on other timeframes.
Asset Types: Works best with stocks, BDRs, and ETFs.
Risk Management: Always align stop loss and take profit levels with your risk tolerance.
Why Use Mile Runner?
The Mile Runner indicator simplifies swing trading by integrating trend, momentum, volume, and volatility filters into one user-friendly tool. It helps traders:
Identify high-probability entry points.
Establish clear stop loss and take profit levels.
Avoid low-volatility or low-volume markets.
Focus on assets with strong buying pressure and recent support.
By following its signals and levels, traders can make informed decisions and enhance their swing trading performance. Customize the inputs and test it on your favorite assets—happy trading!

Smart Buy/Sell Signal IndicatorOverview
The Smart Buy/Sell Signal Indicator is a multi-factor trading tool that i ntegrates Supertrend, Bollinger Bands, RSI, ADX, and Moving Averages to generate high-probability buy and sell signals. Unlike simple crossover-based strategies, this indicator leverages multiple layers of confirmation to reduce false signals and improve trade execution accuracy.
This indicator is designed for trend-following traders, scalpers, and swing traders, helping them identify key reversal points and momentum shifts with precise breakout conditions.
How It Works
The Smart Buy/Sell Signal Indicator filters out weak trade signals by combining trend, volatility, momentum, and strength indicators in the following manner:
✅ Supertrend-Based Trend Filtering:
• The script checks if the price is above or below the Supertrend level before confirming a buy or sell signal.
• Buy signals occur below the Supertrend Down level, confirming support.
• Sell signals occur above the Supertrend Up level, confirming resistance.
✅ Bollinger Bands for Overbought & Oversold Conditions:
• Buy signals are confirmed when price touches the Bollinger Lower Band (suggesting oversold conditions).
• Sell signals are confirmed when price touches the Bollinger Upper Band (suggesting overbought conditions).
• This ensures that trades occur at high-probability reversal zones, rather than random price action.
✅ RSI Momentum Confirmation:
• Buy trades trigger when RSI is below 50 (indicating strength building from an oversold region).
• Sell trades trigger when RSI is above 50 (indicating weakness forming in an overbought region).
• This ensures signals are momentum-backed and not counter-trend moves.
✅ ADX Strength Confirmation:
• The script filters signals using the ADX (Average Directional Index) to ensure that only trades with sufficient market strength are executed.
• If the ADX value is below a threshold (default: 15), the signal is ignored to prevent false breakouts in choppy markets.
✅ Confirmation Moving Average (MA) for Trend Validation:
• The script applies an additional confirmation filter using a Moving Average (SMA/EMA).
• Buy signals trigger only when the price is above the MA, aligning with trend direction.
• Sell signals trigger only when the price is below the MA, ensuring alignment with the broader market structure.
✅ Trade Cooldown Mechanism (Minimum Bars Between Signals):
• To avoid frequent signals in sideways markets, a cooldown period is implemented.
• Default: 5 bars between signals (adjustable).
• Prevents rapid consecutive trades, reducing false entries.
Key Features
✔️ Supertrend & Moving Average Confirmation – Ensures trades are taken only in the correct trend direction.
✔️ Bollinger Bands Integration – Helps identify high-probability reversal zones.
✔️ ADX Strength Filtering – Ensures trades are only executed when the market has enough strength.
✔️ Momentum-Based RSI Filtering – Avoids counter-trend trades and confirms directional strength.
✔️ Trade Cooldown Mechanism – Reduces overtrading and noise in sideways markets.
✔️ Webhook Alerts for Automation – Auto-execute trades or receive real-time notifications.
✔️ Customizable Inputs – Adjustable thresholds, EMA/SMA length, ADX filter, cooldown period for flexibility.
✔️ Works Across Multiple Timeframes – Suitable for scalping (5m, 15m), swing trading (1H, 4H), and position trading (Daily).
How to Use
📌 Scalping & Intraday Trading:
• Use on 5m, 15m, or 30m timeframes.
• Look for Bollinger Band touch + RSI confirmation + Supertrend support/resistance validation before entering trades.
📌 Swing Trading:
• Use on 1H or 4H timeframes.
• Enter only when ADX is strong and price aligns with Supertrend direction.
📌 Webhook Automation:
• Set up TradingView Alerts to auto-execute trades via Webhook-compatible platforms.
Why This Combination?
This indicator is not just a simple moving average crossover tool.
It is designed to filter out weak breakouts and only execute trades that have:
✅ Trend confirmation (Supertrend + Moving Average)
✅ Volatility filtering (Bollinger Bands for overbought/oversold confirmation)
✅ Momentum validation (RSI threshold filtering)
✅ Market strength requirement (ADX ensures sufficient momentum)
This multi-layered approach ensures that only the highest-quality setups are executed, improving both win rate and reliability.
Why It’s Worth Using?
🚀 Reduces False Breakouts – Avoids weak breakouts by requiring ADX confirmation.
🚀 Works in All Market Conditions – Trend-following logic for trending markets, volatility-based entries for reversals.
🚀 Customizable to Any Trading Style – Adjustable parameters for trend, momentum, and strength filtering.
🚀 Seamless Webhook Automation – Execute trades automatically with TradingView alerts.
🚀 Ready to trade smarter?
✅ Add the Smart Buy/Sell Signal Indicator to your TradingView chart today! 🎯🔥

Multi-Timeframe ATR Levels by Hitesh2603Description:
"Multi-Timeframe ATR Levels by Hitesh2603" is a versatile and adaptive indicator designed to help traders identify key price levels based on the Average True Range (ATR) from a higher timeframe. The script automatically adapts to the current chart’s timeframe and allows you to customize the higher timeframe for ATR calculations, making it ideal for intraday and swing trading strategies.
The indicator plots upper and lower price levels based on the ATR multiplier, providing clear visual cues for potential profit-taking or exit points. It also includes features like editable timeframe presets , historical level plotting , labels , and alerts , making it a powerful tool for traders of all experience levels.
---
Key Features:
1. Automatic Timeframe Adaptation : - The script automatically detects the current chart’s timeframe and selects the appropriate higher timeframe for ATR calculations.
2. Editable Preset Timeframe Pairs : - Customize the higher timeframe for each chart timeframe directly in the indicator settings.
3. Dynamic ATR-Based Levels :- Plots upper and lower price levels using the formula:
- Upper Level = Current Candle Open + (Previous Candle ATR * Multiplier)
- Lower Level = Current Candle Open - (Previous Candle ATR * Multiplier)
4. Customizable Inputs :
- Adjust ATR length, multiplier, line length, colors, and more.
5. Labels :
- Displays the exact values of the upper and lower levels for easy reference.
6. Historical Levels :
- Optionally plots historical levels for all candles.
7. Alerts :
- Get notified when the price crosses the upper or lower levels.
---
Use Cases:
1. Intraday Trading :
- Use the script on a 5-minute or 15-minute chart with a 1-hour higher timeframe to identify intraday profit-taking or exit points.
2. Swing Trading :
- Use the script on a 1-hour or 4-hour chart with a daily higher timeframe to identify swing trading opportunities.
3. Position Trading :
- Use the script on a daily chart with a weekly higher timeframe to identify key levels for position trading.
4. Breakout Confirmation :
- Use the upper and lower levels as confirmation points for breakouts or reversals.
5. Risk Management :
- Use the levels to set stop-loss or take-profit targets based on market volatility.
---
How to Use:
1. Add the Script to Your Chart :
- Search for "Multi-Timeframe ATR Levels by Hitesh2603" in the TradingView indicator library and add it to your chart.
2. Customize the Settings :
- Adjust the inputs (e.g., ATR length, multiplier, line length, colors, etc.) to suit your trading strategy.
3. Set the Higher Timeframe :
- The script will automatically display an input for the higher timeframe based on the current chart’s timeframe. Customize it as needed.
4. Interpret the Levels :
- The script will plot two horizontal lines (upper and lower levels) on the chart. Use these levels for profit-taking, exits, or breakout confirmation.
5. Enable Alerts :
- Set up alerts to get notified when the price crosses the upper or lower levels.
---
Input Parameters:
1. ATR Length :
- The period used to calculate the ATR (default: 14).
2. ATR Multiplier :
- The multiplier applied to the ATR to calculate the levels (default: 0.65).
3. Line Length :
- The number of candles to extend the lines (default: 10).
4. Show Labels :
- Toggle to display the exact values of the levels (default: true).
5. Show Historical Levels :
- Toggle to plot historical levels for all candles (default: false).
6. Line Colors :
- Customize the colors of the upper and lower levels.
7. Line Width :
- Adjust the thickness of the lines (default: 2).
---
Example:
- Current Chart : 5-minute
- Higher Timeframe : 1-hour
- Previous Hour’s ATR : 4.6
- Current Hour’s Open : 102
- Multiplier : 0.65
Levels :
- Upper Level = 102 + (4.6 * 0.65) = 105.0
- Lower Level = 102 - (4.6 * 0.65) = 99.0
The script will plot horizontal lines at 105.0 and 99.0 on the 5-minute chart.
---
Alerts:
- Price Crosses Upper Level :
- Triggered when the price crosses above the upper level.
- Price Crosses Lower Level :
- Triggered when the price crosses below the lower level.
---
Notes:
- The script is designed to be flexible and adaptable to various trading styles and timeframes.
- Always backtest and validate the indicator with your trading strategy before using it in live trading.
---
Credits:
- Developed by Hitesh2603 .
- Special thanks to the TradingView community for inspiration and support.

Crystal Order BlockThe Crystal Order Block Indicator is a powerful tool designed to help traders identify key institutional order blocks with high precision. This indicator is ideal for traders following Smart Money Concepts (SMC) and Institutional Trading Strategies, providing clear insights into potential high-probability trade setups.
🔹 Key Features:
✔ Automatic Order Block Detection: Identifies valid bullish & bearish order blocks.
✔ Unmitigated Order Blocks Highlighted: Focuses on fresh order blocks for improved trade opportunities.
✔ Trend-Focused Trading: Works best when combined with market structure analysis.
✔ Multi-Timeframe Support: Suitable for scalping, swing trading, and intraday trading.
✔ Risk Management Enhancement: Helps traders refine entries and exits based on institutional price movements.
📈 How to Use the Crystal Order Block Indicator:
🔹 Identifying Order Blocks:
➡ The indicator automatically detects order blocks formed by institutional trading activity.
➡ Unmitigated order blocks are highlighted, indicating areas where price may react.
🔹 High-Probability Trade Setups:
➡ Buy Setup: Look for a bullish order block in an uptrend, confirming strength.
➡ Sell Setup: Identify a bearish order block in a downtrend for potential short trades.
🔹 Order Block Mitigation:
➡ The updated version filters out mitigated order blocks, allowing traders to focus on fresh trading opportunities.
📊 Best Practices & Timeframes:
🔸 Works on all timeframes, but higher accuracy is observed on M30 and above.
🔸 Best suited for Smart Money Trading, Institutional Trading, and Price Action Strategies.
🔸 Should be used with liquidity concepts and market structure analysis for enhanced precision.
⚠ Important Note:
This indicator is a technical tool designed to assist traders in market analysis. It does not guarantee success and should be used alongside proper risk management and trading discipline.

Flux Charts - SFX Screener💎 GENERAL OVERVIEW
The SFX Screener by Flux Charts is a multi-timeframe market scanner that extracts and visually organizes key conditions detected by the SFX Algo indicator across multiple assets in real-time. It does not perform independent analysis or generate new signals—instead, it pulls data directly from the SFX Algo’s calculations to ensure full alignment across different timeframes and tickers.
The SFX Algo is a multi-factor trading indicator that integrates trend analysis, signal generation, market overlays, and take-profit/stop-loss levels into a single system. It evaluates multiple trend components, including EMA direction, momentum shifts, and volatility cycles, to determine market conditions. Signal generation is based on an Adjusted Weighted Majority Algorithm, filtering out weaker signals by prioritizing the most reliable market indicators. Market overlays, such as Volatility Bands and the Retracement Wave, provide dynamic support, resistance, exit points, and entry points. Its adaptable structure allows traders to customize settings based on strategy preferences, making it effective for scalping, swing trading, and long-term trend analysis.
The SFX Screener’s purpose is to give traders a dashboard view of these SFX Algo signals across multiple tickers and timeframes in real-time.
📌 HOW DOES IT WORK ?
The SFX Algo indicator employs an Adjusted Weighted Majority algorithm to generate "buy" and "sell" signals. It evaluates multiple market indicators ("experts"), including momentum, ATR trends, and EMA trends, and assigns weights based on their recent performance. The "Time Weighting" setting allows users to balance between using more historical data or prioritizing recent trends. Unlike traditional weighted majority methods, SFX also dynamically penalizes larger losses. Signals are confirmed based on the consensus of the most successful indicators within the selected time period, filtering out weaker signals during underperforming phases.
The SFX Screener extracts these calculated outputs and visually organizes them into a real-time dashboard. Each signal, status, and volatility condition displayed in the screener is a direct output from the SFX Algo indicator.
🚩 UNIQUENESS
Unlike traditional screeners that rely on preset filters or static conditions, the SFX Screener dynamically updates its dashboard based on live outputs from the SFX Algo’s adaptive algorithm.
Traditional Screeners → Use predefined filters like “price above EMA” or “RSI overbought.” They do not adjust to market dynamics.
SFX Screener → Displays outputs directly from an adaptive algorithm that continuously evaluates trends, volatility, and momentum changes.
The SFX Screener can show SFX Algo's status on 8 different tickers on different timeframes. Key factors that make it unique include:
✅ Real-time sync with SFX Algo → Displays live conditions, not static filters.
✅ Comprehensive Dashboard – This screener provides a complete and customizable dashboard designed to enhance traders' decision-making by consolidating crucial SFX Algo insights into one user-friendly interface.
✅ Multi-Ticker & Multi-Timeframe Analysis – With support for up to 8 tickers and timeframes, traders can effortlessly analyze the bigger market picture, identifying trends and opportunities across different assets and timeframes.
By combining multiple analytical elements in a single view, this screener empowers traders with the insights needed to navigate the market more effectively.
🎯 SFX SCREENER FEATURES:
SFX Algo Signals : This tool can detect SFX Algo signals across different tickers & timeframes.
Volatility Bands : Detection of Volatility Bands Status & Retests.
Retracement Wave : Detection of Retracement Wave Status & Retests.
Highly Configurable : Offers multiple parameters for fine-tuning detection settings.
Up to 8 Tickers : Allows traders to analyze multiple tickers & timeframes simultaneously for enhanced accuracy.
📊 SFX SCREENER DATA BREAKDOWN
Signal ->
Buy -> The latest signal is a buy signal.
Sell -> The latest signal is a sell signal.
The rating of the signal is shown after the signal type.
Δ⭐ ->
Shows the rating change (delta) after the signal is triggered. Positive values mean that the rating is increased after the signal is given, negative values mean that it's decreased.
Status ->
Displays the amount of time passed after the signal is given.
TP Targets ->
Shows the Take-Profit targets of the signal, if a target was achieved, there is a ✅ symbol near it and the next target it displayed.
V. Bands ->
The Volatility Bands dynamically adjust to market conditions, expanding during high volatility and contracting during low volatility. When the volatility bands are tight, or the upper and lower bands are close to each other, the market is not volatile. During periods of low volatility, it’s common for price to consolidate or move sideways. An early indication of a large price move can occur when the bands widen or open up after being tight. When the volatility bands are wide, it reflects a period of increased volatility, typically during strong price trends or after a breakout. The volatility bands can also act as support and resistance areas. The upper band acts as resistance while the lower band acts as support. These mark out good areas for potential reversals. Breakouts can also occur when price moves beyond the bands, signaling a potential trend in the breakout direction.
Outside -> The price is currently outside of the Volatility Bands.
Inside | Upper -> The price is currently inside the Upper Volatility Band.
Inside | Lower -> The price is currently inside the Lower Volatility Band.
R. Wave ->
The Retracement Wave is used to identify entry points during pullbacks in trending markets. It can also be used to find exit points for open trades. The wave is bullish when price is above it and bearish when the price is below it. The retracement wave can be used as an area to enter during a pullback in a trending market. The wave can also be helpful for managing risk and closing out positions.
Outside | Bullish -> The Retracement Wave is currently Bullish, and the price is outside of it.
Outside | Bearish -> The Retracement Wave is currently Bearish, and the price is outside of it.
Inside | Bullish -> The Retracement Wave is currently Bullish, and the price is inside of it.
Inside | Bearish -> The Retracement Wave is currently Bearish, and the price is inside of it.
Profit & Loss (P&L) ->
Shows the amount of profit or loss the position is currently in. All values are shown in terms of percentage, and positive values mean the position is in profit while negative values mean that the position is in loss.
⚠ Timeframe Restriction : The selected timeframes for analysis cannot be lower than the chart’s current timeframe to ensure proper data alignment.
⏰ ALERTS
This screener supports alerts, so you never miss a key market move. You can choose to receive alerts when a buy or sell signal is given, helping you spot potential trading opportunities. Additionally, you can enable alerts for take-profit or stop-loss levels, which notify you when the price achieves those levels. The alerts will work for each enabled ticker in the settings. You can also toggle webhook format for alerts, and choose to include ticker metadata in it.
⚙️ SETTINGS
1. Algorithm Settings
Sensitivity: The sensitivity setting is a key parameter that influences the frequency of signals the SFX Algo generates. By adjusting this parameter, you can control the frequency of signals produced by the algorithm. Using a lower sensitivity setting generates more frequent signals that are highly responsive to minor price fluctuations. Using a higher sensitivity setting reduces the frequency of signals, focusing on more significant price movements and filtering out minor fluctuations.
Signal Strength: The Signal Strength setting filters signals based on their quality, allowing traders to focus on the most reliable opportunities. This feature helps traders balance the quantity and reliability of the algorithm’s signals to suit their trading strategy. Using a lower signal strength will display more signals, including those with lower signal ratings, for broader market coverage. Using a higher signal strength will display fewer signals by prioritizing those with higher signal ratings, reducing market noise.
Time Weighting: The Time Weighting setting in the SFX Algo determines how historical market data is analyzed to generate signals.
a) Recent Trends
Focuses on the most recent movements for short-term analysis. This setting is good for scalpers and intraday traders who need to react quickly to market changes.
b) Mixed Trends
Balances recent and historical price movements for a comprehensive market view. This setting is well-suited for swing traders and those who want to capture medium-term opportunities by combining the benefits of short-term responsiveness with the reliability of long-term trends.
c) Long-term Trends
Relies on extended historical market data to identify broader market trends, making it an excellent choice for traders focused on long-term strategies.
Minimum Star Rating : The Minimum Star Rating setting allows you to filter signals based on their strength, showing only those that meet or exceed your chosen threshold. For instance, setting the minimum star rating to 3 ensures you only receive signals with a rating of 3 stars or higher.
2. Take Profit / Stop Loss Methods
Key Levels
The Key Levels method uses pivot points to set take profit and stop-loss levels. The TP and SL levels are shown when a new signal is generated.
Volatility Bands
This TP/SL method uses the Volatility Bands overlay to set dynamic TP and SL levels. These levels are not predetermined so they will not be shown in advance when a signal is generated.
Signal Rating
Sets take profit and stop-loss levels based on changes in a signal's rating strength. These levels are not predetermined so they will not be shown in advance when a signal is generated.
Auto Stop-Loss
The auto method can only be applied to the SL. The auto method allows the algorithm to detect SL automatically when a momentum shift is detected. You can adjust the risk tolerance of the Auto SL by adjusting the ‘Auto Risk Tolerance’ setting. You can choose between Low, Medium, and High. A high-risk tolerance will result in stop losses being triggered less often.
3. Tickers
You can set, then enable or disable up to 8 tickers in this section to get informed about their latest SFX Algo signal.
‼️ Important Notes
TradingView has limitations when running advanced screeners, resulting in the following restrictions:
Computation Errors:
The computation of using MTF features and viewing several tickers is very intensive on TradingView. This can sometimes cause calculation timeouts. When this occurs simply force the recalculation by modifying one indicator’s settings or by removing the indicator and adding it to your chart again.
Inconsistencies:
You may notice inconsistencies when viewing the screener on a chart with a specific symbol because screener tickers originate from different markets. Since the cryptocurrency market operates 24/7, while stock markets have defined opening and closing hours, the screener may return varying information depending on whether you're currently viewing a cryptocurrency, stock, or currency pair.

kurd fx Dynamic EMA StrategyDynamic EMA Strategy Explanation
This TradingView Pine Script indicator, "Dynamic EMA Strategy," is designed to plot Exponential Moving Averages (EMAs) dynamically based on the selected timeframe. It adjusts the EMA periods depending on whether the trader is scalping, swing trading, or position trading.
Functionality
1. Defining EMA Periods Based on Timeframe
The script determines appropriate EMA values based on the selected chart timeframe:
Scalping (1m, 3m, 5m)
Uses EMA 9, EMA 21, and EMA 50 for fast-moving market conditions.
Swing Trading (15m, 30m, 45m)
Uses EMA 50 and EMA 100, suitable for medium-term trend identification.
EMA 3 is disabled (na) in this mode.
Position Trading (1H and higher)
Uses EMA 100 and EMA 200 to identify long-term trends.
EMA 3 is disabled (na) in this mode.
2. EMA Calculation
The script calculates EMA values dynamically:
emaLine1 = ta.ema(close, ema1): Computes the first EMA.
emaLine2 = ta.ema(close, ema2): Computes the second EMA.
emaLine3 = not na(ema3) ? ta.ema(close, ema3) : na: Computes the third EMA only if applicable.
3. Plotting the EMAs
The script overlays the EMAs on the chart:
Blue Line (EMA 1) → Represents the fastest EMA.
Orange Line (EMA 2) → Represents the medium EMA.
Red Line (EMA 3) → Represents the slowest EMA (if applicable).
Each EMA is plotted using plot() with a specific color, linewidth of 2, and plot.style_line for a clean visualization.
Use Case
Scalpers can identify short-term momentum changes.
Swing traders can detect medium-term trends.
Position traders can spot long-term market trends.
This strategy helps traders adjust their EMA settings dynamically without manually changing them for different timeframes.

Peak Reaction Zones [BigBeluga]Peak Reaction Zones is an advanced Smart Money Concept (SMC) indicator that identifies the most recent swing high and swing low zones, helping traders determine premium and discount areas for optimal trade positioning.
🔵 Key Features:
Swing High & Low Zones:
Automatically detects the latest swing high and swing low levels.
Helps traders identify key reaction points where price is likely to respond.
Premium & Discount Concept:
The high zone represents a premium area, where price is overextended and may reverse.
The low zone represents a discount area, where price is undervalued and may bounce.
The midline dynamically marks the equilibrium of the range.
Adjustable Zone Width:
Users can fine-tune the width of the zones to match their trading style.
Wider zones capture broader reaction ranges, while narrower zones focus on precise levels.
Zone Retest Signals:
Blue markers appear when price retests the lower reaction zone, signaling potential support.
Orange markers appear when price retests the upper reaction zone, indicating possible resistance.
Price Labels for Key Levels:
Displays the price value of the swing high, swing low, and midline for quick reference.
Helps traders recognize major reaction points at a glance.
🔵 Usage:
Smart Money Trading: Utilize the premium and discount concept to align trades with institutional order flow.
Zone Reactions: Watch for price tests of reaction zones and use the retest signals to confirm potential reversals.
Midline Confirmation: If price holds above or below the midline, it can indicate directional bias.
Scalping & Swing Trading: Short-term traders can look for zone rejections, while swing traders can use the levels for trend continuation setups.
Peak Reaction Zones is a must-have tool for traders looking to trade with Smart Money Concepts, allowing for precise entries and exits based on key liquidity areas and market structure.
