Sniper SweepsPurpose
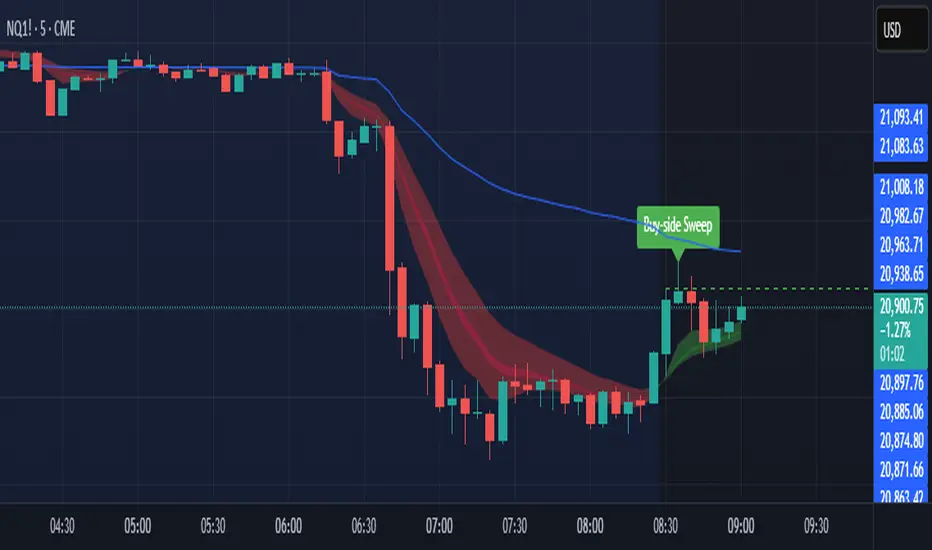
Detect when price sweeps above recent highs (buy-side liquidity) or below recent lows (sell-side liquidity), but closes back inside the range. This is often interpreted as a stop-hunt or liquidity grab by institutional traders.
Core Concepts
Liquidity Sweep: When price briefly breaks a recent swing high/low (potentially triggering stop losses), but then closes back within the previous range.
Buy-side Sweep: Price breaks a previous high, but closes below it.
Sell-side Sweep: Price breaks a previous low, but closes above it.
Summary
This indicator is useful for:
Identifying potential stop-hunts or liquidity grabs.
Recognizing SMC trade setups around swept highs/lows.
Getting alerted when significant liquidity levels are manipulated.
"swing high low" için komut dosyalarını ara
Anchored VWAP by Time (Math by Thomas)📄 Description
This tool lets you plot an Anchored Volume Weighted Average Price (VWAP) starting from any specific date and time you choose. Unlike standard VWAPs that reset daily or weekly, this version gives you full control to track institutional pricing zones from precise anchor points—such as key swing highs/lows, market open, or news-driven candles.
It’s especially useful for price action and Smart Money Concepts (SMC) traders who track liquidity, fair value gaps (FVGs), and institutional zones.
🇮🇳 For NSE India Traders
You can anchor VWAP to Indian market open (e.g., 9:15 AM IST) or major events like RBI policy, earnings, or breakout candles.
The time input uses UTC by default, so for Indian Standard Time (IST), remember:
9:15 AM IST = 3:45 AM UTC
3:30 PM IST = 10:00 AM UTC
⚙️ How to Use
Add the indicator to your chart.
Open the settings panel.
Under “Anchor Start Time”, choose the date & time to begin the VWAP.
Use UTC format (adjust from IST if needed).
Customize the line color and thickness to suit your chart style.
The VWAP will begin plotting from that time forward.
🔎 Best Use Cases
Track VWAP from intraday range breakouts
Anchor from swing highs/lows to identify mean reversion zones
Combine with your FVGs, Order Blocks, or CHoCHs
Monitor VWAP reactions during key macro events or expiry days
🔧 Clean Design
No labels are used, keeping your chart clean.
Works on all timeframes (1min to Daily).
Designed for serious intraday & positional traders.

IPDA with Order Blocks [Enhanced]Summary of the Code
This script plots IPDA Standard Deviations on a price chart, helping traders visualize potential support and resistance levels based on a series of user-defined deviations. It uses swing high/low points and time-based fractal lookbacks (monthly, weekly, daily, or intraday) to define price anchors and compute deviation lines.
Key features include:
Deviations: It calculates and plots deviation levels based on the distance between swing highs and lows, which traders can use as price targets or zones of interest.
Timeframes:
Monthly (higher timeframe analysis)
Weekly (medium-term analysis)
Daily and Intraday (shorter-term precision)
Customization:
Choose which deviation levels (e.g., 0, 1, -1, -2) to display.
Hide labels or adjust their sizes for cleaner charts.
Option to remove invalidated deviation levels dynamically.
Visual Cleanliness: Automatically removes clutter by hiding or deleting invalid deviation levels and focusing on active price zones.
How to Utilize It for Intraday Trading to Make $1,000
Here’s how to effectively use the indicator to optimize intraday trading:
1. Set the Right Timeframe:
Use the 15-minute or 1-hour chart for intraday setups.
Ensure the "Intraday" lookback option is enabled to focus on shorter-term swings.
2. Interpret the Levels:
Bearish Order Blocks: Look for red lines (bearish deviation) as potential resistance zones where the price may reverse downward.
Bullish Order Blocks: Look for green lines (bullish deviation) as potential support zones where the price may bounce upward.
3. Plan Entries and Exits:
Entry: Buy near a green order block or short near a red order block, confirming the trade with additional signals (e.g., candlestick patterns, momentum indicators).
Stop Loss: Place your stop below the green line (for buys) or above the red line (for shorts).
Profit Targets: Use deviation levels as targets (e.g., from the 0 level to +1 or -1).
4. Combine with Market Context:
Use the script alongside volume profile, trend indicators, or news events for confirmation.
Avoid trading during major news events unless aligned with deviations.
5. Position Sizing for $1,000 Goal:
Trade liquid instruments like Nasdaq futures (NQ) or major forex pairs.
Risk 1-2% of your capital on each trade and scale into positions if confirmed.
Target a profit of 10-20 points per trade on Nasdaq futures, with 1-2 trades daily.
6. Monitor Key Timeframes:
Pre-market (before 9:30 AM EST): Mark deviation levels to predict market open behavior.
Midday & Power Hour (3-4 PM EST): Watch for breakouts or retests around key deviation levels.
By combining this tool with disciplined risk management and a clear trading plan, you can systematically work toward your profit target while minimizing unnecessary risks

Price & Time SquaredHi Traders..
This is one of Gann's trading method, called Price & Time Squared. When price & time meets, price will reverse."
as you see, those lines (past & future) represent the forecast of 'potential' swing (swing high/low or turning up/ down)
here are some examples:
Weekly
Daily
H1
M30
M15
M5
How to trade (very simple):
- if the trend is down and tomorrow there is a 'Price & Time Squared Line', we can prepare to take long position (combine with your favorite price action)
- if the trend is up and tomorrow there is a 'Price & Time Squared Line', we can prepare to take short position (combine with your favorite price action)
- stop loss if the chart makes Lower Low (for Long Position)
- stop loss if the chart makes Higher High (for Short Position)
you can use those lines as guidance in your trading (just like Traffic Light)
PS:
-if you see 2 or 3 lines close together, or 2 or 3 lines stack in 1 line (cluster), it means the Time Factor is 'Strong'
the stronger the cluster the stronger the Time Factor
- due to time delay & time lag, the turning can be +/- 1 bar
- PM for trial access
“Time is the most important factor of all and not until sufficient time has expired does any big move start up or down. The time factor will overbalance both space and volume. When time is up, space movement will start and large volume will begin, either up or down.

SuperIchi StrategyTRADE CONDITIONS
Long entry:
Tenkan-Sen is above Kijun-Sen (blue line above red line)
Price closes above both Tenkan-Sen and Kijun-Sen (price closes above both blue and red lines)
Tenkan-Sen and Kijun-Sen is above Senkou Span (both blue and red lines are above cloud)
Senkou Span is green (cloud is green)
Price pulled back and closed below both Tenkan-Sen and Kijun-Sen within last X (configurable in settings) candles (price pulled back below blue and red lines)
Short entry:
Tenkan-Sen is below Kijun-Sen (blue line below red line)
Price closes below both Tenkan-Sen and Kijun-Sen (price closes below both blue and red lines)
Tenkan-Sen and Kijun-Sen is below Senkou Span (both blue and red lines are below cloud)
Senkou Span is red (cloud is red)
Price pulled back and closed above both Tenkan-Sen and Kijun-Sen within last X (configurable in settings) candles (price pulled back above blue and red lines)
Risk management:
Each trade risks 2% of account (configurable in settings)
SL size determined by swing low/high of previous X candles (configurable in settings) or using the ATR override (configurable in settings) where the max of swing high/low or ATR value will be used to calculate SL
TP is calculated by Risk:Reward ratio (configurable in settings)
TIPS
Timeframe: I have found best results running on anything 5M and above
CREDITS
SuperIchi by LuxAlgo

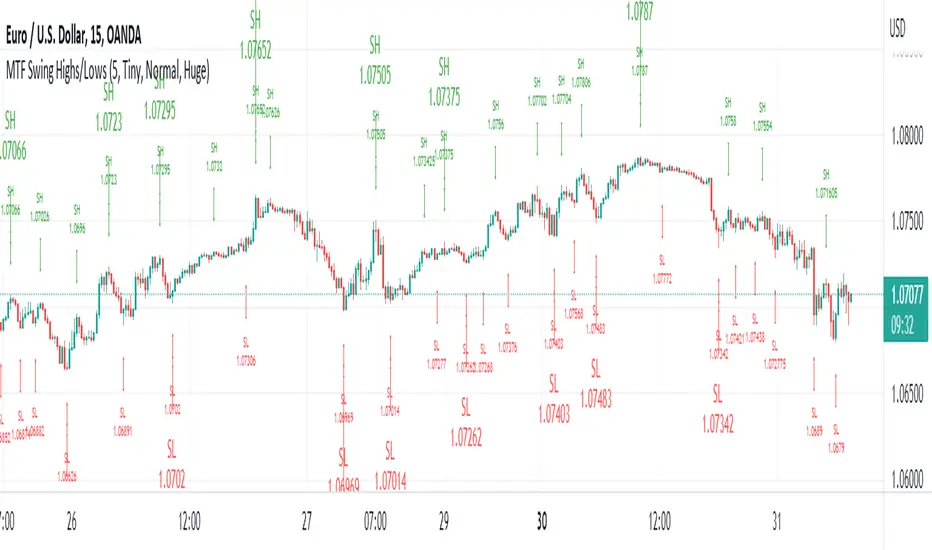
MTF Swing Highs/LowsI designed this indicator out of necessity for the Market structure/Price action trading strategy I use.
I thought I'd share. :)
This indicator displays Swing Highs and Lows an 3 timeframes based on the Chart timeframe, as follows:
Chart TF Higher TF Highest TF
1m 5m 15m
5m 15m 60m
15m 60m 240m
60m 240m Daily
You can change the font size of the labels as you'd prefer.
Swing Failure Pattern SuvorovIndicator: Logic-based Swing Failure Pattern (SFP)
What is the logic of my indicator based on and what makes it unique:
1. The indicator can calculate extreme candles that close with huge shadows and a small body and it works on any timeframe.
2. The indicator analyzes the volumes on which the desired bar was closed. This function is customizable. That is, you can build a search for signals according to your trading strategy, based on the number of volumes. What does this mean - you select the number of previous bars where the indicator calculates the average value and based on these numbers, you can set up: how many times the desired candle should be larger than the previous average volume.
3. Since SFP is based on the removal of important liquidity, the search for such situations occurs from swing structures (swing high/low). When these parameters are found on the chart (on history), the indicator draws the situation and shows where important liquidity was removed and why the trading situation appeared right now.
4. The indicator gives recommendations on possible takes and stops.
The structure of takes has a built-in logic for searching for previous swings to remove liquidity, as well as searching for imbalances to cover them (50 and 100%).
5. For TP (Take Profit): there are 3 TPthat can be adjusted to your trading strategy (Risk/Profit). For example: you always trade from 2 to 1 on the 1st Take, 3 to 1 on the second, 5 to 1 on the third: you can set all this in the indicator and all your targets will be detected by the indicator, taking into account the logic of searching for important ranges. If, for example, in your 3 to 1 range there are no important zones for TP, then the indicator writes that NaN (not found).
6. The indicator works on any timeframe.
7. The indicator has a built-in RSI logic, which comes as an additional function to the indicator. If this function is enabled, then trading situations are detected only when there is a divergence (from the swing point to the extreme bar that has formed).
Katz Exploding PowerBand FilterUnderstanding the Katz Exploding PowerBand Filter (EPBF) v2.4
1. Indicator Overview
The Katz Exploding PowerBand Filter (EPBF) is an advanced technical indicator designed to identify moments of expanding bullish or bearish momentum, often referred to as "power." It operates as a standalone oscillator in a separate pane below the main price chart.
Its primary goal is to measure underlying market strength by calculating custom "Bull" and "Bear" power components. These components are then filtered through a versatile moving average and a dual signal line system to generate clear entry and exit signals. This indicator is not a simple momentum oscillator; it uses a unique calculation based on exponential envelopes of both price and squared price to derive its values.
2. On-Chart Lines and Components
The indicator pane consists of five main lines:
Bullish Component (Thick Green/Blue/Yellow/Gray Line): This is the core of the indicator. It represents the calculated bullish "power" or momentum in the market.
Bright Green: Indicates a strong, active long signal condition.
Blue: Shows the bull component is above the MA filter, but the filter itself is still pointing down—a potential sign of a reversal or weakening downtrend.
Yellow: A warning sign that bullish power is weakening and has fallen below the primary signal lines.
Gray: Represents neutral or insignificant bullish power.
Bearish Component (Thick Red/Purple/Yellow/Gray Line): This line represents the calculated bearish "power" or downward momentum.
Bright Red: Indicates a strong, active short signal condition.
Purple: Shows the bear component is above the MA filter, but the filter itself is still pointing down—a sign of potential trend continuation.
Yellow: A warning sign that bearish power is weakening.
Gray: Represents neutral or insignificant bearish power.
MA Filter (Purple Line): This is the main filter, calculated using the moving average type and length you select in the settings (e.g., HullMA, EMA). The Bull and Bear components are compared against this line to determine the underlying trend bias.
Signal Line 1 (Orange Line): A fast Exponential Moving Average (EMA) of the stronger power component. It acts as the first level of dynamic support or resistance for the power lines.
Signal Line 2 (Lime/Gray Line): A slower EMA that acts as a confirmation filter.
Lime Green: The line turns lime when it is rising and the faster Signal Line 1 is above it, indicating a confirmed bullish trend in momentum.
Gray: Indicates a neutral or bearish momentum trend.
3. On-Chart Symbols and Their Meanings
Various characters are plotted at the bottom of the indicator pane to provide clear, actionable signals.
L (Pre-Long Signal): The first sign of a potential long entry. It appears when the Bullish Component rises and crosses above both signal lines for the first time.
S (Pre-Short Signal): The first sign of a potential short entry. It appears when the Bearish Component rises and crosses above both signal lines for the first time.
▲ (Post-Long Signal): A stronger confirmation for a long entry. It appears with the 'L' signal only if the momentum trend is also confirmed bullish (i.e., the slower Signal Line 2 is lime green).
▼ (Post-Short Signal): A stronger confirmation for a short entry. It appears with the 'S' signal only if the momentum trend is confirmed bullish.
Exit / Take-Profit Symbols:
These symbols appear when a power component crosses below a line, suggesting that momentum is fading and it may be time to take profit.
⚠️ (Exit Signal 1): The Bull/Bear component has crossed below the main MA Filter. This is the first and most sensitive take-profit signal.
☣️ (Exit Signal 2): The Bull/Bear component has crossed below the faster Signal Line 1. This is a moderate take-profit signal.
🚼 (Exit Signal 3): The Bull/Bear component has crossed below the slower Signal Line 2. This is the slowest take-profit signal, suggesting the trend is more definitively exhausted.
4. Trading Strategy and Rules
Long Entry Rules:
Initial Signal: Wait for an L to appear at the bottom of the indicator. This confirms that bullish power is expanding.
Confirmation (Recommended): For a higher-probability trade, wait for a green ▲ symbol to appear. This confirms the underlying momentum trend aligns with the signal.
Entry: Enter a long (buy) position on the opening of the next candle after the signal appears.
Short Entry Rules:
Initial Signal: Wait for an S to appear at the bottom of the indicator. This confirms that bearish power is expanding.
Confirmation (Recommended): For a higher-probability trade, wait for a maroon ▼ symbol to appear. This confirms the underlying momentum trend aligns with the signal.
Entry: Enter a short (sell) position on the opening of the next candle after the signal appears.
Take Profit (TP) Rules:
The indicator provides three levels of take-profit signals. You can choose to exit your entire position or scale out at each level.
For a long trade, exit when you see ⚠️, ☣️, or 🚼 appear below the Bullish Component.
For a short trade, exit when you see ⚠️, ☣️, or 🚼 appear below the Bearish Component.
Stop Loss (SL) Rules:
The indicator does not provide an explicit stop loss. You must use your own risk management rules. Common methods include:
Swing High/Low: For a long position, place your stop loss below the most recent significant swing low on the price chart. For a short position, place it above the most recent swing high.
ATR-Based: Use an Average True Range (ATR) indicator to set a volatility-based stop loss.
Fixed Percentage: Risk a fixed percentage (e.g., 1-2%) of your account on the trade.
5. Disclaimer
This indicator is a tool for technical analysis and should not be considered financial advice. All trading involves significant risk, and past performance is not indicative of future results. The signals generated by this indicator are probabilistic and can result in losing trades. Always use proper risk management, such as setting a stop loss, and never risk more than you are willing to lose. It is recommended to backtest this indicator and use it in conjunction with other forms of analysis before trading with real capital. The indicator should only be used for educational purposes.

Kaufman Trend Strategy# ✅ Kaufman Trend Strategy – Full Description (Script Publishing Version)
**Kaufman Trend Strategy** is a dynamic trend-following strategy based on Kaufman Filter theory.
It detects real-time trend momentum, reduces noise, and aims to enhance entry accuracy while optimizing risk.
⚠️ _For educational and research purposes only. Past performance does not guarantee future results._
---
## 🎯 Strategy Objective
- Smooth price noise using Kaufman Filter smoothing
- Detect the strength and direction of trends with a normalized oscillator
- Manage profits using multi-stage take-profits and adaptive ATR stop-loss logic
---
## ✨ Key Features
- **Kaufman Filter Trend Detection**
Extracts directional signal using a state space model.
- **Multi-Stage Profit-Taking**
Automatically takes partial profits based on color changes and zero-cross events.
- **ATR-Based Volatility Stops**
Stops adjust based on swing highs/lows and current market volatility.
---
## 📊 Entry & Exit Logic
**Long Entry**
- `trend_strength ≥ 60`
- Green trend signal
- Price above the Kaufman average
**Short Entry**
- `trend_strength ≤ -60`
- Red trend signal
- Price below the Kaufman average
**Exit (Long/Short)**
- Blue trend color → TP1 (50%)
- Oscillator crosses 0 → TP2 (25%)
- Trend weakens → Final exit (25%)
- ATR + swing-based stop loss
---
## 💰 Risk Management
- Initial capital: `$3,000`
- Order size: `$100` per trade (realistic, low-risk sizing)
- Commission: `0.002%`
- Slippage: `2 ticks`
- Pyramiding: `1` max position
- Estimated risk/trade: `~0.1–0.5%` of equity
> ⚠️ _No trade risks more than 5% of equity. This strategy follows TradingView script publishing rules._
---
## ⚙️ Default Parameters
- **1st Take Profit**: 50%
- **2nd Take Profit**: 25%
- **Final Exit**: 25%
- **ATR Period**: 14
- **Swing Lookback**: 10
- **Entry Threshold**: ±60
- **Exit Threshold**: ±40
---
## 📅 Backtest Summary
- **Symbol**: USD/JPY
- **Timeframe**: 1H
- **Date Range**: Jan 3, 2022 – Jun 4, 2025
- **Trades**: 924
- **Win Rate**: 41.67%
- **Profit Factor**: 1.108
- **Net Profit**: +$1,659.29 (+54.56%)
- **Max Drawdown**: -$1,419.73 (-31.87%)
---
## ✅ Summary
This strategy uses Kaufman filtering to detect market direction with reduced lag and increased smoothness.
It’s built with visual clarity and strong trade management, making it practical for both beginners and advanced users.
---
## 📌 Disclaimer
This script is for educational and informational purposes only and should not be considered financial advice.
Use with proper risk controls and always test in a demo environment before live trading.

RJ_ Vader Master IndicatorOverview
The Rj_Vader Master Indicator is a trend-following tool designed to identify key momentum shifts using a dual EMA system. It highlights crossover signals, potential reversal levels, and visually marks significant swing highs and lows. The script provides clear dynamic support/resistance levels along with color-coded trend zones for quick market direction analysis.
🔑 Features
Dual EMA Trend Detection
Fast EMA (default 12)
Slow EMA (default 25)
Crossovers confirm trend changes.
Automatic Swing Level Marking
Detects the most recent swing high/low during crossovers.
Plots horizontal levels with optional extension.
Dynamic Line Management
Extend support/resistance levels until invalidated.
Dotted lines mark broken levels.
Adjustable limit on how many lines to display.
Visual Trend Zone Highlighting
Gradient fill between EMAs for bullish/bearish zones.
Color strength adapts to EMA spread (trend momentum).
Signal Alerts
Marks potential entry/exit points with labels and symbols at EMA crossovers.

Scalper - Pattern Recognition & Price Action Scalper - Pattern Recognition & Price Action Educational Indicator
**Originality and Educational Innovation**
**Why This Comprehensive Integration Merits a New Publication**
This indicator addresses a specific educational gap in technical analysis learning: **the lack of integrated pattern recognition systems that systematically combine traditional candlestick analysis with modern price action concepts in a unified confluence framework**. While individual components like moving averages, RSI, CCI, and basic candlestick patterns are well-established tools, this indicator's originality lies in its **comprehensive educational methodology** and **systematic multi-signal confluence engine**.
**Original Educational Framework:**
1. **Multi-Layer Confluence System**: Original algorithm that systematically combines 6+ different signal categories with customizable threshold requirements for educational analysis
2. **Modern Price Action Integration**: Educational implementation of Fair Value Gaps (FVG) and Order Block detection integrated with traditional pattern recognition
3. **Dynamic Support/Resistance Education**: Original strength-validated S/R system using statistical touch-count methodology rather than simple pivot points
4. **Comprehensive Pattern Library**: Educational collection combining basic and advanced candlestick patterns with mathematical validation criteria
5. **Customizable Multi-Timeframe Framework**: Educational tool allowing cross-timeframe analysis for understanding trend context
**How the Educational Components Work Together Systematically**
**Educational Layer 1 - Trend Context Understanding**: Multi-timeframe moving averages (customizable SMA/EMA/WMA/VWMA/HMA) establish directional bias for learning trend analysis
**Educational Layer 2 - Pattern Recognition Learning**: 15+ mathematically-defined candlestick patterns from basic engulfing to complex three-soldier formations demonstrate systematic pattern identification
**Educational Layer 3 - Modern Price Action Education**: Fair Value Gaps and Order Blocks teach institutional footprint recognition and market structure analysis
**Educational Layer 4 - Dynamic S/R Framework**: Strength-validated support/resistance levels demonstrate statistical validation methodology
**Educational Layer 5 - Momentum Analysis Education**: RSI and CCI extreme reversal detection teaches momentum exhaustion identification
**Educational Layer 6 - Confluence Analysis Methodology**: Original multi-signal combination system demonstrates how to systematically analyze multiple factors
This integrated educational approach provides a comprehensive framework for learning how different technical analysis concepts work together in real market conditions, addressing the common problem of studying indicators in isolation.
**Detailed Technical Implementation and Educational Methodology**
**Original Multi-Signal Confluence Algorithm**
**Educational Confluence Scoring System:**
The indicator implements an original systematic approach to signal combination:
```
Bullish Signal Categories (Educational Analysis):
- Candlestick Patterns: Strong Engulfing, Morning Star, Hammer, Three White Soldiers
- Momentum Indicators: RSI oversold exit (75→70), CCI extreme reversal (-200→-180)
- Price Action: Volume-confirmed breakouts above resistance levels
Bearish Signal Categories (Educational Analysis):
- Candlestick Patterns: Bearish Engulfing, Evening Star, Hanging Man, Three Black Crows
- Momentum Indicators: RSI overbought exit (25→30), CCI extreme reversal (200→180)
- Price Action: Volume-confirmed breakdowns below support levels
Original Confluence Calculation:
User-configurable minimum threshold (2-6 signals required)
Real-time signal counting with dynamic visual feedback
Educational labels showing current signal strength
```
**Why This Systematic Approach is Original:**
Most indicators show patterns individually without systematic combination methodology. This indicator provides an educational framework for understanding how to weight and combine different types of analysis systematically.
**Advanced Pattern Recognition with Educational Validation**
**Original Pattern Validation Methodology:**
Each pattern includes multiple educational validation criteria:
```
Strong Engulfing Educational Criteria:
- Body size > ATR (volatility filter for market significance)
- Current body > previous body (strength confirmation)
- Complete price engulfment (mathematical validation)
- Volume confirmation (market participation validation)
Morning/Evening Star Educational Framework:
- First candle: Directional (bull/bear confirmation)
- Second candle: Indecision (body < 30% of current body)
- Third candle: Reversal confirmation with penetration validation
Three Soldiers/Crows Educational Requirements:
- Three consecutive candles meeting directional criteria
- Each candle body > ATR * 0.5 (significance filter)
- Progressive price advancement (momentum validation)
```
**Modern Price Action Educational Implementation**
**Original Fair Value Gap Detection Algorithm:**
```
Educational FVG Identification:
Bullish FVG: current_low > high AND close > open AND close < open
Bearish FVG: current_high < low AND close < open AND close > open
Educational Purpose: Understanding institutional inefficiencies
Visual Education: Semi-transparent boxes showing gap zones
Practical Learning: Identifying potential reversal or continuation areas
```
**Original Order Block Educational Detection:**
```
Educational Order Block Criteria:
Bullish: Previous candle bullish AND current close > previous high AND volume > 20-period average
Bearish: Previous candle bearish AND current close < previous low AND volume > 20-period average
Educational Purpose: Recognizing institutional accumulation/distribution
Visual Education: Highlighted zones showing institutional interest
Learning Application: Understanding market structure concepts
```
**Dynamic Support/Resistance Educational System**
**Original Strength-Validation Algorithm:**
```
Educational S/R Methodology:
1. Identify recent swing highs/lows over user-defined period
2. Calculate ATR-based tolerance levels (volatility adjustment)
3. Count historical touches within tolerance (statistical validation)
4. Create levels only when touches ≥ minimum strength requirement
5. Project levels forward for future price interaction analysis
Educational Advantage over Simple Pivots:
- Statistical validation through touch counting
- Volatility-adjusted tolerance (adapts to market conditions)
- Strength-based filtering (reduces noise)
- Forward-looking projection (practical application)
```
**Comprehensive Educational Features and Customization**
**Multi-Timeframe Educational Framework**
- **MA 1**: SMA 34 with customizable timeframe (short-term trend education)
- **MA 2**: SMA 63 with customizable timeframe (medium-term trend education)
- **MA 3**: User-selectable type (SMA/EMA/WMA/VWMA/HMA) with customizable timeframe
- **MA 4**: User-selectable type for long-term trend context
- **Educational Purpose**: Understanding cross-timeframe trend analysis
**Educational Pattern Detection Parameters**
- **ATR Length**: Volatility measurement for pattern significance (default: 14)
- **Volume Validation**: Historical volume comparison for pattern confirmation
- **Mathematical Ratios**: Precise wick/body ratios for pattern classification
- **Strength Filters**: Size and volume thresholds ensuring pattern validity
**Educational Price Action Configuration**
- **FVG Detection**: Three-candle gap analysis with directional confirmation
- **Order Block Settings**: Volume threshold and visual projection length
- **S/R Parameters**: Detection period, minimum touch count, tolerance calculation
- **Educational Visualization**: Clear boxes and labels for learning identification
**Customizable Educational Dashboard**
- **Position Control**: 6 different dashboard positions for optimal viewing
- **Color Customization**: Full color control for text, backgrounds, and signals
- **Real-Time Education**: Current RSI, CCI, ATR values for learning
- **Signal Analysis**: Live bullish/bearish signal counts for confluence education
- **Educational Branding**: Clear identification as learning tool
Educational Applications and Learning Outcomes
**Progressive Learning Structure for Technical Analysis**
**Beginner Level Education:**
- Moving average trend identification across timeframes
- Basic candlestick pattern recognition with mathematical criteria
- Introduction to support/resistance concepts with visual validation
**Intermediate Level Education:**
- Multi-pattern analysis and pattern strength assessment
- RSI and CCI momentum analysis with extreme level identification
- Volume analysis integration with pattern confirmation
**Advanced Level Education:**
- Fair Value Gap theory and practical institutional analysis
- Order Block detection and market structure understanding
- Multi-signal confluence methodology and systematic signal combination
**Practical Educational Workflow**
1. **Setup Phase**: Configure moving averages for chosen timeframes and enable desired patterns
2. **Context Analysis**: Study trend direction using multi-timeframe MA alignment
3. **Pattern Study**: Identify candlestick formations meeting mathematical validation criteria
4. **Price Action Learning**: Analyze FVG and Order Block formations for institutional insight
5. **Confluence Education**: Count and analyze multiple signal types for probability assessment
6. **Real-Time Practice**: Use dashboard for ongoing market analysis and signal tracking
**Educational Risk Management Concepts**
- **Pattern Reliability Understanding**: Learning which patterns have higher success rates
- **Signal Strength Analysis**: Understanding how confluence affects probability
- **Market Context Education**: Learning when patterns are most/least reliable
- **Systematic Analysis**: Developing consistent methodology for market evaluation
**Technical Requirements and Optimization**
**Performance Optimization for Education**
- **Visual Element Limits**: 500 maximum boxes, lines, and labels for stable performance
- **Efficient Calculations**: S/R updates every 10 bars for smooth operation
- **Memory Management**: Proper array management for dynamic level storage
- **Clean Interface**: Organized input groups for easy educational navigation
**Educational Visualization Standards**
- **Color-Coded Learning**: Consistent color scheme for pattern identification
- **Clear Labeling**: Educational text labels for all major patterns and signals
- **Professional Layout**: Organized visual hierarchy for systematic learning
- **Customizable Display**: User control over visual elements and positioning
**Educational Disclaimers and Learning Focus**
**Educational Purpose Statement**
This indicator is designed as a comprehensive educational tool for learning technical analysis concepts. It demonstrates how traditional candlestick analysis, modern price action concepts, and systematic confluence methodology can be integrated for educational purposes.
**Learning Tool Disclaimer**
The indicator provides an educational framework for studying:
- Traditional and modern technical analysis integration
- Systematic pattern recognition methodology
- Multi-signal confluence analysis techniques
- Price action and market structure principles
- Statistical validation approaches for support/resistance
**Risk Education and Understanding**
Technical analysis education requires understanding that:
- Patterns and indicators show historical relationships, not future guarantees
- Confluence analysis increases probability understanding but not certainty
- Educational study should focus on methodology rather than signal generation
- Proper risk management principles must be learned alongside technical analysis
- Real market conditions may differ from educational examples
**Systematic Learning Approach**
This educational tool emphasizes:
- **Methodology over Signals**: Focus on learning systematic analysis approaches
- **Understanding over Automation**: Developing analytical skills rather than relying on automated signals
- **Education over Trading**: Comprehensive learning framework for technical analysis concepts
- **Progressive Development**: Building skills systematically from basic to advanced concepts
**Technical Documentation and Implementation**
**Original Algorithm Documentation**
All custom algorithms are documented for educational transparency:
- Pattern detection mathematics with specific criteria
- Confluence scoring methodology with threshold requirements
- Support/resistance validation with statistical touch counting
- Price action detection with institutional footprint identification
**Educational Code Structure**
- **Comprehensive Comments**: Every section includes educational purpose explanation
- **Version Tracking**: Clear version documentation for educational development
- **Performance Notes**: Optimization techniques explained for learning
- **Customization Guidance**: Clear parameter explanation for educational experimentation
---
**Educational Innovation Summary:**
This implementation represents an original approach to technical analysis education, systematically combining traditional pattern recognition with modern price action concepts in an integrated confluence framework. The educational methodology addresses common learning gaps by providing systematic approaches to multi-signal analysis, statistical validation, and institutional footprint recognition.
**Learning Value:**
The comprehensive educational framework eliminates the need to study multiple separate indicators by providing an integrated learning platform that demonstrates how different technical analysis concepts work together systematically in real market conditions.
**Educational Commitment:**
This indicator prioritizes education and systematic learning over simple signal generation, providing traders with the analytical framework needed to develop comprehensive technical analysis skills through hands-on practice and systematic methodology development.

Stop Hunt Indicator ║ BullVision 🧠 Overview
The Stop Hunt Indicator (SmartTrap Radar) is an original tool designed to identify potential liquidity traps caused by institutional stop hunts. It visually maps out historically significant levels where price has repeatedly reversed or rejected — and dynamically detects real-time sweep patterns based on volume, structure, and candle rejection behavior.
This script does not repurpose existing public indicators, nor does it use default TradingView built-ins such as RSI, MACD, or MAs. Its core logic is fully proprietary and was developed from scratch to support discretionary and data-driven traders in visualizing volatility risks and manipulation zones.
🔍 What the Indicator Does
This indicator identifies and visualizes potential stop hunt zones using:
Historical structure analysis: Swing highs/lows are identified via a configurable lookback period.
Liquidity level tracking: Once detected, levels are monitored for touches, age, and volume strength.
Proprietary scoring model: Each level receives a real-time significance score based on:
Age (how long the level has held)
Number of rejections (touches)
Relative volume strength
Proximity to current price
The glow intensity of plotted levels is dynamically mapped based on this score. Bright glow = higher institutional interest probability.
⚙️ Stop Hunt Detection Logic
A stop hunt is flagged when all of the following are met:
Price sweeps through a high/low beyond a user-defined penetration threshold
Wick rejection occurs (i.e., candle closes back inside the level)
Volume spikes above the average in a recent window
The script automatically:
Detects bullish stop hunts (below support) and bearish ones (above resistance)
Marks detected sweeps on-chart with optional 🔰/🚨 signals
Adjusts glow visuals based on score even after the sweep occurs
These sweeps often precede local reversals or high-volatility zones — this is not predictive, but rather a reactive mapping of market manipulation behavior.
📌 Why This Is Not Just Another Liquidity Tool
Unlike typical liquidity heatmaps or S/R indicators, this script includes:
A proprietary significance score instead of fixed rules
Multi-layer glow rendering to reflect level importance visually
Real-time scoring updates as new volume and touches occur
Combined volume × rejection × structure logic to validate stop hunts
Fully customizable detection logic (lookback, wick %, volume filters, max bars, etc.)
This indicator provides a specialized view focused solely on visualizing trap setups — not generic trend signals.
🧪 Usage Recommendations
To get started:
Add the indicator to your chart (volume-enabled instruments only)
Customize detection:
Lookback Period for structure
Penetration % for how far price must sweep
Volume Spike Multiplier
Wick rejection strength
Enable/disable features:
Glow effects
Hunt markers
Score labels
Volume highlights
Watch for:
🔰 Bullish Sweeps (below support)
🚨 Bearish Sweeps (above resistance)
Bright glowing zones = high-liquidity targets
This tool can be used for both confluence and risk assessment, especially around high-impact sessions, liquidation events, or range extremes.
📊 Volume Dependency Notice
⚠️ This indicator requires real volume data to function correctly. On instruments without volume (e.g., synthetic pairs), certain features like spike detection and scoring will be disabled or inaccurate.
🔐 Closed-Source Disclosure
This script is published as invite-only to protect its proprietary scoring, glow mapping, and detection logic. While the full implementation remains confidential, this description outlines all key mechanics and configurable logic for user transparency.

Suvorov Pro SFP+Indicator: Logic-based Swing Failure Pattern (SFP)
What is the logic of my indicator based on and what makes it unique:
1. The indicator can calculate extreme candles that close with huge shadows and a small body and it works on any timeframe.
2. The indicator analyzes the volumes on which the desired bar was closed. This function is customizable. That is, you can build a search for signals according to your trading strategy, based on the number of volumes. What does this mean - you select the number of previous bars where the indicator calculates the average value and based on these numbers, you can set up: how many times the desired candle should be larger than the previous average volume.
3. Since SFP is based on the removal of important liquidity, the search for such situations occurs from swing structures (swing high/low). When these parameters are found on the chart (on history), the indicator draws the situation and shows where important liquidity was removed and why the trading situation appeared right now.
4. The indicator gives recommendations on possible takes and stops.
The structure of takes has a built-in logic for searching for previous swings to remove liquidity, as well as searching for imbalances to cover them (50 and 100%).
5. For TP (Take Profit): there are 3 TPthat can be adjusted to your trading strategy (Risk/Profit). For example: you always trade from 2 to 1 on the 1st Take, 3 to 1 on the second, 5 to 1 on the third: you can set all this in the indicator and all your targets will be detected by the indicator, taking into account the logic of searching for important ranges. If, for example, in your 3 to 1 range there are no important zones for TP, then the indicator writes that NaN (not found).
6. The indicator works on any timeframe.
7. The indicator has a built-in RSI logic, which comes as an additional function to the indicator. If this function is enabled, then trading situations are detected only when there is a divergence (from the swing point to the extreme bar that has formed).

Hybrid Swing/Day Alert System - PLATINUM EditionThis indicator is a complete trading assistant designed for crypto swing and day traders, built to identify high-probability long and short setups based on a multi-confirmation system.
Strategy Logic
The system scans and confirms entries only when 6 major confluences align:
1. EMA Trend: Price is above or below the EMA 9, 21, and 200 (bullish or bearish trend).
2. RSI Zone: RSI(14) is between 40-60 (ideal reversal zone).
3. Volume Confirmation: Volume is declining on pullback and then spikes.
4. Accumulation/Distribution: A/D line rising (for longs) or falling (for shorts).
5. Fibonacci Pullback Zone: Automatic detection of swing high/low and checks if price is inside the golden zone (0.5-0.618).
Built-In Alerts
- Long Setup Confirmed - Short Setup Confirmed - Setup Forming: Monitor
Conclusion
This script is ideal for disciplined traders who value confluence-based entries, risk/reward logic, and trend-aligned trades. Perfect for semi-automated trading via alerts or manual execution.6. Candle Pattern: Bullish (hammer, doji, engulfing) or Bearish (rejection wick, engulfing, doji).
Visual Features
- Long Entry: Green square
- Short Entry: Red triangle
- Pre-Signal Alert: Blue circle (confluence forming)
- Dynamic Table: Displays all 6 confirmations in real time
- Fibonacci Zones: Auto-plotted long/short retracement zones
- Customizable: Turn on/off alerts, overlays, and direction filters
Best Use Cases
- 4H/Daily: Trend confirmation
- 1H: Entry execution
- 15min: Scalping (use cautiously)
- Works great with BTC, ETH, SOL, XAU, and meme coins

Shockwave⚡️ Shockwave – Precision Momentum Strategy
🔹 Purpose
Shockwave is a precision-engineered trend and momentum strategy designed for aggressive, high-conviction trades. Built for volatile markets like crypto, this system enters only when trend, volume, and momentum are fully aligned — then exits intelligently using layered profit targets and trend weakening logic.
It filters out false breakouts, traps, and low-quality setups using advanced multi-factor confirmation. Ideal for trend-following traders who want cleaner signals, no repainting, and adaptive position handling.
🔹 Indicator Breakdown
1️⃣ ZLEMA + Gradient Filter (Trend Core)
Defines the trend using a Zero Lag EMA (ZLEMA) for responsiveness.
Gradient slope confirms acceleration or weakening in trend direction.
Uptrend: ZLEMA is rising and slope > 0.
Downtrend: ZLEMA is falling and slope < 0.
2️⃣ Smoothed CCI (Momentum Confirmation)
Uses ZLEMA as the source for CCI to avoid noise.
Bullish momentum: CCI rising above 0.
Bearish momentum: CCI falling below 0.
Filters out chop and premature entries.
3️⃣ Volume Spike Filter
Median-based filter confirms breakout volume integrity.
Requires volume > 1.5x median of previous candles.
Avoids low-volume whipsaws.
4️⃣ Vortex Indicator (Trend Strength Confirmation)
Confirms directional conviction by comparing VI+ vs VI–.
Long: VI+ > VI– and threshold difference is met.
Short: VI– > VI+ and trend strength is validated.
5️⃣ Wick Trap Filter (Reversal Trap Detection)
Blocks entries on manipulative upper/lower wick patterns.
Longs rejected if upper wick > 1.5× body and close is weak.
Shorts rejected if lower wick > 1.5× body and close is strong.
🔹 Strategy Logic & Trade Execution
✅ Entry Conditions
A trade is entered only when all the following align:
ZLEMA trend direction is confirmed.
CCI momentum matches the trend.
Volume spike confirms participation.
Vortex difference meets strength threshold.
No wick trap is present.
✅ Exit Conditions
TP1: 50% of the position is closed at the first profit level.
TP2: Remaining 50% is closed at the second target.
Weak Trend Exit: If ZLEMA slope flips against the trade, the position is closed early.
A 1-bar cooldown delay is enforced after closing to prevent same-bar reentry.
🔹 Take-Profit System
TP1: 50% close at +2% for longs / –2% for shorts
TP2: Full close at +4% for longs / –4% for shorts
Limit orders are used for precise profit-taking
TP1/TP2 status is tracked and displayed in the live dashboard
🔹 Risk Management (Important)
🚫 This strategy does not include a stop-loss by default.
Trades are exited using trend reversal detection or TP targets.
💡 Suggested risk controls:
Add a manual stop-loss based on recent swing high/low
Use appropriate position sizing based on volatility
Apply the strategy in strong trending environments
🔹 Default Backtest Settings
Initial Capital: $1,000
Position Size: 10% of equity per trade
Commission: 0.05%
Slippage: 1
Strategy Date Filter: Adjustable (default: 2023–2029)
🔹 How to Use Shockwave
Apply to any chart (best results on 1H or higher).
Review backtest performance.
Adjust take-profit percentages or thresholds as needed.
Use in strongly trending markets — avoid sideways ranges.
Add your own stop-loss if desired.
⚠️ Disclaimer
This strategy is for educational and informational purposes only. It is not financial advice. Trading involves risk, and past performance does not guarantee future results. Always test thoroughly and manage your own risk.
🚀 Why Use Shockwave?
✔ Multi-layer confirmation for high-quality entries
✔ Non-repainting logic for backtest/live consistency
✔ Adaptive trend/momentum filtering
✔ Dual profit targets for smart trade management
✔ Visual dashboard with live tracking

NexAlgo AI with Dynamic TP/SLThe NexAlgo Indicator combines a Gaussian kernel regression engine with adaptive volatility thresholds to generate clear, data‑driven trade signals and built‑in risk levels. It predicts the next bar’s price relative to a simple moving average, then measures the average deviation between actual and forecasted values to form dynamic bands. Breakouts beyond these bands, aligned with the prediction’s direction, produce buy or sell signals directly on your chart.
How It Works & What You’ll See
Kernel Regression Forecast: A rolling “lookback” window builds a Gaussian similarity matrix of recent prices. This matrix is used to project the next price, smoothing around a moving average.
Adaptive Volatility Bands: The indicator computes the mean absolute error between actual and predicted prices, multiplies it by your chosen volatility factor, and plots upper and lower bands.
Signal Triggers: When price closes above the upper band while the prediction is rising, a green “BUY” label appears; when price closes below the lower band as the forecast falls, a red “SELL” label is shown.
Automatic SL/TP Levels: After each signal, the script scans recent swing highs/lows and applies an ATR buffer. Stop‑loss is set conservatively at the more protective of these levels, while take‑profit is calculated by your reward‑to‑risk ratio and capped near the opposite swing extreme.
Customizable Inputs
Lookback Period & Smoothing: Adjust how many bars the regression and volatility calculations use, and tune the noise regularization to suit fast or slow markets.
Volatility Multiplier: Widen or tighten the adaptive bands to control signal frequency and confidence.
Swing Lookback & ATR Options: Define how far back the indicator searches for swing points, and choose between ATR calculation methods.
Reward‑to‑Risk Ratio: Set your preferred multiple of stop‑loss distance for take‑profit targets.
What Makes NexAlgo Different
Hybrid Statistical Approach: Unlike fixed‑period moving averages or standard regression, the Gaussian kernel adapts locally to evolving price patterns and regimes.
Self‑Adjusting Thresholds: Volatility bands derive from prediction errors—so they expand in choppy markets and contract in trending conditions.
Integrated Risk Controls: Automatically calculated stop‑loss and take‑profit levels remove manual guesswork, yet remain grounded in both ATR and price structure.
Trader‑Driven Flexibility: Every parameter—from lookback length to risk ratio—can be dialed in for scalping, swing trading, or longer‑term strategies.
Getting Started
• Apply NexAlgo to your preferred timeframe (5–15 min for intraday scalps, 1 h–4 h for swings, daily for position plays).
• Begin with default settings and gradually adjust lookback and smoothing to balance responsiveness versus noise.
• Experiment with volatility multipliers: tighten in strong trends, widen when markets churn.
• Backtest different ATR buffers and reward ratios to discover your ideal risk‑reward profile.

Enhanced BarUpDn StrategyEnhanced BarUpDn Strategy
The Enhanced BarUpDn Strategy is a refined price action-based trading approach that identifies market trends and reversals using bar formations. It focuses on detecting bullish and bearish momentum by analyzing consecutive price bars and key support/resistance levels.
Key Features:
✅ Trend Confirmation – Uses a combination of bar patterns and indicators (e.g., moving averages, RSI) to confirm momentum shifts.
✅ Entry Signals – A buy signal is triggered when an "Up Bar" (higher high, higher low) follows a bullish setup; a sell signal when a "Down Bar" (lower high, lower low) confirms bearish momentum.
✅ Enhanced Filters – Incorporates volume analysis and additional conditions to reduce false signals.
✅ Stop-Loss & Risk Management – Uses recent swing highs/lows for stop placement and dynamic trailing stops for maximizing gains.

Multi-Timeframe MA Based Zigzag[liwei666]🎲 Overview
🎯 This Zigzag indicator build based on different MA such as EMA/HMA/RMA/SMA, support multi-timeframe setting .
you can get customer zigzag indicator by change short/long ma length and high-timeframe config(5m/15m/30m/1h/2h) in any symbol.
🎲 Indicator design logic
🎯 entired logic is simple and code looks complex, I‘ll explain core logic here, code already equipped with detailed comments.
1. use close-in EMA's highest/lowest value mark as SWING High/Low when EMA crossover/under, not use func ta.pivothigh()/ta.pivotlow()
2. when EMA crossover/under plot a char as signal like ●/❄/▲, crossover get blue char crossunder get red char
3. latest zigzag line is not drawn until EMA is turned (crossover/under), but signal is realtime
4. you can see diff zigzag structure when you open high-timeframe config, then find regular pattern benefit your trading.
🎲 Settings
🎯 there are 3 group properties in script, just focus on 5 properties in 'GRP1' ,
'GRP2' and 'GRP3' are display config.
'GRP1':
MA_Type: MA type you can choose(EMA/RMA/SMA/HMA/WMA), default is EMA
short_ma_len: short MA length of your current timeframe on chart
long_ma_len: long MA length of your current timeframe on chart
htf_ma_len: MA length of high timeframe, MA type same as 'MA_Type' config
htf_ma_tf: high timeframe ma length, 15/30/60/120 minute
'GRP2':
• show_short_zz • show_long_zz • show_htf_zz:
'GRP3':
• show_short_ma_line • show_short_ma_signal
• show_long_ma_line • show_long_ma_signal
• show_htf_ma_line • show_htf_ma_signal
🎲 Usage
🎯 As we know, MA based signal usually worked fine in trend market , low volatility is unprofitable.
🎯 One of pattern as the chart show below.
1. success example : after a blue ▲ signal, entry long when blue ● signal appear, marked with green box.
2. failed example: after a blue ▲ signal, a red ▼ signal appear, marked with white box.
🎯 BoS(Break of Structure) based on ma zigzag is a good idea I'm implementing, it will be published in next script.
Additionally, I plan to publish 20 profitable strategies in 2023; this indicatior not one of them,
let‘s witness it together!
Hope this indicator will be useful for you :)
enjoy! 🚀🚀🚀

Simple and Profitable Scalping Strategy (ForexSignals TV)Strategy is based on the "SIMPLE and PROFITABLE Forex Scalping Strategy" taken from YouTube channel ForexSignals TV.
See video for a detailed explaination of the whole strategy.
I'm not entirely happy with the performance of this strategy yet however I do believe it has potential as the concept makes a lot of sense.
I'm open to any ideas people have on how it could be improved.
Strategy incorporates the following features:
Risk management:
Configurable X% loss per stop (default to 1%)
Configurable R:R ratio
Trade entry:
Based on stratgey conditions outlined below
Trade exit:
Based on stratgey conditions outlined below
Backtesting:
Configurable backtesting range by date
Trade drawings:
Each entry condition indicator can be turned on and off
TP/SL boxes drawn for all trades. Can be turned on and off
Trade exit information labels. Can be turned on and off
NOTE: Trade drawings will only be applicable when using overlay strategies
Debugging:
Includes section with useful debugging techniques
Strategy conditions
Trade entry:
LONG
C1: On higher timeframe trend EMAs, Fast EMA must be above Slow EMA
C2: On higher timeframe trend EMAs, price must be above Fast EMA
C3: On current timeframe entry EMAs, Fast EMA must be above Medium EMA and Medium EMA must be above Slow EMA
C4: On current timeframe entry EMAs, all 3 EMA lines must have fanned out in upward direction for previous X candles (configurable)
C5: On current timeframe entry EMAs, previous candle must have closed above and not touched any EMA lines
C6: On current timeframe entry EMAs, current candle must have pulled back to touch the EMA line(s)
C7: Price must break through the high of the last X candles (plus price buffer) to trigger entry (stop order entry)
SHORT
C1: On higher timeframe trend EMAs, Fast EMA must be below Slow EMA
C2: On higher timeframe trend EMAs, price must be below Fast EMA
C3: On current timeframe entry EMAs, Fast EMA must be below Medium EMA and Medium EMA must be below Slow EMA
C4: On current timeframe entry EMAs, all 3 EMA lines must have fanned out in downward direction for previous X candles (configurable)
C5: On current timeframe entry EMAs, previous candle must have closed above and not touched any EMA lines
C6: On current timeframe entry EMAs, current candle must have pulled back to touch the EMA line(s)
C7: Price must break through the low of the last X candles (plus price buffer) to trigger entry (stop order entry)
Trade entry:
Calculated position size based on risk tolerance
Entry price is a stop order set just above (buffer configurable) the recent swing high/low (long/short)
Trade exit:
Stop Loss is set just below (buffer configurable) trigger candle's low/high (long/short)
Take Profit calculated from Stop Loss using R:R ratio
Credits
"SIMPLE and PROFITABLE Forex Scalping Strategy" taken from YouTube channel ForexSignals TV

RSI Crossover AlertRSI Crossover Alert Indicator - User Guide
The RSI Crossover Alert Indicator is a comprehensive technical analysis tool that detects multiple types of RSI crossovers and generates real-time alerts. It combines traditional RSI analysis with signal lines, divergence detection, and multi-level crossing alerts.
1. Multiple Crossover Detection
- RSI/Signal Line Cross: Signals a primary trend change.
- RSI/Second Signal Cross: Confirmation signals for stronger trends.
- Level Crossings: Crosses of Overbought 70, Oversold 30, and Midline 50.
- Divergence Detection: Hidden and regular divergences for reversal signals.
2. Alert Types
- Alert: RSI > Signal
Description: Bullish momentum is building.
Signal: Consider long positions.
- Alert: RSI < Signal
Description: Bearish momentum is building.
Signal: Consider short positions.
- Alert: RSI > 70
Description: Entering the overbought zone.
Signal: Prepare for a potential reversal.
- Alert: RSI < 30
Description: Entering the oversold zone.
Signal: Watch for a bounce opportunity.
- Alert: RSI crosses 50
Description: A shift in momentum.
Signal: Trend confirmation.
3. Visual Components
- Lines: RSI blue, Signal orange, Second Signal purple
- Histogram: Visualizes momentum by showing the difference between RSI and the Signal line.
- Background Zones: Red overbought, Green oversold
- Markers: Up/down triangles to indicate crossovers.
- Info Table: Real-time RSI values and status.
Strategy 1: Classic Crossover
- Entry Long: RSI crosses above the Signal Line AND RSI is below 50.
- Entry Short: RSI crosses below the Signal Line AND RSI is above 50.
- Take Profit: On the opposite signal.
- Stop Loss: At the recent swing high/low.
Strategy 2: Extreme Zone Reversal
- Entry Long: RSI is below 30 and crosses above the Signal Line.
- Entry Short: RSI is above 70 and crosses below the Signal Line.
- Risk Management: Higher win rate but fewer signals. Use a minimum 2:1 risk-reward ratio.
Strategy 3: Divergence Trading
- Setup: Enable divergence alerts and look for price/RSI divergence. Wait for an RSI crossover for confirmation.
- Entry: Enter on the crossover after the divergence appears. Place the stop loss beyond the starting point of the divergence.
Strategy 4: Multi-Timeframe Confirmation
1. Check the higher timeframe e.g. Daily to identify the main trend.
2. Use the current timeframe e.g. 4H/1H for your entry.
3. Only enter in the direction of the main trend.
4. Use the RSI crossover as the entry trigger.
Optimal Settings by Market
- Forex Major Pairs
RSI Length: 14, Signal Length: 9, Overbought/Oversold: 70/30
- Crypto High Volatility
RSI Length: 10-12, Signal Length: 6-8, Overbought/Oversold: 75/25
- Stocks Trending
RSI Length: 14-21, Signal Length: 9-12, Overbought/Oversold: 70/30
- Commodities
RSI Length: 14, Signal Length: 9, Overbought/Oversold: 80/20
Risk Management Rules
1. Position Sizing: Never risk more than 1-2% on a single trade. Reduce size in ranging markets.
2. Stop Loss Placement: Place stops beyond the recent swing high/low for crossovers. Using an ATR-based stop is also effective.
3. Profit Taking: Take partial profits at a 1:1 risk-reward ratio. Switch to a trailing stop after reaching 2:1.
1. Filtering Signals
- Combine with volume indicators.
- Confirm the trend on a higher timeframe.
- Wait for candlestick pattern confirmation.
2. Avoid Common Mistakes
- Don't trade every single crossover.
- Avoid taking signals against a strong trend.
- Do not ignore risk management.
3. Market Conditions
- Trending Market: Focus on midline 50 crosses.
- Ranging Market: Look for reversals from overbought/oversold levels.
- Volatile Market: Widen the overbought/oversold levels.
- If you get too many false signals:
Increase the signal line period, add other confirmation indicators, or use a higher timeframe.
- If you are missing major moves:
Decrease the RSI length, shorten the signal line period, or check your alert settings.
Recommended Combinations
1. RSI + MACD: For dual momentum confirmation.
2. RSI + Bollinger Bands: For volatility-adjusted signals.
3. RSI + Volume: To confirm the strength of a signal.
4. RSI + Moving Averages: To use as a trend filter.
This indicator provides a comprehensive RSI analysis. Success depends on proper configuration, risk management, and combining signals with the overall market context. Start with the default settings, then optimize based on your trading style and market conditions.

GOXXIE H4 S/R + Volume Zones + Alerts [For GOLD Day Traders]This advanced indicator identifies key trading levels by combining:
H4 Timeframe Support/Resistance
Automatically detects swing highs/lows from the 4-hour chart
Plots them on your current timeframe (perfect for day traders)
Only shows confirmed levels (adjustable from 1-5 touches)
Volume Confirmation
Highlights high-volume zones from the H4 timeframe
Purple shading shows where institutions traded actively
Proximity Alerts
Customizable alerts when price approaches key levels (0.1%-5% distance)
Prevents missed opportunities at critical zones
Key Features:
✅ Multi-Timeframe Analysis - See H4 structure while trading lower timeframes
✅ Volume-Filtered Levels - Avoid false breaks with volume confirmation
✅ Customizable Sensitivity - Adjust touch requirements and alert distances
✅ Clean Visualization - Dashed lines (red=resistance, green=support) with subtle volume shading
Ideal For:
Day traders who need to align with higher timeframe structure
Swing traders looking for confluent support/resistance zones
Breakout/Reversal strategies with volume confirmation
Input Parameters:
Higher Timeframe (H4) - Base timeframe for level detection
Min Touches - How many times a level must be tested (1-5)
Volume Threshold - Sensitivity for high-volume zones (0.1-2.0)
Alert Distance - How close price must be to trigger alerts (0.1%-5%)
Pro Tips:
Combine with:
Trend confirmation (e.g., 200 EMA)
Candlestick patterns at key levels
Strongest signals occur when:
Price tests H4 level + volume zone simultaneously
Lower timeframe shows rejection (wick) or breakout (close beyond level)
Publishing Notes:
Categories: Strategy > Support/Resistance > Volume
Tags: support, resistance, volume, daytrading, multitimeframe
Preview Image: Show a chart with:
H4 levels on a 15m chart
Purple volume zones
Example alerts popping up
50/100 EMA Crossover with Candle Confirmation📘 **50/100 EMA Crossover with Candle Confirmation – Strategy Description**
The **50/100 EMA Crossover with Candle Confirmation** is a trend-following strategy designed to filter high-probability entries by combining exponential moving average (EMA) crossovers with strong price action confirmation. This strategy aims to reduce false signals commonly associated with EMA-only systems by requiring a **candle close confirmation in the direction of the trend**, making it more reliable for intraday or swing trading across Forex, crypto, and stock markets.
---
### 🔍 **Core Logic**
* The strategy is based on the interaction of the **50 EMA** (fast-moving average) and the **100 EMA** (slow-moving average).
* **Trend direction** is determined by the crossover:
* **Bullish Trend**: When the 50 EMA crosses **above** the 100 EMA.
* **Bearish Trend**: When the 50 EMA crosses **below** the 100 EMA.
* To **filter out false breakouts**, a **candle confirmation** is used:
* For a **Buy signal**: After a bullish crossover, wait for a strong bullish candle (e.g., full-body green candle) to **close above both EMAs**.
* For a **Sell signal**: After a bearish crossover, wait for a strong bearish candle to **close below both EMAs**.
---
### ✅ **Entry Conditions**
**Buy Entry:**
* 50 EMA crosses above 100 EMA.
* Latest candle closes **above both EMAs**.
* Candle must be bullish (green/full body preferred).
**Sell Entry:**
* 50 EMA crosses below 100 EMA.
* Latest candle closes **below both EMAs**.
* Candle must be bearish (red/full body preferred).
---
### 🛑 **Exit or Take-Profit Options**
* **Fixed TP/SL**: 1:2 or 1:3 risk-reward.
* **Trailing Stop**: Based on recent swing highs/lows or ATR.
* **EMA Exit**: Exit trade when the candle closes on the opposite side of 50 EMA.
---
### ⚙️ **Best Settings**
* **Timeframes**: 5M, 15M, 1H, 4H (works well on most).
* **Markets**: Forex, Crypto (e.g., BTC/ETH), Indices (e.g., NASDAQ, NIFTY50).
* **Recommended filters**:
* Use with RSI divergence or volume confirmation.
* Avoid using during high-impact news (especially on lower timeframes).
---
### 🧠 **Why This Works**
The 50/100 EMA crossover provides a **medium-term trend signal**, reducing noise seen in fast EMAs (like 9 or 21). The candle confirmation adds a **momentum filter**, ensuring price supports the directional bias. This makes it suitable for traders who want a balance of trend and entry precision without overcomplicating with too many indicators.
---
### 📈 **Advantages**
* Simple yet effective for identifying trends.
* Filters out fakeouts using candle confirmation.
* Easy to automate in Pine Script or other trading bots.
* Can be combined with support/resistance or SMC zones for better confluence.
---
### ⚠️ **Limitations**
* May lag slightly in ranging markets.
* Late entries possible due to confirmation candle.
* Works best with additional volume or volatility filter.

PulseWave + DivergenceOverview
PulseWave + Divergence is a momentum oscillator designed to optimize the classic RSI. Unlike traditional RSI, which can produce delayed or noisy signals, PulseWave offers a smoother and faster oscillator line that better responds to changes in market dynamics. By using a formula based on the difference between RSI and its moving average, the indicator generates fewer false signals, making it a suitable tool for day traders and swing traders in stock, forex, and cryptocurrency markets.
How It Works
Generating the Oscillator Line
The PulseWave oscillator line is calculated as follows:
RSI is calculated based on the selected data source (default: close price) and RSI length (default: 20 periods).
RSI is smoothed using a simple moving average (MA) with a selected length (default: 20 periods).
The oscillator value is the difference between the current RSI and its moving average: oscillator = RSI - MA(RSI).
This approach ensures high responsiveness to short-term momentum changes while reducing market noise. Unlike other oscillators, such as standard RSI or MACD, which rely on direct price values or more complex formulas, PulseWave focuses on the dynamics of the difference between RSI and its moving average. This allows it to better capture short-term trend changes while minimizing the impact of random price fluctuations. The oscillator line fluctuates around zero, making it easy to identify bullish trends (positive values) and bearish trends (negative values).
Divergences
The indicator optionally detects bullish and bearish divergences by comparing price extremes (swing highs/lows) with oscillator extremes within a defined pivot window (default: 5 candles left and right). Divergences are marked with "Bull" (bullish) and "Bear" (bearish) labels on the oscillator chart.
Signals
Depending on the selected signal type, PulseWave generates buy and sell signals based on:
Crosses of the overbought and oversold levels.
Crosses of the oscillator’s zero line.
A combination of both (option "Both").
Signals are displayed as triangles above or below the oscillator, making them easy to identify.
Input Parameters
RSI Length: Length of the RSI used in calculations (default: 20).
RSI MA Length: Length of the RSI moving average (default: 20).
Overbought/Oversold Level: Oscillator overbought and oversold levels (default: 12.0 and -12.0).
Pivot Length: Number of candles used to detect extremes for divergences (default: 5).
Signal Type: Type of signals to display ("Overbought/Oversold", "Zero Line", "Both", or "None").
Colors and Gradients: Full customization of line, gradient, and label colors.
How to Use
Adjust Parameters:
Increase RSI Length (e.g., to 30) for high-volatility markets to reduce noise.
Decrease Pivot Length (e.g., to 3) for faster divergence detection on short timeframes.
Interpret Signals:
Buy Signal: The oscillator crosses above the oversold level or zero line, especially with a bullish divergence.
Sell Signal: The oscillator crosses below the overbought level or zero line, especially with a bearish divergence.
Combine with Other Tools:
Use PulseWave alongside moving averages or support/resistance levels to confirm signals.
Monitor Divergences:
"Bull" and "Bear" labels indicate potential trend reversals. Set up alerts to receive notifications for divergences.
