Minor Break of Structure (Minor BoS)This indicator extracts and isolates the Minor Break of Structure (BoS) logic from a full SMC framework and presents it as a clean, lightweight tool for structure-based price action traders.
Unlike traditional BOS indicators that rely on swing calculations with heavy filtering, this script uses original SMC-style minor structure logic to detect meaningful shifts in internal order flow.
A Minor BoS appears when price breaks above a minor swing high (bullish) or below a minor swing low (bearish), confirming a short-term continuation in trend direction.
Features:
Bullish Minor BoS detection
Bearish Minor BoS detection
Automatic line plotting with extend-right
Clear “Minor BoS” label with tiny footprint
Customizable line styles and colors
Lightweight & optimized for fast execution
Zero repainting on BoS confirmations
This tool is ideal for traders who want a simple, clean, and reliable structure-based signal without the noise of major structure, order blocks, liquidity sweeps, or external SMC modules.
"sweep" için komut dosyalarını ara

Position Size Calculator + Live R/R Panel — SMC/ICT (@PueblaATH)Position Size + Live R/R Panel — SMC/ICT (@PueblaATH)
Position Size + Live R/R Panel — SMC/ICT (@PueblaATH) is a professional-grade risk management and execution module built for Smart Money Concepts (SMC) and ICT Traders who require accurate, repeatable, institution-style trade planning.
This tool delivers precise position sizing, R:R modeling, leverage and margin projections, fee-adjusted PnL outcomes, and real-time execution metrics—all directly on the chart. Optimized for crypto, forex, and futures, it provides scalpers, day traders, and swing traders with the clarity needed to execute high-quality trades with confidence and consistency.
What the Indicator Does
Institutional Position Sizing Engine
Calculates position size based on account balance, % risk, and SL distance.
Supports custom minimum lot size rounding across crypto, FX, indices, and derivatives.
Intelligent direction logic (Auto / Long / Short) based on SMC/ICT structure.
Advanced Risk/Reward & Profit Modeling
Real-time R:R ratio using actual rounded position size.
Live PnL readout that updates with price movements.
Gross & net profit projections with full fee deduction.
Execution Planning with Draggable Levels
Entry, SL, and TP levels fully draggable for fast scenario modeling.
Automatic projected lines backward/forward with clean label alignment.
TP and SL tags include % movement from Entry, ideal for SMC/ICT journaling.
Precise modeling of real exchange fee structures
Maker fee per side
Taker fee per side
Mixed fee modes (Maker entry, Taker exit, Average, etc.)
Leverage & Margin Forecasting
Margin requirements displayed for 3 customizable leverage settings.
Helps traders understand capital commitment before executing the trade.
Useful for futures, crypto perps, and CFD setups.
Clean HUD Panel for Rapid Decision-Making
A full professional trading panel displays:
Target & actual risk
Position size
Entry / SL / TP
TP/SL percentage distance
Gross profit
Net profit (after fees)
Fees @ TP and @ SL
Live PnL
Margin requirements
Optimized for SMC & ICT Workflows
Perfect for traders using:
Breakers, FVGs, OBs
Liquidity sweeps
Session models
Precision entries (OTE, Displacement, Rebalancing)
Leverage-based execution (crypto perps, futures)
How to Use It
Attach the indicator to your chart.
Set account balance, risk %, fee model, and leverage presets.
Drag Entry, SL, and TP to shape the setup.
View instant calculations of: Position size; R:R; Net PnL after fees; Margin required
Use it as your pre-trade checklist & execution model.
Originality & Credits
This script is an original creation by @PueblaATH, released under the MPL 2.0 license.
It does not copy, modify, or repackage any existing TradingView code.
All logic—including the fee engine, margin calculator, responsive HUD, dynamic risk model, and visual execution system—is authored specifically for this indicator.

Displacement Pulse Markers - sudoThis indicator is designed to highlight sudden and meaningful bursts of price movement. These bursts are called displacement pulses. A pulse appears when price expands with force, closes near the extreme of its own bar, and breaks through a recent structural level. The indicator places small circles above or below the candle to signal these moments so that traders can quickly spot abnormal movement and potential shifts in market intent.
How it works
The indicator evaluates each bar for three conditions:
Range expansion relative to volatility
The bar must be larger than normal. It compares the bar range to ATR and requires that range to exceed a multiple of ATR. When this condition is met, the bar is considered a large or forceful bar.
Close location within the bar
The bar has to close near its own high or low. A close near the top suggests strong buying force. A close near the bottom suggests strong selling force. The user can adjust what percentage qualifies as near the top or bottom.
Break of recent structure
The bar must break a recent pivot level. For bullish pulses, the high of the bar must exceed the highest high of the past N bars. For bearish pulses, the low must break the lowest low of the past N bars. This confirms that the move did not merely expand but actually displaced prior structure.
When all conditions align
A bullish displacement pulse is marked with a small aqua circle below the bar.
A bearish displacement pulse is marked with a fuchsia circle above the bar.
The result is a clean on chart visualization of where price produced meaningful displacement.
How traders can use this
Spot abnormal momentum
Pulses can highlight areas where price behaves with more force than usual. These events often appear around news, liquidity sweeps, or algorithmic shifts.
Identify possible regime changes
A pulse that breaks structure while closing near the extreme may signal a transition from a ranging environment to a trending one. It does not predict direction but flags where displacement actually occurred.
Support narrative building
When combined with levels, zones, or other frameworks, pulses can confirm whether the market had enough strength to break through an area with conviction.
Filter trades or refine entries
Some traders may choose to trade in the direction of recent pulses during trending conditions. Others may only enter a trade after a pulse confirms that the market has shifted away from compression.
Track where the market is imbalanced
A pulse visually marks whether buyers or sellers were able to generate strong initiative movement. These points often become useful reference zones for continuation or rejection analysis.
Why this indicator is useful
It reduces complex logic into simple visual markers. Instead of scanning bar by bar for structural breaks, volatility expansions, and close strength, the indicator does this automatically and highlights only the bars that meet all criteria. This keeps the chart clean while still providing precision about where displacement actually occurred.

One for AllOne for All (OFA) - Complete ICT Analysis Suite
Version 3.3.0 by theCodeman
📊 Overview
One for All (OFA) is a comprehensive TradingView indicator designed for traders who follow Inner Circle Trader (ICT) concepts. This all-in-one tool combines essential ICT analysis features—sessions, kill zones, previous period levels, and higher timeframe candles with Fair Value Gaps (FVGs) and Volume Imbalances (VIs)—into a single, highly customizable indicator. Whether you're a beginner learning ICT concepts or an experienced trader refining your edge, OFA provides the visual structure needed for precise market analysis and execution.
✨ Key Features
- 🏷️ Customizable Watermark**: Display your trading identity with customizable titles, subtitles, symbol info, and full style control
- 🌍 Trading Sessions**: Visualize Asian, London, and New York sessions with high/low lines, range boxes, and open/close markers
- 🎯 Kill Zones**: Highlight 5 critical ICT kill zones with precise timing and visual boxes
- 📈 Previous Period H/L**: Track Daily, Weekly, and Monthly highs/lows with customizable styles and lookback periods
- 🕐 Higher Timeframe Candles**: Display up to 5 HTF timeframes with OHLC trace lines, timers, and interval labels
- 🔍 FVG & VI Detection**: Automatically detect and visualize Fair Value Gaps and Volume Imbalances on HTF candles
- ⚙️ Universal Timezone Support**: Works globally with GMT-12 to GMT+14 timezone selection
- 🎨 Full Customization**: Control colors, styles, visibility, and layout for every feature
🚀 How to Use
Watermark Setup
The watermark overlay helps you identify your charts and maintain focus on your trading principles:
1. Enable/disable watermark via "Show Watermark" toggle
2. Customize the title (default: "Name") to display your trading name or account identifier
3. Set up to 3 subtitles (default: "Patience", "Confidence", "Execution") as trading reminders
4. Choose position (9 locations available), size, color, and transparency
5. Toggle symbol and timeframe display as needed
Use Case: Display your trading principles or account name for multi-monitor setups or content creation.
Trading Sessions Analysis
Sessions define market character and liquidity availability:
1. Enable "Show All Sessions" to visualize all three sessions
2. Adjust timezone to match your local market (default: UTC-5 for EST)
3. Customize session times if needed (defaults cover standard hours)
4. Enable session range boxes to see consolidation zones
5. Use session high/low lines to identify key levels for the current session
6. Enable open/close markers to track session transitions
Use Case: Identify which session you're trading in, track session highs/lows for liquidity, and anticipate session transition volatility.
Kill Zones Trading
Kill zones are ICT's high-probability trading windows:
1. Enable individual kill zones or use "Show All Kill Zones"
2. **Asian Kill Zone** (2000-0000 GMT): Early positioning and smart money accumulation
3. **London Kill Zone** (0300-0500 GMT): European market opening volatility
4. **NY AM Kill Zone** (0930-1100 EST): Post-NYSE open expansion
5. **NY Lunch Kill Zone** (1200-1300 EST): Midday consolidation or manipulation
6. **NY PM Kill Zone** (1330-1600 EST): Afternoon positioning and closes
7. Customize colors and times to match your trading style
8. Set max days display to control historical visibility (default: 30 days)
Use Case: Focus entries during high-probability windows. Watch for liquidity sweeps at kill zone openings and institutional positioning.
Previous Period High/Low Levels
Previous period levels act as magnetic price targets and support/resistance:
1. Enable Daily (PDH/PDL), Weekly (PWH/PWL), or Monthly (PMH/PML) levels individually
2. Set lookback period (how many previous periods to display)
3. Choose line style: Solid (current emphasis), Dashed (standard), or Dotted (subtle)
4. Customize colors per timeframe for visual hierarchy
5. Adjust line width (1-5) for visibility preference
6. Enable gradient effect to fade older periods
7. Position labels left or right based on chart layout
8. Customize label text for your preferred notation
Use Case: Identify key levels where price is likely to react. Daily levels work on intraday timeframes, Weekly on daily charts, Monthly for swing trading.
Higher Timeframe (HTF) Candles
HTF candles reveal the larger market context while trading lower timeframes:
1. Enable up to 5 HTF slots simultaneously (default: 5m, 15m, 1H, 4H, Daily)
2. Choose display mode: "Below Chart" (stacked rows) or "Right Side" (compact column)
3. Customize timeframe, colors (bull/bear), and titles for each slot
4. **OHLC Trace Lines**: Visual lines connecting HTF candle levels to chart bars
5. **HTF Timer**: Countdown showing time remaining until HTF candle close
6. **Interval Labels**: Display day of week (Daily+) or time (intraday) on each candle
7. For Daily candles: Choose open time (Midnight, 8:30, 9:30) to match your market structure preference
Use Case: Trade lower timeframes while respecting higher timeframe structure. Watch for HTF candle closes to confirm directional bias.
FVG & VI Detection
Fair Value Gaps and Volume Imbalances highlight inefficiencies that price often revisits:
1. **Fair Value Gaps (FVGs)**: Detected when HTF candle wicks don't overlap between 3 consecutive candles
- Bullish FVG: Gap between candle 1 high and candle 3 low (green box by default)
- Bearish FVG: Gap between candle 1 low and candle 3 high (red box by default)
2. **Volume Imbalances (VIs)**: Similar detection but focuses on body gaps
- Bullish VI: Gap between candle 1 close and candle 3 open
- Bearish VI: Gap between candle 1 open and candle 3 close
3. Enable FVG/VI detection per HTF slot individually
4. Customize colors and transparency for each imbalance type
5. Boxes appear on chart at formation and remain visible as retracement targets
**Use Case**: Identify high-probability retracement zones. Price often returns to fill FVGs and VIs before continuing the trend. Use as entry zones or profit targets.
🎨 Customization
OFA is built for flexibility. Every feature includes extensive customization options:
Visual Customization
- **Colors**: Independent color control for every element (sessions, kill zones, lines, labels, FVGs, VIs)
- **Transparency**: Adjust box and label transparency (0-100%) for clean charts
- **Line Styles**: Choose Solid, Dashed, or Dotted for previous period lines
- **Sizes**: Control text size, line width, and box borders
- **Positions**: Place watermark in 9 positions, labels left/right
Layout Control
- **HTF Display Mode**: "Below Chart" for detailed analysis, "Right Side" for space efficiency
- **Drawing Limits**: Set max days for sessions/kill zones to manage chart clutter
- **Lookback Periods**: Control how many previous periods to display (1-10)
- **Gradient Effects**: Enable fading for older previous period lines
Timing Adjustments
- **Timezone**: Universal GMT offset selector (-12 to +14) for global markets
- **Session Times**: Customize each session's start/end times
- **Kill Zone Times**: Adjust kill zone windows to match your market's characteristics
- **Daily Open**: Choose Midnight, 8:30, or 9:30 for Daily HTF candle open time
💡 Best Practices
1. Start Simple: Enable one feature at a time to learn how each element affects your analysis
2. Match Your Timeframe: Use Daily levels on intraday charts, Weekly on daily charts, HTF candles one or two levels above your trading timeframe
3. Kill Zone Focus: Concentrate your trading activity during kill zones for higher probability setups
4. HTF Confirmation: Wait for HTF candle closes before committing to directional bias
5. FVG/VI Entries: Look for price to return to unfilled FVGs/VIs for entry opportunities with favorable risk/reward
6. Customize Colors: Use a consistent color scheme that matches your chart theme and reduces visual fatigue
7. Reduce Clutter: Disable features you're not actively using in your current trading plan
8. Session Context: Understand which session controls the market—trade with session direction or anticipate reversals at session transitions
⚙️ Settings Guide
OFA organizes settings into logical groups for easy navigation:
- **═══ WATERMARK ═══**: Title, subtitles, position, style, symbol/timeframe display
- **═══ SESSIONS ═══**: Enable/disable sessions, times, colors, high/low lines, boxes, markers
- **═══ KILL ZONES ═══**: Individual kill zone toggles, times, colors, max days display
- **═══ PREVIOUS H/L - DAILY ═══**: Daily high/low lines, style, color, lookback, labels
- **═══ PREVIOUS H/L - WEEKLY ═══**: Weekly high/low lines, style, color, lookback, labels
- **═══ PREVIOUS H/L - MONTHLY ═══**: Monthly high/low lines, style, color, lookback, labels
- **═══ HTF CANDLES ═══**: Global display mode, layout settings
- **═══ HTF SLOT 1-5 ═══**: Individual HTF configuration (timeframe, colors, title, FVG/VI detection, trace lines, timer, interval labels)
Each setting includes tooltips explaining its function. Hover over any input for detailed guidance.
📝 Final Notes
One for All (OFA) represents a complete ICT analysis toolkit in a single indicator. By combining watermark customization, session visualization, kill zone highlighting, previous period levels, and higher timeframe candles with FVG/VI detection, OFA eliminates the need for multiple indicators cluttering your chart.
**Version**: 3.3.0
**Author**: theCodeman
**Pine Script**: v6
**License**: Mozilla Public License 2.0
Start with default settings to learn the indicator's structure, then customize extensively to match your personal trading style. Remember: tools provide information, but your edge comes from disciplined execution of a proven strategy.
Happy Trading! 📈

MM Trap Reversal System [TradeHawk]MM TRAP REVERSAL SYSTEM by Timmy741
The only indicator that doesn't just show arrows — it gives you the full battle plan.
Detects real Market Maker stop hunts (liquidity sweeps) and tells you exactly:
WHAT TO DO → BUY / SELL / WAIT
WHEN TO ENTER → Exact trigger candle
WHERE TO ENTER → Current close (or better on pullback)
WHERE YOUR STOP GOES → ATR or wick-based
YOUR TARGETS → 1:2, 1:3, 1:4+ calculated automatically
CONFIDENCE → Filtered by volume, trend, chop, overextension
NO TRADE ZONES → When to stay the hell out (this saves accounts)
FEATURES
• Real swing high/low breach + rejection detection
• Strong wick requirement (default 50%+ of candle)
• Volume confirmation option
• Smart filters: kills trades in chop, low volume, overextended moves
• ADX + VWAP + deviation filters
• Full risk:reward calculation per trade
• Clean trade instruction panel (no clutter)
This is the system professional prop traders use to catch reversals after stop runs.
Works on all markets: Forex, Stocks, Futures, Crypto
Best on 15m – 4H timeframes
No repainting | No future leak | No magic
Just pure price action + liquidity concepts.
Released under MPL 2.0 — fully open source because real traders share the real stuff.
#mmtrap #stophunt #liquidity #reversal #smartmoney #ict #orderblock #fairvaluegap #fvg #propfirm #proptrading #reversalsystem

Daily 12/21 EMA OverlayDaily 12/21 EMA Overlay
This indicator projects the daily 12 and 21 EMAs onto any timeframe as a soft, semi-transparent band. It is designed to give a constant higher-timeframe bias and dynamic support/resistance reference while you execute your systems on lower timeframes (4H, 1H, 15m, etc.).
The script uses request.security() to calculate the 12/21 EMAs on the daily chart only, then overlays those values on your current timeframe without recalculating them locally. This means the band always represents the true daily 12/21 EMAs, regardless of the chart you are viewing.
Key Features:
Fixed daily 12/21 EMA band, visible on all timeframes
Faded lines and fill to keep focus on your active intraday tools
Simple, minimal inputs (fast length, slow length, colors, band visibility)
Ideal as a higher-timeframe “backdrop” for systems built around EMA trend, rejections, or liquidity sweeps
How to Use
Add the indicator on any symbol and timeframe
Keep your normal intraday EMAs (e.g., EMA 12/21) for execution
Note: You can change the bands to not just be 12 or 21, you can change them if needed for your own systems or emas that you use.
This tool is intentionally lightweight: it does one job—showing the true daily EMA structure across all timeframes—and leaves trade execution logic to your primary system.

ORB + Fair Value Gaps (FVG/iFVG) Suite with Daily 50% MidlineA complete smart-money–focused price-action toolkit combining the New York Open Range Breakout (ORB), ICT-style Fair Value Gaps, Inverted FVGs, and a dynamic Daily 50% Midline.
Designed for traders who want a clean, fast, and highly visual way to track liquidity, imbalances, and intraday directional bias.
📌 Key Features
1. NY Session ORB (09:30–09:45 New York Time)
Automatically plots:
ORB High
ORB Low
Labels for ORB high/low
Optional 5-minute chart restriction
Lines extend forward for easy reference
Used to identify breakout conditions, liquidity sweeps, and directional bias into the morning session.
📌 2. ICT-Style Fair Value Gaps (FVGs)
Full automated detection of bullish & bearish FVGs based on the classic 3-candle displacement structure:
Bullish FVG: high < low
Bearish FVG: low > high
Each FVG is drawn as a box with:
Custom colour
Custom border style (solid, dashed, dotted)
Automatic extension to the right until filled
Optional size text showing the gap in points (font size/colour adjustable)
Adjustable max lookback for performance
📌 3. Inverted FVGs (iFVGs)
Once price fully fills an FVG, it automatically becomes an iFVG, shown with:
Custom iFVG colour
Custom border style
Extension to the right
Once price trades through the zone from the opposite side, the iFVG is considered “consumed” and:
It stops extending
And optionally auto-deletes based on user settings
This makes it easy to track meaningful imbalances that turn into liquidity pockets.
📌 4. “Show Only After ORB” Filter
Optionally hide all FVGs/iFVGs formed before the ORB completes.
This is especially useful for intraday strategies focused on NY session structure only.
📌 5. Daily 50% Midline (OHLC Midpoint)
A dynamic, always-updating midpoint of the current daily candle:
Mid = (Daily High + Daily Low) / 2
Features:
Custom colour
Dashed styling
Extends left and right as a horizontal ray
Updates live as the daily candle forms
Great for bias filters, mean reversion, and daily liquidity zones.
📌 6. Performance-Optimized (Fast!)
Built with:
Fully configurable max lookback
Memory-efficient arrays
Auto-cleaning of old FVG/iFVG objects
Lightweight daily midline recalculation
This allows extremely fast rendering even on 1-minute charts.
📌 7. Alerts
Includes a clean alert condition:
Price returned to a Fair Value Gap
Works for both bullish and bearish FVG revisits.
🎯 Who This Indicator Is For
This tool is ideal for traders who use:
ICT / SMC concepts
Liquidity-based trading
ORB strategies
Imbalance-driven price action
Intraday or NY session-focused setups
Futures, crypto, forex, and equities
🎁 Summary
This indicator gives you:
A clean ORB framework
Automatic, dynamic FVG and iFVG analysis
Real-time daily candle context
Customizable visuals
Powerful session filtering
Efficient performance
All in one clean, intuitive package built for real-time decision making.

🔥 SMC Reversal Engine v3.5 – Clean FVG + DashboardSMC Reversal Engine v3.5 – Clean FVG + Dashboard
The SMC Reversal Engine is a precision-built Smart Money Concepts tool designed to help traders understand market structure the single most important foundation in reading price action. It reveals how institutions move liquidity, where structure shifts occur, and how Fair Value Gaps (FVGs) align with these changes to signal potential reversals or continuations.
Understanding How It Works
At its core, the script detects CHoCH (Change of Character) and BOS (Break of Structure)—the two key turning points in institutional order flow. A CHoCH shows that the market has reversed intent (for example, from bearish to bullish), while a BOS confirms a continuation of the current trend. Together, they form the backbone of structure-based trading.
To refine this logic, the engine uses fractal pivots clusters of candles that confirm swing highs and lows. Fractals filter out noise, identifying points where price truly changes direction. The script lets you set this sensitivity manually or automatically adapts it depending on the timeframe. Lower fractal sensitivity captures smaller intraday swings for scalpers, while higher sensitivity locks onto major swing structures for swing and position traders.
The dashboard gives you a real-time reading of the trend, the last high and low, and what the market is likely to do next—for example, “Expect HL” or “Wait for LH.” It even tracks the accuracy of these structure predictions over time, giving an educational feedback loop to help you learn price behavior.
Fair Value Gaps and Tap Entries
Fair Value Gaps (FVGs) mark moments when price moves too quickly, leaving inefficiencies that institutions often revisit. When price taps into an FVG, it often acts as a high-probability entry zone for reversals or continuations. The script automatically detects, extends, and deletes old FVGs, keeping only relevant zones visible for a clean chart.
Traders can enable markTapEntry to visually confirm when an FVG gets filled. This is a simple but powerful trigger that often aligns with CHoCH or BOS moments.
Recommended Settings for Different Traders
For Scalpers, use a lower HTF structure such as 1 minute or 5 minutes. Keep Auto Fractals on for faster reaction, and limit FVG zones to 2–3. This gives you a clean, real-time reflection of order flow.
For Intraday Traders, 15-minute to 1-hour structure gives the perfect balance between reactivity and stability. Fractal sensitivity around 3–5 captures the most actionable levels without excessive noise.
For Swing Traders, use 4-hour, 1-day, or even 3-day structure. The chart becomes smoother, showing higher-order CHoCH and BOS that define true institutional transitions. Combine this with EMA confirmation for higher conviction.
For Position or Macro Traders, select Weekly or Monthly structure. The dynamic label system expands automatically to keep more historical BOS/CHoCH points visible, allowing you to see long-term shifts clearly.
Educational Value
This indicator is built to teach traders how to see structure the way professionals and smart money do. You’ll learn to recognize how markets transition from one phase to another from accumulation to manipulation to expansion. Each CHoCH or BOS helps you decode where liquidity is being taken and where new intent begins.
The included SMC Quick Guide explains each structural cue right on your chart. Within days of using it, you’ll start noticing patterns that reveal how price really moves, instead of guessing based on indicators.
Settings and How to Use Them
Everything in the SMC Reversal Engine is designed to adapt to your trading style and help you read structure like a professional.
When you open the Inputs Panel, you’ll see sections like Fractal Settings, FVG Settings, Buy/Sell Confirmation, and Educational Tools.
Under Fractal Settings, you can choose the higher timeframe (HTF) that defines structure—from minutes to weeks. The Auto Fractal Sensitivity option automatically adjusts how tight or wide swing points are detected. Lower sensitivity captures short-term fluctuations (great for scalpers), while higher values filter noise and isolate major swing highs and lows (perfect for swing traders).
The Fair Value Gap (FVG) options manage imbalance zones—the footprints of institutional orders. You can show or hide these zones, extend them into the future, and control how long they remain before auto-deletion. The Mark Entry When FVG is Tapped option places a small label when price revisits the gap—a potential entry signal that aligns with smart money logic.
EMA Confirmation adds a layer of confluence. The script can automatically scale EMA lengths based on timeframe, or you can input your preferred values (for example, 9/21 for intraday, 50/200 for swing). Require EMA Crossover Confirmation helps filter false moves, keeping you trading only with aligned momentum.
The Educational section gives traders visual reinforcement. When enabled, you’ll see tags like HH (Higher High), HL (Higher Low), LH (Lower High), and LL (Lower Low). These show structure shifts in real time, helping you learn visually what market structure really means. The Cheat Sheet panel summarizes each term, always visible in the corner for quick reference.
Early Top Warnings use wick size and RSI divergence to signal when price may be overextended—a useful heads-up before potential CHoCH formations.
Finally, the Narrative and Accuracy System translates structure into simple English—messages like Trend Bullish → Wait for HL or BOS Bearish → Expect LL. Over time, you can monitor how accurate these expectations have been, training your pattern recognition and confidence.
Pro Tips for Getting the Most Out of the SMC Reversal Engine
1. Start on Higher Timeframes First: Begin on the 4H or Daily chart where structure is cleaner and signals have more weight. Then scale down for entries once you grasp directional intent.
2. Use FVGs for Context, Not Just Entries: Observe how price behaves around unfilled FVGs—they often act as magnets or barriers, offering insight into where liquidity lies.
3. Combine With HTF Bias: Always trade in the direction of your higher timeframe trend. A bullish weekly BOS means lower timeframes should ideally align bullishly for optimal setups.
4. Clean Charts = Clear Mind: Use Minimal Mode when focusing on price action, then toggle the educational tools back on to review structure for learning.
5. Don’t Chase Every CHoCH or BOS: Focus on significant breaks that align with broader context and liquidity sweeps, not minor fluctuations.
6. Accuracy Rate Is a Feedback Tool: Use the accuracy stat as a reflection of consistency—not a trade trigger.
7. Build Narrative Awareness: Read the on-chart narrative messages to reinforce structured thinking and stay disciplined.
8. Practice Replay Mode: Step through past structures to visually connect CHoCH, BOS, and FVG behavior. It’s one of the best ways to train pattern recognition.
Summary
* Detects CHoCH and BOS automatically with fractal precision
* Identifies and manages Fair Value Gaps (FVGs) in real time
* Displays a smart dashboard with accuracy tracking
* Adapts label visibility dynamically by timeframe
* Perfect for both learning and trading with institutional clarity
This tool isn’t about predicting the market—it’s about understanding it. Once you can read structure, everything else in trading becomes secondary.

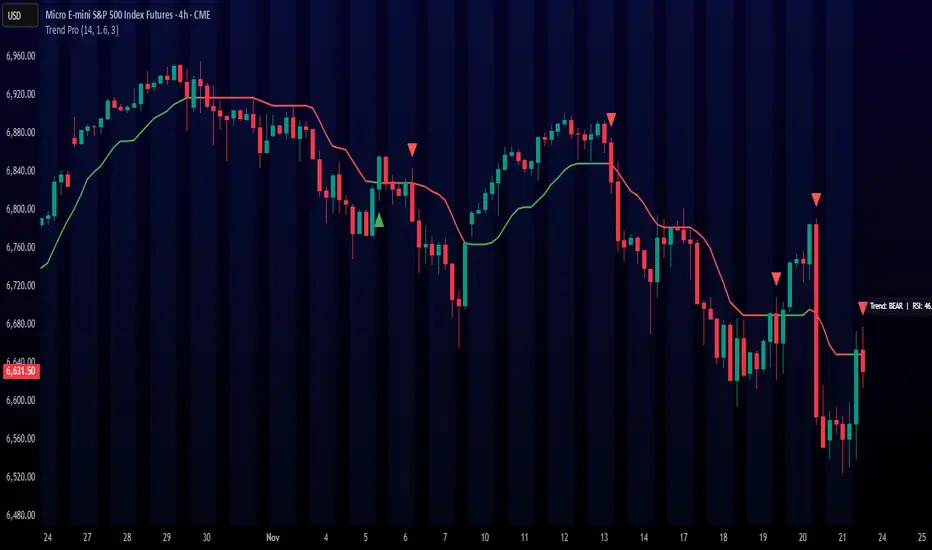
Trend ProTrend Pro is a volatility-adaptive trend and momentum system designed for scalping, day trading, and short-term swing trading.
It uses an ATR-based dynamic trend line (Alpha-Trend style) to identify momentum shifts and confirm directional strength.
Unlike traditional moving averages, Trend Pro adapts to volatility and reacts faster during expansions while filtering noise during chop.
🔍 How Trend Pro Works
Trend Pro builds a dynamic volatility channel using ATR and tracks whether price stays above or below this adaptive line.
When price crosses and closes on the opposite side, it suggests a shift in market control.
When price closes above the line → the trend turns BULLISH (green)
When price closes below the line → the trend turns BEARISH (red)
This gives a clear, visual trend state without repainting.
Tips for Best Performance:
✔ Avoid signals directly inside major ranges or sideways chop
✔ Strongest entries come after small pullbacks into the line
✔ Combine signals with:
Market structure
Key swing highs/lows
Liquidity sweeps
Session timing (NYSE open, power hour)
✔ Trend Pro works best when used with the trend, not counter-trend
Enjoy!
TICK & ADD Market Internals SuiteOverview: This is the ultimate Market Internals tool designed for professional SPX/ES and NQ intraday traders.
Traders often monitor both TICK (for short-term timing) and ADD (for daily trend context). However, displaying them on the same chart is usually problematic due to their different scales (TICK ±1000 vs. ADD ±2000), causing chart compression.
Market Internals Suite solves this with a smart "Visual Scaling" algorithm, perfectly fusing TICK Candles and the ADD Line into a single, coherent pane.
Key Features
1.Hybrid Visualization:
· TICK (Foreground): Displayed as OHLC Candles to capture instant liquidity sweeps and wicks.
· ADD (Background): Displayed as a clean Line to show the underlying market breadth trend without clutter.
2.Smart Visual Scaling:
· To prevent chart distortion, the ADD line is visually scaled down (Default Ratio: 1.5).
· This aligns the ADD trend volatility with the TICK range, allowing you to instantly spot divergences or resonance between sentiment and trend.
3.Real-Time Data Dashboard:
· Never lose track of the actual numbers. A dashboard in the top-right corner displays the TRUE values for both TICK and ADD (unscaled).
· Customizable Text Size: You can adjust the dashboard font size (Small/Normal/Large/Huge) in the settings to fit your screen.
4.TICK Extreme Alerts:
· Visual Highlight: The chart background highlights (Green/Red) only when TICK hits the extreme ±1000 levels.
· The ADD line remains clean and alert-free to serve as a stable reference.
Strategy: Context + Timing:
1.Trend Resonance
When the ADD line trends upward and TICK candles consistently maintain levels above zero, it indicates a healthy, strong trend. This is a signal to look for trend-following long setups.
2.Divergence Analysis (The "Holy Grail" Signal)
This combination view makes spotting internal divergences incredibly easy:
· Bearish Divergence: When Price makes a New High, but the ADD line or TICK peaks make a Lower High. This suggests buying exhaustion beneath the surface and often precedes a reversal down.
· Bullish Divergence: When Price makes a New Low, but the ADD line or TICK lows make a Higher Low. This suggests that selling pressure is being absorbed, signaling a potential bounce or reversal up.

Live Session Extremes: Asia / London / NY (5m)This script automatically tracks and plots the live high and low levels of the three major Forex trading sessions:
Asia Session (18:00–03:00) — Teal
London Session (03:00–08:00) — Blue
New York Session (08:00–12:00) — Red
Designed specifically for 5-minute charts, it updates in real time as each session forms new highs or lows.
You always see the most recent session’s levels, cleanly plotted and color-coded on your chart.
✔ Features
Live updating lines for each session’s high & low
Lines anchored to the exact candles that created the extreme
Auto-cleaning: old session levels are deleted when a new session begins
Clear labeling:
Asia High / Asia Low (Teal)
London High / London Low (Blue)
NY High / NY Low (Red)
Extend-right option for projecting session levels into future price action
Built for precision session-based strategies such as:
Liquidity grabs
Session sweeps
BOS/CHOCH analysis
ICT-style trading
High/low power levels

X HL Rangedynamically maps high-low range boxes for custom time-bucket intervals without relying on security() calls. Each defined timeframe (e.g., 15-minute, 60-minute, or any user-selected value) produces a visual “range block” that captures the extremes (H/L) of price activity for that session bucket.
This tool is engineered to be lightweight, precise, and session-aware, avoiding repaint characteristics that can occur when referencing higher-timeframe candles directly. It builds the range locally in real-time, ensuring that traders always see authentic structure as it developed on the chart — not delayed or back-filled values.
The indicator can display one or both timeframes independently, with configurable display depth, color logic, and visual emphasis through fill and border toggles.
🎯 Key Features
Feature Description
Multi-timeframe bucket logic Builds range blocks locally using time calculations, not security()
Directional coloring Automatically adjusts based on up/down close of the completed range
Independent display controls Turn TF buckets on/off without affecting the other
Visual style management Independent fill + border toggles and opacity-aware color output
Historical depth control Automatically prunes oldest blocks to maintain visual clarity
Non-repainting Values are locked at bucket close and never adjusted backward
💡 Primary Use Cases
1️⃣ Intraday Structure Mapping
Traders who value intrablock liquidity zones, swing sweeps, or stop hunt regions can instantly see where price respected — or violated — previous time-based range extremes.
2️⃣ Volatility & Regime Shift Detection
Rapid compression or expansion across sequential blocks can be used to identify:
Transition from balance → imbalance
Trend exhaustion and reversal
The start of new initiative moves
3️⃣ Confluence Layering with:
VWAP (session, anchored, rolling)
Market profile / volume nodes
Opening range breakout systems
Session order flow frameworks
Mean-reversion and ATR-based models
Stacking multiple intervals (e.g., 15-min micro-range + 60-min macro-range) can highlight nested liquidity pockets, similar to structural mapping seen in professional execution models.

VWAP + Volume Spikes See Where Smart Money ExhaustsVolume tells the truth. VWAP tells the bias. This script shows both — live.
If you trade intraday momentum, reversals, or liquidity sweeps, this indicator is built for you.
It shows where volume spikes hit extreme levels, anchored around VWAP and its dynamic bands, so you can instantly spot capitulation or hidden absorption.
🎯 What This Indicator Does
✅ Plots VWAP — session-anchored, updates automatically
✅ Adds dynamic VWAP bands — standard deviation envelopes showing volatility context
✅ Highlights volume spikes — colored candles + background for abnormal prints
✅ Includes alerts — “Volume Spike”, “VWAP Cross”, or a combined alert with direction
✅ Clean visual design — instantly readable in fast markets
It’s your visual orderflow radar — whether you’re trading gold, indices, or small caps.
🔍 Why It Works
Institutions build and unwind positions around VWAP.
Retail often chases volume… this script shows you when that volume becomes too extreme.
A spike above VWAP near resistance? → Likely distribution.
A spike below VWAP near support? → Likely capitulation.
Combine volume exhaustion + VWAP context, and you’ll see market turning points form before most indicators react.
⚙️ Inputs You Can Tune
Bands lookback: adjusts how reactive the VWAP bands are
Band width (σ): set how tight or wide your deviation envelope is
Volume baseline length: controls how “abnormal” a spike must be
Spike threshold: multiplier vs. average volume
Toggle color-coding, bands, and labels
Default settings work well across 1m–15m intraday charts and 1h–4h swing frames.
💡 How Traders Use It
1️⃣ Fade Parabolics:
When a green spike candle pierces upper VWAP band on high volume → smart money unloading.
Look for rejection and short into VWAP.
2️⃣ Catch Capitulations:
When a red spike candle dumps below lower VWAP band → panic selling.
Watch for stabilization and long back to VWAP.
3️⃣ VWAP Rotation Plays:
Alerts for price crossing VWAP help you spot shift in intraday control.
Above VWAP = buyers in charge.
Below VWAP = sellers in charge.
🧠 Best Practices
Pair it with Volume Profile or Delta/Flow tools to confirm exhaustion.
Don’t chase — wait for spike confirmation + reversal candle.
Use it on liquid tickers (NASDAQ, SPY, GOLD, BTC, etc.).
Great for Dux-style small-cap shorts or index pullbacks.
🔔 Alerts Ready
Choose from:
Volume Spike (single-bar explosion)
VWAP Cross Up/Down (trend shift confirmation)
One Combined Alert (any signal, includes ticker, price, and volume)
Set once — get real-time push notifications, Telegram, or webhook signals.
📊 My Favorite Setups
US100 / NASDAQ: fade rallies above VWAP + spike
Gold / Silver: trade reversals from VWAP bands
Small caps: short back-side after volume climax
ES, DAX, Oil: scalp VWAP rotation with confluence
❤️ Support This Work
I release free and premium scripts weekly — combining smart money concepts, VWAP tools, and volume analytics.
👉 Follow me on TradingView for more indicators and setups.
👉 Comment “🔥” if you want me to post the multi-timeframe VWAP + Volume Pressure version next.
👉 Share this with your team — it helps the community grow.

Order-Flow Proxy (VWAP Deviation Zones)Order-Flow Proxy (VWAP Deviation Zones) helps traders visualize when market price moves unusually far away from its Volume-Weighted Average Price (VWAP) — a key fair-value level used by institutional participants.
When price stretches too far above or below VWAP, it often signals temporary imbalance between buying and selling pressure.
This tool highlights those moments using simple color zones and an optional statistical Z-Score filter for deeper precision.
In short: it’s a clean, minimal mean-reversion indicator showing when price is statistically “too far” from fair value.
Red zone → Price extended above VWAP → possible buyer exhaustion or short setup.
Green zone → Price extended below VWAP → possible seller exhaustion or long setup.
VWAP line → Acts as a dynamic fair-value anchor.
Concept:
VWAP combines both price and traded volume to define where most transactions occurred.
Deviations from it — measured either by a fixed distance (1%) or by Z-Score — can reveal overvaluation or undervaluation zones used by professional traders for contrarian setups.
How to use:
Apply the indicator to any intraday chart (1m–1h recommended).
Watch for background color shifts — red or green.
Optionally enable the Z-Score filter to focus only on statistically extreme deviations.
Combine with volume spikes, liquidity sweeps, or your own order-flow tools for confirmation.
Tip:
Best used as a visual overlay for detecting stretched markets and potential reversals.

📋 Trading Checklist – Precision Entry SystemTake your trading discipline to the next level with this Precision Trading Checklist for TradingView. Designed for intraday traders following liquidity, structure, and Smart Money Concepts (SMC) AKA ICT Concepts, this overlay ensures you never miss a key confirmation before entering a trade.
Features:
✅ Pre-Market Preparation: Track previous session highs/lows, AM/PM sessions, and key liquidity zones.
✅ Bias & Narrative Check: Quickly confirm daily trend, price position relative to daily open, and higher timeframe confluence.
✅ Session-Specific Rules: Focused sessions like Silver Bullet (10:00–11:30), Afternoon (13:30–15:00), and Final Hour (15:00–16:00).
✅ Structure & Setup Validation: Confirm liquidity sweeps, market structure shifts, expansion candles, fair value gaps, and order blocks.
✅ Risk Management Reminders: Stop-loss, target points, risk percentage, breakeven management, and pyramiding rules.
✅ Post-Trade Journaling: Document entries, session, setup type, trade outcome, and grading for continuous improvement.
✅ Golden Rules: Visual reminders to enforce discipline, avoid emotional trades, and respect session limits.
Why Use It:
This checklist is perfect for traders who want to stay consistent, minimise mistakes, and follow a disciplined routine. Displayed as an overlay on your chart, it provides all essential checks in one glance, keeping you focused on the setup rather than scrolling through notes or separate trackers.
How to use:
Add the indicator to your chart
Click the settings/gear icon
Check off items as you complete them
The checklist on your chart updates in real-time with green checkmarks!
The checkboxes will persist as long as the indicator is on your chart,
making it perfect for tracking your pre-trade and post-trade routines!
Follow the checklist items step by step before entering trades.
Use the session-specific guidelines to filter setups.
Journal your trades post-execution for growth and analysis.

Session Dominator — Asia • London • New York Precision ZonesRule the global market sessions.
Session Dominator is a precision-engineered indicator built for traders who want total clarity across Asia, London, and New York sessions.
It automatically plots:
🔷 Dynamic Session Boxes — visually map institutional killzones in real time
⚙️ Session Mean Line — track equilibrium and liquidity shifts
📊 EMA-50 Confluence — align directional bias and intraday trend
🎯 BSL / SSL Levels — reveal active liquidity sweeps and reversals
💡 Bias Engine — evaluates structure and locks the session bias automatically
Toggle between Asia / London / New York / Overlap / Custom modes to dominate any timezone.
Designed with minimalist visuals, high precision, and ICT-based logic — this tool helps you anticipate where liquidity will be taken before it happens.
✳️ For XAUUSD traders, scalpers, and ICT-style analysts seeking sniper-level clarity.

RAFEN-G - Kill Zones & Institutional Gaps🔍 What It Does
Kill Zones (KZ1, KZ2, KZ3)
Automatically highlights the main intraday liquidity windows such as the London open, NY AM, and NY PM sessions — customizable by time, color, and transparency.
Perfect for timing setups, identifying liquidity sweeps, or backtesting session behavior.
Institutional GAP Detection (NY 11:00 → 03:00)
Anchored on the New York H1 clock, the script automatically draws the “institutional gap” between the 11:00 close and the 03:00 open of the next trading day.
Each gap is drawn as a transparent box with a label showing its size in price units.
Dynamic Cleanup & Color Updates
Automatically removes old boxes beyond your chosen history limit and keeps all visuals perfectly synchronized in real-time.
⚙️ Key Features
3 fully independent and editable Kill Zones
Adjustable timezone (default: America/New_York)
Works on all intraday timeframes
Auto-management of historical data
Clean and lightweight visuals (up to 2000 boxes)
Real-time color and transparency updates
Alerts when each Kill Zone starts
🧠 Ideal For
Traders using ICT, SMC, or institutional frameworks who want clear visual separation of market sessions and automatic tracking of session-to-session gaps for confluence or imbalance analysis.
🕐 Recommended Use
Apply on 5 min / 15 min / 1 h charts, align timezone to NYC, and combine with liquidity or FVG tools for maximum insight.

Camarilla Pivot Plays (Lite) [BruzX]█ OVERVIEW
This indicator implements the Camarilla Pivot Points levels and a system for suggesting particular plays. It only 3rd, 4th, and 6th levels, as these are the only ones used by the system. It also optionally shows the Central Pivot Range, which is in fact between S2 and R2. In total, there are 12 possible plays, grouped into two groups of six. The algorithm evaluates in real-time which plays fulfil their precondition and shows the candidate plays. The user must then decide if and when to take the play.
█ CREDITS
The Camarilla pivot plays are defined in a strategy developed by Thor Young, and the whole system is explained in his book "A Complete Day Trading System". This description is self-sufficient for effective use.
█ FEATURES
Display the 3rd, 4th and 6th Camarilla pivot levels
Works for stocks, futures, indices, forex and crypto
Automatically switches between RTH and ETH data based on criteria defined by the system.
Option to force RTH/ETH data and force a close price to be used in the calculation.
Preconditions for the plays can be toggled on/off
Works correctly on both RTH and ETH charts
Well-documented options tooltips
Well-documented and high-quality open-source code for those who are interested
█ HOW TO USE
The defaults work well; at a minimum, just add the indicator and watch the plays being called. For US futures, you will probably want to chat the "Timezone for sessions" to New York and the regular session times to 09:30 - 16:00. The following diagram shows its key features.
By default, the indicator draws plays 1 days back; this can be changed up to 20 days. The labels can be shifted left/right using the "label offset" option to avoid overlapping with other labels in this indicator or those of another indicator.
An information box at the top-right of the chart shows:
The data currently in use for the main pivots. This can switch in the pre-market if the H/L range exceeds the previous day's H/L, and if it does, you will see that switch at the time that it happens
Whether the current day's pivots are in a higher or lower range compared to the previous day's.
The width of the pivots compared to the previous day
The current candidate plays fulfilling preconditions. You then need to watch the price action to decide whether to take the play.
The resistance pivots are all drawn in the same colour (red by default), as are the support pivots (green by default). You can change the resistance and support colours, but it is not possible to have different colours for different levels of the same kind.
█ CONCEPTS
The indicator is focused around daily Camarilla pivots and evaluates the preconditions for 12 possible plays: 6 when in a higher range, 6 when in a lower range. The plays are labelled by two letters—the first indicates the range, the second indicates the play—as shown in this diagram:
The pivots can be calculated using only RTH (Regular Trading Hours) data, or ETH (Extended Trading Hours) data, which includes the pre-market and post-market. The indicator implements logic to automatically choose the correct data, based on the rules defined by the strategy. This is user-overridable. With the default options, ETH will be used when the H/L range in the previous day's post-market or current day's pre-market exceeds that of the previous day's regular market. In auto mode, the chosen pivots are considered the main pivots for that day and are the ones used for play evaluation. The "other" pivots can also be shown—"other" here meaning using ETH data when the main pivots use RTH data, and vice versa.
The plays must fulfil a set of preconditions. There are preconditions for valid region and range, price sweeps into levels, correct pivot width, opening position, price action, and whether neutral range plays and premarket plays are enabled. When all the preconditions are fulfilled, the play will be shown as a candidate.
█ NOTE FOR FUTURES
Futures don't officially have a pre-market or post-market like equities. Let's take ES on CME as an example. It trades from 18:00 ET Sunday to 17:00 Friday (ET), with a daily pause between 17:00 and 18:00 ET. However, most of the trading activity is done between 09:30 and 16:00, which you can tell from the volume spikes at those times, and this coincides with NYSE/NASDAQ regular hours. So we define a pseudo-pre-market from 18:00 the previous day to 09:30 on the current day, then a pseudo-regular market from 08:30 to 16:00, then a pseudo-post-market from 16:00 to 17:00. The indicator then works exactly the same as with equities—all the options behave the same, just with different session times defined for the pre-, regular, and post-market, with "RTH" meaning just the regular market and "ETH" meaning all three.
█ LIMITATIONS
The pivots are very close to those shown in DAS Trader Pro. They are not to-the-cent exact, but within a few cents. The reasons are:
TradingView provides free real-time data from CBOE One, not full exchange data (you can pay for this though, and it's not expensive), and
the close/high/low are taken from the intraday timeframe you are currently viewing, not daily data—which are very close, but often not exactly the same. For example, the high on the daily timeframe may differ slightly from the daily high you'll see on an intraday timeframe.
Despite these caveats, occasionally large spikes will be seem in one platform and not the other (even with paid data), or the spikes will reach significantly difference prices. Where these spikes create the daily high or low, this can cause significantly different pivots levels. The more traded the stock is, the less the difference tends to be. Highly traded stocks are usually within a few cents (but even they occasionally have large differences in spikes). There is nothing that can be done about this.
The 6th Camarilla level does not have a standard definition and may not match the level shown on other platforms. It does match the definition used by DAS Trader Pro.
Replay mode for stocks does not work correctly. This is due to some important Pine Script variables provided by the TradingView platform and used by the script not being assigned correct values in replay mode. Futures do not use these variables, so they should work in replay mode.
The indicator is an intraday indicator (despite also being able to show weekly and monthly pivots on an intraday chart). It deactivates on a daily timeframe and higher. Sub-minute timeframes are also not supported.
The indicator was developed and tested for US/European stocks, US futures and EURUSD forex and BTCUSD. It should work as intended for stocks and futures in different countries, and for all forex and crypto, but this is tested as much as the security it was developed for.
█ DISCLAIMER
This indicator is provided for information only and should not be used in isolation without a good understand of the system and without considering other factors. You should not take trades using real money based solely on what this indicator says. Any trades you take are entirely at your own risk.

Gold H1 Breakout Failure (V11.0)This strategy is designed for trading XAU/USD (Gold) on the 1-hour timeframe. It identifies and trades fake breakouts of the Asian session range.
The logic is simple yet effective:
The script first marks the Asian session high and low.
Once price breaks out of this range and closes outside, it waits for confirmation by watching for price to close back inside the range.
When this re-entry occurs, the strategy takes a position in the opposite direction of the initial breakout, anticipating a false breakout or liquidity trap setup.
By focusing on these fakeouts, the strategy aims to capture reversal momentum after liquidity sweeps, making it especially effective during sessions when volatility transitions from Asia to London or New York.

AG_STRATEGY📈 AG_STRATEGY — Smart Money System + Sessions + PDH/PDL
AG_STRATEGY is an advanced Smart Money Concepts (SMC) toolkit built for traders who follow market structure, liquidity and institutional timing.
It combines real-time market structure, session ranges, liquidity levels, and daily institutional levels — all in one clean, professional interface.
✅ Key Features
🧠 Smart Money Concepts Engine
Automatic detection of:
BOS (Break of Structure)
CHoCH (Change of Character)
Dual structure system: Swing & Internal
Historical / Present display modes
Optional structural candle coloring
🎯 Liquidity & Market Structure
Equal Highs (EQH) and Equal Lows (EQL)
Marks strong/weak highs & lows
Real-time swing confirmation
Clear visual labels + smart positioning
⚡ Fair Value Gaps (FVG)
Automatic bullish & bearish FVGs
Higher-timeframe compatible
Extendable boxes
Auto-filtering to remove noise
🕓 Institutional Sessions
Asia
London
New York
Includes:
High/Low of each session
Automatic range plotting
Session background shading
London & NY Open markers
📌 PDH/PDL + Higher-Timeframe Levels
PDH / PDL (Previous Day High/Low)
Dynamic confirmation ✓ when liquidity is swept
Multi-timeframe level support:
Daily
Weekly
Monthly
Line style options: solid / dashed / dotted
🔔 Built-in Alerts
Internal & swing BOS / CHoCH
Equal Highs / Equal Lows
Bullish / Bearish FVG detected
🎛 Fully Adjustable Interface
Colored or Monochrome visual mode
Custom label sizes
Extend levels automatically
Session timezone settings
Clean, modular toggles for each component
🎯 Designed For Traders Who
Follow institutional order flow
Enter on BOS/CHoCH + FVG + Liquidity sweeps
Trade London & New York sessions
Want structure and liquidity clearly mapped
Prefer clean charts with full control
💡 Why AG_STRATEGY Stands Out
✔ Professional SMC engine
✔ Real-time swing & internal structure
✔ Session-based liquidity tracking
✔ Non-cluttered chart — high clarity
✔ Supports institutional trading workflows

Percentile Rank Oscillator (Price + VWMA)A statistical oscillator designed to identify potential market turning points using percentile-based price analytics and volume-weighted confirmation.
What is PRO?
Percentile Rank Oscillator measures how extreme current price behavior is relative to its own recent history. It calculates a rolling percentile rank of price midpoints and VWMA deviation (volume-weighted price drift). When price reaches historically rare levels – high or low percentiles – it may signal exhaustion and potential reversal conditions.
How it works
Takes midpoint of each candle ((H+L)/2)
Ranks the current value vs previous N bars using rolling percentile rank
Maps percentile to a normalized oscillator scale (-1..+1 or 0–100)
Optionally evaluates VWMA deviation percentile for volume-confirmed signals
Highlights extreme conditions and confluence zones
Why percentile rank?
Median-based percentiles ignore outliers and read the market statistically – not by fixed thresholds. Instead of guessing “overbought/oversold” values, the indicator adapts to current volatility and structure.
Key features
Rolling percentile rank of price action
Optional VWMA-based percentile confirmation
Adaptive, noise-robust structure
User-selectable thresholds (default 95/5)
Confluence highlighting for price + VWMA extremes
Optional smoothing (RMA)
Visual extreme zone fills for rapid signal recognition
How to use
High percentile values –> statistically extreme upward deviation (potential top)
Low percentile values –> statistically extreme downward deviation (potential bottom)
Price + VWMA confluence strengthens reversal context
Best used as part of a broader trading framework (market structure, order flow, etc.)
Tip: Look for percentile spikes at key HTF levels, after extended moves, or where liquidity sweeps occur. Strong moves into rare percentile territory may precede mean reversion.
Suggested settings
Default length: 100 bars
Thresholds: 95 / 5
Smoothing: 1–3 (optional)
Important note
This tool does not predict direction or guarantee outcomes. It provides statistical context for price extremes to help traders frame probability and timing. Always combine with sound risk management and other tools.

Liquidity Grab + RSI Divergence═══════════════════════════════════════════════════════════════
LIQUIDITY GRAB + RSI DIVERGENCE INDICATOR
═══════════════════════════════════════════════════════════════
📌 OVERVIEW
This indicator identifies high-probability reversals by combining:
• Liquidity sweeps (stop hunts)
• RSI divergence confirmation
• Filters false breakouts automatically
═══════════════════════════════════════════════════════════════
🟢 BUY SIGNAL (Green Triangle Up)
REQUIRES BOTH CONDITIONS:
1. Liquidity Grab Below Previous Low
• Price breaks BELOW recent low
• Candle CLOSES ABOVE that low
• Traps sellers who shorted the breakdown
2. Bullish RSI Divergence
• Price: Lower Low (LL)
• RSI: Higher Low (HL)
• Shows weakening downward momentum
➜ Result: Potential bullish reversal
═══════════════════════════════════════════════════════════════
🔴 SELL SIGNAL (Red Triangle Down)
REQUIRES BOTH CONDITIONS:
1. Liquidity Grab Above Previous High
• Price breaks ABOVE recent high
• Candle CLOSES BELOW that high
• Traps buyers who bought the breakout
2. Bearish RSI Divergence
• Price: Higher High (HH)
• RSI: Lower High (LH)
• Shows weakening upward momentum
➜ Result: Potential bearish reversal
═══════════════════════════════════════════════════════════════
📊 VISUAL INDICATORS
Main Signals:
🔺 Large Green Triangle = BUY (Liq Grab + Bullish Div)
🔻 Large Red Triangle = SELL (Liq Grab + Bearish Div)
Reference Levels:
━ Red Line = Previous High Level
━ Green Line = Previous Low Level
Additional Markers (Optional):
○ Small Green Circle = Liquidity grab low only
○ Small Red Circle = Liquidity grab high only
✕ Small Blue Cross = Bullish divergence only
✕ Small Orange Cross = Bearish divergence only
═══════════════════════════════════════════════════════════════
⚙️ SETTINGS
1. Lookback Period (Default: 20)
• Range: 5-100
• Sets how far back to identify previous highs/lows
• Higher = fewer but stronger levels
• Lower = more frequent but weaker levels
2. RSI Length (Default: 14)
• Range: 5-50
• Standard RSI calculation period
• 14 is industry standard
3. RSI Divergence Lookback (Default: 5)
• Range: 3-20
• Controls pivot point sensitivity
• Higher = fewer divergence signals
• Lower = more divergence signals
4. Show Labels (Default: ON)
• Toggle BUY/SELL text labels
• Disable for cleaner chart view
═══════════════════════════════════════════════════════════════
💡 HOW TO USE
Step 1: WAIT FOR CONFIRMATION
• Only trade LARGE TRIANGLE signals
• Ignore small circles/crosses alone
Step 2: CHECK TIMEFRAME
• Best on: 15min, 1H, 4H, Daily
• Avoid: 1min, 5min (too noisy)
Step 3: CONFIRM CONTEXT
• Check overall market trend
• Identify key support/resistance
• Look for confluence with price action
Step 4: ENTRY & RISK MANAGEMENT
• Enter on signal candle close or pullback
• Stop loss below/above the liquidity grab wick
• Target: Previous swing high/low or key levels
• Risk/Reward: Minimum 1:2 ratio
Step 5: SET ALERTS
• Create alert for "BUY Signal"
• Create alert for "SELL Signal"
• Never miss opportunities
═══════════════════════════════════════════════════════════════
✅ BEST PRACTICES
DO:
✓ Use on multiple timeframes for confluence
✓ Combine with support/resistance zones
✓ Wait for both conditions (liq grab + divergence)
✓ Practice on demo account first
✓ Use proper position sizing
DON'T:
✗ Trade every small circle/cross
✗ Use on very low timeframes (<15min)
✗ Ignore overall market context
✗ Trade without stop loss
✗ Risk more than 1-2% per trade
═══════════════════════════════════════════════════════════════
⚠️ IMPORTANT NOTES
• This is a CONFIRMATION tool, not a holy grail
• No indicator is 100% accurate
• Combine with your trading strategy
• Backtest on your preferred instruments
• Adjust parameters for your trading style
• Higher timeframes = more reliable signals
• Always use risk management
═══════════════════════════════════════════════════════════════
🔔 ALERTS INCLUDED
Two alert conditions are built-in:
1. "BUY Signal" - Liquidity Grab + Bullish RSI Divergence
2. "SELL Signal" - Liquidity Grab + Bearish RSI Divergence
═══════════════════════════════════════════════════════════════
📈 RECOMMENDED SETTINGS BY TIMEFRAME
5-15 Min Charts:
• Lookback: 10-15
• RSI Length: 14
• RSI Div Lookback: 3-5
1H-4H Charts:
• Lookback: 20-30
• RSI Length: 14
• RSI Div Lookback: 5-7
Daily Charts:
• Lookback: 30-50
• RSI Length: 14
• RSI Div Lookback: 7-10
═══════════════════════════════════════════════════════════════
Good luck and trade safe! 🚀

Buyside & Sellside Liquidity The Buyside & Sellside Liquidity Indicator is an advanced Smart Money Concepts (SMC) tool that automatically detects and visualizes liquidity zones and liquidity voids (imbalances) directly on the chart.
🟢 Function and meaning:
1. Buyside Liquidity (green):
Highlights price zones above current price where short traders’ stop-loss orders are likely resting.
When price sweeps these areas, it often indicates a liquidity grab or stop hunt.
👉 These zones are labeled with 💵💰 emojis for a clear visual cue where smart money collects liquidity.
2. Sellside Liquidity (red):
Highlights zones below the current price where long traders’ stop-losses are likely placed.
Once breached, these often signal a potential reversal upward.
👉 The 💵💰🪙 emojis make these liquidity targets visually intuitive on the chart.
3. Liquidity Voids (bright areas):
Indicate inefficient price areas, where the market moved too quickly without filling orders.
These zones are often revisited later as the market seeks balance (fair value).
👉 Shown as light shaded boxes with 💰 emojis to emphasize imbalance regions.
💡 Usage:
• Helps spot smart money manipulation and stop hunts.
• Marks potential reversal or breakout zones.
• Great for traders applying SMC, ICT, or Fair Value Gap strategies.
✨ Highlight:
Dollar and money bag emojis (💵💰🪙💸) are integrated directly into chart labels to create a clear and visually engaging representation of liquidity areas.
