One-Sided Gaussian Support & Resistance Rate [Loxx]One-Sided Gaussian Support & Resistance Rate is a mean reversion oscillator much like Fisher Transform. This indicator is built using a one-sided Gaussian filter. If you pair this with Fisher Transform and line up the settings, you'll notice similar outcomes. You'll notice that as the oscillator levels out at around zero or one that this signifies a zone of resistance or support. See here for more details on calculating the OS Gaussian Filter:
Included:
Bar coloring
Signals
Alerts
Ehlers 2-Pole Super Smoothing for smoothing source inputs
"support" için komut dosyalarını ara

Magic levelsIt is by far the simplest on chart presentation of Gann square of 9. It calculates the levels based on previous day closing. These levels usually acts as support and resistance.

MACD Support ResistanceThis script is dynamic support & resistance based on MACD cross.
Resistance= Highest value of candle looks back when MACD crossunder.
Support= Lowest value of candle looks back when MACD crossover.
Middle line is average of Resistance and Support.
Buy when close, LSMA and SMMA crossover middle line. Please use Green Trend Line as SL or Trailing.
Sell when close, LSMA and SMMA crossunder middle line. Please use Red Trend Line as SL or Trailing.
Let me know if its useful for you in the comments and by giving Like (means a lot to me). Also share your feedback and ideas to improve this script further.

Chikou Support and Resistance by TheSocialCryptoClubName: Chikou Supports and Resistances
Category: Indicator
Timeframe: Any Timeframe.
Description: Chikou Support and Resistance is an indicator which allows to represent on the chart the price structures identified by the cusps formed by the Ichimoku Kinko Hyo Chikou, Chikou is the line chart of close price projected in the past as per Kijun periods.
Suggested usage: Use on any timeframe. It is possible to calculate cusp only in a certain period and in a different time frame, and select those calculated by specific lines.
Technical Details: Internally it uses an Array to store the levels of when the Chikou bounces using the Zig-Zag indicator. At the last bar it prints the various lines on the screen.
Credits:
- Techniques has been explained by Corrado Rondelli in "Strategie di trading con l’indicatore Ichimoku Kinko Hyo"
- It is based on the Zig-Zag indicator of TradingView to calculate the Zig-Zag.

Ichimoku Support and Resistance by TheSocialCryptoClubName: Ichimoku Supports and Resistances
Category: Indicator
Timeframe: Any Timeframe.
Description: Ichimoku Support and Resistance is an indicator which allows to represent on the chart the price structures identified through the flat zones of the various lines of the Ichimoku Kinko Hyo indicator
Suggested usage: Use on any timeframe. It is possible to calculate flat zones only in a certain period and in a different time frame, and select those calculated by specific lines.
Technical Details: Internally it uses an Array to store the levels of when a line is flat (calculating the distance to the previous one). At the last bar it prints the various lines on the screen.
Credits:
- Some of the indications has been explained by Corrado Rondelli in "Strategie di trading con l’indicatore Ichimoku Kinko Hyo"

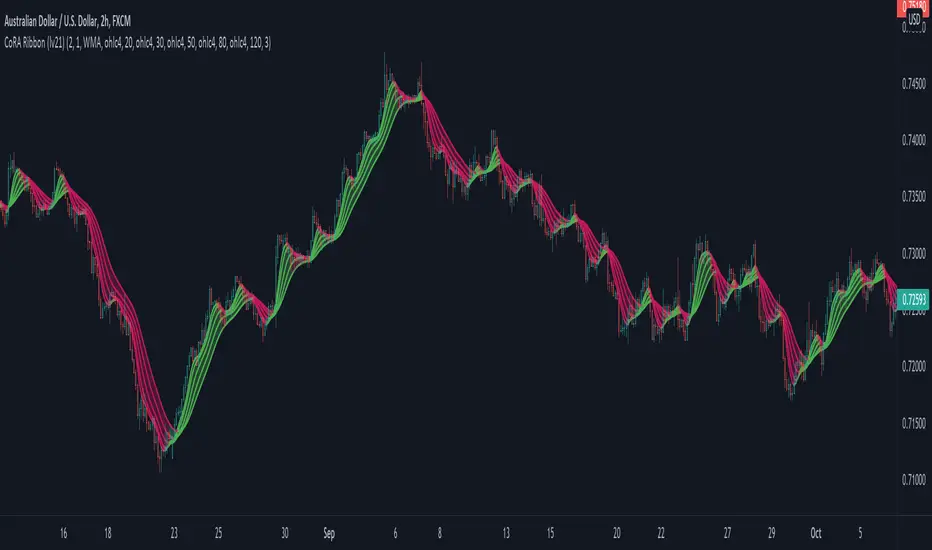
CoRA Ribbon - Multiple Compound Ratio Weighted Moving AveragesWhat distinguishes this indicator?
A Compound Ratio Weighted Moving Average ("CoRA") is a Moving Average that, regardless of its length, has very little lag and that can be relied on to accurately track price movements and fluctuations - compared to other types of Moving Averages.
By combining multiple Compound Ratio Weighted Moving Averages you can identify the trend better and more reliably . This is where "CoRA Ribbon" comes in.
The original study, which supported one CoRA Wave, comes from RedKTrader and was introduced as "RedK Compound Ratio Moving Average (CoRa_Wave)” . Thanks to him for the great work!
What was improved or added to this version of the indicator?
With this version of the indicator, up to 5 waves of Compound Ratio Moving Averages with different lengths can be combined and output to one "CoRA Ribbon".
Alerts were implemented. You can be notified e.g. in the event of
changes in direction of each single CoRA Wave
a trend change, which is determined on the basis of all 5 CoRA Waves
A CoRA Wave compared to other Moving Averages - CoRa Waves are less lagging behind
A suggestion for interpretation of “CoRA Ribbon”:
Since CoRA Ribbon can help you to identify the trend better and more reliably, this indicator provides a good baseline for your strategy, but should always be used in conjunction with other indicators or market analysis.
By adjusting the length of each individual wave, you can adapt "CoRA Ribbon" to your trading style - whether it is more aggressive or more cautious.
The following general rules can be formulated:
If the Ribbon changes its color to green, this can be interpreted as a buy signal.
If the Ribbon changes its color to red, this can be interpreted as a sell signal.
Good to know: The default settings have been selected for timeframe lower than 15 minutes. Adjust them and the indicator will do a great job on higher timeframes too. Please remember to test carefully after every change before the changes are applied to your live trading.
Background “Compound Ratio Weighted Average” - provided by "RedKTrader"
A Compound Ratio Weighted Average is a moving average where the weights increase in a "logarithmically linear" way - from the furthest point in the data to the current point.
The formula to calculate these weights work in a similar way to how "compound ratio" works: you start with an initial amount, then add a consistent "ratio of the cumulative prior sum" each period until you reach the end amount. The result is the "step ratio" between the weights is consistent - This is not the case with linear-weighted “Moving Average Weighted” (WMA) or “Exponential Moving Average” (EMA)
For example, if you consider a Weighted Moving Average ( WMA ) of length 5, the weights will be (from the furthest point towards the most current) 1, 2, 3, 4, 5 -- we can see that the ratio between these weights are inconsistent. in fact, the ratio between the 2 furthest points is 2:1, but the ratio between the most recent points is 5:4. the ratio is inconsistent, and in fact, more recent points are not getting the best weights they should get to counter-act the lag effect. Using the Compound Ratio approach addresses that point.
A key advantage here is that we can significantly reduce the "tail weight" - which is "relatively" large in other Moving Averages.
A Compound Ratio Weighted Moving Average is a moving average that has very little lag and that can be relied on to accurately track price movements and fluctuations.
Use or modify the code, invite us for a coffee, ... most importantly: have a lot of fun and success with this indicator
The code is commented - please don't hesitate to use it as needed or customize it further ... and if you are satisfied and even successful with this indicator, maybe buy us a coffee ;-)
The original developer ( RedKTrader ) and I ( consilus ) are curious to see how our indicators will develop through further ideas - so please keep us updated.
Bollinger Bands SRThis simple script base on Bollinger Bands to defined Support and Resistance and marked Bar False broken SR by Reversal Arrow. Detail of rule as below:
================================================
1.Defined Support and Resistance
1.1.Support
+ Key bar:
- Open Price lower than BB lower band, Close Price higher than BB lower band
+ Support Zone:
- Bottom Zone place at Low Price of Key bar
- Top Zone place at Median Price (HL2) of Key bar
1.2.Resistance
+ Key bar:
- Open Price higher than BB upper band, Close Price lower than BB upper band
+ Resistance Zone:
- Bottom Zone place at Median Price (HL2) of Key bar
- Top Zone place at High Price of Key bar
1.3.Median Line
+ Median Line place at half of Range limit by Support and Resistance
================================================
2.Defined False Break
2.1.Defined Bull Trap
+ High Price higher than Top of Resistance Zone
+ Close Price lower than Top of Resistance Zone
+ Open Price higher than Bottom of Resistance Zone
+ Bar Direction is downward
+ Body of current Bar greater than Body of previous bar
2.2.Defined Bear Trap
+ Low Price lower than Bottom of Support Zone
+ Close Price higher than Bottom of Support Zone
+ Open Price lower than Top of Support Zone
+ Bar Direction is upward
+ Body of current Bar greater than Body of previous bar
================================================
3.Defined Reversal Arrow and Alert
+ Arrow Down when Bull Trap appear
+ Arrow Up when Bear Trap appear
+ Alert when Reversal Arrow appear
================================================
4.Trading
4.1.Long Position
+ Consider open positon when Arrow Up appear
+ Stoploss place at Low Price of Arrow Bar
+ Take profit at Resistance Zone
+ Consider Exit Position when:
- Price moving above Median Line and has Bearish Reversal Pattern
4.2.Short Position
+ Consider open positon when Arrow Down appear
+ Stoploss place at High Price of Arrow Bar
+ Take profit at Support Zone
+ Consider Exit Position when:
- Price moving below Median Line and has Bullish Reversal Pattern

Fibonacci Extension / Retracement / Pivot Points by DGTFɪʙᴏɴᴀᴄᴄɪ Exᴛᴇɴᴛɪᴏɴ / Rᴇᴛʀᴀᴄᴍᴇɴᴛ / Pɪᴠᴏᴛ Pᴏɪɴᴛꜱ
This study combines various Fibonacci concepts into one, and some basic volume and volatility indications
█ Pɪᴠᴏᴛ Pᴏɪɴᴛꜱ — is a technical indicator that is used to determine the levels at which price may face support or resistance. The Pivot Points indicator consists of a pivot point (PP) level and several support (S) and resistance (R) levels. PP, resistance and support values are calculated in different ways, depending on the type of the indicator, this study implements Fibonacci Pivot Points
The indicator resolution is set by the input of the Pivot Points TF (Timeframe). If the Pivot Points TF is set to AUTO (the default value), then the increased resolution is determined by the following algorithm:
for intraday resolutions up to and including 5 min, 4HOURS (4H) is used
for intraday resolutions more than 5 min and up to and including 45 min, DAY (1D) is used
for intraday resolutions more than 45 min and up to and including 4 hour, WEEK (1W) is used
for daily resolutions MONTH is used (1M)
for weekly resolutions, 3-MONTH (3M) is used
for monthly resolutions, 12-MONTH (12M) is used
If the Pivot Points TF is set to User Defined, users may choose any higher timeframe of their preference
█ Fɪʙ Rᴇᴛʀᴀᴄᴇᴍᴇɴᴛ — Fibonacci retracements is a popular instrument used by technical analysts to determine support and resistance areas. In technical analysis, this tool is created by taking two extreme points (usually a peak and a trough) on the chart and dividing the vertical distance by the key Fibonacci coefficients equal to 23.6%, 38.2%, 50%, 61.8%, and 100%. This study implements an automated method of identifying the pivot lows/highs and automatically draws horizontal lines that are used to determine possible support and resistance levels
█ Fɪʙᴏɴᴀᴄᴄɪ Exᴛᴇɴꜱɪᴏɴꜱ — Fibonacci extensions are a tool that traders can use to establish profit targets or estimate how far a price may travel AFTER a retracement/pullback is finished. Extension levels are also possible areas where the price may reverse. This study implements an automated method of identifying the pivot lows/highs and automatically draws horizontal lines that are used to determine possible support and resistance levels.
IMPORTANT NOTE: Fibonacci extensions option may require to do further adjustment of the study parameters for proper usage. Extensions are aimed to be used when a trend is present and they aim to measure how far a price may travel AFTER a retracement/pullback. I will strongly suggest users of this study to check the education post for further details, where to use extensions and where to use retracements
Important input options for both Fibonacci Extensions and Retracements
Deviation, is a multiplier that affects how much the price should deviate from the previous pivot in order for the bar to become a new pivot. Increasing its value is one way to get higher timeframe Fib Retracement Levels
Depth, affects the minimum number of bars that will be taken into account when building
█ Volume / Volatility Add-Ons
High Volatile Bar Indication
Volume Spike Bar Indication
Volume Weighted Colored Bars
This study benefits from build-in auto fib retracement tv study and modifications applied to get extentions and also to fit this combo
Disclaimer:
Trading success is all about following your trading strategy and the indicators should fit within your trading strategy, and not to be traded upon solely
The script is for informational and educational purposes only. Use of the script does not constitute professional and/or financial advice. You alone have the sole responsibility of evaluating the script output and risks associated with the use of the script. In exchange for using the script, you agree not to hold dgtrd TradingView user liable for any possible claim for damages arising from any decision you make based on use of the script

FirstBarRangeFirstBarRange study displays lines for the high and low of the first bar/candle of the trading day, along with shaded areas for the range on top of the first bar high and below the first bar low.
This study is very useful for intraday traders to see when stocks trade above the first bar high, it shows strength, and many times the high of the first bar is also good support.
On the contrary, below the first bar high tends to be good area of weakness and many times it becomes a good resistance level.
Many times when the stock trades inside the first bar range, price will be choppy and range bound.

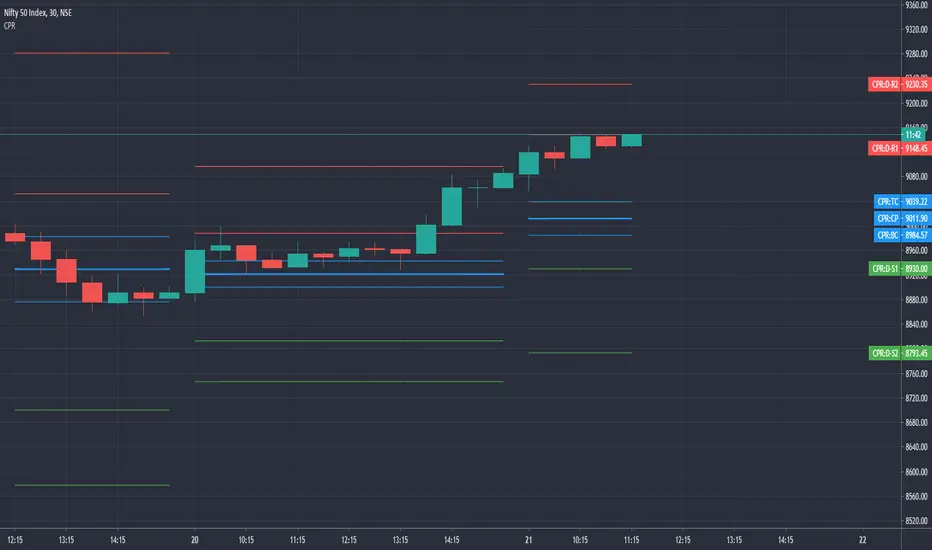
CPR by GuruprasadMeduriThis script will allow to add CPR with Standard Pivot ad 9 levels of support and 9 levels of resistance lines. It has CPR, 3 levels of Day-wise pivots, 3 levels of Weekly pivots and 3 Levels of Monthly Pivots. All the Support and resistance levels can be enabled / disabled from settings. It will allow to select multiple combinations of support and resistance levels across 3 levels at any of the 3 time-frames individually and combined.
These number of combinations will allow user to visualize the charts with desired pivot support & resistance levels on all or any of the 3 time frames.
For Ease of access, listed few points on how the script works..
- CPR and day-wise level 1 & 2 (S1, R1, S2 R2) enabled by default and can be changed from settings
- Day-wise Level 3 (S3 & L3) can be enabled from settings
- Weekly 3 levels and Monthly 3 levels can be enabled from settings
- CPR & pivot levels colored in blue lines
- All support levels colored in Green
- All resistance levels Colored in Red
- Day-wise pivot, support & resistance are straight lines
- Weekly pivot, support & resistance are cross (+) lines
- Weekly pivot, support & resistance are circle (o) lines
- Any combinations can be selected from stettings-> Inputs & style
// - This is an iterative development. Will add more features due course of time. Suggestions are always welcomed!!
Multiple EMAs with marked zones and custom timeframe supportThis script plots 10 exponential moving averages and marks the areas between them.
The lengths are Fibonacci numbers starting from 5 and ending with 377.
The colors indicate the length of the moving average, green for the shortest and purple for the longest.
The zones between consecutive EMA's (e.g. 5 and 8 ema ) are market according to the color of the greater one in value.
By default the script plots values for the current time frame, but supports custom time frames.
I'm releasing this script with an open visibility. Feel free to suggest improvements!
Enjoy,
s0ullight

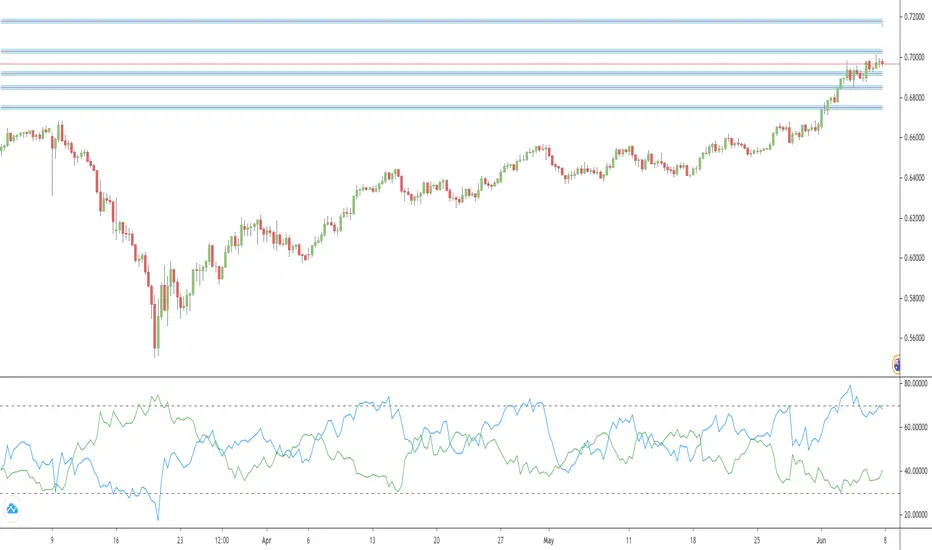
Currency Correlation indicator for the major currenciesThis Pine script creates a currency correlation graph with 6 correlations in a separate window below the main chart.
The indicator supports the following 8 currencies: AUD, CAD, CHF, EUR, GBP, JPY, NZD, USD
Correlations can be selected to be either related to the base or the counter currency (default is base). The length of the correlation can be chosen (default is 10).
Correlations are given for related currencies e.g. for all AUD pairs.
If Base currency is selected and e.g. AUDCAD is displayed in the main window, then the correlation window will compare AUDCAD to: AUDCHF, AUDEUR, AUDGBP, AUDJPY, AUDNZD, AUDUSD
If Counter currency is seleted and e.g. AUDCAD is displayed in the main window, then the correlation window will compare AUDCAD to: CHFCAD, EURCAD, GBPCAD, JPYCAD, NZDCAD, USDCAD
Many of the above currency pairs are not real pairs. But they are availabe in Pine script to enable e.g. correlation calculations.
The advantage is that e.g. the comparison between AUDCAD and EURAUD will give a positive correlation, if AUD is gaining in strenght and EUR and CAD are not changing in strenght.
Eventhough price is moving in the opposite direction the correlation is positive in the AUDCAD vs EURAUD example.

Currency Strength, displays lines for currency pair onlyThis currency strength indicator displays the strength for the displayed currency pair only.
The following currencies are supported: AUD, CAD, CHF, EUR, GBP, JPY, NZD, USD
Base currency is indicated by a blue line. Counter currency by a green line.
Double click on a line to open the settings window to change line colors or the possition of the dashed lines.
Covengers Ichimoku Cloud Easy 0.1
This is Covengers Ichimoku Cloud's EASY VERSION.
This is for you who don't know about Ichimoku,
to describe "Time tiktok & Price tiktok Trading".
☆Time tiktok & Price tiktok Trading☆
IF 1. DON'T CARE ABOUT LOWEST PRICE.
IF 2. DON'T CARD ABOUT HIGHER PRICE.
BUY IF 1. IS "CLOSE" BROKE THROUGH BASE LINE?
BUY IF 2. IS "CLOSE " SUPPORTED BY BASE LINE?
-> THEN BUY !
At this time, Base line should be STOP LOSS line.
SELL IF 1. IS "CLOSE" BROKE THROUGH BASE LINE?
SELL IF 2. IS "CLOSE" RESISTED BY BASE LINE?
SELL IF 3. IS "CLOSE" BROKE THROUGH ICHIMOKU CLOUD?
-> THEN SELL !
Buy conservatively, Sell aggressively.
"less LOSS" better than "much PROFIT"
-
Covengers Ichimoku Cloud의 EASY 버전입니다.
차트를 하나도 모르는 당신에게
임운자재를 설명하기 위해 만들었습니다.
☆임운자재 매매법☆
절대 조건 1. 바닥에는 관심을 두지 않는다.
절대 조건 2. 천장에는 관심을 두지 않는다.
매수 조건 1. 종가가 기준선을 돌파하였는가?
매수 조건 2. 종가가 기준선의 지지를 받는가?
-> 매수
이 때, 손절라인은 기준선이 된다.
매도 조건 1. 종가가 기준선을 돌파하였는가?
-> 매도
매도 조건 2. 종가가 기준선의 저항을 받는가?
-> 매도
매도 조건 3. 종가가 구름대를 돌파하였는가?
-> 매도
매수는 보수적으로, 매도는 공격적으로.
많이 따는 것보다, 잃지 않는 것이 중요하다.
Guerrilla AdvancedThis indicator was designed with people without Pro License in mind (Including many of my close friends).
Basically, you will get a combo of few different tools in one box, with ability to turn them on and off with a single check mark, also, you have total control over the input numbers that was used in calculations if you so want to, for example, sometimes when i see a massive bullish up trend, i reduce the short rally from 12 to 8 even 6 to get faster signal for selling the trend.
So, what will you get in this pack?
1- Ichimoko. Yes, you heard it right, although we have it in the default tools but hey, it will use one indicator slot and if you don't have a pro license, you will use that slot
2- Rally. This is an old yet very powerful system for getting buy or sell signals, basically, you get two lines and for making the life easier i draw a cloud between them. when the trend passes above the cloud and it was bellow it in past, right after the very first candle that gets above the cloud you can put the buy order, and vice versa, the moment a candle body enters the cloud, if you want an aggressive signal, you can sell, if not, you may want to wait to see if the candles drop bellow the cloud or not then decide.
3- Resistance Support Cloud. Most of us always heard about resistance and support "lines" but many of us don't know that, in each trend, the trend line itself is a resistance or support line, and when you are going in a bullish or bearish tunnel, the floor and roof of tunnels are again resistance and supports, using this part of the tool, just like rally, you get a cloud that shows you the resistance / support "zone"
4- William Fractals. To be honest, I got this part of the code from another source available around. Why? looking at those fractal indicators, you can easily eyeball the trend line or existence of a tunnel.
5- Different EMA lines. If you are one of those people that use EMA lines for their trading, have fun with them, there are few different standard ones and even a custom one that you can put your desired number for it.
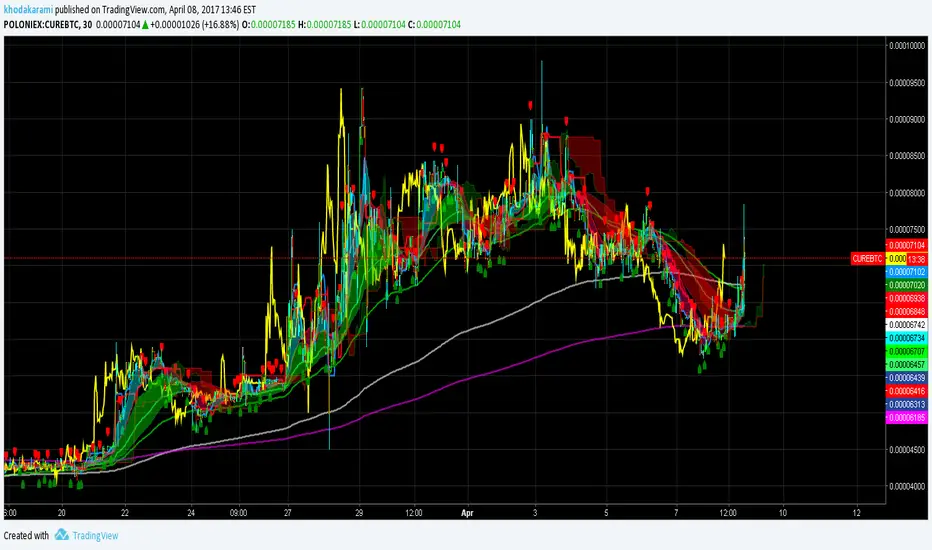
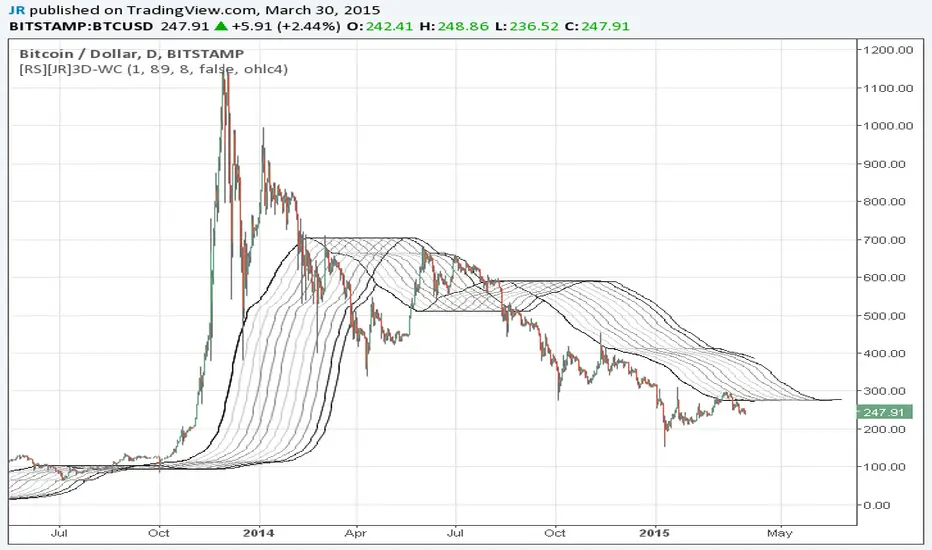
Wave Channel 3D Wave Channel 3D
Built by Ricardo idea from JR & Aloakdutt from indieTrades Jan. 2010
This indicator is very easy to build. We utilize Moving Averages with a set multiplier and an offset. Specially we try to use Fibonacci sequence series numbers (1, 2, 3, 5, 8, 13, 21, 34, 55, 89, 144...) as time space and multiplier (default 89, 8). Also included is Donchian Channel to locate strong trends and possible future support - resistance.
Examples of support/resistance on chart.
Dominant Price Trends
Future Support Resistance
Comparing Fibonacci Series Time Space - Multiplier
When Comparing make note of confluence support/resistance showing up with Fibonacci Series
Example uses DC
When Comparing make note of confluence support/resistance showing up with Fibonacci Series
Example without DC / Smooth MA