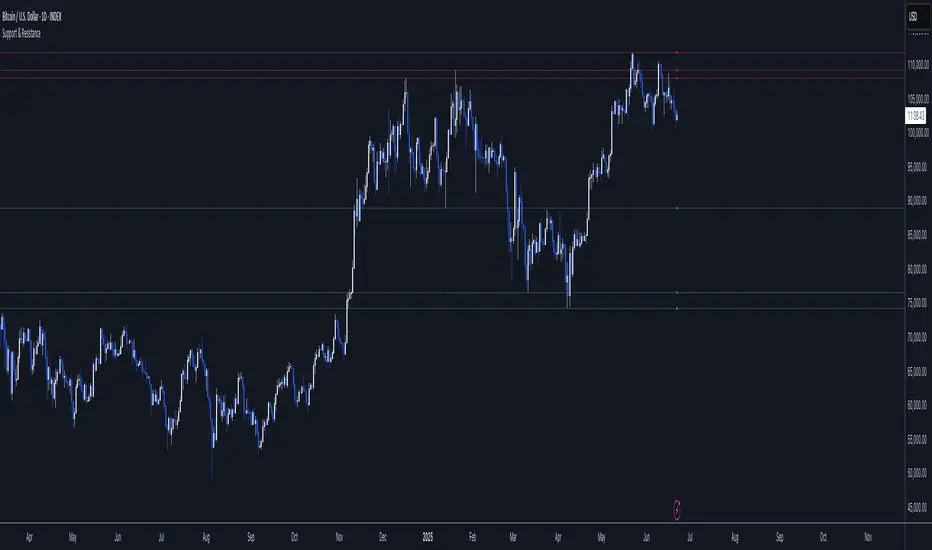
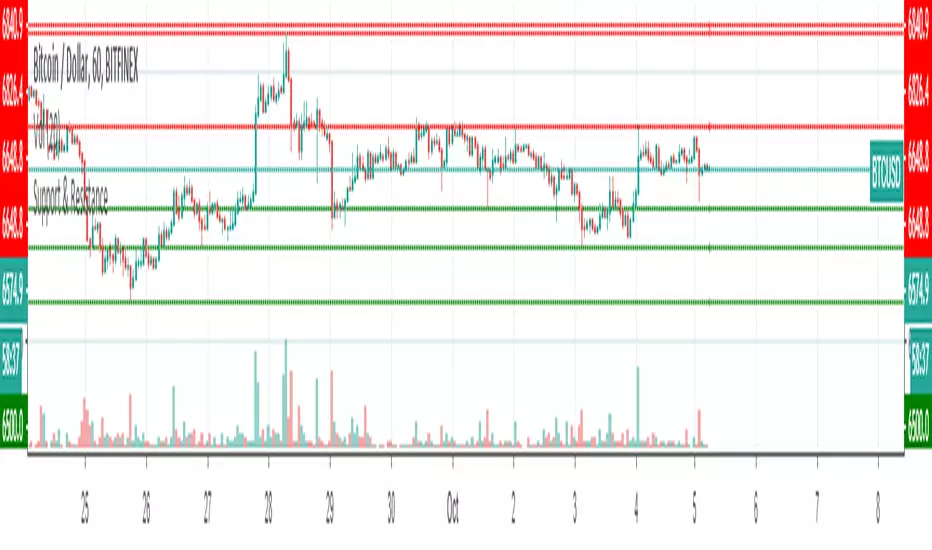
Support & ResistanceWhat is this script ?
Pivot points are tools used to identify potential support and resistance levels in trading. They are calculated using the previous period’s high, low, and close prices. This script leverages pivot points to plot up to four support levels and four resistance levels, helping traders visualize key price zones.
How to Use the Script?
Support and resistance levels represent price zones where significant liquidity often exists due to past price interactions. These levels are critical for traders to:
Assess Trend Continuation or Reversal: Prices may pause, reverse, or break through at these levels, signaling potential trend changes or continuations.
Manage Risk: Support and resistance levels are ideal for placing stop-loss orders or setting profit targets, as they indicate areas where price reactions are likely.
Plan Entries and Exits: Traders can buy near support levels, sell near resistance levels, or trade breakouts when prices move decisively beyond these zones.
"support" için komut dosyalarını ara
Support and Resistance Power Channel [ChartPrime]The Support and Resistance Power Channel indicator helps traders visualize key support and resistance zones, along with buy and sell power within those zones. By identifying the highest and lowest prices within a defined range, this indicator provides insight into potential price reversals and market strength. It calculates the strength of buy and sell pressure within the zones and includes additional features like midline values and delayed signals to reduce false breakouts.
⯁ KEY FEATURES AND HOW TO USE
⯌ Support and Resistance Zones :
This indicator identifies dynamic support (lower zone) and resistance (upper zone) levels, allowing traders to easily visualize key price levels. These zones are customizable with settings for the length of the channel and how far the zones extend into the future. The zones can be used to predict areas of potential price reversal or consolidation.
⯌ Buy and Sell Power :
Within the upper resistance zone, the indicator calculates Sell Power based on the number of bearish candles, while the lower support zone calculates Buy Power based on bullish candles. This feature helps traders understand the strength of buying or selling activity within each zone.
Example of buy and sell power tracking:
⯌ Highest, Lowest, and Mid Price Levels :
The indicator marks the highest and lowest price levels within the channel with an "X," and displays these values at the end of the channel. Additionally, the midline (average of the high and low) is plotted with a dotted line, showing a key area that the price often retests during trends.
⯌ Delayed Signal Markers :
To prevent false breakouts, the indicator includes a 2-bar delay for signals. These signals are plotted when the price crosses above or below the resistance or support zones, confirming potential reversals or breakouts. Arrows or diamonds are used to mark these signals on the chart.
Example of delayed breakout signals on the chart:
⯌ Extend Zones into the Future :
In the settings, traders can extend the support and resistance zones further into the future, allowing for ongoing analysis even after the initial levels have been identified. This feature can help with forward-looking trade planning.
⯁ USER INPUTS
Length : Defines the number of bars used to calculate the support and resistance zones.
Extend : Sets how far the support and resistance zones should be extended into the future.
Top and Bottom Colors : Allows customization of the colors for the support and resistance zones.
⯁ CONCLUSION
The Support and Resistance Power Channel indicator provides a powerful and visually intuitive way to track key market levels, buy and sell pressure, and potential reversals. With its real-time zone plotting and the calculation of power within each zone, it offers traders essential insights for making more informed trading decisions.

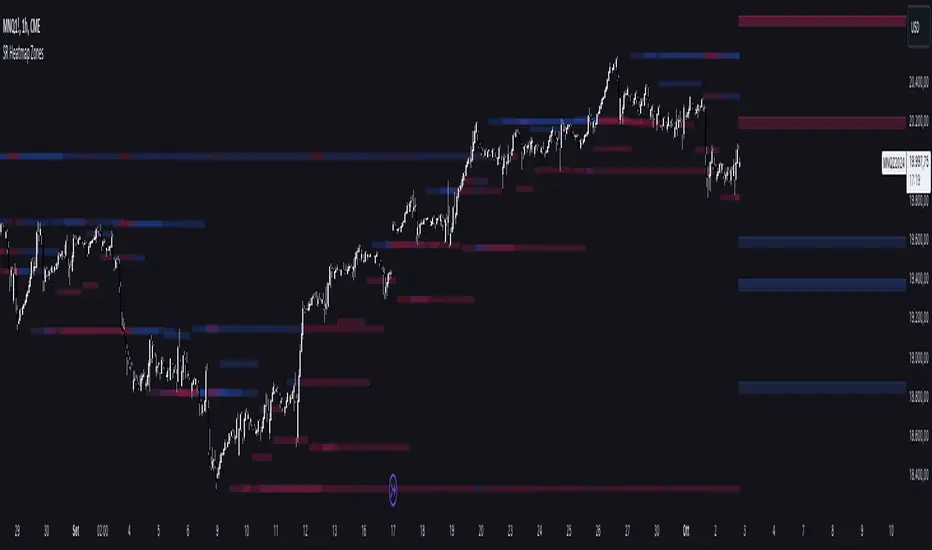
Support and Resistance HeatmapThe "Support and Resistance Heatmap" indicator is designed to identify key support and resistance levels in the price action by using pivots and ATR (Average True Range) to define the sensitivity of zone detection. The zones are plotted as horizontal lines on the chart, representing areas where the price has shown significant interaction. The indicator features a customizable heatmap to visualize the intensity of these zones, making it a powerful tool for technical analysis.
Features:
Dynamic Support and Resistance Zones:
Identifies potential support and resistance areas based on price pivots.
Zones are defined by ATR-based thresholds, making them adaptive to market volatility.
Customization Options:
Heatmap Visualization: Toggle the heatmap on/off to view the strength of each zone.
Sensitivity Control: Modify the zone sensitivity with the ATR Multiplier to increase or decrease zone detection precision.
Confirmations: Set how many touches a level needs before it is confirmed as a zone.
Extended Zone Visualization:
Option to extend the zones for better long-term visibility.
Ability to limit the number of zones displayed to avoid clutter on the chart.
Color-Coded Zones:
Color-coded zones help differentiate between bullish (support) and bearish (resistance) levels, providing visual clarity for traders.
Heatmap Integration:
Gradient-based color changes on levels show the intensity of touches, helping traders understand which zones are more reliable.
Inputs and Settings:
1. Settings Group:
Length:
Determines the number of bars used for the pivot lookback. This directly affects how frequently new zones are formed.
Sensitivity:
Controls the sensitivity of the zone calculation using ATR (Average True Range). A higher value will result in fewer, larger zones, while a lower value increases the number of detected zones.
Confirmations:
Sets the number of price touches needed before a level is confirmed as a support/resistance zone. Lower values will result in more zones.
2. Visual Group:
Extend Zones:
Option to extend the support and resistance lines across the chart for better visibility over time.
Max Zones to Display (maxZonesToShow):
Limits the maximum number of zones shown on the chart to avoid clutter.
3. Heatmap Group:
Show Heatmap:
Toggle the heatmap display on/off. When enabled, the script visualizes the strength of the zones using color intensity.
Core Logic:
Pivot Calculation:
The script identifies support and resistance zones by using the pivotHigh and pivotLow functions. These pivots are calculated using a lookback period, which defines the number of candles to the left and right of the pivot point.
ATR-Based Threshold:
ATR (Average True Range) is used to create dynamic zones based on volatility. The ATR acts as a buffer around the identified pivot points, creating zones that are more flexible and adaptable to market conditions.
Merging Zones:
If two zones are close to each other (within a certain threshold), they are merged into a single zone. This reduces overlapping zones and gives a cleaner visual representation of significant price levels.
Confirmation Mechanism:
Each time the price touches a zone, the confirmation counter for that zone increases. The more confirmations a zone has, the more reliable it is. Zones are only displayed if they meet the required number of confirmations as specified by the user.
Color Gradient:
Zones are color-coded based on the number of confirmations. A gradient is used to visually represent the strength of each zone, with stronger zones being more vividly colored.
Heatmap Visualization:
When the heatmap is enabled, the color intensity of the zones is adjusted based on the proximity of the price to the zone and the number of touches the zone has received. This helps traders quickly identify which zones are more critical.
How to Use:
Identifying Support and Resistance Zones:
After adding the indicator to your chart, you will see horizontal lines representing key support (bullish) and resistance (bearish) levels. These zones are dynamically updated based on price action and pivots.
Adjusting Zone Sensitivity:
Use the "ATR Multiplier" to fine-tune how sensitive the indicator is to price fluctuations. A higher multiplier will reduce the number of zones, focusing on more significant levels.
Using Confirmations:
The more times a price interacts with a zone, the stronger that zone becomes. Use the "Confirmations" input to filter out weaker zones. This ensures that only zones with enough interaction (touches) are plotted.
Activating the Heatmap:
Enabling the heatmap will provide a color-coded visual representation of the strength of the zones. Zones with more price interactions will appear more vividly, helping you focus on the most significant areas.
Best Practices:
Combine with Other Indicators:
This support and resistance indicator works well when combined with other technical analysis tools, such as oscillators (e.g., RSI, MACD) or moving averages, for better trade confirmations.
Adjust Sensitivity Based on Market Conditions:
In volatile markets, you may want to increase the ATR multiplier to focus on more significant support and resistance zones. In calmer markets, decreasing the multiplier can help you spot smaller, but relevant, levels.
Use in Different Time Frames:
This indicator can be used effectively across different time frames, from intraday charts (e.g., 1-minute or 5-minute charts) to longer-term analysis on daily or weekly charts.
Look for Confluences:
Zones that overlap with other indicators, such as Fibonacci retracements or key moving averages, tend to be more reliable. Use the zones in conjunction with other forms of analysis to increase your confidence in trade setups.
Limitations and Considerations:
False Breakouts:
In highly volatile markets, there may be false breakouts where the price briefly moves through a zone without a sustained trend. Consider combining this indicator with momentum-based tools to avoid false signals.
Sensitivity to ATR Settings:
The ATR multiplier is a key component of this indicator. Adjusting it too high or too low may result in too few or too many zones, respectively. It is important to fine-tune this setting based on your specific trading style and market conditions.
Support Resistance Zones using confluence & Std. DeviationOverview:
This indicator takes (interactive) input from the user for support and resistance levels and plots important zones considering the other confluence levels in the indicator.
Working of indicator:
This indicator takes six input of Support/resistance level form the user
It has following 32 confluence levels
a.4 Recent positive Divergence levels (DN1, DN2, DN3, DN4)
b.4 recent negative divergence levels (DP1, DP2, DP3, DP4)
d.5 Fibonacci levels (Fib0, Fib236, Fib5, Fib618, Fib786)
e. 7 Pivot levels (P, PR1, PR2, PR3, PS1, PS2, PS3)
f.4 EMAs (E20, E200, E100, E50)
g. ATH, ATL, Weekly High, Weekly Low, two days ago high, two days ago low, previous day high , previous day low
The code checks nearest ‘n’ CONFLUENCE for each level (“Number of confluences to check”) in the indicator, after getting the nearest confluence it calculates the standard deviation of those levels WITH RESPECT TO THE MANUAL INPUT LEVELS.
If the Std. Deviation is less than the input value (“Minimum standard deviation” option) then the zone is displayed on the chart.
How to use:
Add the indicator on the chart select your important support and resistance levels.
Set standard deviation, if the confluence is less than the input standard deviation then you will see those zones on the chart.
You can display all divergence levels; you can display all fib levels. All confluences can be displayed by using the setting of the indicator
How to read the indicator values:
The zone will show all the confluence it has in its zone,
Example:
Table details:
The table shows the maximum and minimum deviation out of all six levels .To see at least one zone you have to make sure that Input value Std. Deviation must be greater than Min Std. Deviation of the table
Sources & refences :
Big thank to www.pinecoders.com and kodify.net
Standard deviation :
www.investopedia.com
function to find 'k' closest elements :
www.techiedelight.com
Interactive support resistance :
Divergence for many indicators:
Auto fib level by DGT:
www.tradingview.com

Support and Resistance Multi Time frameSimple indicator showing the support and resistance on Daily, Weekly and Monthly time frames no matter what time frame you're currently on by highlighting the highest and lowest points on each over the last 34 bars.
Daily support and resistance are coloured green.
support and resistance are coloured yellow.
Monthly support and resistance are coloured red.
For best results check where multiple support and resistance areas line up and combine with another indicator for example oscillators to gauge if the support or resistance will reverse the market.

Support Resistance - DynamicThis is Dynamic Support / Resistance script.
How it Works?
It finds Pivot Points and creates channels for each Pivot Point. Channel size is calculated by (Highest - Lowest) * %Channel_size in Loopback Period. After creating channels it calculates that how many Pivot Points in the channels. more Pivot Points in channel means stronger Support/Resistance. in the option menu there is S/R Strength, this is the minimum number of Pivot Points that each channel must contain to be S/R. calculation starts from last pivot point and go back for "loopback period" which is 300 by default. so last Pivot Points have more priority. Finally after calculating Support/Resistance it draws lines.
Number of Support/Resistance line is Dynamic and up to 20 lines, that means number of lines changes dynamically. you can see how the script puts Suppport/Resistance lines dynamically by "Replay" button. (if I have time I will try to put a video)
Currently the scripts checks up to 40 pivot points in loopback period. it shows up to 20 S/Rs only for visible area in the chart.
There is option to Show S/R lines as Solid, Dotted or Dashed.
Enjoy!

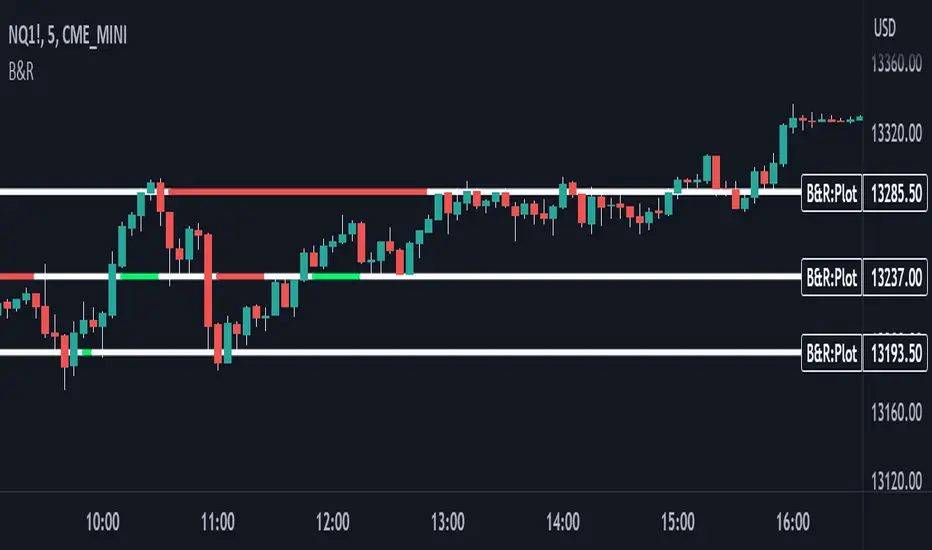
Support & Resistance With Breakout & RetestIntro
The Breakout Retest Indicator is a valuable tool utilized to confirm the occurrence of a proper breakout so you know when to enter on a retest. It analyses the price movement of an asset and identifies a breakout when the price level surpasses the inputted support and resistance values.
Conditions
The indicator operates based on simple yet reliable conditions. Once a candle closes above or below the specified line, the next candle's closure above or below without touching the high or low levels confirms the breakout. The indicator subsequently changes its color, signaling a long or short position. Upon retesting, it reverts to its original color.
Need Your Help
I am sharing this indicator to solicit your input in improving it. As a committed developer, I have ambitious plans for enhancing the indicator's functionality. To that end, I welcome your suggestions and ideas to build indicators that can contribute to the success of people's strategies.
Future Ideas
Some of the potential improvements that I plan to incorporate include the implementation of zones. Users will be able to define zones that require breaking above or below for a confirmed breakout. Additionally, a volume check will provide additional confirmation by evaluating the volume level relative to the breakout. Lastly, close above or below feature will ensure that a certain number of ticks, percentage, or price level has been breached to confirm the breakout.
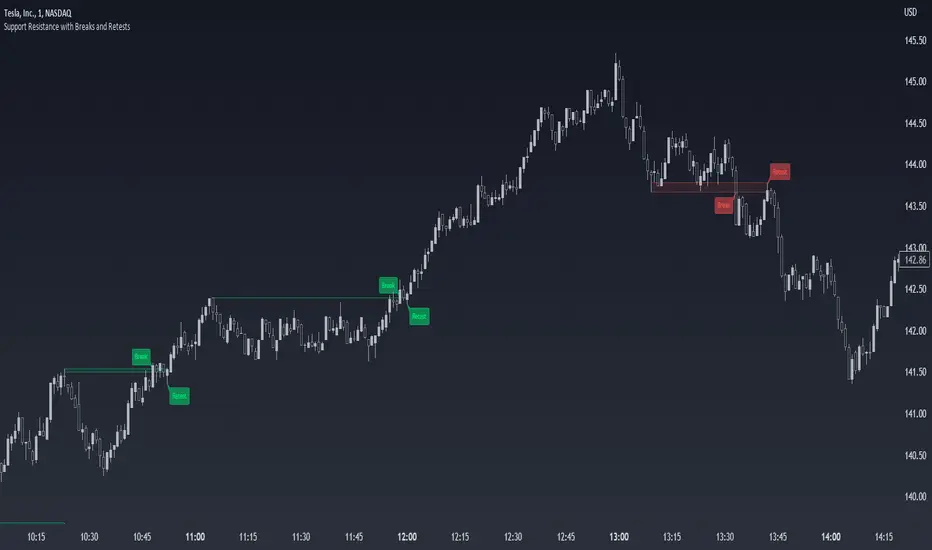
Support Resistance with Breaks and RetestsThe Break and Retest indicator strives to provide a visual aid for spotting areas of continuation and pullbacks. Support and resistance levels are drawn out automatically and have sequential conditions in place to determine a breakout following an eventual retest. Additionally, there are methods in place that try and detect liquidation events and still output a retest.
Although there are options to adjust repaint settings, "potential labels" are structured in a way to detect live ongoing retest events and therefore will be the only thing in the script that will be forced to repaint.
🔳 Settings
Lookback Range: Lookback period to trigger a new support/resistance level when pivot conditions are met.
Bars Since Breakout: How many bars since breakout in order to detect a retest.
Retest Detection Limiter: Whenever a potential retest is detected, the indicator knows that a retest is about to happen. In that given situation, this input grants the ability to raise the limit on how many bars are allowed to be actively checked while a potential retest event is active. For example, if you see the potential retest label, how many bars do you want that potential retest label to be active for to eventually confirm a retest?
🔳 Repaint Options
By default, the break and retest system uses the current close value to determine a condition. (Repaints by default)
On: Allows repainting
Off - Bar Confirmation: Prevents repainting and generates alerts when the bar closes. (1 candle later)
Off - High & Low: Prevents repainting, but in return utilizes both the high and low values instead of the close which may yield a higher outcome and inaccurate results.
🔳 How it works
In the background, calculations aren't searching for the perfect retest within the zone but instead focuses its attention towards price fluctuation around the zones. This allows the indicator to yield more results than it would otherwise.
The chart below provides an example of how potential retests are established. These are updated constantly until a retest is confirmed, and deleted if not. If a potential retest is active and the next candle drops below the value when the potential retest was detected, a retest is placed..
🔳 Alerts
Support and Resistance by CainKellyeCheck out my automatic support and resistance indicator that uses the EMA of price change * relative volume as the bases of pivot search.
It also tells the strength of the support and resistance lines calculated using a 4 times quicker EMA and using its distance from the slower one.
The strongest plotted line has the maximum opacity and the weakest has the minimum opacity inside the given range.
This calculation results in an organic detection of the support and resistance prices.
You can set the distance range in percentage you want to have lines calculated around the current price.
You can set the lines gravity distance inside which they are snapped together: the stronger line pulls the weaker to it by using strength weighted average for the new price value.
You can increase the minimum opacity value in case you only see few lines (but the maximum is 15)
You can change the used price for the lines to Close or High/Low but recommended is to use the average of those two (default)
The distances multiplier helps to get a birds eye view easily when using 4H (or higher) chart and a separate one to use on Daily / Weekly / Monthly for even broader view.
Lines and labels are drawn near the candles so you are still able to zoom in.
Labels are not drawn when their line is barely visible (transparency >= 80)
This indicator has been refined on the 15 minute and 1 hour charts of BTC and other cryptos but it works well in smaller volatility markets as well if the distances are adjusted accordingly.

Support and ResistanceThis indicator shows three types of support and resistance lines: Horizontal, Parallel (using linear regression) and Fibonacci Retracement. Lines can be adjusted or turned on and off in settings. A great tool for setting up entries, exits and locating pivot points.

Support & Resistance LevelsPlots support and resistance levels based on occurrence of fractals.
Line width indicates historical significance of the level.
Decreasing the proximity multiplier input increases the sensitivity/ increases the frequency of level changes.
If price closes above a resistance level, the level becomes a support level and its color on the chart changes to green (& vice-versa).

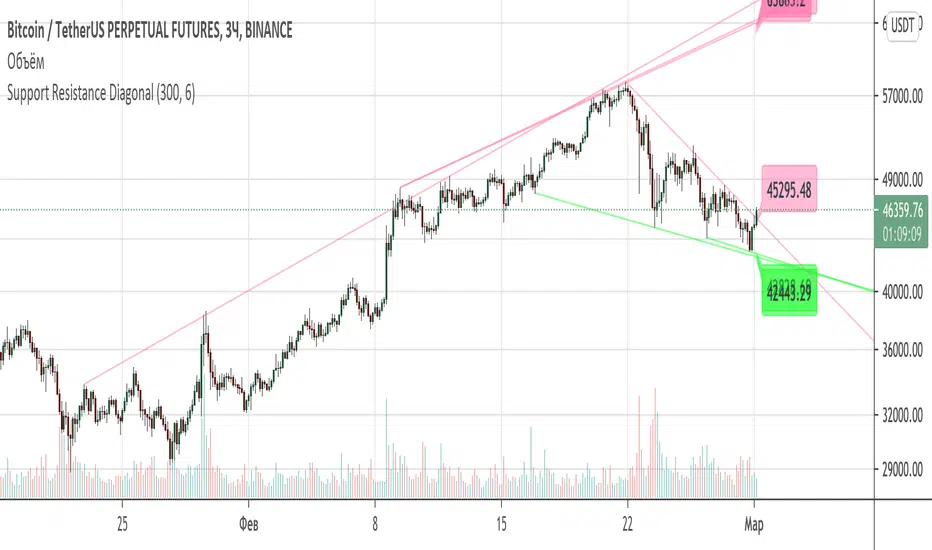
Support Resistance DiagonalClassic diagonal support and resistance based on pivot points. As a result, they form triangles, wedges, channels and other patterns. Realtime update up to 1 second chart.
Support/Resistance (Rupprecht)Set the maximum data points to look back for a support resistance line, then set the pivot point threshold and your off to the races.
Very effective solution to have your support resistance points automatically show up on your chart. A good tip is to include 2 or 3 of this indicator on your chart with varying levels of degree for support and resistance categorized by color.
Best of luck :)

Support and Resistance lines - version 2I created a new version of the Support and Resistance lines script. Compared to the original script this version
1. works with a lot more currency pairs
2. SR line width can be set in the indicator settings window
3. the vertical lines, arrows and the SR lines can be turned off in the indicator settings window
4. the indicator settings window can be opened by clicking on a star symbol that is placed in the upper right corner of the graph window

Support/Resistance Zones x3Support and Resistance Levels + Zones for 3 time frames, based on volume at fractal levels with Zones based on wick size which is a true reflection of a Zone when compared to other S/R Zone scripts which only use a thick line not based on anything.
Original script is thanks to synapticex I have just migrated to version 3, heavily modified it and added Support and Resistance Zones.


Support & ResistanceThis indicator detects large swings/pivots in historical price action to highlight tops and bottoms which might act as future levels of support or resistance. The code by default detects the last 3 significant swing highs and the last 3 swing lows. It then places lines on the chart to highlight those levels.
For a full overview of the indicator and code commentary visit the backtest-rookies (.com) website.
Example
[RS]Support and Resistance V0Support and Resistance using donchian channels to validate tops/bottoms
(note: while donchians follow price closely within look back window, this will only update new top/bottom when making new extremes in the donchian channel)
combo with other systems:

Quaterly & Monthly & Weekly & Daily Support&Resistance [LM]Hello traders,
I would like to introduce you Quaterly & Monthly & Weekly & Daily Support&Resistance study. The idea behind it is to look for natural S/R levels based on high/low of higher time and looking for ranges. Script has 4 different high&lows levels that you can configure at your will what is shon and how.
You can combine various timeframe ranges to look for bounces
I hope you will enjoy it.

BIN Based Support and Resistance [SS]This indicator presents a version of an alternative way to determine support and resistance, using a method called "Bins".
Bins provide for a flexible and interesting way to determine support and resistance levels.
First off, let's discuss BINS:
Bins are ranges or containers into which your data points can be sorted. For example, if you're grouping ages, you might have bins like 0–18, 19–35, 36–50, and 51+. Any data point within these intervals gets placed in the corresponding bin.
Binning simplifies complex data sets by grouping values into categories. This is useful for such things as
Visualizing data in histograms or bar charts.
Reducing noise and highlighting trends.
This indicator groups the price action into 10 separate bins. It determines the Support / Resistance level by averaging the values in the Bins to find an iteration of the "central tendency" or average reoccurring value.
Pros and Cons
Since this is a different approach to support and resistance, I think its important to highlight some of the pros and advantages, but also be open about the cons.
First off the PROS
Bin Based Support and Resistance Levels dynamically adjust to ranges as opposed to hard / fast peaks and valleys. This makes them better at analyzing price action vs simply drawing lines at random peaks and valleys.
Because Bins are analyzing ALL PA within a period's max and min range, Bin Support and Resistance can actually be used similar to Volume profile, where you are able to identify a pseudo-POC, or areas where price tends to consolidate. Take a look at this example on SPY:
You can see these 2 SR lines are close together. This represents that this general price range is an area where price likes to accumulate/consolidate. You can see the SPY ended up coming back to this range and consolidating there for a bit.
This is a strength of using a BIN based approach to calculating support and resistance, because as indicated before, it looks at price action vs peaks and valleys.
As a tip, these areas are areas you want to wait for a break in one direction or the other.
The indicator provides for backtest results of the support and resistance lines, to see how many times certain areas acted as resistance or support. Because this is analyzing and distributing PA evenly throughout the period's max and min, the indicator can tell you which areas tend to have higher rejection zones and which have higher support zones.
Now the CONS
Because bin based SR take an average approach, the SR lines can sometimes be slightly broken before the ticker finds rejection:
To combat this, make sure there is confirmed support. How the indicator actually backtests these lines is by waiting to see if the ticker has 3 consecutive closes above the support line or below the resistance line. So these are things to be mindful of.
It doesn't consider pivots. Most support and resistance indicators either identify max and min peaks and valleys or use pivot points. Pivot points are a great way to identify peaks and valleys and thus by extension support and resistance. However, this is also somewhat of a strength, as using BINS forces the indicator to consider ALL price action and not just the extremes (highs and lows).
Can be slightly skewed in highly volatile environments. Any time there is a massive drop or rally, it can skew the indicator to give extreme ranges to both ends. For example, the Tariff news collapse on ES1!:
Owning to limitations in lookback length, sometimes the min and max range can be exceeded and other traditional areas of support / resistance is where a ticker will find support.
Using the indicator
Here are some basic use/functionalities of the indicator:
Selecting display of backtest results: You can select to have the backtest results shown in a table:
Or directly on the lines:
Inversely, you can toggle them off completely:
You can modify the lookback length. The suggested lookback length is between 250 to 500 candles on smaller timeframes. I also suggest 252 on daily timeframes (which represents 1 trading year).
And that's the indicator!
It is very easy to use, so you should pick it up in no time!
Enjoy and as always, 🚀🚀 safe trades! 🚀🚀
