Static OHLC Static OHLC,
This can be applied out of market hours to have static lines on OHLC,
This can act as strong support and resistance regions
"support" için komut dosyalarını ara
Malama's KAYCAP Pre-Market Box# Pre-Market Single Candle Range Box
## What Makes This Script Original
While many scripts plot entire pre-market session ranges, this indicator focuses specifically on **a single user-defined candle** within the pre-market period rather than the entire session. This targeted approach allows traders to isolate the most relevant price action from a specific time (default: 4:00 AM EST) that often establishes key levels for the trading day.
## Core Methodology & Technical Implementation
**Single Candle Isolation:**
- Captures OHLC data from one specific minute within pre-market hours (user configurable)
- Differentiates between the candle's body (open/close range) and wicks (high/low extremes)
- Creates four distinct reference levels instead of traditional session high/low boxes
**Dual Box Structure:**
- **Inner Box (Body):** Plots the range between open and close prices of the target candle
- **Outer Boundaries:** Separately plots the high and low of that same candle
- **Visual Differentiation:** Uses different colors and line weights to distinguish body vs. wick levels
**Time-Specific Logic:**
The script uses precise time matching (`hour == boxHour and minute == boxMinute`) to capture data from exactly one candle, rather than aggregating an entire session. This creates four specific price levels:
- Box Top: Higher of open/close (body boundary)
- Box Bottom: Lower of open/close (body boundary)
- Box High: Candle high (wick extreme)
- Box Low: Candle low (wick extreme)
## Why This Approach Differs from Standard Session Boxes
**vs. Full Session Ranges:** Focuses on a single critical minute rather than entire pre-market period
**vs. Traditional S/R:** Creates both body and wick levels from one specific candle
**vs. Opening Range:** Uses pre-market data rather than regular session opening minutes
## Practical Application
The 4:00 AM EST default targets a time when institutional pre-market activity often establishes initial sentiment and key levels. By isolating this specific candle's range:
- **Body levels** often act as initial support/resistance during regular hours
- **Wick extremes** provide broader range boundaries for breakout analysis
- **Precise timing** allows focus on the most statistically relevant pre-market moment
## Technical Considerations
- Requires intraday timeframes (1-minute recommended) to capture specific candle data
- Time settings should match your broker's timezone for accurate candle selection
- Works best on liquid instruments where pre-market activity is meaningful
- The selected candle must exist in your data feed for the levels to plot
## Customization Options
All timing parameters are adjustable:
- Target candle hour and minute
- Pre-market session definition (for context)
- Visual styling for all four level types
This focused approach provides more granular analysis than broad session ranges while maintaining simplicity in execution.

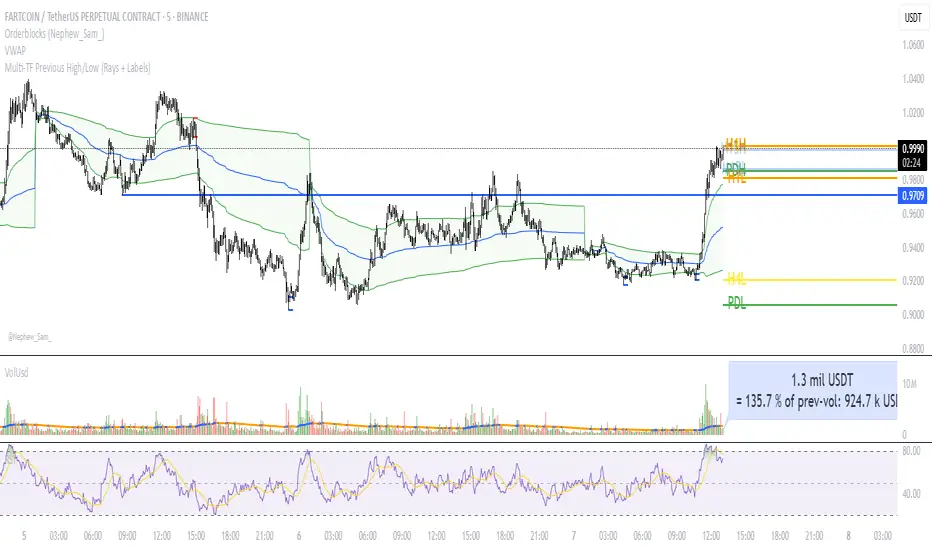
Multi‑TF Previous High/Low (Rays + Labels)Use this indicator if you want to automate Support and Resistance levels.
Previous Day High and Low - Green Lines
Previous 4 Hour High and Low - Yellow Lines
Previous 1 Hour High and Low - Orange Lines
Previous 15 Minute High and Low - Light Blue Lines
Follow me on X-
ADHDTRDR
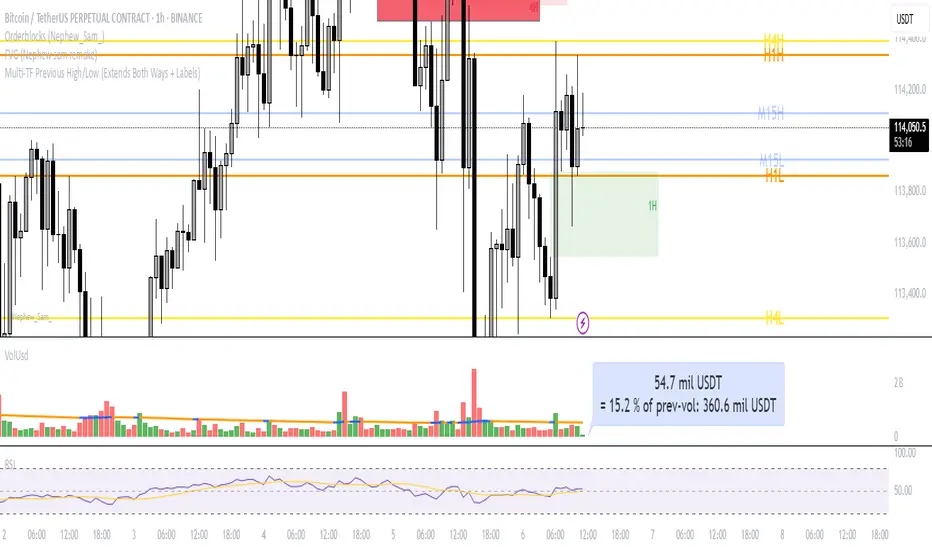
Multi‑TF Previous High/Low (Extends Both Ways + Labels)Use this indicator if you want to automate Support and Resistance levels.
Previous Day High and Low - Green Lines
Previous 4 Hour High and Low - Yellow Lines
Previous 1 Hour High and Low - Orange Lines
Previous 15 Minute High and Low - Light Blue Lines
Follow me on X-
@ADHDTRDR
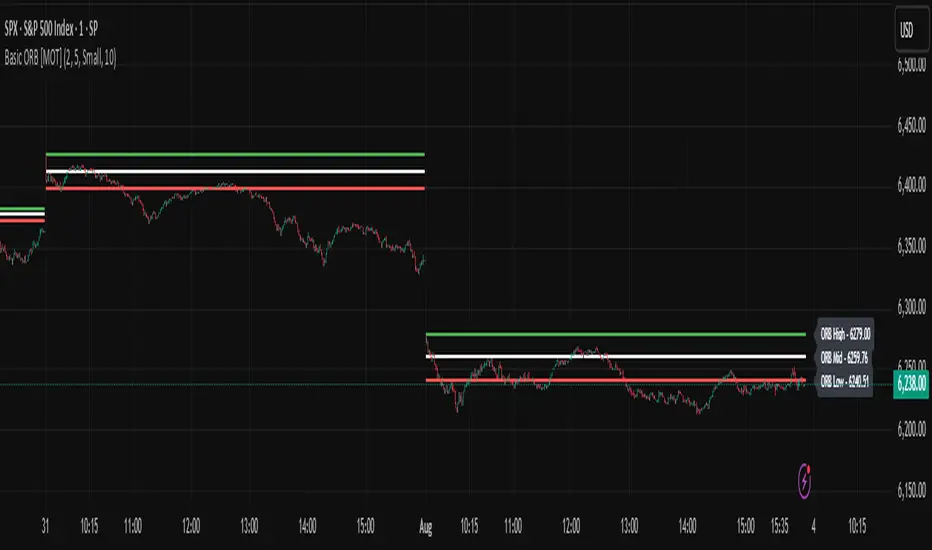
Basic ORB [MOT]Basic ORB – Opening Range Breakout Tool
The Basic ORB is a visual tool designed to assist intraday traders by identifying the opening range from 9:30–9:45 AM ET. It automatically plots the high, low, and midpoint of this range to help traders analyze potential areas of interest.
This script provides a simple and customizable way to frame market structure during the early trading session. It is intended to support various intraday strategies across multiple asset classes including futures, stocks, ETFs, indexes, and crypto.
🔹 Key Features
1. Opening Range Levels
- Automatically plots the High, Low, and Midline of the 9:30–9:45 AM ET session.
- Midline helps visualize the midpoint of the range.
- Customizable colors and line thickness.
2. Previous ORB Ranges
- Option to display previous days’ ORB levels for visual pattern recognition.
- Useful for spotting recurring reactions to prior day levels.
3. Dynamic Price Labels
- Adds price labels to each ORB line for quick reference.
- Fully customizable: adjust text size, background color, label position, and offset.
4. Clean Settings Panel
- Customize all visual elements to match your charting style.
- Control how many previous ORBs to display.
- Toggle features on or off for a simplified interface.
🧠 How to Use
- Best viewed on 1m, 5m, or 15m charts.
- Combine with your existing entry/exit criteria to monitor how price interacts with the opening range.
- Common use cases include breakout confirmation, rejection trades, and support/resistance analysis based on prior ORBs.
⚠️ Disclaimer
This script is for educational and informational purposes only. It does not constitute financial advice. Trading carries risk, and users should test any tools in a demo environment before live use. Always implement proper risk management.
Strategic LevelsIntroduction
The Strategic Levels indicator plots key high and low price levels for monthly, weekly, daily, and Monday (current week) timeframes. It draws horizontal lines with consolidated labels to highlight significant support and resistance zones.
How to use it ?
Identify critical price levels for trade entries, exits, and risk management.
These prices levels (monthly, weekly, daily open/close) are significant inflection points during short term price movements.
Perfect for swing traders, day traders, or anyone using support/resistance strategies.
Best used for trades lasting no more than a few days.

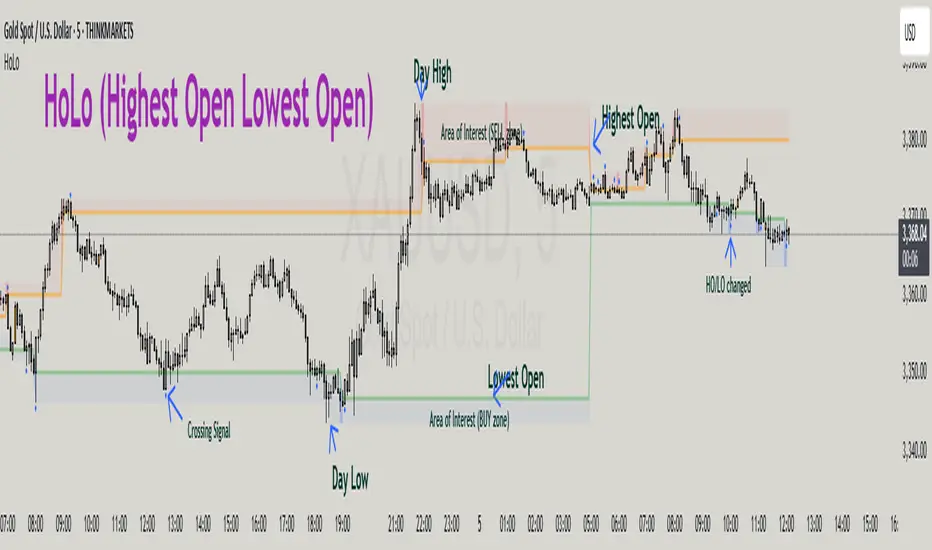
HoLo (Highest Open Lowest Open)HoLo (Highest Open Lowest Open) Method
Overview
HoLo stands for "Highest Open Lowest Open" – a forex trading strategy.
Core Concept
Definition of HoLo:
Highest Open (HO): The highest opening price among all H1 candles of the current trading day
Lowest Open (LO): The lowest opening price among all H1 candles of the current trading day
Trading Day: Starts at Asia Open Session
Strategy Setup
Step 1: Mark Key Levels
Current day's High/Low
Highest Open and Lowest Open (from H1 candles)
Step 2: Define the Area of Interest
Sell Zone: Between the Highest Open and the current day's High
Buy Zone: Between the Lowest Open and the current day's Low
Trade Entry Rules
Sell Trade:
Price goes above the Highest Open
Trigger candle (M5, M15, or M30) closes above the Highest Open
Enter a sell when price revisits the Highest Open level (Sell Stop Order)
Buy Trade:
Price drops below the Lowest Open
Trigger candle closes below the Lowest Open
Enter a buy when price revisits the Lowest Open level (Buy Stop Order)
Trigger Timeframe:
Choose M1, M5, or M15 based on:
Your screen time availability
Personal trading style
Risk and Profit Management
Stop Loss:
For sell: Set SL at the day’s High + spread
For buy: Set SL at the day’s Low + spread
Take Profit (TP) Basic Rule:
You should open 2 positions:
When profit reaches 1R: Take partial profit + move SL to BE (Break Even)
Let the remaining position run using partial TP or trailing stop
Money Management:
Never risk more than 1% per trade
Recommended: 0.5% risk due to multiple opportunities daily
Prioritize major pairs.
The Indicator
How to read data
For Day Traders
Monitor the sell zone (red area) for potential short entries near resistance
Watch the buy zone (blue area) for potential long entries near support
Use cross signals for entry/exit points
Pay attention to timing markers for key market hours
Alert
HO (Highest Open) level changes
LO (Lowest Close) level changes
Price crossing key levels
Timing notifications
IPDA with Order Blocks [Enhanced]Summary of the Code
This script plots IPDA Standard Deviations on a price chart, helping traders visualize potential support and resistance levels based on a series of user-defined deviations. It uses swing high/low points and time-based fractal lookbacks (monthly, weekly, daily, or intraday) to define price anchors and compute deviation lines.
Key features include:
Deviations: It calculates and plots deviation levels based on the distance between swing highs and lows, which traders can use as price targets or zones of interest.
Timeframes:
Monthly (higher timeframe analysis)
Weekly (medium-term analysis)
Daily and Intraday (shorter-term precision)
Customization:
Choose which deviation levels (e.g., 0, 1, -1, -2) to display.
Hide labels or adjust their sizes for cleaner charts.
Option to remove invalidated deviation levels dynamically.
Visual Cleanliness: Automatically removes clutter by hiding or deleting invalid deviation levels and focusing on active price zones.
How to Utilize It for Intraday Trading to Make $1,000
Here’s how to effectively use the indicator to optimize intraday trading:
1. Set the Right Timeframe:
Use the 15-minute or 1-hour chart for intraday setups.
Ensure the "Intraday" lookback option is enabled to focus on shorter-term swings.
2. Interpret the Levels:
Bearish Order Blocks: Look for red lines (bearish deviation) as potential resistance zones where the price may reverse downward.
Bullish Order Blocks: Look for green lines (bullish deviation) as potential support zones where the price may bounce upward.
3. Plan Entries and Exits:
Entry: Buy near a green order block or short near a red order block, confirming the trade with additional signals (e.g., candlestick patterns, momentum indicators).
Stop Loss: Place your stop below the green line (for buys) or above the red line (for shorts).
Profit Targets: Use deviation levels as targets (e.g., from the 0 level to +1 or -1).
4. Combine with Market Context:
Use the script alongside volume profile, trend indicators, or news events for confirmation.
Avoid trading during major news events unless aligned with deviations.
5. Position Sizing for $1,000 Goal:
Trade liquid instruments like Nasdaq futures (NQ) or major forex pairs.
Risk 1-2% of your capital on each trade and scale into positions if confirmed.
Target a profit of 10-20 points per trade on Nasdaq futures, with 1-2 trades daily.
6. Monitor Key Timeframes:
Pre-market (before 9:30 AM EST): Mark deviation levels to predict market open behavior.
Midday & Power Hour (3-4 PM EST): Watch for breakouts or retests around key deviation levels.
By combining this tool with disciplined risk management and a clear trading plan, you can systematically work toward your profit target while minimizing unnecessary risks

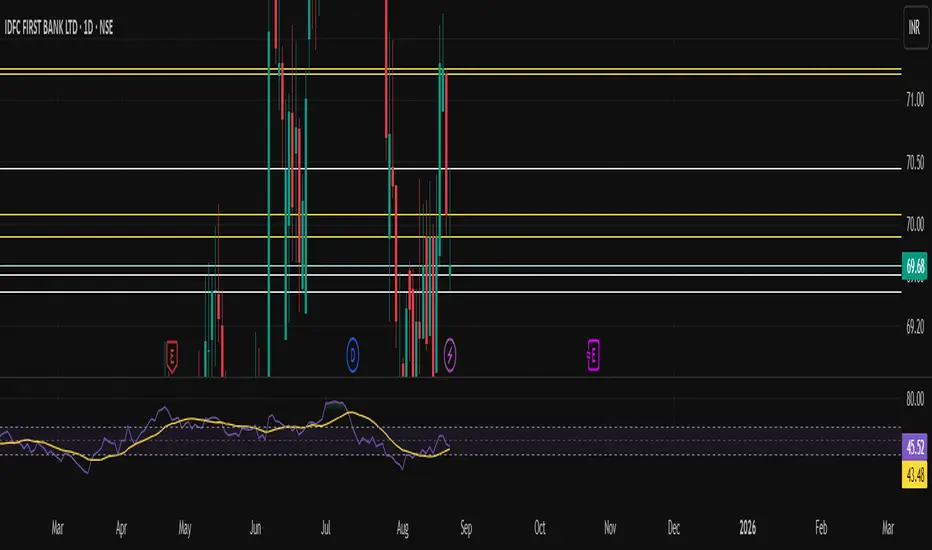
RSI Horizontal resistance levelsRSI Horizontal Resistance Levels
Purpose
This study automatically draws horizontal price rays every time the Relative Strength Index (RSI) trades inside a user‑defined band (default = 50 ± 1). The idea is to spotlight price levels that historically coincided with a specific RSI state—levels that often evolve into short‑term support or resistance as sentiment repeats.
How it works
Raw RSI – The script computes an un‑smoothed RSI of the closing price (rsiLength, default = 3).
Trigger zone – Whenever RSI falls within level ± tolerance (e.g., 49 – 51) the close price of that bar becomes a reference.
Horizontal ray – A ray (extend.right) is drawn from that close and continues indefinitely to the right, creating a live price level.
History management – Only the most recent N rays are kept (maxRays, default = 5); the oldest line is deleted automatically to avoid chart clutter.
Inputs
Name Default Description
RSI Length 3 Look‑back of the RSI calculation.
RSI Level 50 Center of the trigger zone. Common alternatives: 30, 70, custom mid‑lines.
Tolerance 1 Width of the RSI band on each side of RSI Level (set 0 for an exact hit).
Max Rays 5 Maximum number of active horizontal levels kept on screen.
Ray Color Yellow Visual color of the rays.
Ray Width 2 Thickness of the rays.
How to use it
Spot recurring reaction zones – Markets often hesitate near prices where momentum has flipped before. The rays reveal those spots automatically.
Combine with candlestick or volume cues – A level marked by this script plus a rejection wick, volume spike, or divergence can strengthen conviction.
Adapt the band –
50 ± tolerance → momentum balance line (trend pullbacks)
70 ± tolerance → overbought fade levels
30 ± tolerance → oversold bounce levels
Works on any asset or timeframe; shorter RSI periods highlight intraday rotations, longer periods capture swing pivots.
Tips & cautions
A drawn line is not a guarantee of future reversal—always validate with price action and risk management.
For high‑frequency strategies, consider lowering tolerance or increasing rsiLength to reduce noise.
You can add custom alerts on RSI crossing the band to receive push or email notifications.
Happy trading!

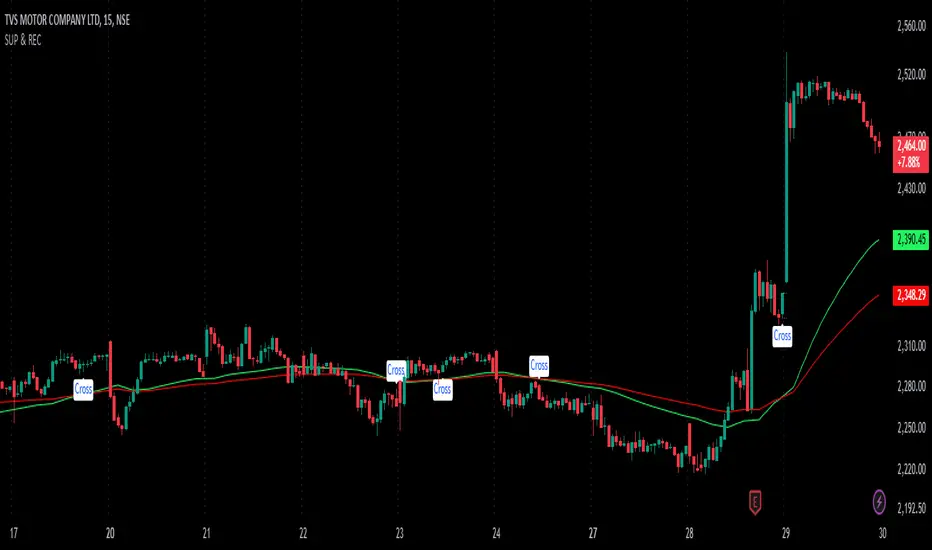
SUP & RECIdentifying Support and Resistance: An indicator (likely visual) highlights areas on a price chart where the asset's price has historically struggled to break through. These are crucial levels to watch for potential price reversals.
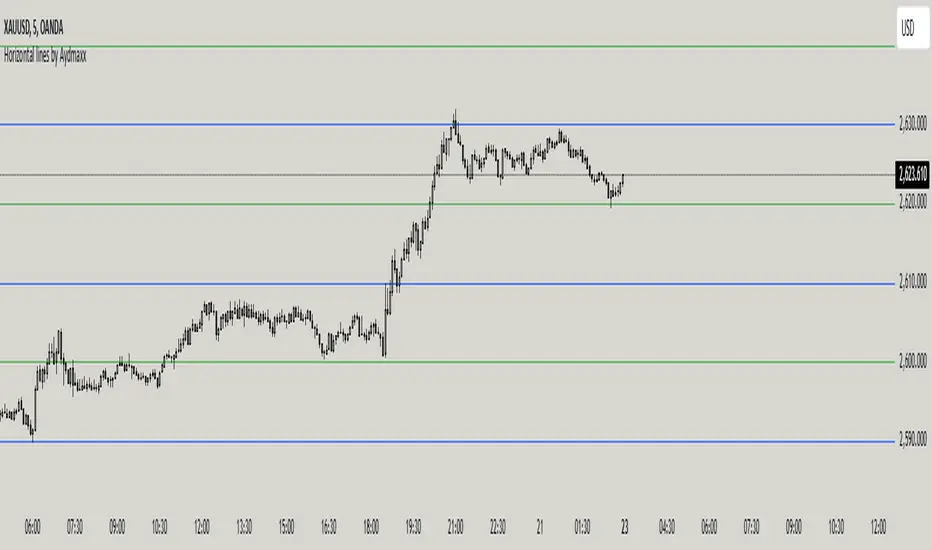
Horizontal lines by AydmaxxIndicator Description: Horizontal Lines by Aydmaxx
This indicator plots customizable horizontal lines on the chart to assist with technical analysis. It allows traders to define a starting price and a step size (gap) between the lines, making it versatile for a variety of strategies, such as identifying support, resistance, or key price levels.
How to Use:
Starting Price (Bottom): Enter the price level where the first (lowest) line should begin. This is your base level.
Example: If you're analyzing a market with prices around 2550, you can set this value to 2550 to align the indicator with your focus.
Gap (Step Size): Specify the interval or step size between consecutive lines.
Example: If you want lines every 10 points, set this value to 10.
Number of Lines: Adjust the total number of lines to display on the chart.
Line Style and Width: Customize the appearance of the lines (solid, dashed, dotted) and their thickness.
Line Colors and Transparency: Choose primary and secondary colors for alternating lines, and adjust the transparency to match your visual preferences.
This indicator is ideal for visualizing price zones and can be tailored to suit any trading style. Adjust the parameters based on your market analysis to highlight key price levels effectively.
Previous Day Close (PVC)Indicator Description: Previous Day Close
This indicator visually represents the previous day's closing price, providing traders with a clear reference point on the chart. By marking this key level, it enhances your ability to analyze stock price movements and make informed trading decisions.
Key Features:
Visual Clarity: The previous day's close is prominently displayed, making it easy to spot significant price levels at a glance.
Enhanced Analysis: Use this indicator to identify potential support and resistance levels based on historical closing prices.
User-Friendly: Designed for simplicity, this indicator integrates seamlessly into your trading workflow.
Leverage the power of the previous day’s close to improve your trading strategy and gain a competitive edge in the market!
Fibonacci IntraDay Range [UkutaLabs]█ OVERVIEW
The Fibonacci IntraDay Range is a powerful trading tool that combines recent price action data with key Fibonacci ratios to identify strong levels of support and resistance.
The purpose of this script is to simplify the trading experience of users by identifying and labelling strong levels of support and resistance that they should be aware of.
█ USAGE
At the beginning of each trading day, the Fibonacci IntraDay Range indicator will calculate the average total range of the past 14 trading days. This average will be drawn on either side of the open, then several more levels will be drawn between them using Fibonacci ratios.
These levels can be treated as levels of support and resistance that can be incorporated into many different trading strategies.
Each line will also have an identifying label so traders will know at a glance what each line represents. These labels can be toggled in the settings.
█ SETTINGS
Configuration
• Show Labels: Determines whether or not labels will be drawn on each line.
• Display Mode: Determines the number of days to load.
• Font Size: Determines the font size of labels.
• Text Alignment: Determines the alignment of labels on their respective line.

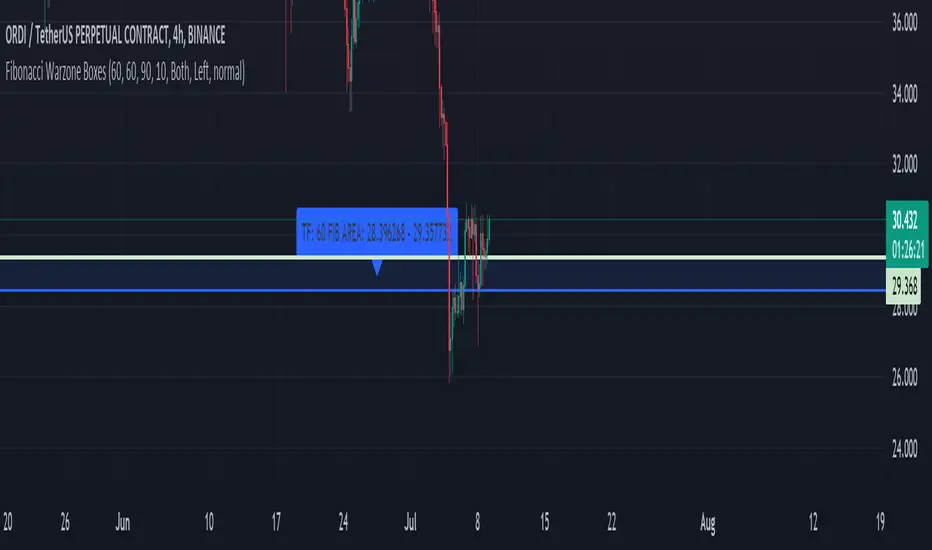
Fibonacci Warzone BoxesThe "Fibonacci Warzone Boxes" is a unique trading indicator that leverages the power of Fibonacci retracement levels to identify critical support and resistance zones. Designed for both seasoned traders and novices, this tool dynamically calculates the 38.2% and 61.8% retracement levels from the highest and lowest prices within a user-defined lookback period and timeframe. By highlighting these zones, the indicator assists traders in making informed decisions about entry and exit points.
Unlike standard Fibonacci tools, the "Fibonacci Warzone Boxes" provides a visual representation of Fibonacci levels in the form of easy-to-interpret boxes, enhancing the decision-making process. This method helps traders quickly understand where significant price action can occur, improving their reaction time and strategic approach to the markets.
A. Key Features:
- Dynamic Fibonacci Levels: Automatically updates Fibonacci retracement levels based on the price action within the selected timeframe and lookback period.
- Customizable Settings: Users can easily adjust the timeframe, lookback period, and box transparency to suit their trading style and the specific characteristics of the asset they are trading.
- Visual Effectiveness: The indicator uses colored boxes (customizable in terms of color and transparency) to clearly denote the Fibonacci war zones, making it easy to spot key levels at a glance.
B. Usage:
To use this indicator, simply apply it to any chart and set the desired timeframe and lookback period. The indicator is particularly useful in markets with clear trends where Fibonacci levels can predict potential reversal points.
C. Benefits:
Enhanced Decision Making: Helps traders identify potential buy and sell zones based on historical price levels.
Adaptability: Works on any timeframe and with any market, making it a versatile tool for various trading strategies.
Ease of Use: Designed with a user-friendly interface, requiring minimal setup for optimal performance.
D. Guidelines for Use:
Ensure your chart is uncluttered to make the best use of this indicator.
Adjust the settings based on the volatility and characteristics of the market you are trading.
Combine this tool with other indicators for a comprehensive trading strategy, but avoid overcrowding the chart to maintain clarity.
Fibonacci Period Range [UkutaLabs]█ OVERVIEW
The Fibonacci Period Range Indicator is a powerful trading tool that draws levels of support and resistance that are based on key Fibonacci levels. The script will identify the high and low of a range that is specified by the user, then draw several levels of support and resistance based on Fibonacci levels.
The script will also draw extension levels outside of the specified range that are also based on Fibonacci levels. These extension levels can be turned off in the indicator settings.
Each level is also labelled to help traders understand what each line represents. These labels can be turned off in the indicator settings.
The purpose of this script is to simplify the trading experience of users by giving them the ability to customize the time period that is identified, then draw levels of support and resistance that are based on the price action during this time.
█ USAGE
In the indicator settings, the user has access to a setting called Session Range. This gives users control over the range that will be used.
The script will then identify the high and low of the range that was specified and draw several levels of support and resistance based on Fibonacci levels between this range. The user can also choose to have extension levels that display more levels outside of the range.
These lines will extend until the end of the current trading day at 5:00 pm EST.
█ SETTINGS
Configuration
• Display Mode: Determines the number of days that will be displayed by the script.
• Show Labels: Determines whether or not identifying labels will be displayed on each line.
• Font Size: Determines the text size of labels.
• Label Position: Determines the justification of labels.
• Extension Levels: Determines whether or not extension levels will be drawn outside of the high and low of the specified range.
Session
• Session Range: Determines the time period that will be used for calculations.
• Timezone Offset (+/-): Determines how many hours the session should be offset by.

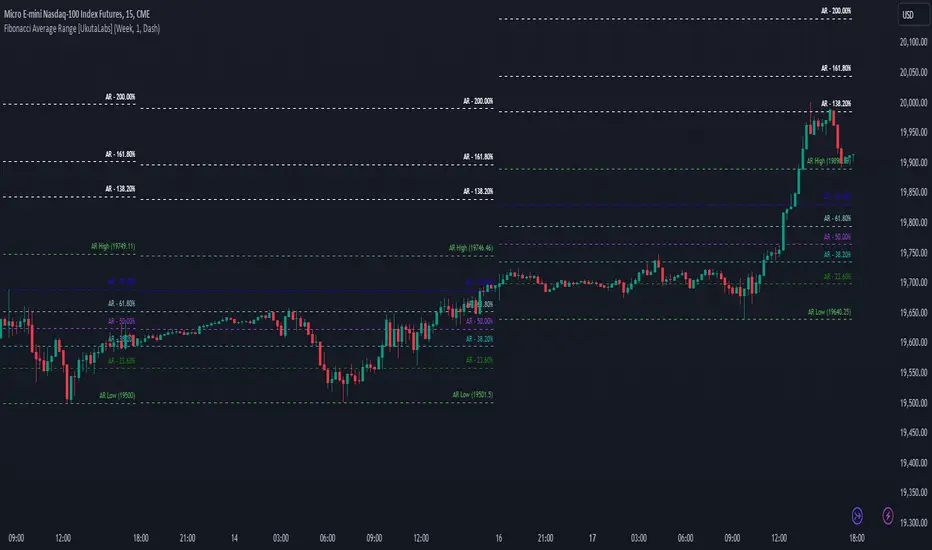
Fibonacci Average Range [UkutaLabs]█ OVERVIEW
The Fibonacci Average Range indicator provides unique insight into key price-action levels within the market that can serve as powerful support and resistance levels. The Fibonacci Average Range is automatically generated purely from price-action; simplifying the decision-making process because price-action focuses on the most critical factor, price.
Through the use of its Fibonacci retracement levels, traders will be able to more accurately predict future direction and price movement of any given commodity.
The Fibonacci Average Range indicator is a powerful trading tool that provides unique insight into the market that can provide value to a wide variety of trading styles.
The aim of this script is to simplify the trading experience of users by automatically identifying and displaying price levels that they should be aware of.
█ USAGE
At the beginning of each trading day, the script will use relevant price-action information to calculate an expected range for the current trading day, giving traders unique insight into potential levels of support and resistance within the market.
Depending on current market conditions, the script will either generate from the current day’s high or the current day’s low, depending on whether the market shows bullish or bearish strength.
Within the total projected range, several other levels will be identified and labelled. These levels combine the script’s prediction for the day’s range and key Fibonacci Ratios to identify potentially powerful levels of support and resistance within.
Each line also has a label to identify what it represents, and these labels can be turned off in the settings.
█ SETTINGS
Configuration
• Show Labels: Determines whether labels get drawn.
• Current Day Open: Determines whether a line representing the current day’s open is drawn.
• Display Mode: Determines the number of days the script will load.
Line Settings
• Line Width: Determines the width of lines.
• Line Style: Determines the style of lines.
Initial Balance [UkutaLabs]█ OVERVIEW
The Initial Balance Indicator is a powerful trading tool that indicates a strong range based on the high and low of the first hour after market open. This range serves as a potential area of Support or Resistance that traders should be aware of during their trading. Because of this, the Initial Balance Indicator is a versatile trading tool that can be included in a wide variety of trading strategies.
The aim of this script is to simplify the trading experience of users by automatically identifying and displaying price levels that they should be aware of.
█ USAGE
When the New York Market opens each day, the script will automatically identify and label the opening range of the first hour of the trading day in real time.
Because there tends to be a spike in volume during this period, the range that is identified can serve as a powerful indication of overall market strength. Once the price breaks out of this range, it then can be used as an area of support or resistance depending on the direction of the breakout.
█ SETTINGS
Configuration
• Display Mode: Determines the number of days that the script should load.
• Show Labels: Determines whether identifying labels are drawn on the chart as well.
• Initial Balance Color: Determines the color of the range and labels that are drawn by the indicator.
• Extension Levels: Determines the number of extension levels that should be drawn on either side of the range. These levels are drawn at an interval of half the width of the Initial Balance range.
• Extension Levels Color: Determines the color of the extension level lines.

Psychological Levels [UkutaLabs]█ OVERVIEW
The Psychological Levels Indicator provides real-time insight into key price levels within the market that can serve as powerful support and resistance levels. These levels are updated automatically in real time to display only the most relevant levels to the current price, facilitating your trading experience.
The aim of this script is to simplify the trading experience of users by automatically identifying and displaying price levels that they should be aware of.
█ USAGE
On each tick, the nearest key price level is automatically identified by the script. The script will identify this level based on the price of the commodity you are applying it to:
• Commodities priced at $0 to $999.99 will identify the nearest whole dollar.
• Commodities priced at $1,000 to $9,999.99 will identify the nearest $10.
• Commodities priced at $10,000 to $99,999.99 will identify the nearest $100.
• Commodities priced over $100,000 will identify the nearest $1,000.
We refer to this rounding price as the gap price, and it is also used to determine the prices of the other lines drawn by this script.
After identifying the nearest key price level, the script then incrementally draws lines on either side of this level at an interval of the gap price. We refer to these as the Major Lines, and the user can control the number of these lines that get drawn, the style of these lines, and they can be disabled in the settings.
The script then draws lines at the half-way point between each of these Major Lines, and we refer to these as the Minor Lines. Like the Major Lines, the user has full control over the number of these lines that can be drawn, the style of these lines, and they can be disabled in the settings.
█ SETTINGS
Configuration
• Number of Lines: Determines the number of lines that are drawn on either side of the key price line. This controls both the number of Major Lines and Minor Lines.
Line Settings
• Major Lines: Determines whether or not the Major Lines will be displayed.
- Color: Determines the color of Major Lines.
- Style: Determines the style of Major Lines.
- Width: Determines the width of Major Lines
• Minor Lines: Determines whether or not the Minor Lines will be displayed.
- Color: Determines the color of Minor Lines
- Style: Determines the style of Minor Lines
- Width: Determines the width of Minor Lines

Opening Range Breakout [UkutaLabs]█ OVERVIEW
The Opening Range Breakout is a powerful trading tool that indicates a strong range based on the high and low of the first fifteen or thirty minutes after market open. This range serves as a potential area of Support or Resistance that traders should be aware of during their trading. Because of this, the Opening Range Breakout is a versatile trading tool that can be included in a wide variety of trading strategies.
The aim of this script is to simplify the trading experience of users by automatically identifying and displaying price levels that they should be aware of.
█ USAGE
When the New York Market opens each day, the script will automatically identify and label the opening range in real time. The user can control whether the script measures the first 15 or 30 minutes of each trading day to fit each trader’s trading style.
Because there tends to be a spike in volume during this period, the range that is identified can serve as a powerful indication of overall market strength. Once the price breaks out of this range, it then can be used as an area of support or resistance depending on the direction of the breakout.
█ SETTINGS
Configuration
• Show Labels: Determines whether labels are drawn within the range.
• Display Mode: Determines the number of days the script should load.
Range Settings
• 15 Minute: Determines whether or not the 15 minute range is drawn.
• 15 Minute Color: Determines the color of the 15 minute range and labels.
• 30 Minute: Determines whether or not the 30 minute range is drawn.
• 30 Minute Color: Determines the color of the 30 minute range and labels.

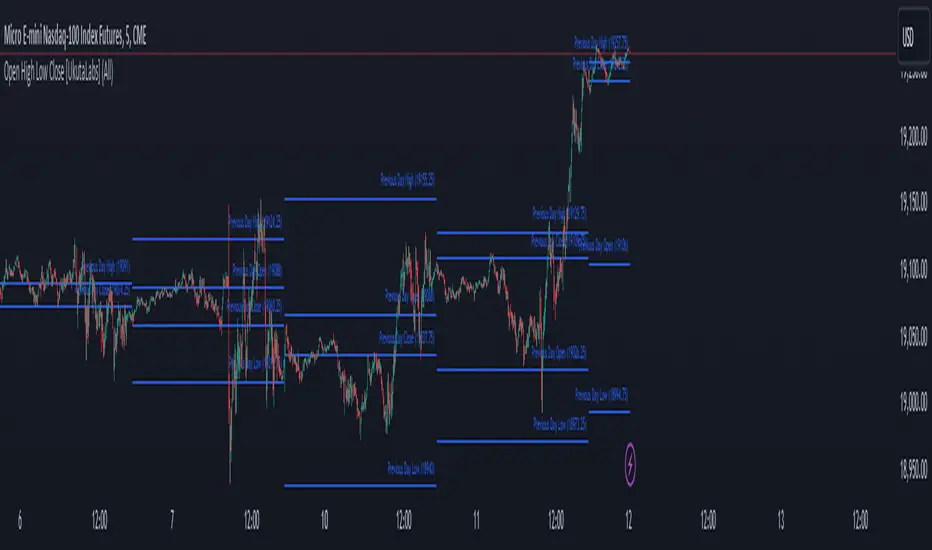
Open High Low Close [UkutaLabs]█ OVERVIEW
The Open High Low Close indicator is a powerful trading tool which generates resistance and support levels based on the previous day’s Open, High, Low and Close prices. These levels may act as strong levels of support and resistance, granting traders insight into key price levels.
The aim of this script is to simplify the trading experience of users by automatically identifying and displaying price levels that they should be aware of.
█ USAGE
At the beginning of each trading day, the script will automatically identify the previous day’s high, low, open and close prices. After identifying these levels, the script will then display them as a line on the chart.
Each line also has a label at the end indicating which level it represents. These labels can be toggled in the indicator's settings.
These levels are based on relevant price-action information and may serve as potentially powerful Support and Resistance levels that can be included in a variety of trading strategies.
█ SETTINGS
Configuration
• Show Labels: Determines whether or not identification labels are drawn on each line.
• Display Mode: Determines the number of days the script should load.
• OHLC Color: Determines the color of the lines and labels.
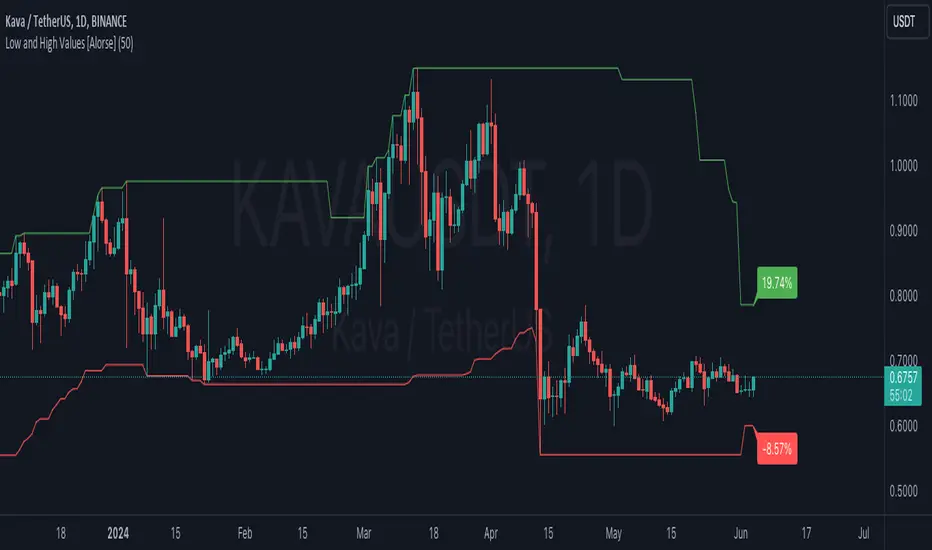
Low and High Values [Alorse]🌟 What does this indicator do?
This magical indicator shows you the lowest (Low) and highest (High) values of the last X candles directly on your chart. Not only that, but it also tells you how much the price has changed from the opening price of the current candle to these key points, all in percentage format. You'll have a clear and precise view of market movement!
🔧 Customize to your liking
Want to adjust the number of candles to consider? No problem! You can easily change this parameter to suit your preference. Whether you like short-term strategies with just a few candles or prefer more extensive analysis with many candles, our indicator adapts to you.
🚀 How can this indicator help you?
Identify Support and Resistance: By showing the lowest and highest points, it helps you identify key support and resistance levels. Perfect for planning your entries and exits!
Trend Analysis: With the percentage labels, you can quickly see how the price has moved relative to recent extremes, helping you confirm trends or anticipate possible reversals.
Trading Strategies: Imagine the price is near a recent low, but the percentage indicates a significant drop from the opening. This could be a buy signal if you expect a rebound. Conversely, if the price is near a recent high with a large percentage increase, you might consider selling.
Calculate Stop Loss: Use this indicator to determine your Stop Loss levels by leaving a bit of margin between the indicator value and your desired SL. This helps protect your positions while allowing for some price fluctuation.
📊 Examples of Use
Intraday Trader: Use the indicator with 10-20 candles to capture quick moves and capitalize on daily fluctuations.
Mid-term Trader: Set the indicator to consider 50 candles for a broader view of trends and reversal points.
Long-term Strategist: Adjust the indicator to 100 candles or more to identify highs and lows over larger time frames.
🛠️ Customizable Parameters
Number of Candles: Define the number of candles the indicator will analyze to calculate the lowest and highest values. It's all up to you!
Savage MorningMade for those Savage morning where you need to plot your values quicker.
The following section defines several input variables with default values that can be configured by the user:
resistance, weak_resistance, support, weak_support, gap_price, gap_price2, last_close, key_price, key_price1, key_price2, key_price3: These variables represent various price levels such as resistance, support, gap prices, and key levels. Users can input their own values for these levels when adding the indicator to their chart.
Next, there are boolean input variables that control the visibility of each line:
show_res, show_weak_res, show_sup, show_weak_sup, show_gap, show_gap2, show_last_close, show_key, show_key1, show_key2, show_key3: These variables allow users to choose which lines should be displayed on the chart by toggling them on or off.
Following that, there are multiple plot statements. These statements create plot series for each line that may be displayed on the chart. The plot function determines the value to be plotted based on the user's input and the visibility settings:
plot_res, plot_weak_res, plot_sup, plot_weak_sup, plot_gap, plot_gap2, plot_last_close, plot_key, plot_key1, plot_key2, plot_key3: These variables store the values to be plotted for the respective lines based on the user's input and visibility settings.
After defining the plot series, there are multiple plot statements that actually plot the lines on the chart. Each line has its own color and title specified.
Finally, labels are added on the right side of the lines to provide additional information. The label.new function is used to create labels for each line, displaying their names ("Res," "Weak Res," "Sup," etc.) at the corresponding price levels on the chart.
In summary, this Pine Script code creates a custom indicator named "Savage Morning" that allows users to input various price levels and choose which of these levels should be displayed on their chart. It plots these levels as lines with different colors and labels them for easy identification on the chart. The indicator is designed to help traders visualize important price levels and gaps that they have determined for themselves and make it easier for them to plot or change their own levels.

MTF Breakout/RetestIntroducing the MTF (Multi Timeframe) Breakout and Retest Indicator:
This indicator is designed to enhance your trading strategy by providing a clear view of support and resistance levels across multiple timeframes. What this simply means is that you can input your levels, and be on a lower timeframe such as the 1 minute timeframe, and are able to see when your support or resistance level has a breakout
📈 Short Trade Breakout Condition:
- Definition: A short breakout occurs when a candle closes below your specified support level on any chosen timeframe.
- Confirmation: It confirms as a valid short signal when a second candle closes below the support level without retesting.
- Visual Clarity: The indicator highlights the timeframe in which this breakout has occurred.
(Long conditions are same but reversed, and will be displayed in color green)
📊 Multi-Timeframe Insights:
- Scope: You can analyze support and resistance levels across various timeframes, including 5, 15, 30, and 60 minutes, while trading on a lower timeframe like 1 minute.
🎨 Dynamic Color-Coding:
- Visual Signaling: The indicator employs color-coding to visually signal breakout events. When a short breakout occurs on any timeframe the timeframe color will highlight red, and vice versa for long will highlight green. The physical line will change color based on the current timeframe you are viewing
- Real-Time Tracking: Colors reset when a level is retested, helping you track market sentiment in real-time.
🪙 Need Your Help
- I am still very much new to coding, and this code is clearly not optimized well. This code was mainly the based idea, and over the next coming months I will be working to enhance the code but I need tradingview help. If you are a coder and see a way to optimize this code please please let me know :)
