Fibonacci + Support/Resistant + Trendline (Price action)This is opening source code version: Fibonacci + Support/Resistant + Trendline (One of Advanced Price action Analysis).
How it works:
It find entry Long/Short by combining: Fibonacci + Support/Resistant + Trendline
1. Find Impulse wave:
To findind Impulse wave, It uses Pivot High/Low to find Impulse wave. In case find entry Long, If having Pivot High higher Pivot High before, it will draw an Impulse wave.
2. Find entry at Fibonacci levels:
Draw Fibonacci fibonacci retracement from Pivot Low to Pivot High. A Fibonacci retracement forecast is created by taking two extreme points on a chart and dividing the vertical distance by important Fibonacci ratios. 0% is considered to be the start of the retracement, while 100% is a complete reversal to the original price before the move. Horizontal lines are drawn in the chart for these price levels to provide support and resistance levels. Common levels are 23.6%, 38.2%, 50%, and 61.8%
3. Find entry at Support/Resistant Zone:
Support/Resistant Zone drawed from Pivot High before, which price just breaken and return to retest.
4. Find entry at Trendline:
Trendline drawed from Pivot High/Low before, which price just breaken and return to retest.
How do use it:
+ You can customize the thickness of the lines.
+ You can set up an alert when the price touchs important areas.
"support" için komut dosyalarını ara

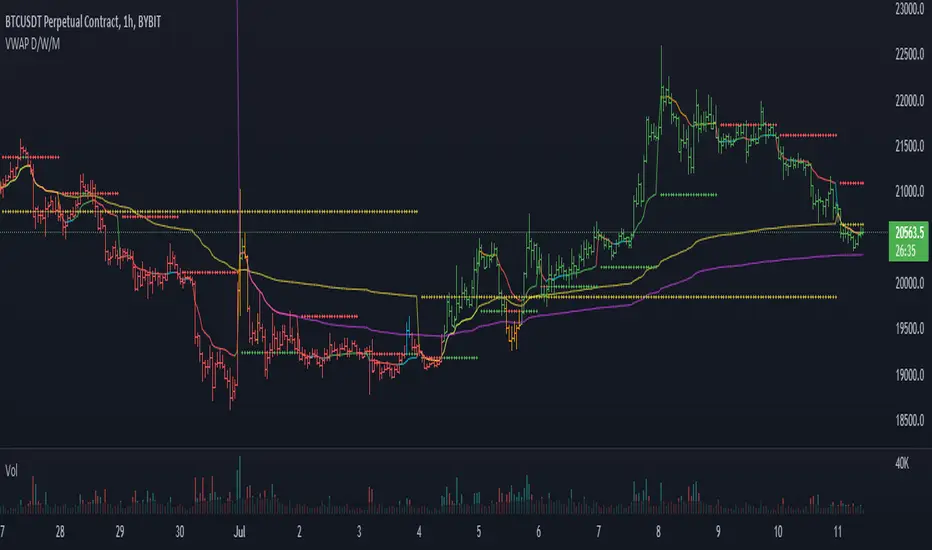
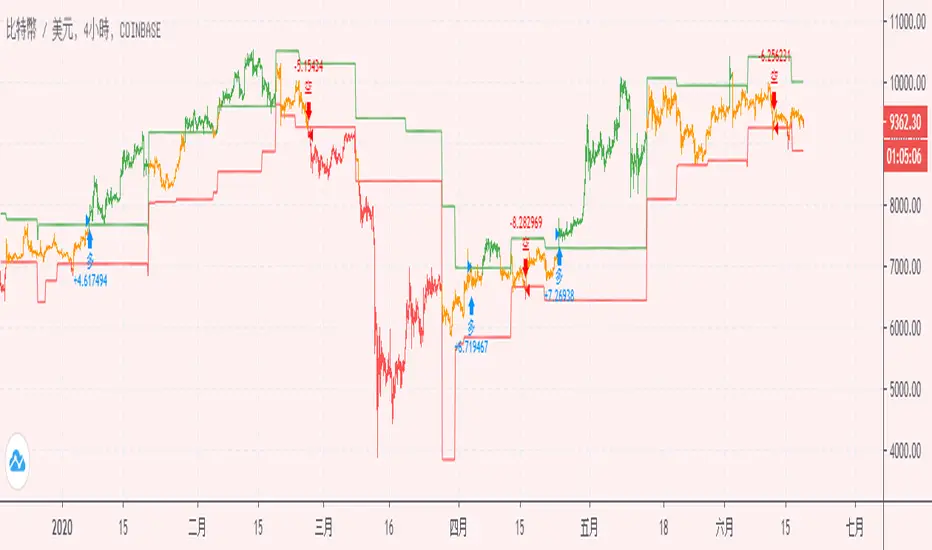
VWAP and previous VWAP for Support & Resistance for D W MI overhauled my old multi timeframe VWAP script to make the VWAP OC-Check work for all timeframes. Now only one function is used to calculate the 3 preset VWAPs.
Previous VWAPS = the price where the last session closed sometimes work as Support and Resistance.
The OC-Check Mode theory examines if the VWAP from the Open is above or below the VWAP from Close
and if price is above or below normal VWAP (HLC3).
This way we have 4 states:
Red = Strong Downtrend
Orange = Weak Downtrend
Blue = Weak Uptrend
Green = Strong Uptrend
As always it is just a theory - nothing is set in stone regarding any indicator.
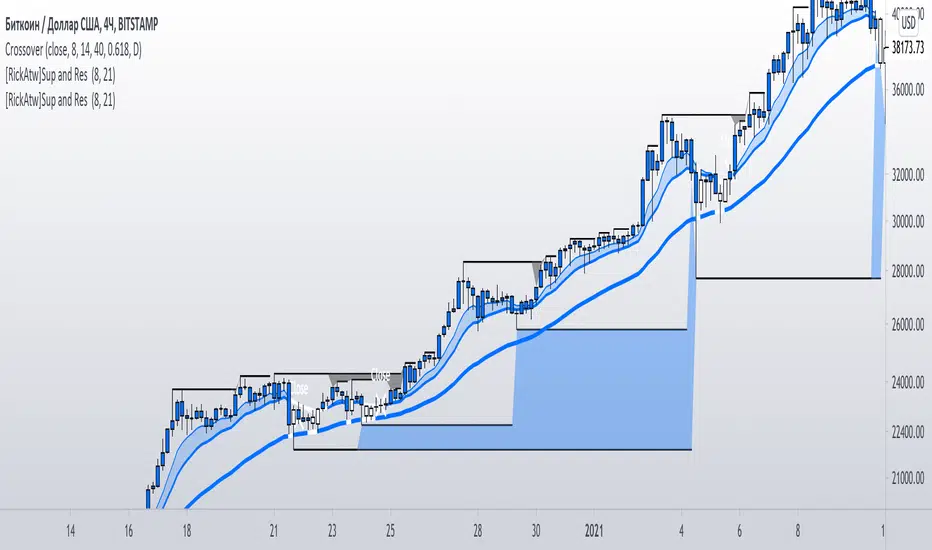
Universal logarithmic growth curves, with support and resistanceLogarithmic regression is used to model data where growth or decay accelerates rapidly at first and then slows over time. This model is for the long term series data (such as 10 years time span).
The user can consider entering the market when the price below 25% or 5% confidence and consider take profit when the price goes above 75% or 95% confidence line.
This script is:
- Designed to be usable in all tickers. (not only for bitcoin now!)
- Logarithmic regression and shows support-resistance level
- Shape of lines are all linear adjustable
- Height difference of levels and zones are customizable
- Support and resistance levels are highlighted
Input panel:
- Steps of drawing: Won't change it unless there are display problems.
- Resistance, support, other level color: self-explanatory.
- Stdev multipliers: A constant variable to adjust regression boundaries.
- Fib level N: Base on the relative position of top line and base line. If you don't want all fib levels, you might set all fib levels = 0.5.
- Linear lift up: vertically lift up the whole set of lines. By linear multiplication.
- Curvature constant: It is the base value of the exponential transform before converting it back to the chart and plotting it. A bigger base value will make a more upward curvy line.
FAQ:
Q: How to use it?
A: Click "Fx" in your chart then search this script to get it into your chart. Then right click the price axis, then select "Logarithmic" scale to show the curves probably.
Q: Why release this script?
A: - This script is intended to to fix the current issues of bitcoins growth curve script, and to provide a better version of the logarithmic curve, which is not only for bitcoin , but for all kinds of tickers.
- In the public library there is a hardcoded logarithmic growth curve by @quantadelic . But unfortunately that curve was hardcoded by his manual inputs, which makes the curve stop updating its value since 2019 the date he publish that code. Many users of that script love using it but they realize it was stop updating, many users out there based on @quantadelic version of "bitcoin logarithmic growth curves" and they tried their best to update the coordinates with their own hardcode input values. Eventually, a lot of redundant hardcoded "Bitcoin growth curve" scripts was born in the public library. Which is not a good thing.
Q: What about looking at the regression result with a log scale price axis?
A: You can use this script that I published in a year ago. This script display the result in a log scale price axis.

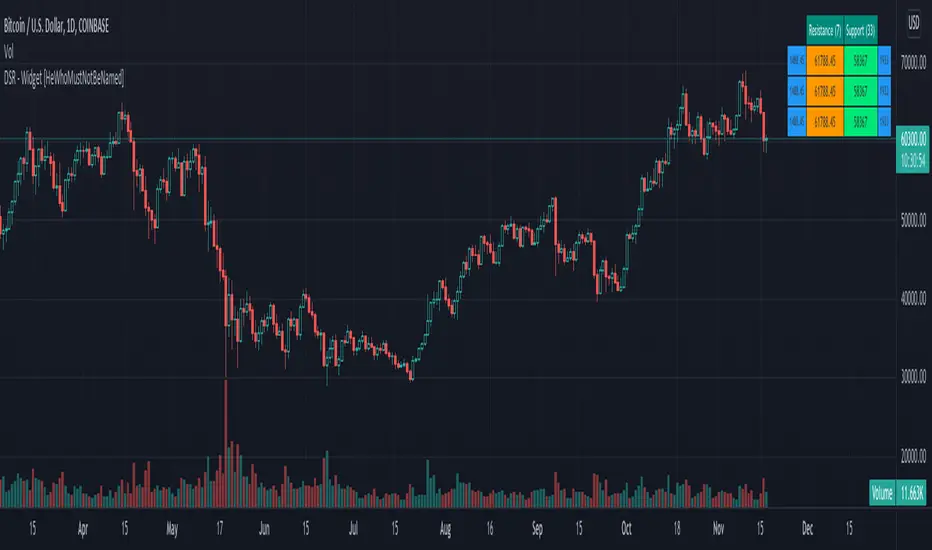
Divergence-Support/Resistance - Widget [HeWhoMustNotBeNamed]Unique live widget which provides information about support and resistance along with distance to immediate levels.
⬜ Custom Candle Source
Three options of candles available
▶ Regular OHLC candles
▶ Heikin-Ashi candles ( Taken leaf out of @Bjorgum's book - but, still could not do it as good as him :) )
▶ Moving average candles
⬜ Multiple zigzags and choice of oscillator
Like any other zigzag based indicator, I prefer using 4 zigzag levels.
And select oscillator of your choice to identify divergence. Oscillator lengths are automatically calculated based on zigzag lengths. You can also chose external oscillator.
⬜ Support and resistance widget settings
▶ Max S/R per zigzag - this is the number of last S/R levels recorded for each zigzag
▶ Max S/R for stats - even though there can be many number of S/R levels, we cannot show all of them in the widget due to space constraint. Hence, this is set to minimal value of 3. Can be changed via this input.
▶ Max S/R for Alerts - When sending stats through alerts, users can decide how many immediate S/R levels to be sent in them.
▶ Alert Choices - Can chose to get alerts when new S/R levels formed and also when existing S/R levels broken.
Personally think it is a very handy widget to have!!
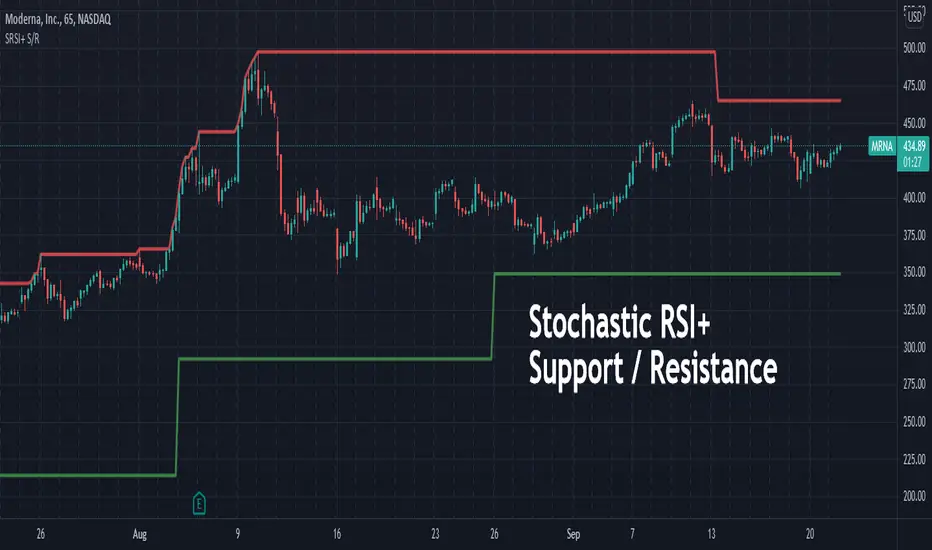
Stochastic RSI+ Support/Resistance (beta)This indicator uses Stochastic RSI+ as a means to determine overbought and oversold conditions which subsequently define recent support and resistance levels.
Martyv Auto Fib Retracement with Logarithmic SupportSimple & easy auto-fib levels. Took the out-of-the-box version provided by TradingView and added Logarithmic support and a nicer palette, and made the controls a bit nicer to use (in my opinion lol). Enjoy.

SMA 200 Ribbon MTF - Support and ResistanceThe SMA 200 is one of the most important and strongest support/resistance lines on any timeframe. This script pulls the SMA 200 line from multiple timeframes so traders can visually see price action bounce between support and resistance . The current timeframes SMA 200 is displayed in white and turns yellow to signify "pressure". Can be used on higher timeframes to find bull action. This indicator can also be used to filter out pumps and dumps as shown in example 3 and 4.
Example of indicator on 5 min timeframe. Candles bounce along SMA200 lines.
Example of indicator on daily timeframe . Lines turn green and price action pumps. Lines turn red and price action dumps.
Example 3: A clean crossover of lines usually signals a bullish pump.
Example 4: Tangled or messy lines tend to result in a dump as price action struggles to cross resistance. A pullback is required to "clean" the lines.
EMA Band can be turned on using "tickbox" in settings menu.

EMA 730 Ribbon MTF - Support and ReistanceThe EMA 730 line is a great way to show dynamic support and resistance . Price action travels "through" this line on each timeframe. This script pulls the EMA 730 Line from multiple timeframes so a trader can visually see price action bounce between support and resistance lines. Lower bands (white lines) can be turned off using "tickbox" in settings. EMA length can also be adjusted in settings. Some charts may work better with a length of 750.
Example of EMA Bands on lower timeframe.

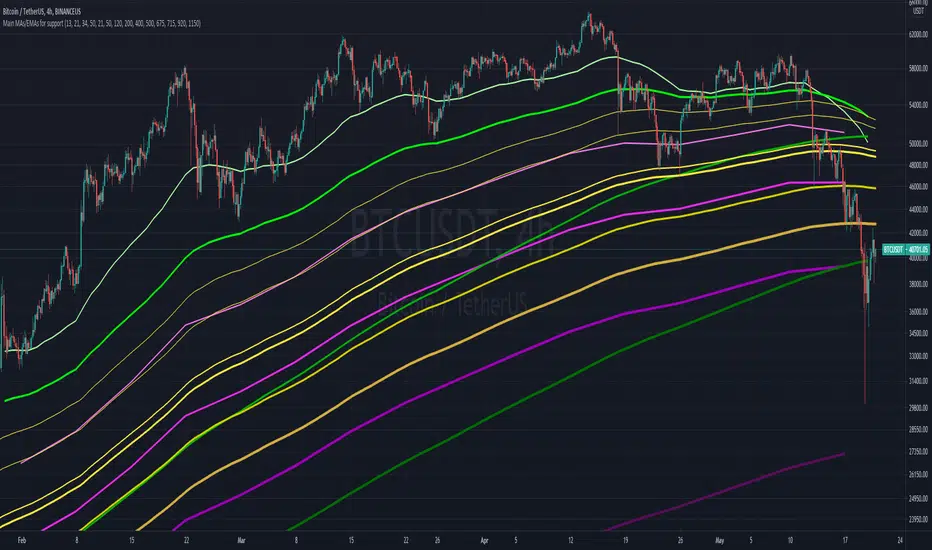
Main MAs and EMAs multi-timeframe for supportObjective is to map out different multi-timeframe support/resistance , all at once. Includes weekly, daily and 4H EMAs and MAs, as per the follow (allowing customization)
WEEKLY (in pink/purple variations):
- 13 EMA
- 21 EMA
- 34 EMA
- 50 M.A
DAILY (in green variations):
- 21 EMA
- 50 EMA
- 120 M.A.
- 200 M.A.
4H (in yellow/golden colors):
- 400 EMA
- 500 EMA
- 675 EMA
- 715 EMA
- 920 EMA
- 1150 EMA
Notes:
- Quite useful to all types of assets; crypto, commodities , stocks, etc...
- Ideally not to be visible all the time, as it can "pollute" the charts. But very helpful in moments of great volatility
[RickAtw] S1 Support and resistance This indicator helps to identify the current support and resistance in the market.
Function
Shows at which points the correction appears and at which points there is resistance
Key Signal
buy ---> If a blue zone forms
sell --->If a black zone forms
Remarks
This helps you determine the approximate support and resistance area.
Since we cannot look into the future, it does not inform you about the exact entries, but it shows who is dominating the market at the moment.
Readme
In real life, I am a professional investor. And I check each of my indicators on my portfolio and how effective it is. I will not post a non-working method. The main thing is to wait for the beginning of trends and make money!
I would be grateful if you subscribe ❤️
Support and Resistance StrategySupport and resistance Strategy (FX and Crypto)
Description: This strategy uses “support” S and “resistance” R levels, which can be computed
using the “pivot point” (a.k.a. the “center”) C as follows:
C = (PH + PL + PC) / 3
R = 2 × C - PL
S = 2 × C - PH
Here PH, PL and PC are the previous day’s high, low and closing prices.
One way to define a trading signal is as follows (as above, P is the current price):
Signal:
Establish long position if P > C
Liquidate long position if P ≥ R
Establish short position if P < C
Liquidate short position if P ≤ S
Other definitions of the pivot point (e.g., using the current trading day’s open price) and
higher/lower support/resistance levels exist.
Style tags: Trend Following, Trend Analysis
Asset class: Equities, Futures, ETFs, Currencies and Commodities
Dataset: FX Minutes/Hours/Days

Standard deviation zones Support & Resistance [LM]Hi Guy,
I would like to introduce you Standard deviation zones Support & Resistance horizontals. It draws line horizontals on high and low st dev zone. The colors are dynamic depending whether price is below or above the line.
Credit is due to @Zeiierman for st dev zone calculation so shout out to him.
There are various sections in setting:
general setting where you can select source for zone calculation
tops setting
bottom setting
show and hide section of the first timeframe
show and hide section of the second timeframe
Be aware that when new zone starts and is not finished yet than the top will trail the high of unfinished zone that could be also at the high of current candle and next candle it can change
Any suggestions are welcomed

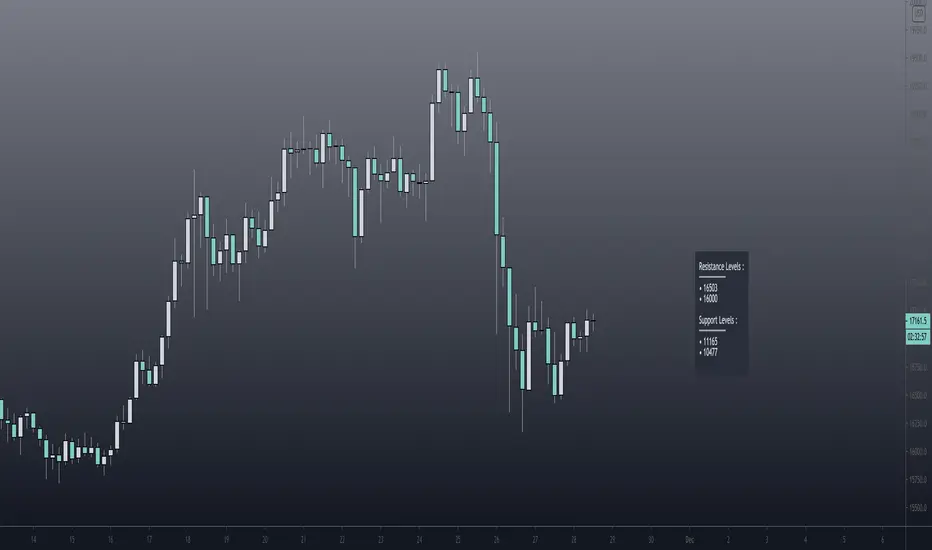
Pivot Support / Resistance Panel [JV]Hello Traders,
First all of thanks to LonesomeTheBlue for making me grasp arrays, a wonderful addition to Pine Script.
This indicator uses arrays to find Pivot Points and mark them as Support / Resistance.
It displays an info panel with the latest values.
This code was written using the following standards:
• PineCoders Coding Conventions for Pine: www.pinecoders.com
Configurable options:
Up to 6 Support / Resistance Levels.
Pivot Lookback Period.
Panel Color.
Text Color.
Panel Offset.
Panel Size.
Enjoy!
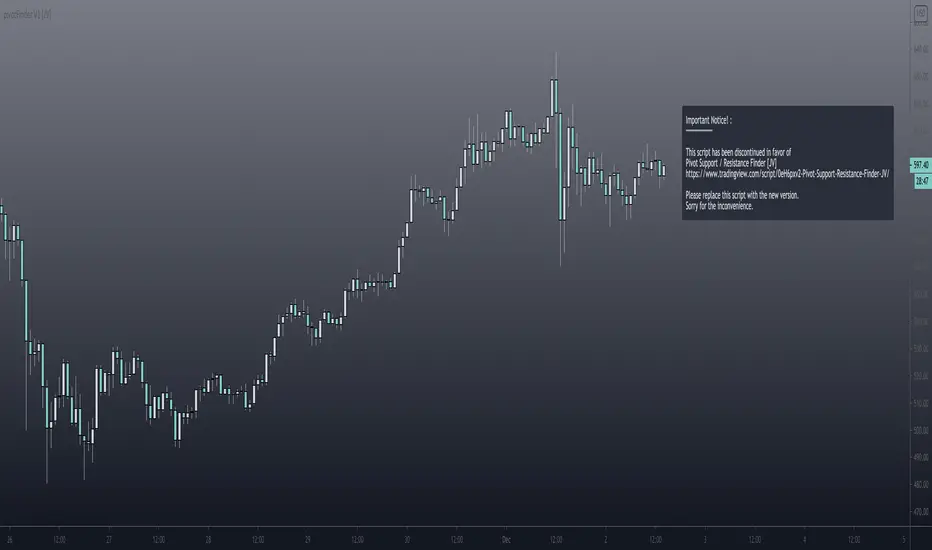
Pivot Support and Resistance Finder [JV] V1Hi Traders.
This is my first attempt of writing an indicator.
Let me start by saying I could never have done this without lmatl and WMX_Q_System_Trading who were and are an incredible source of inspiration.
This indicator shows horizontal Pivot Support and Resistance . It draws up to 4 horizontal lines extending to the right from and adds labels to High and Low Pivot Candles . It also draws the Support / Resistance that is currently forming.
You can select the number of lines on the current timeframe.
There are some options in Settings:
Current timeframe pivot settings
Show and hide levels of the current timeframe
Change colors
Extend Lines
Any suggestions are more than welcome!
I also welcome donations, no matter how small ;-)
Volatility Support & Resistance [LM]Hello guys,
I would like to introduce you volatility support and resistance horizontals. It draws line horizontal on high and low vhighly volatile candles. You can select lines on this timeframe and/or another one. It's done in the same spirit like my other indicators for horizontals
The colors are dynamic depending whether price is below or above the line:
for the current timeframe green is used for support and blue for resistance
for the other timeframe by default 4h orange is used for support and violet for resistance
There are various sections in setting:
general settings - here you can select ATR length, multiplier and show labels
show and hide section of the current timeframe
other timeframe
show and hide other timeframe horizontals
Any suggestions are welcome

Support Resistance - Aging [Example]Hello All,
First all of Thanks to Pine Team for adding Arrays to Pine!
In this script I tried to make example for
1. Finding S/R lines using highest/lowest function
2. Using 1D array as 2D (we keep S/R levels and age)
3. "Age" usage for S/R levels, getting older on each candle and changing colors by their age (maximum age is 127 then it disappears)
You can use "Close"/Open " or " High/Low " as source.
There is an option for the background color, by default it's Black, do not forget to set it accordingly :)
Enjoy!

Pivot Support & Resistance multi timeframe [LM]Hello guys,
I would like to introduce you pivot support and resistance horizontals. It draws line horizontals on high and low high pivot candles . You can select lines on this timeframe and/or another one.
The colors are dynamic depending whether price is below or above the line:
for the current timeframe green is used for support and blue for resistance
for the other timeframe by default 4h orange is used for support and violet for resistance
There are various sections in setting:
current timeframe pivot setting
show and hide section of the current timeframe
other timeframe pivot setting
show and hide other timeframe horizontals
I'm mainly looking smaller timeframe and trading higher timeframe from level to level
Any suggestions are welcome

True Strong Classical Support/Resistance LevelsThis script is based on the approach of filtering signals by checking higher timeframes.
So basically setting higher numbers in "Strength Of Levels" option, will make the indicator check for support and/or resistance levels in timeframes higher than the current.
Unfortunately, I was forced to still use inefficient built-in functions pivothigh() and pivotlow(). I hope they fix them up soon!
I'm looking for any opinion about the idea and if you like any of my scripts, anything you send means a lot to me.
This script is published for the third time because of some moderators absurd behavior.
But thank heavens, the code is now more clean and of course the option "Strength Of Levels" accepts float numbers.

[LunaOwl] Support Resistance Strategy V4作品: 支撐壓力策略
A simple Support Resistance Breakthrough Strategy, the only difference is that it is PineScript @version=4. interested parties can use it as a reference.
Its logic is simple, wish your all the best.
一個簡單的支撐阻力突破策略,唯一的差異,在於它是PineScript第四版。有興趣的可以拿來當作參考,簡易的指標。祝你們順心。
Support level refers to the support price that the exchange rate may encounter when it falls, so as to stop falling and stabilize the price.
The corresponding concept is the resistance level, that is, the pressure that the exchange rate may encounter when it rises, thus reversing to a falling price.
支撐位是指匯價在下跌時可能遇到的支撐價格,從而止跌回穩的價格,對應的概念是阻力位,也即匯價上漲時可能遇到的壓力,從而反轉為下跌的價格。
NSDT Auto Support / Resistance LevelsSimple script that automatically plots support and resistance lines based on the pivot points of the number of candles you choose to look back upon.
All options are editable.

Phicube EMASAR ( EMA Support and Resistance )Indicator based on the Concept created by Bo Williams. But unlike the original that uses MIMAs, EMAs are used here.
Exponential moving averages will be shown according to fractal alignment, in order to show the important support and resistance levels ( SAR ).
When the fractals are aligned to become support,
we will have the EMA in the graph with a bright color.
When the fractals are aligned to become resistance, we will have EMA in the graph with a matte color.
Available exponential moving averages: 17,34,72,144,305,610,1292 and 2584
____________________________________________________//_____________________________________________________________________
Indicador baseado no Conceito criado pelo Bo Williams. Mas diferente do original que utiliza MIMAs, aqui é utilizado EMAs.
As médias móveis exponenciais serão mostradas de acordo com o alinhamento dos fractais, com objetivo de mostrar os níveis importantes
de suporte e resistência( SAR ).
Quando estiver com os fractais alinhados virando suporte, teremos no gráfico a EMA com uma cor em tom brilhante.
Quando estiver com os fractais alinhados virando resistência, teremos no gráfico a EMA com uma cor em tom fosco.
Médias móveis exponenciais disponíveis: 17,34,72,144,305,610,1292 e 2584


