Volume Support and Resistance*In a cutting system, from the lowest price of the red momentum to the highest price of the green momentum of the range of candles, cuts of different heights are created and the volume of transactions is calculated.
*Volumes in red and green candles each layer are calculated separately.
*The start of the candles can be from a candle other than zero.
*The maximum number of cuts for support or resistance will be separate and user-opinionated. This will help us see the most accurate support or resistance independently and quickly.
*The layer that has (1) the highest volume ratio of green to red, (2) the lowest number of red candles and (3) the highest number of green candles is considered as the best resistance and vice versa as the best support. Therefore, by changing the maximum number of cuts, we should look for the largest ratio of green to red volume for resistance and vice versa for support.
*If the current price is in the range of the momentum candle, the distance of the highest or lowest price of the momentum to hlc3 of the momentum candle will be checked.
*if you get an error message (> 500ms), reduce high_slice or loockback.
*Trading volume is formatted because it varies from very small to very large numbers in different markets and time periods.
"support" için komut dosyalarını ara

Strongest Supports And ResistancesDraws the best support and resistance lines. How it works:
1) Tries every possible line through lows, highs, opens, closes
2) Finds the total hit counts given the confidence interval as input to the candlesticks
3) Calculates the strength of every line according to hit count, total volumes on hits, and timestamps
4) Eliminates similar lines, confidence interval is set as input
5) Selects the strongest 20(changable as an input) lines and draws them on the graph.
Makes your work way easier!!!
Feel free to adjust the parameters for your own style!
Cheers!!

Moving Average Support and ResistanceThis indicator takes a moving average, creates an envelope, and analyzes how frequently the moving average and its deviations act as areas of support or resistance. Using this information, you can determine how strong the moving average is as a support or resistance. For example, if the 200 SMA with a 5% range and 1% buffer has an S/R ratio of 1:1.5, then the 200 SMA is acting as resistance more frequently than support. This indicator uses the "buffer" as an envelope extension. The best way to think of this buffer is to envision areas where false breakouts and stop runs may occur. Use this indicator to experiment with different moving averages, ranges, and buffers to find the best combination for your trading style.

RSI based support resistance levelsThis indicator draws support line and resistance lines in the price chart.
How ?
For drawing the support/resistance line we need to first determine the demand and supply.
We are using too-familiar indicator RSI to determine when the script is oversold and overbought.
Now oversold (in RSI) is not a point, it’s a zone. The RSI indicator comes below 30, stays there and goes up above 30. Similarly for overbought.
Now if you carefully look at the oversold region – the lowest point of the oversold region is the place where the demand came (for surety) and push the indicator (and price) up.
Similarly: the highest point of overbought is the place where (for surety) the supply came and push the indicator (and price) down.
So that’ the supply / demand line (for surety).
In this indicator, based on the RSI we are just drawing support and resistance lines in the chat. That’s all.
What is unique ?
Trendline concept is not new. RSI is not new. RSI overbought/oversold is not new.
There are indicators exist to draw trendlines. Some of them works beautifully.
However, none of these, we are aware of, uses RSI to determine it. And, we believe, the most logical way to determine support/resistance is RSI.
Note: We are not responsible for any trading/investment decision you are taking out of the outcome of this indicator.

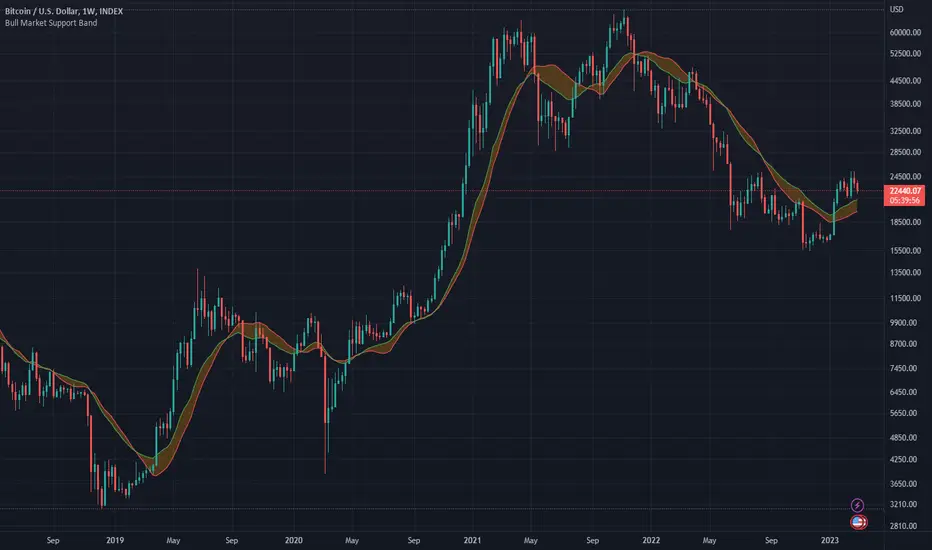
Bull Market Support Band (20w SMA, 21w EMA)This moving average indicator is a bull market support band. It's significance comes from the previous bull runs where the price was bouncing off or riding from a distance the support band until the end of the market cycle. For example, during the 2017 bull run, Bitcoin had several 30-40% corrections to the support band.
The green line represents the 20 weeks simple moving average and the red line represents the 21 weeks exponential moving average. The best way to read the current value is to look at the weekly chart, but any time frame will display the same values.
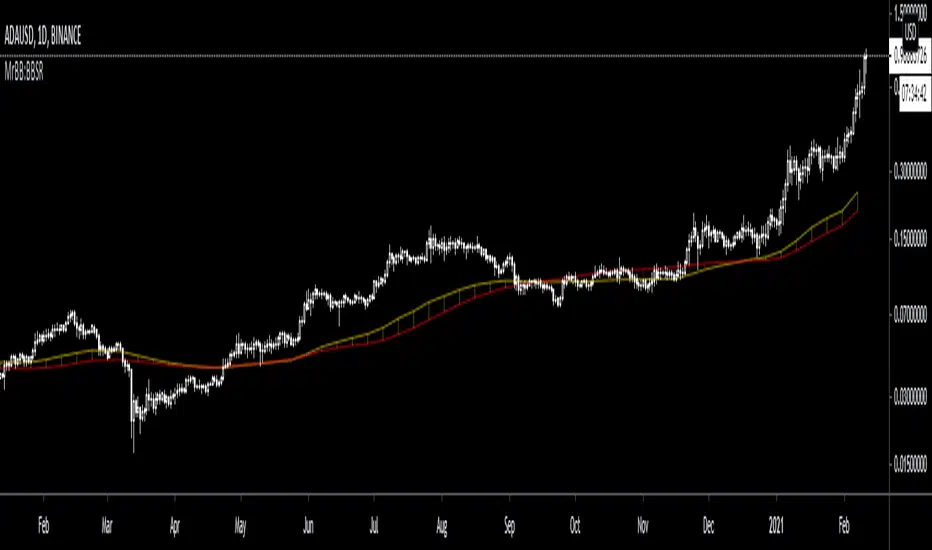
MrBB:BullBear Support BandVery simple and effective S/R band. Created bycombining the weekly 21EMA and weekly 20SMA, it provides strong support/resistance depending on market direction, and works as a basing area for retraces during parabolic (and normal) bull markets.
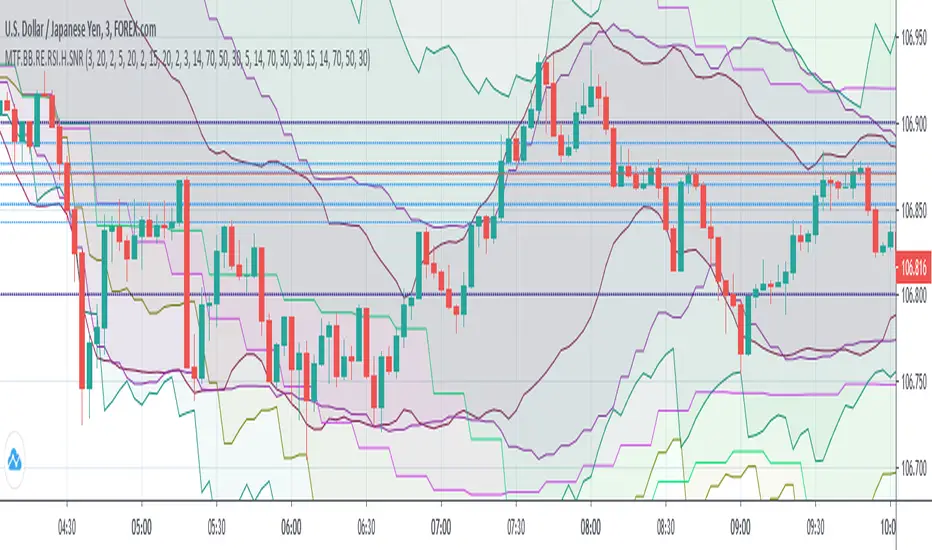
(MTF) Bollinger Bands + RE RSIs + Hidden Supports & ResistancesI merged some of my previous written indicators, because a combination of multi-timeframe Bollinger Bands, RE RSI and Resistance/Support levels could help a lot.
Don't forget to add my other useful indicator (Classical SnR) to the chart to maximize your profit!
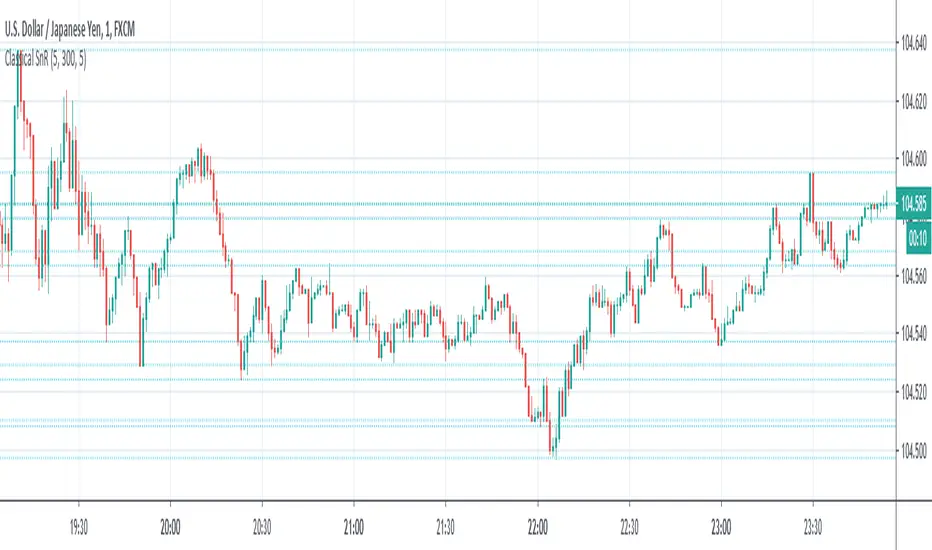
Classical Supports & ResistancesThis indicator shows classical resistance and support levels which retraced the chart lately. Notice that the condensed lines laying close together are showing an area of support and/or resistance.
But after all, it was a tedious work creating this indicator because like I've already said, pine script is a very odd and weak language which does not have many ordinary features like useful loops, simple line drawing and even reasonable variable casting!
So I was forced to use its built-in pivothigh() and pivotlow() functions without any handy documentation. I assume that even these functions don't work as expected, and because of that, I embedded "Sensitivity" and "Lookback Time" options in the indicator as a workaround.
Feel free to use it and send me your comments/solutions.
Dynamic Support Resistance Zones======================================================================
TRADINGVIEW PUBLICATION - DYNAMIC SUPPORT RESISTANCE ZONES
======================================================================
TITLE: Dynamic Support Resistance Zones
SHORT TITLE: SR Zones
--------------------------------------------------------------------------------
DESCRIPTION (Copy below for TradingView publication)
--------------------------------------------------------------------------------
The Dynamic Support Resistance Zones indicator identifies key price levels where potential reversals may occur by analyzing candlestick behavior and volume dynamics together.
▶ CONCEPT AND METHODOLOGY
This indicator detects support and resistance levels through a specific combination of three market conditions occurring simultaneously:
1. Candlestick Body Expansion: The current candle's body (distance between open and close) must be larger than the previous candle's body. This signals increased price commitment from market participants.
2. Direction Reversal: The current candle must close in the opposite direction of the previous candle. A bullish candle following a bearish candle suggests potential support formation, while a bearish candle following a bullish candle suggests potential resistance formation.
3. Volume Contraction: The current candle must have lower volume than the previous candle. This condition filters out high-volume breakout moves and focuses on exhaustion patterns where price reverses on decreasing participation.
When all three conditions align, the indicator marks the opening price of the previous candle as a significant level.
▶ HOW LEVELS ARE CLASSIFIED
Support Zones (Green Lines): Form when a bullish reversal candle appears with an expanded body on declining volume. These represent areas where buying pressure overcame selling pressure.
Resistance Zones (Red Lines): Form when a bearish reversal candle appears with an expanded body on declining volume. These represent areas where selling pressure overcame buying pressure.
▶ DYNAMIC LEVEL MANAGEMENT
The indicator continuously monitors each level and updates its status:
- Active Levels (Solid Lines): Levels that have not been broken by a closing price. These extend forward automatically as new bars form.
- Broken Levels (Dashed Lines): When price closes beyond a level, it converts to a dashed line. These broken levels remain visible for potential retest scenarios.
- Level Removal: Broken support levels are removed if price closes back above them. Broken resistance levels are removed if price closes back below them. This keeps the chart clean and focused on relevant levels.
▶ TRADING APPLICATIONS
Reversal Trading: Look for price approaching active support or resistance levels for potential bounce trades.
Breakout Confirmation: When a solid level converts to dashed, it confirms a breakout. The dashed level then becomes a potential retest zone.
Trend Analysis: Multiple support levels stacking below price suggests bullish structure. Multiple resistance levels above price suggests bearish structure.
Risk Management: Active levels provide logical areas for stop-loss placement just beyond the identified zones.
▶ WHY THIS COMBINATION WORKS
The three-filter approach (body expansion + direction change + volume decline) identifies exhaustion reversals rather than continuation patterns. Large body candles show conviction, direction change shows momentum shift, and lower volume suggests the prior move is losing steam rather than breaking out with strength.
▶ SETTINGS
This indicator uses fixed detection logic with no adjustable parameters to maintain consistency. The colors are preset: green for support zones and red for resistance zones.
▶ BEST PRACTICES
- Works on all timeframes but higher timeframes typically produce more reliable levels
- Combine with trend analysis for directional bias
- Not all levels will hold; use proper risk management
- More effective in ranging or mean-reverting conditions than strong trending markets
--------------------------------------------------------------------------------
TAGS (for TradingView)
--------------------------------------------------------------------------------
support, resistance, reversal, volume, candlestick, levels, zones, price-action
--------------------------------------------------------------------------------
CATEGORY
--------------------------------------------------------------------------------
Support and Resistance
======================================================================

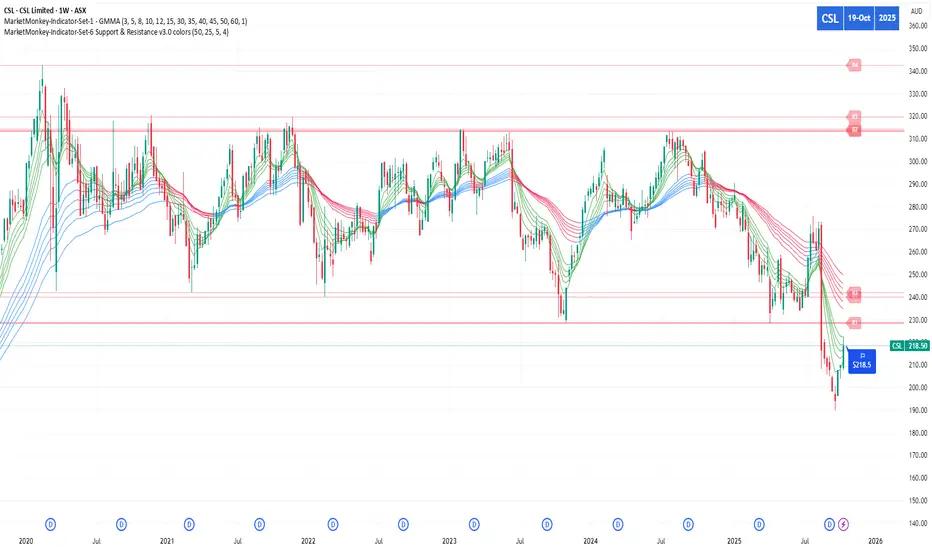
MarketMonkey-Indicator-Set-6 Support & Resistance v3.0 colorsMarketMonkey-Indicator-Set-6 Support & Resistance v3.0 colors
Automatically detects and plots up to four recent support and resistance levels using pivot highs and lows. Lines update dynamically with adaptive colours, highlighting key price zones in real time. Optional R1–R4 and S1–S4 labels keep charts clean yet informative. Ideal for identifying trend reversals, breakout points, and areas where buyers or sellers are likely to act.
________________________________________
🔍 What It Does
The script uses pivot highs and pivot lows to detect recent swing points — the moments where price has clearly turned.
• Resistance levels are drawn at recent pivot highs (red lines).
• Support levels are drawn at recent pivot lows (blue lines).
• Each level automatically updates as new price data forms, keeping your analysis current.
The indicator displays up to four recent resistance and support levels on each side (R1–R4, S1–S4), with labels and colours that adapt to whether the line is above or below current price.
________________________________________
🎨 Features
• Dynamic Detection: Automatically identifies and updates support and resistance using pivot logic.
• Multi-Level Display: Shows up to four most recent highs and lows for a broader market view.
• Customisable Inputs: Adjust the number of bars used to confirm pivots and control how many levels are displayed.
• Colour-Coded Clarity:
o Resistance lines = soft red tone (indicating potential ceiling levels).
o Support lines = soft blue tone (indicating price floors).
• Optional Labels: Toggle on/off “R1–R4” and “S1–S4” tags for quick reference.
• Strong Level Highlighting: The nearest (most recent) levels are drawn thicker for emphasis.
Volumetric Support and Resistance [BackQuant]Volumetric Support and Resistance
What this is
This Overlay locates price levels where both structure and participation have been meaningful. It combines classical swing points with a volume filter, then manages those levels on the chart as price evolves. Each level carries:
• A reference price (support or resistance)
• An estimate of the volume that traded around that price
• A touch counter that updates when price retests it
• A visual box whose thickness is scaled by volatility
The result is a concise map of candidate support and resistance that is informed by both price location and how much trading occurred there.
How levels are built
Find structural pivots uses ta.pivothigh and ta.pivotlow with a user set sensitivity. Larger sensitivity looks for broader swings. Smaller sensitivity captures tighter turns.
Require meaningful volume computes an average volume over a lookback period and forms a volume ratio for the current bar. A pivot only becomes a level when the ratio is at least the volume significance multiplier.
Avoid clustering checks a minimum level distance (as a percent of price). If a candidate is too close to an existing level, it is skipped to keep the map readable.
Attach a volume strength to the level estimates volume strength by averaging the volume of recent bars whose high to low range spans that price. Levels with unusually high strength are flagged as high volume.
Store and draw levels are kept in an array with fields for price, type, volume, touches, creation bar, and a box handle. On the last bar, each level is drawn as a horizontal box centered at the price with a vertical thickness scaled by ATR. Borders are thicker when the level is marked high volume. Boxes can extend into the future.
How levels evolve over time
• Aging and pruning : levels are removed if they are too old relative to the lookback or if you exceed the maximum active levels.
• Break detection : a level can be removed when price closes through it by more than a break threshold set as a fraction of ATR. Toggle with Remove Broken Levels.
• Touches : when price approaches within the break threshold, the level’s touch counter increments.
Visual encoding
• Boxes : support boxes are green, resistance boxes are red. Box height uses an ATR based thickness so tolerance scales with volatility. Transparency is fixed in this version. Borders are thicker on high volume levels.
• Volume annotation : show the estimated volume inside the box or as a label at the right. If a level has more than one touch, a suffix like “(2x)” is appended.
• Extension : boxes can extend a fixed number of bars into the future and can be set to extend right.
• High volume bar tint : bars with volume above average × multiplier are tinted green if up and red if down.
Inputs at a glance
Core Settings
• Level Detection Sensitivity — pivot window for swing detection
• Volume Significance Multiplier — minimum volume ratio to accept a pivot
• Lookback Period — window for average volume and maintenance rules
Level Management
• Maximum Active Levels — cap on concurrently drawn levels
• Minimum Level Distance (%) — required spacing between level prices
Visual Settings
• Remove Broken Levels — drop a level once price closes decisively through it
• Show Volume Information on Levels — annotate volume and touches
• Extend Levels to Right — carry boxes forward
Enhanced Visual Settings
• Show Volume Text Inside Box — text placement option
• Volume Based Transparency and Volume Based Border Thickness — helper logic provided; current draw block fixes transparency and increases border width on high volume levels
Colors
• Separate colors for support, resistance, and their high volume variants
How it can be used
• Trade planning : use the most recent support and resistance as reference zones for entries, profit taking, or stop placement. ATR scaled thickness provides a practical buffer.
• Context for patterns : combine with breakouts, pullbacks, or candle patterns. A breakout through a high volume resistance carries more informational weight than one through a thin level.
• Prioritization : when multiple levels are nearby, prefer high volume or higher touch counts.
• Regime adaptation : widen sensitivity and increase minimum distance in fast regimes to avoid clutter. Tighten them in calm regimes to capture more granularity.
Why volume support and resistance is used in trading
Support and resistance relate to willingness to transact at certain prices. Volume measures participation. When many contracts change hands near a price:
• More market players hold inventory there, often creating responsive behavior on retests
• Order flow can concentrate again to defend or to exit
• Breaks can be cleaner as trapped inventory rebalances
Conditioning level detection on above average activity focuses attention on prices that mattered to more participants.
Alerts
• New Support Level Created
• New Resistance Level Created
• Level Touch Alert
• Level Break Alert
Strengths
• Dual filter of structure and participation, reducing trivial swing points
• Self cleaning map that retires old or invalid levels
• Volatility aware presentation using ATR based thickness
• Touch counting for persistence assessment
• Tunable inputs for instrument and timeframe
Limitations and caveats
• Volume strength is an approximation based on bars spanning the price, not true per price volume
• Pivots confirm after the sensitivity window completes, so new levels appear with a delay
• Narrow ranges can still cluster levels unless minimum distance is increased
• Large gaps may jump past levels and immediately trigger break conditions
Practical tuning guide
• If the chart is crowded: increase sensitivity, increase minimum level distance, or reduce maximum active levels
• If useful levels are missed: reduce volume multiplier or sensitivity
• If you want stricter break removal: increase the ATR based break threshold in code
• For instruments with session patterns: tailor the lookback period to a representative window
Interpreting touches and breaks
• First touch after creation is a validation test
• Multiple shallow touches suggest absorption; a later break may then travel farther
• Breaks on high current volume merit extra attention
Multi timeframe usage
Levels are computed on the active chart timeframe. A common workflow is to keep a higher timeframe instance for structure and a lower timeframe instance for execution. Align trades with higher timeframe levels where possible.
Final Thoughts
This indicator builds a lightweight, self updating map of support and resistance grounded in swings and participation. It is not a full market profile, but it captures much of the practical benefit with modest complexity. Treat levels as context and decision zones, not guarantees. Combine with your entry logic and risk controls.

Dynamic Support and Resistance V2 | AnonycryptousThe Dynamic Support and Resistance V2 indicator, an easy tool to identify key support, resistance, trendline levels, pivot points and volume data.
Pivot Points.
Calculates support, resistance and trendline levels using pivot points, which are derived from the high, low, and close prices of previous trading periods.
Customize the pivot calculation by using Close' or 'High/Low' and adjusting the lookback periods for both the left and right sides of the pivot calculation.
Pivot points are crucial for forecasting potential market turning points, so it allows traders to adapt the indicator to different market conditions and timeframes.
By using pivot points, traders can spot reversal and consolidation levels or trendlines early on, allowing them to react to them in time.
Volume Levels.
This option focuses on identifying support and resistance levels based on volume data, specifically the Point of Control.
The POC is the highest traded volume price level during a time period.
This POC calculation, allow traders to areas of significant trading levels as support or resistance zones.
Volume-based levels gives insights into market sentiment and showes strong support and resistance based on trading volume.
Traders can choose between pivot-based and volume-based levels or use both simultaneously, depending on their analysis.
The indicator offers custom colors, so the trader can customize their visual analysis to their own style.
It calculates the importance of each level based on the number of touches and the duration it holds.
This indicator is intended for educational and informational purposes only and should not be considered financial advice.
Trading involves significant risk, and you should consult with a financial advisor before making any trading decisions.
The performance of this indicator is not guaranteed, and past results do not predict future performance.
Use at your own risk.

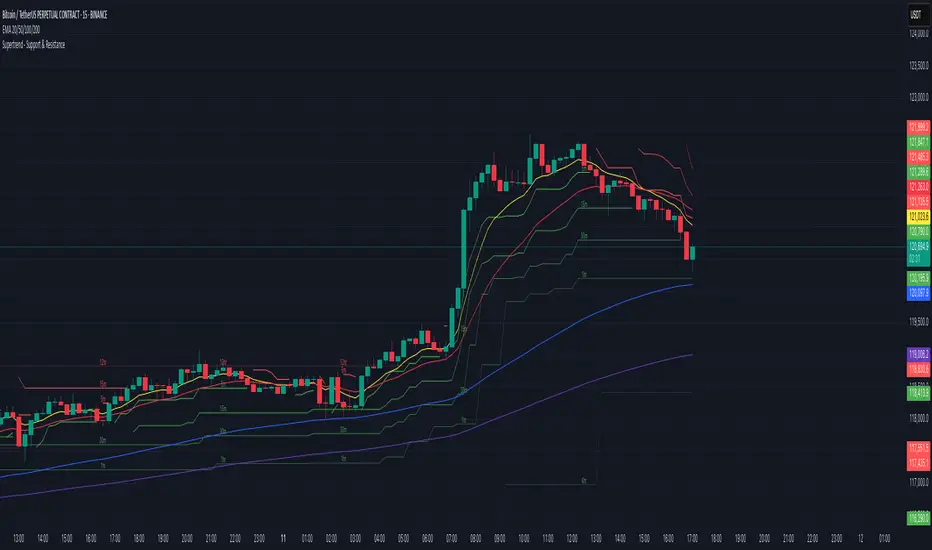
Supertrend - Support & ResistanceSupertrend – Multi-Timeframe Support & Resistance
This script overlays multiple Supertrend bands from higher timeframes on a single chart and treats them as dynamic support and resistance. The goal is simple: see the bigger picture without leaving your current timeframe.
What it does
• Calculates Supertrend using the same ATR Length and Factor across 5m, 15m, 30m, 1h, 4h, 8h, 12h, and 1D.
• Pulls each timeframe via request.security(..., lookahead_off) so values only update on candle close. No look-ahead, no “teleporting” lines.
• Plots each timeframe’s Supertrend as an on-chart band with increasing transparency the higher you go, so you can visually separate short-term vs higher-timeframe structure.
• Colors indicate direction:
• Green = bearish band above price (acting as resistance)
• Red = bullish band below price (acting as support)
• Drops compact labels (5m, 15m, 30m, etc.) every 20 bars right on the corresponding Supertrend level, so you can quickly identify which line belongs to which timeframe.
Why this helps
Supertrend is great for trend definition and trailing stops. But one timeframe alone can whipsaw you. By stacking multiple timeframes:
• Confluence stands out. When several higher-TF bands cluster, price often reacts.
• You see where intraday pullbacks are likely to pause (lower TF bands) and where trend reversals are more meaningful (higher TF bands).
• It’s easier to align entries with the dominant trend while still timing them on your working timeframe.
How it works (quick refresher)
Supertrend uses ATR to offset a median price with a multiplier (Factor). When price crosses the band, direction flips and the trailing line switches sides. This script exposes:
• ATR Length (default 10): sensitivity of the ATR. Smaller = tighter band, more flips. Larger = smoother, fewer flips.
• Factor (default 3.0): multiplier applied to ATR. Larger = wider band, more conservative.
The same settings are used for all timeframes for clean, apples-to-apples comparisons.
How to use it
• Trend alignment: Prefer longs when most higher-TF lines are below price (red support). Prefer shorts when most are above price (green resistance).
• Pullback entries: In an uptrend, look for pullbacks into a lower-TF red band that lines up near a higher-TF red band. That overlap is your “zone.”
• Breakout confirmation: A strong break and close beyond a higher-TF band carries more weight than a lower-TF poke.
• Stops and targets: Use the nearest opposing band as a logic point. For example, in a long, if price loses the lower-TF red band and the next higher-TF band is close overhead, trim or tighten.
Signals you can read at a glance
• Stacking: Multiple red bands beneath price = strong bullish structure. Multiple green bands above price = strong bearish structure.
• Compression: Bands from different TFs squeezing together often precede expansion.
• Flip zones: When a higher-TF band flips side, treat that level as newly minted support/resistance.
Design choices in the code
• lookahead_off on all request.security calls avoids repainting from future data.
• Increasing transparency as the timeframe rises makes lower-TF context visible without drowning the chart.
• Labels every 20 bars keep the chart readable while still giving you frequent anchors.
Good to know (limits and tips)
• This is an overlay of closed-bar Supertrend values from higher TFs. Intrabar moves can still exceed a band before close; final signal prints at candle close of that timeframe.
• Using the same ATR/factor across TFs makes confluence easier to judge. If you need independent tuning per TF, you can clone the security calls and add separate inputs.
• On very low timeframes with many symbols, multiple request.security calls can be heavy. If performance drops, hide one or two higher TFs or increase the label spacing.
Risk note
This is a context tool, not an auto-trader. Combine it with structure (HH/HL vs LH/LL), volume, and your execution rules. Always test on your market and timeframe before committing real capital.
weighted support or resistance linesQ: Why should users choose this script?
A: I found that in all the publicly available scripts about support and resistance lines, there is basically no weight identification for these lines. In other words, users do not know which support or resistance lines are the most important. So I specifically wrote this script.
1. By adjusting the weights, only the most effective support or resistance lines are displayed. (Length threshold of trend price (Bar))
2. By selecting the number of K-lines, only the latest number of support or resistance lines generated will be displayed. (Maximum number of reserved S/R lines)
3. By selecting whether to automatically remove lines, only support or resistance lines that have not been penetrated by the k-line will be displayed. If this function is checked, the weight can be adjusted lower, as high-weight SR may have already been penetrated, and the newly generated SR may have a lower weight. (Automatically remove lines penetrated by closing price confirmation)
4. Notes: The default parameters work well in 15-minute candlestick charts. For candlestick charts with other time periods, the parameters can be adjusted appropriately. It is suitable for sideways trading but not for strong trends.
5. I'm quite satisfied with the performance of the script, as I specifically optimized it, lol

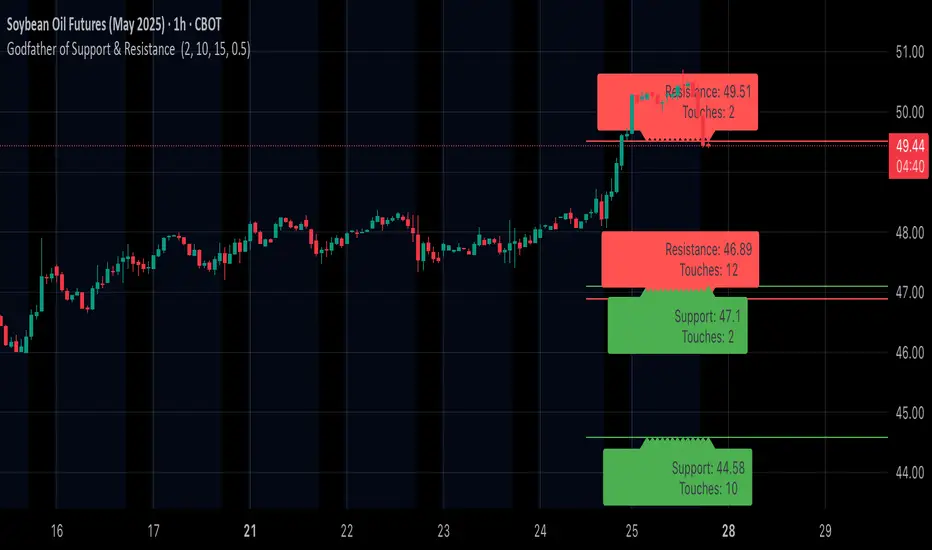
Godfather of Support & Resistance Godfather of Support & Resistance
Overview
The Godfather of Support & Resistance script is a powerful tool designed to help traders identify critical support and resistance levels on their charts. These price levels are vital for understanding market behavior, as they often act as turning points where prices reverse, consolidate, or break through. By automating the detection of these levels, this script simplifies your trading decisions and enhances your technical analysis.
How It Works
Pivot Points for Level Detection:
The script uses pivot points to identify potential support (lows) and resistance (highs) levels:
A pivot high is a local peak (a high surrounded by lower highs).
A pivot low is a local trough (a low surrounded by higher lows).
You can adjust the Pivot Length (pivotLen) input to control the sensitivity of detection. Smaller values detect more levels, while larger values focus on major levels.
Dynamic Grouping with Tolerance:
The script dynamically groups nearby price levels using a tolerance percentage. This tolerance is based on the level's price, making it adaptive to all types of assets (low- and high-priced).
For example, if the tolerance is set to 1% and a level is at $100, levels within $1 are grouped together.
Touch Count for Significance:
The script tracks how many times the price interacts with each level (touch count). Only levels that meet or exceed the Minimum Touches (minTouches) input are displayed on the chart. This ensures only meaningful levels are highlighted.
Clear Visual Representation:
Resistance Levels (Red Lines): Represent areas where the price tends to reverse downward.
Support Levels (Green Lines): Represent areas where the price tends to reverse upward.
Labels are added to each level (optional) to display the price and the number of touches for better decision-making.
Inputs You Can Customize
Minimum Touches to Show Level:
Set the minimum number of price interactions required for a level to be displayed.
Maximum Lines to Keep:
Limit the number of support and resistance lines displayed to keep your chart clean and focused.
Pivot Length:
Customize the sensitivity of pivot point detection. Smaller values detect more levels, while larger values focus on key levels.
Tolerance for Touch Detection (%):
Adjust the grouping tolerance as a percentage of the price. For example, 1% groups levels that are within 1% of each other.
How to Use
Apply the Script:
Add the script to your TradingView chart, and it will automatically detect and plot support and resistance levels.
Analyze the Levels:
Use Resistance Levels (red lines) as potential sell zones or areas to place stop-loss orders above.
Use Support Levels (green lines) as potential buy zones or areas to place stop-loss orders below.
Customize for Your Trading Style:
Adjust the inputs to match your preferred strategy and the timeframe or asset you're analyzing.
Example Use Case
Imagine you're analyzing a stock:
Resistance Level: The script identifies resistance at $150 with 3 touches. This might be a potential sell zone if the price struggles to break through.
Support Level: The script identifies support at $130 with 4 touches. This might be a potential buy zone if the price shows signs of bouncing upward.
Key Features
Automatically detects and plots support and resistance levels.
Tracks the number of price touches to filter out weak levels.
Adapts dynamically to price ranges using a percentage-based tolerance.
Fully customizable to suit different trading styles and assets.
Clean and professional chart display with a limit on the number of lines.
Notes
This script is for educational purposes only and should not be considered financial advice.
Always perform your own analysis and manage risk before making trading decisions.
Why Use This Script?
The Godfather of Support & Resistance script simplifies your trading decisions by automating the detection of critical price levels. Whether you're a beginner or an experienced trader, this script is designed to save you time and help you focus on making informed trades.
Start using it today to master the art of support and resistance trading!
Let me know if you need further refinements for this description!
DM Support / Resistance (USA Session)This indicator is specifically designed for use on the 4-hour time frame and helps traders identify key support and resistance levels during the USA trading session (9:30 AM to 4:00 PM Eastern Time). The indicator calculates important price levels to assist in making well-informed entry and exit decisions, particularly for those focusing on swing trades or longer-term intraday strategies. It also includes a feature to skip setups when relevant fundamental news is scheduled, ensuring you avoid trading during periods of high volatility.
Key Features:
Support and Resistance Levels (S1 & R1):
The indicator calculates and displays Support 1 (S1) and Resistance 1 (R1) levels, which act as key barriers for price action and help traders spot potential reversal or breakout zones on the chart.
Pivot Point (PP):
The Pivot Point (PP) is calculated as the average of the previous period's high, low, and close. It serves as a central reference point for market direction, allowing traders to evaluate whether the market is in a bullish or bearish trend.
Market Bias:
The Bias is shown as a histogram that helps traders assess the strength of the market trend. A positive bias suggests bullish sentiment, while a negative bias signals bearish conditions. This can be used to confirm the overall trend direction.
4-Hour Time Frame:
The indicator is optimized for the 4-hour time frame, making it suitable for traders looking for swing trades or those who wish to capture longer-term trends within the USA session. The key support, resistance, and pivot levels are recalculated dynamically to reflect price action over 4-hour periods.
Dynamic Plotting and Alerts:
Support and resistance levels are drawn as dashed horizontal lines, updating in real-time to reflect the most current market data during the USA session. Alerts can be set for significant price movements crossing these levels.
Stop-Loss Strategy Based on 15-Minute Time Frame:
A unique feature of this indicator is its stop-loss strategy, which uses 15-minute time frame support and resistance levels. When a long or short entry is triggered on the 4-hour chart, traders should place their stop-loss according to the relevant 15-minute support or resistance level.
If the price closes above the 15-minute support for a long entry, or closes below the 15-minute resistance for a short entry, it signals the need to exit or adjust your position based on these levels.
Fundamental News Filter:
To avoid unnecessary risk, the indicator incorporates a fundamental news filter. If there is relevant news scheduled during the USA session, such as high-impact economic data or central bank announcements, the indicator will skip the setup for that period. This prevents traders from entering positions during times of elevated volatility caused by news events, which could result in unpredictable price movements.
How to Use:
Long Entry: When the Bias is positive and the price breaks above Support 1 (S1), this signals a potential bullish move. Consider entering a long position at this point.
Stop-Loss Strategy: Set your stop-loss at the respective 15-minute support level. If the price closes below this level, it could signal a reversal, prompting you to exit the trade.
Short Entry: When the Bias is negative and the price breaks below Resistance 1 (R1), this signals a potential bearish move. Enter a short position at this point.
Stop-Loss Strategy: Set your stop-loss at the respective 15-minute resistance level. If the price closes above this level, exit the short trade as it could indicate a bullish reversal.
Pivot Point (PP): The Pivot Point serves as a reference level to gauge potential price reversals. A move above the PP suggests a bullish bias, while trading below the PP suggests a bearish outlook.
Bias Histogram: The Bias Histogram helps confirm trend direction. A positive bias confirms long positions, while a negative bias reinforces short trades.
Avoid Trading During High-Impact News: If there is significant economic news or fundamental events scheduled during the USA session, the indicator will automatically skip any potential setup. This feature ensures you avoid entering trades that might be affected by unexpected news-driven volatility, keeping your trading strategy safer and more reliable.
Why Use This Indicator:
The 4-hour time frame is ideal for traders who prefer swing trading or those looking to capture longer-term trends in a structured manner. This indicator provides crucial insights into market direction, support/resistance levels, and potential entry/exit points.
The stop-loss management based on the 15-minute support and resistance levels helps traders protect their positions from sudden price reversals, ensuring more precise risk management.
The fundamental news filter is particularly useful for avoidance of high-risk periods. By skipping setups during high-impact news events, traders can avoid entering trades when price volatility could be unpredictable.
Overall, this indicator is a powerful tool for traders who want to make data-driven decisions based on technical analysis while ensuring that their positions are managed responsibly and avoiding news-driven risk.

TQ's Support & Resistance(My goal creating this indicator): Provide a way to categorize and label key structures on multiple different levels so I can create a plan based on those observable facts.
The Underlying Concept / What is Momentum?
Momentum indicates transaction pressure. If the algorithm detects price is going up, that would be considered positive momentum. If the algorithm detects price is going down negative momentum would be detected.
The Momentum shown is derived from a price action pattern. Unlike my previous Support & Resistance indicator that used Super Trend, this indicator uses a unique pattern I created. On the first bar bearish momentum is detected a resistance Level is made at the highest point of the previous bullish condition. On the first bar bullish momentum is detected a support Level is made at the lowest point of the previous bearish condition. This happens on 5 different Momentum Levels, (short-term to long-term). I currently use this pattern to trade so the source code is protected.
What is Severity?
Severity is How we differentiate the importance of different Highs and Lows. If Momentum is detected on a higher level the Supply or Demand Level is updated. The Color and Size representing that Level will be shown. Demand and Supply Levels made by higher levels are more SEVERE than a demand level made by a lower level.
Technical Inputs
- to ensure the correct calculation of Support and Resistance levels change BAR_INDEX. BAR_INDEX creates a buffer at the start of the chart. For example: If you set BAR_INDEX to 300. The script will wait for 300 bars to elapse on the current chart before running. This allows the script more time to gather data. Which is needed in order for our dynamic lookback length to never return an error (Dynamic lookback length can't be negative or zero). The lower the timeframe the greater the number of bars need. For Example, if I open up a 1min chart I would enter 5000 as my BAR_INDEX since that will provide enough data to ensure the correct calculation of Support and Resistance levels. If I was on a daily chart, I would enter a lower number such as 800. Don't be afraid to play around with this.
- Toggle options (Close) or (High & Low) creates Support and Resistance Levels using the Lowest close and Highest close or using the Lowest low and Highest high.
Level Inputs
- The indicator has 5 Different Levels indicating SEVEREITY of a Supply and Demand Levels. The higher the Level the more SEVERE the Level.
Display Inputs
- You have the option to customize the Length, Width, Line Style, and Colors of all 5 different
- This indicator includes a Trend Chart. To Easily verify the current trend of any displayed by this indicator toggle on Chart On/Off. You also get the option to change the Chart Position and the size of the Trend Chart
How Trend Is being Determined?
(Close > Current Supply Level) if this statement is true technically price made a HH, so the trend is bullish.
(Close < Current Demand Level) if this statement is true technically price made a LL, so the trend is bearish.
- Fully customize how you display Market Structure on different levels. Line Length, Line Width, Line Style, and Line color can all be customized.
How it can be used?
(Examples of Different ways you can use this indicator): Easily categorize the severity of each and every Supply or Demand Level in the market (The higher Level the stronger the level)
: Quickly Determine the trend of any Level.
: Get a consistent view of a market and how different Levels are behaving but just use one chart.
: Take the discretion from hand drawing support and resistance lines out of your trading.
: Find and categorize strong levels for potential breakouts.
: Trend Analysis, use Levels to create a narrative based on observable facts from these Levels.
: Different Targets to take money off the table.
: Use Severity to differentiate between different trend line setups.
: Find Great places to move your stop loss too.

Support and Resistance LevelsSupport and Resistance Levels with Breaks – Amin & Taufik
The Support and Resistance Levels with Breaks indicator is designed to automatically detect support and resistance levels based on pivots (high and low points within a given period). It also highlights breakouts of these levels, confirmed by increased volume for additional validation.
Key Features:
✅ Automatic Support & Resistance Detection
Uses pivothigh and pivotlow to identify key support and resistance levels.
Red lines indicate resistance, while blue lines represent support.
✅ Breakout Confirmation with Volume
The indicator generates breakout signals when price breaks support or resistance with high volume.
A downside breakout is marked with a red "B" label above the candlestick.
An upside breakout is marked with a green "B" label below the candlestick.
✅ Bullish & Bearish Wick Detection (Rejections)
Additional signals for long wicks (candlestick shadows) indicating possible price reversals.
Bullish Wick (rejection at support) is marked with a green label.
Bearish Wick (rejection at resistance) is marked with a red label.
✅ Automatic Breakout Alerts
The indicator can send automatic notifications when support or resistance is broken with high volume.
How to Use:
1️⃣ Adjust the Left Bars and Right Bars parameters to fine-tune pivot sensitivity for detecting support & resistance.
2️⃣ Enable the Show Breaks option to see breakout confirmations with high volume.
3️⃣ Use this indicator alongside price action analysis and other indicators to confirm trade decisions.
🚀 Ideal for:
✔️ Scalping & Intraday Trading
✔️ Swing Trading & Trend Following
✔️ Breakout & Retest Confirmation
ℹ️ Note:
This indicator does not provide direct buy or sell signals. It is recommended to use it alongside other technical analysis tools, such as candlestick patterns, moving averages, and RSI, for more accurate decision-making.
📌 Developed by: Amin & Taufik
🔗 License: Attribution-NonCommercial-ShareAlike 4.0 (CC BY-NC-SA 4.0)
💬 If you find this indicator useful, don’t forget to like and comment on TradingView! 🚀

Auto-Support v 0.3The "Auto-Support v 0.3" indicator is designed to automatically detect and plot multiple levels of support and resistance on a chart. It aims to help traders identify key price levels where the market tends to reverse or consolidate. Here’s a breakdown of its functionality and goals:
Objective:
The primary objective of the Auto-Support v 0.3 indicator is to provide traders with a clear, visual representation of support and resistance levels. These levels are determined based on a predefined sensitivity parameter, which adjusts how tightly or loosely the indicator reacts to recent price movements. The indicator can be applied to any chart to assist in identifying potential entry and exit points for trades, enhancing technical analysis by displaying these important price zones.
Description:
Support and Resistance Calculation:
The indicator calculates multiple levels of support and resistance using the highest and lowest prices over a defined period. The "sensitivity" parameter, which ranges from 1 to 10, determines how sensitive the calculation is to recent price changes. A higher value increases the number of bars used to calculate these levels, making the levels more stable but less responsive to short-term price movements.
Visual Representation:
The support levels are drawn in green with a customizable transparency setting, while resistance levels are displayed in red with similar transparency controls. This visual representation helps traders identify these levels on the chart and see the strength or weakness of the support/resistance zones depending on the transparency setting.
Multiple Levels:
The indicator plots 10 distinct levels of support and resistance (from 1 to 10), which can offer a more granular view of price action. Traders can use these levels to assess potential breakout or breakdown points.
Customization:
Sensitivity: The sensitivity input allows traders to adjust how aggressively the indicator reacts to recent price data. This ensures flexibility, enabling the indicator to be tailored to different trading styles and market conditions.
Transparency: The transparency input adjusts the visual opacity of the support and resistance lines, making it easier to overlay the indicator without obscuring other chart elements.
Key Goals:
Dynamic Support/Resistance Identification: Automatically detect and display relevant support and resistance levels based on price history, removing the need for manual chart analysis.
Customizable Sensitivity: Offer a flexible method to adjust how the indicator identifies key levels, allowing it to fit different market conditions.
Clear Visualization: Provide easy-to-read support and resistance levels with customizable colors and transparencies, enhancing visual clarity and decision-making.
Multiple Levels: Display up to 10 levels of support and resistance, allowing traders to consider both short-term and longer-term price action when making trading decisions.
By using this indicator, traders can more effectively identify key price zones where price may reverse, consolidate, or break out, providing a solid foundation for developing trading strategies.

Dynamic Support & Resistance based on SMI CrossoverExplanation:
SMI Calculation: The script calculates the Stochastic Momentum Index (SMI) and its signal line using the specified input lengths.
Crossover Detection: It detects when the SMI crosses above (crossUp) or below (crossDown) its signal line.
Period Tracking: The script keeps track of up and down periods based on SMI crossovers. During an up period, it records the lowest low (support), and during a down period, it records the highest high (resistance).
Support and Resistance Levels: When a crossover occurs, it captures the highest or lowest value since the last crossover to define dynamic resistance and support levels.
Midline Calculation: The midline is calculated as the average of the current support and resistance levels.
Buy and Sell Signals: Buy signals are generated when the close price crosses above the midline, and sell signals are generated when it crosses below.
Plotting: The support, resistance, and midline are plotted on the upper chart. Buy and sell signals are indicated with arrows. Trendlines are added for visual clarity.
Note: This indicator should be used in conjunction with other analysis tools and is intended for educational purposes. Always perform thorough analysis before making trading decisions.
Like all technical indicators, this script is based on historical data and may not predict future market movements.
Always perform due diligence and consider multiple factors when making trading decisions.

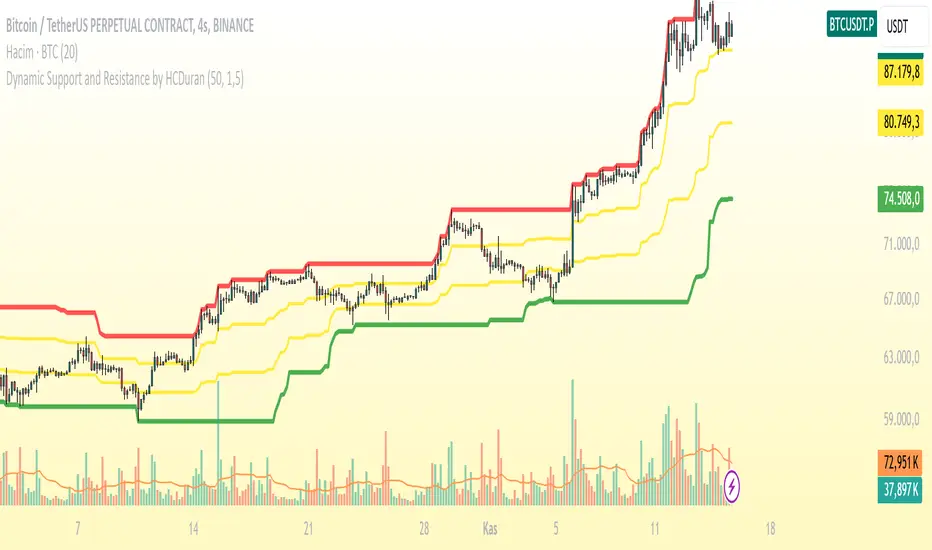
Dynamic Support and Resistance by HCDuranThis indicator dynamically plots support and resistance levels based on price action. It calculates the strongest support and resistance levels using the highest and lowest prices over a specified period, and visualizes these levels with different colors. Strong support and resistance are marked in **green** and **red** respectively, while **mid-range** support and resistance levels are displayed in **yellow**.
### Features:
- **Strong Support (Green):** The lowest price level over the last 50 bars.
- **Strong Resistance (Red):** The highest price level over the last 50 bars.
- **Mid Support (Yellow):** A support level above the strong support but below the resistance range.
- **Mid Resistance (Yellow):** A resistance level below the strong resistance but above the support range.
### Usage:
1. **Support and Resistance:** The indicator calculates dynamic support and resistance levels based on the most recent price action over a specified lookback period (e.g., 50 bars). These levels are then plotted on the chart for easy visualization.
2. **Alerts:** Alerts are triggered when the price crosses below the strong support or above the strong resistance. This can be useful for identifying potential breakouts or reversals.
### Help for Users:
This indicator helps to identify potential price reversal points by plotting dynamic support and resistance levels. Strong support or resistance levels can indicate areas where the price is likely to reverse, while mid-range levels can provide additional insights into price trends and ranges.
**Note:** The performance of this indicator may vary depending on the selected lookback period and time frame. It is recommended to experiment with different timeframes to see how the indicator performs under various market conditions.
-------------------------------------------------------------------------------------------------------------------
Bu indikatör, fiyat hareketlerine dayalı olarak dinamik destek ve direnç seviyelerini çizer. En yüksek ve en düşük seviyeler arasındaki farkı göz önünde bulundurarak, güçlü direnç ve destek seviyelerini kırmızı ve yeşil renklerle, orta seviyeleri ise sarı renk ile gösterir.
### Özellikler:
- **Güçlü Destek (Yeşil):** En düşük fiyat seviyesinin 50 barlık bir zaman dilimi boyunca belirlenen seviyesi.
- **Güçlü Direnç (Kırmızı):** En yüksek fiyat seviyesinin 50 barlık bir zaman dilimi boyunca belirlenen seviyesi.
- **Orta Destek (Sarı):** Destek seviyesinin üstünde, ancak güçlü destek seviyesinden daha yüksek bir seviyedir.
- **Orta Direnç (Sarı):** Direnç seviyesinin altında, ancak güçlü direnç seviyesinden daha düşük bir seviyedir.
### Kullanım:
1. **Destek ve Direnç:** Bu indikatör, belirli bir süre dilimindeki fiyat hareketlerine dayalı olarak destek ve direnç seviyelerini belirler ve çizer. Fiyat bu seviyelere yaklaşırken, seviyelerin ne kadar güçlü olduğunu görsel olarak değerlendirebilirsiniz.
2. **Uyarılar:** İndikatör, fiyatın güçlü destek seviyesinin altına düşmesi veya güçlü direnç seviyesinin üstüne çıkması durumunda uyarılar tetikler. Bu, trade kararları alırken önemli sinyaller sağlayabilir.
### Kullanıcıya Yardım:
Bu indikatör, dinamik destek ve direnç seviyeleri belirleyerek, potansiyel geri dönüş noktalarını ve fiyat hareketinin yönünü anlamaya yardımcı olur. Fiyatın güçlü seviyeleri kırması, önemli trade fırsatları gösterebilir.
**Not:** İndikatörün performansı, bakılan zaman dilimine ve seçilen lookback periyoduna göre değişebilir. Farklı zaman dilimlerinde kullanarak daha doğru sinyaller elde edebilirsiniz.
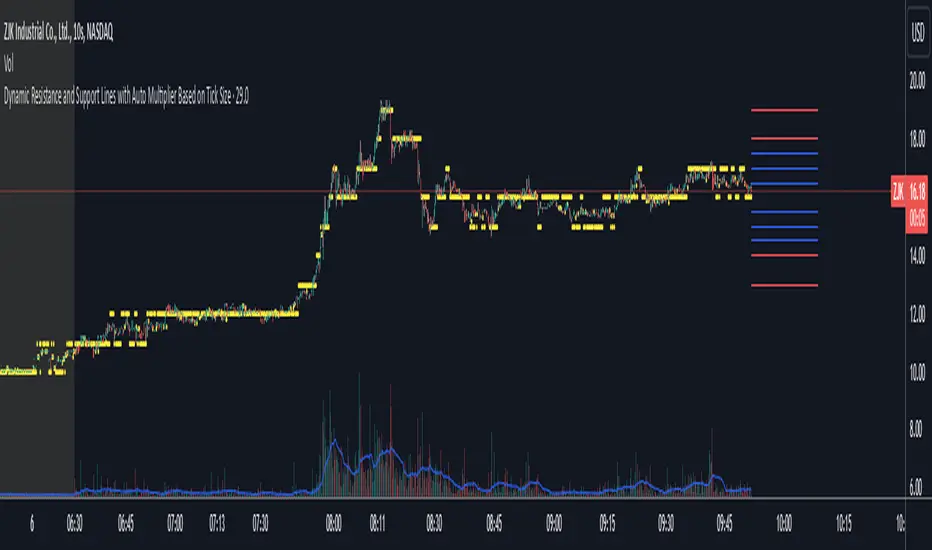
Dynamic Resistance and Support LinesThis script is designed to dynamically plot support and resistance lines based on full-dollar and half-dollar price levels relative to the close price on a chart. The script is particularly useful for day traders and scalpers, as it helps visualize key psychological price levels that often act as support and resistance zones in volatile and fast-moving markets in real time.
Key Features:
Dynamic Resistance and Support Levels:
Full-dollar levels: These are calculated by rounding the close price to the nearest full dollar and then extending the levels by adding and subtracting increments of 1 (e.g., $1, $2, $3).
Half-dollar levels: These are calculated by adding and subtracting 0.5 increments to the nearest full-dollar price, providing additional reference points. The historical full-dollar levels remain where support and resistance may have occurred in the past.
Extend Lines:
You can toggle whether the support and resistance lines are extended to the right, left, or both directions. This allows flexibility in projecting potential future areas of support or resistance.
Custom Line Extension:
The user can set the number of bars (or time periods) that the support and resistance lines will extend, giving control over how long the levels remain on the chart.
Color-Coded Lines:
Red lines represent full-dollar resistance and support levels.
Blue lines represent half-dollar levels, making it easy to differentiate between key psychological price zones.
Line Flexibility:
The script allows the lines to extend both left and right on the chart, making it useful for analyzing historical price action or projecting future price movements. The number of bars for extension is customizable, allowing for tailored setups.
Nearest Full Dollar Plot:
The nearest full-dollar price level is plotted as a yellow circle on the chart. This serves as a quick visual cue for traders to monitor price proximity to critical levels.
Benefits in Day Trading, Scalping, and Volatile Markets:
Visualizing Key Psychological Levels:
Full-dollar and half-dollar price levels often act as psychological barriers for traders. This script helps traders easily identify these levels, which are important in both fast-moving markets and during sideways consolidation.
Improved Decision-Making:
By automatically drawing these support and resistance levels, the script helps day traders and scalpers make quicker and more informed decisions, especially in volatile markets where every second counts.
Adaptability to Market Conditions:
The flexibility of extending lines based on trader preferences allows the user to adapt the script to various market conditions, such as high volatility or trend-based trading, providing a clear view of potential breakout or reversal areas.
Better Risk Management:
Having predefined support and resistance levels helps traders better manage risk, as these levels can act as logical areas for setting stop losses or taking profits.
This script is especially valuable for traders looking to capitalize on quick market movements or identify key entry and exit points during market volatility.
CARNAC Trading - Dynamic Support and Resistance LevelsThe **CARNAC Trading - Dynamic Support and Resistance Levels** indicator is designed to help traders identify key support and resistance levels on any chart timeframe. This indicator dynamically detects major support and resistance levels based on historical price pivots and displays them as lines on the chart. The levels are color-coded for easy identification—**green lines** represent support levels below the current price, while **red lines** represent resistance levels above the current price.
Key Features:
- Dynamic Support/Resistance Detection**: Automatically identifies the strongest support and resistance levels on the chart.
- Timeframe Selection**: Allows users to choose a specific timeframe for detecting support and resistance levels, independent of the chart's timeframe.
- Pivot Strength and Lookback Period**: Customizable inputs to control how far back the indicator looks and how strong the pivots need to be for support/resistance detection.
- Level Limitation**: Limits the number of support and resistance lines to keep charts clean, ensuring only the most relevant levels are displayed.
---
How to Use the Indicator:
Inputs and Settings:
1. **Lookback Period**: Defines how many bars back the indicator will consider for detecting support and resistance levels. You can adjust this depending on how much historical data you want to include. A larger value will capture more significant levels, while a smaller value focuses on more recent price action.
2. **Pivot Strength**: This setting determines how significant a high or low must be to qualify as a pivot. A higher pivot strength will capture stronger, more critical levels, while a lower value will detect more frequent, minor pivots.
3. **Max Levels Above/Below Price**: This controls the maximum number of support and resistance levels displayed on each side of the current price. Keeping this number low helps reduce clutter and focuses on the most important levels.
4. **Timeframe for Support/Resistance Detection**: Select the timeframe used for detecting support and resistance levels, which can differ from the chart's timeframe. This is helpful when you're trading on shorter timeframes but want to see key levels from a higher timeframe (e.g., detecting daily levels while trading intraday).
---
Visualization:
- **Green Lines**: Represent support levels below the current price. These are potential areas where buying interest may increase, and the price could bounce upwards.
- **Red Lines**: Represent resistance levels above the current price. These are potential areas where selling interest may increase, and the price could fall downwards.
---
Example Usage:
1. **Identifying Support and Resistance Zones**: Use this indicator to identify critical support and resistance zones. These are areas where the price has historically reversed or paused, making them ideal for setting entry, exit, stop-loss, or take-profit levels.
2. **Trend Analysis**: By observing which side of the current price the majority of lines are on (more red or more green), traders can gauge whether the market is facing more resistance or support, helping them align with the current trend.
3. **Timeframe Flexibility**: You can choose to detect support and resistance levels from higher timeframes (e.g., Daily or Weekly) while trading on lower timeframes (e.g., 15-minute or 1-hour charts). This gives you a macro-level view of key price levels while executing trades on the micro-level.
---
Recommendations:
- **Swing Traders**: Use this indicator with a larger lookback period and higher pivot strength to capture major long-term support and resistance levels.
- **Scalpers and Intraday Traders**: Use shorter lookback periods and lower pivot strengths to detect key levels within a shorter timeframe.
By customizing the inputs and tailoring them to your trading style, this indicator can provide valuable insights into price levels where significant buying or selling activity is likely to occur, helping you make more informed trading decisions.