Market Structure Pivots TrendThis indicator identifies and visualizes key market structure by plotting confirmed, non-repainting pivot points. It goes beyond simple markers by classifying the pivots, extending dynamic support/resistance lines, and providing a visual representation of the current trend state.
Key Features:
Non-Repainting Pivot Detection:
Uses a standard lookback method (left and right bars) to identify historical pivot points.
Note on Confirmation: Pivots are only confirmed after the Pivot Right Bars input has passed. This is essential for ensuring the signal is non-repainting, but it introduces an inherent lag.
Automatically classifies the sequence of pivots according to Dow Theory: Higher Highs (HH), Higher Lows (HL), Lower Highs (LH), and Lower Lows (LL).
Pivot Classification Filter:
Price Tolerance Filter: A user-defined percentage tolerance filters out insignificant market noise. A pivot is only classified as 'Higher' or 'Lower' if its price exceeds the previous one by more than the set tolerance, leading to more robust signals.
Equal Pivot Detection: The tolerance also enables the detection of Equal Highs (EH) and Equal Lows (EL), highlighting consolidation zones.
Dynamic Support & Resistance Lines:
When enabled, the indicator extends a horizontal line from the most recent confirmed pivot high and low.
These lines update in real-time, providing clear S/R levels.
Lines automatically terminate if the price decisively breaks through them or if a new pivot of the same type is formed.
Trend State Visualization:
A built-in state machine analyzes the sequence of pivots and breaks to determine the current market trend (Uptrend, Downtrend, or Neutral).
Plots a dynamic step-line based on recent highs/lows to visually represent the current trend state.
Full Customization & Alerts:
Display Options: Choose between simple triangles or detailed text labels that show the pivot type, price, and the absolute or relative change from the previous pivot of the same type.
Visual Styling: Full control over colors for all six pivot types (HH, LH, EH, LL, HL, EL) and line styles.
Comprehensive Alerts: Set up alerts for every new pivot formation (e.g., HH, LL), for S/R line breaks, and for changes in the overall trend state (Up, Down, Neutral).
DISCLAIMER
For Informational/Educational Use Only: This indicator is provided for informational and educational purposes only. It does not constitute financial, investment, or trading advice, nor is it a recommendation to buy or sell any asset.
Use at Your Own Risk: All trading decisions you make based on the information or signals generated by this indicator are made solely at your own risk.
No Guarantee of Performance: Past performance is not an indicator of future results. The author makes no guarantee regarding the accuracy of the signals or future profitability.
No Liability: The author shall not be held liable for any financial losses or damages incurred directly or indirectly from the use of this indicator.
Signals Are Not Recommendations: The alerts and visual signals (e.g., crossovers) generated by this tool are not direct recommendations to buy or sell. They are technical observations for your own analysis and consideration.
"support resistance" için komut dosyalarını ara

EMA100 Breakout by shubhThis indicator is a clean, price-action-based breakout system designed for disciplined trend trading on any timeframe — especially for Nifty and Bank Nifty spot, futures, and options charts.
It uses a single 100-period EMA to define trend direction and waits for decisive candle closes across the EMA to trigger potential entries.
The logic ensures only one active trade at a time, enforcing patience and clarity in decision-making.
⚙️ Core Logic
Buy Setup
A bullish candle closes above the 100 EMA while its open was below the EMA.
Entry occurs at candle close.
Stop-Loss (SL): Low of the signal candle.
Target (TP): 4 × the SL distance (Risk : Reward = 1 : 4).
Sell Setup
A bearish candle closes below the 100 EMA while its open was above the EMA.
Entry occurs at candle close.
Stop-Loss (SL): High of the signal candle.
Target (TP): 4 × the SL distance.
Trade Management
Only one trade may run at a time (either long or short).
New signals are ignored until the current position hits SL or TP.
Transparent labels show Entry, SL, and TP levels on chart.
Dotted lines visualize active Stop-Loss (red) and Target (green).
Exit markers:
✅ Target Hit
❌ Stop Loss Hit
🧠 Key Advantages
Simple and transparent trend-following logic.
Enforces disciplined “one-trade-at-a-time” behavior.
High risk-to-reward (1 : 4).
Works across timeframes — 5 min to Daily.
Ideal for intraday and positional setups.
📊 Suggested Use
Apply on Nifty / Bank Nifty spot or futures charts.
Works on any instrument with clear momentum swings.
Best confirmation when EMA 100 acts as dynamic support/resistance.
⚠️ Disclaimer
This script is for educational and research purposes only.
It is not financial advice or an invitation to trade.
Always backtest thoroughly and manage risk responsibly before applying in live markets.

Murrey Math SMA up to 32s Murrey Math SMA up to 32s is a highly advanced Pine Script v5 indicator that combines Murrey Math Lines (MML) with a customizable moving average (MA) — including a non-repainting Rolling VWAP (RVWAP) — and dynamic color-coded support/resistance bands up to 1/32 subdivisions. It projects octave-based geometric price levels (like Gann) centered on your chosen MA, with adaptive scaling, angle-based trend coloring, and absolute/extended MML bands. Includes 1/8, 1/16, and 1/32 grid lines, shaded zones, labels, and a live increment display.Core FeaturesFeature
Description
MA Types
SMA, VWMA, VWAP, Period VWAP, RVWAP (rolling VWAP over fixed or adaptive time window)
Murrey Math Grid
Auto-scaled 0/8 to 8/8 + extensions (±3/8), with 1/16 & 1/32 subdivisions
Dynamic Coloring
Bands colored by MA slope angle (bullish/bearish) or absolute MML shift
RVWAP Engine
Non-repainting volume-weighted average over user-defined or adaptive time steps
Wick Filtering
Optional ignore wicks for cleaner MML framing
Resolution Support
Works with higher timeframe data via request.security()
Key Use Cases Use Case
How to Use
1. Precision Support & Resistance
Treat 4/8 (mid) as pivot, 0/8 & 8/8 as extremes. Price often reverses or accelerates at these levels.
2. Mean Reversion Trades
Buy near 0/8–1/8 (oversold), sell near 7/8–8/8 (overbought) when MA is flat or sloping mildly.
3. Trend Continuation
When MA angle > threshold and price breaks 5/8, expect move to 8/8. Confirm with volume.
4. Breakout Entries
Watch for close beyond 8/8 or 0/8 + MA angle steep → strong momentum breakout.
5. Scalping with 1/32 Grid
Use 1/32 lines as micro-targets in ranging markets or after news spikes.
6. Volume-Weighted Fair Value
RVWAP = true average price paid over time → anchor for institutional fair value.
Visual Layout (MA-Centered)
+3/8 ───┐
+2/8 ───┤ ← Strong resistance
+1/8 ───┤
8/8 ███┤ ← Overbought (red zone)
7/8 ───┤
6/8 ███┤
5/8 ───┤
4/8 ███┤ ← Midline (pivot)
3/8 ───┤
2/8 ███┤
1/8 ───┤
0/8 ███┤ ← Oversold (green zone)
-1/8 ───┤
-2/8 ───┤
-3/8 ───┘
Shaded: 0/8–1/8 (buy), 7/8–8/8 (sell), 3/8–5/8 (neutral/consolidation)
MA Line: Orange (RVWAP) or hidden
Labels: Bottom, 1/4, Mid, 3/4, Top (offset to the right)
Table: Shows current Increment size
Best For Swing & scalp traders on stocks, forex, crypto
Volume-based strategies (RVWAP shines in high-volume moves)
Gann/Murrey Math enthusiasts wanting automation + modern MA anchoring

VMMA Ribbon + Q1/Q3 Echo Rayssimulates a series of vwma lines in a wave. Basically puts them in an array and calculates highest lowest values among other things ... The VMMA Ribbon + Q1/Q3 Echo Rays is a Pine Script v5 indicator that combines a dynamic Volume-Weighted Moving Average (VWMA) ribbon with interactive support/resistance "echo rays" based on the ribbon’s inner quartiles (Q1 and Q3). The ribbon is built from multiple VWMAs of increasing lengths, forming a band with an upper edge, lower edge, midline, and Q1/Q3 lines (representing the 25th and 75th percentiles of the band).
Edges are colored by slope (bullish = green, bearish = red) or use a default color.
Echo rays extend horizontally from recent swing lows in Q1 and swing highs in Q3, acting as dynamic support/resistance levels that "echo" past extremes until broken or surpassed.
Key Use CasesUse Case
Description
1. Trend Strength & Direction
Ribbon expansion = volatility; compression = consolidation. Slope-colored edges show momentum shifts early.
2. Dynamic Support & Resistance
Q1/Q3 echo rays mark high-probability reversal zones. Price respecting rays = continuation; break = reversal.
3. Mean Reversion Entries
Buy near Q1 ray in uptrend (oversold within band); sell near Q3 ray in downtrend.
4. Breakout Confirmation
Price breaking upper/lower edge + Q3/Q1 ray termination confirms strong breakout.
5. Volume-Weighted Context
Uses VWMA → more reactive to volume spikes than SMA → better for stocks/crypto with sudden volume surges.

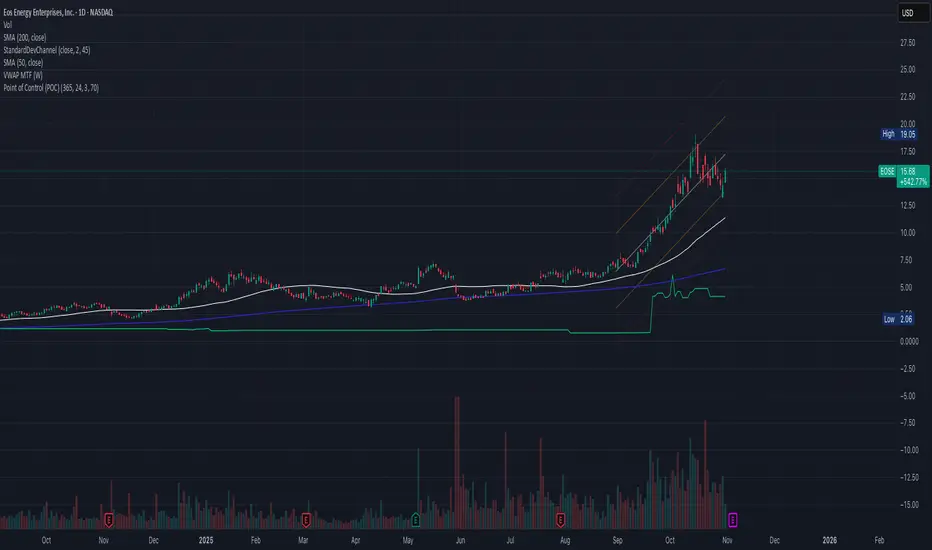
Point of Control (POC)**Point of Control (POC) Indicator**
This indicator identifies the price level where the most trading volume occurred over a specified lookback period (default: 365 days). The POC represents a significant support/resistance level where the market found the most acceptance.
**Key Features:**
- **POC Line**: Bright green horizontal line showing the highest volume price level
- **Volume Profile Analysis**: Divides price range into rows and calculates volume distribution
- **Value Area (Optional)**: Shows VAH and VAL levels containing 70% of total volume
- **Customizable**: Adjust lookback period, price resolution, colors, and line width
**How to Use:**
- POC acts as a magnet - price often returns to test these high-volume levels
- Strong support/resistance zone where significant trading activity occurred
- Useful for identifying key price levels for entries, exits, and stops
- Higher lookback periods (365 days) show longer-term significant levels
**Settings:**
- Lookback Period: Number of bars to analyze (default: 365)
- Price Rows: Calculation resolution - higher = more precise (default: 24)
- Toggle Value Area High/Low for additional context
---
AutoPivot Levels with Alerts [ChartWhizzperer] – Dynamic EditionAuto-Pivot Levels 4 methods with alerts – Dynamic Edition
Now with
- Live Mode
- 4 Pivot Methods
- 7 Session Types (5m, 15m, 30m, Hourly, Daily, Weekly, Monthly)
- PineConnector-Ready Alerts!
Free, Open Source, Pine Script v6-compliant.
NEW: Live Mode (Ultra-Dynamic, Repainting) – Switchable in UI!
Instantly switch between Classic (session-based, repaint-free) and Live (rolling window, real-time, repainting) using the simple checkbox in the settings!
Live Mode recalculates all pivots on every tick/bar, using the current high/low/close for the chosen session (5m, 15m, 30m, hourly, daily, weekly, monthly).
Perfect for:
- Scalping and high-frequency trading
- Real-time bot/automation setups (PineConnector-ready)
- Fast-moving or breakout markets
Classic Mode: For traditional, stable levels based on confirmed session data – ideal for backtesting and trading history.
Four Calculation Methods (Choose What Fits YOU)
1. Classic
Standard pivot calculation.
Based on previous session’s High, Low, Close.
Simple, proven, and suitable for any asset.
2. Fibonacci
Projects levels using Fibonacci ratios of the prior session’s range.
Great for traders who want to align pivots with fib retracements and extensions.
3. Camarilla
Uses unique multipliers for support/resistance, focusing on mean reversion and volatility.
Popular among futures and forex day traders.
4. Woodie
Puts extra weight on previous Close for more responsive pivots.
Often used in trending or choppy conditions.
Switch methods anytime in the UI – the script recalculates instantly and keeps your chart clean!
Level-Specific Alerts – PineConnector Ready!
Dedicated alert for EVERY level and direction (Up/Down):
Pivot (P), R1, R2, R3, S1, S2, S3
No configuration hassle:
All alerts are pre-defined in the TradingView Alert Panel and work across all session types (5m → monthly).
Machine-readable message format:
PIVOT=R1 DIR=UP SYMBOL={{ticker}} PRICE={{close}}
Direct plug-and-play with PineConnector, webhooks, Discord, Telegram, bots, and other automation tools.
Never miss a breakout, reversal, or key support/resistance touch!
Powerful Customization & Performance
- Session selection: 5m, 15m, 30m, Hourly, Daily, Weekly, Monthly (choose what suits your trading style).
- Show/hide any level (Pivot, R1–R3, S1–S3) for minimal chart clutter.
- Color selection for each level to match your theme or highlight key pivots.
- Auto-cleanup: Old lines and labels are cleared on every recalculation or session change for maximum performance and visual clarity.
- Zero runtime errors: Strict Pine Script v6 practices for stability.
How To Use – Quick Start
1) Add the indicator to your TradingView chart.
2) Pick your calculation method (Classic, Fibonacci, Camarilla, Woodie).
3) Set session type (5m, 15m, 30m, Hourly, Daily, Weekly, Monthly).
4) Switch between Classic and Live Mode with a single click in settings.
5) Customize your levels (on/off, colors).
6) Open the Alert Panel, select any pre-configured alert (e.g. "R2 Cross Down"), and go live!
7) Connect with PineConnector or any webhook system instantly using the pre-formatted alert messages.
Who Is It For?
- Active scalpers & bot traders: Live Mode + PineConnector-ready alerts = instant, automated reactions.
- Swing and position traders: Use Classic Mode for stable, repaint-free levels.
- Strategy developers: Seamless integration into automated and manual trading workflows.
License & Community
Open Source, Non-Commercial:
Free for personal & educational use under CC BY-NC-SA 4.0.
Feedback, bug reports & ideas:
Drop a comment, or contact me for feature requests.
Trade smart. Trade dynamic. Unlock the true power of pivots – with ChartWhizzperer!

Gold 15m: Trend + S/R + Liquidity Sweep (RR 1:2)This strategy is designed for short-term trading on XAUUSD (Gold) using the 15-minute timeframe. It combines trend direction, support/resistance pivots, liquidity sweep detection, and momentum confirmation to identify high-probability reversal setups in line with the dominant market trend.
⚙️ Core Logic:
Trend Filter (EMA 200):
The strategy only takes long positions when price is above the 200 EMA and short positions when price is below it.
Support/Resistance via Pivots:
Dynamic swing highs and lows are identified using pivot points. These act as local supply and demand levels where liquidity is likely to accumulate.
Liquidity Sweep Detection:
A bullish liquidity sweep occurs when price briefly breaks below the last pivot low (grabbing liquidity) and then closes back above it.
A bearish sweep occurs when price breaks above the last pivot high and then closes back below.
Momentum & Candle Strength:
The strategy filters signals based on candle range and body size to ensure entries occur during strong price reactions, not weak retracements.
Risk Management (1:2 RR):
Stop-loss is placed slightly beyond the last pivot level using ATR-based buffers, and take-profit is set at 2× the risk distance, maintaining a reward-to-risk ratio of 1:2.
💼 Trade Logic Summary:
Long Entry:
After a bullish liquidity sweep & reclaim, momentum confirmation, and trend alignment (above EMA 200).
Short Entry:
After a bearish sweep & reclaim, momentum confirmation, and trend alignment (below EMA 200).
Exit:
Automated via ATR-based Stop Loss and Take Profit targets.
📊 Customization Options:
Adjustable EMA length, pivot settings, ATR multipliers, and RR ratio.
Option to enable/disable trend filter.
Toggle display of S/R zones on chart.
🧠 Best Use:
Works best during London and New York sessions when Gold shows strong momentum.
Can be adapted for forex pairs and indices by tuning ATR and pivot parameters.

Ichimoku Average with Margin█ OVERVIEW
“Ichimoku Average with Margin” is a technical analysis indicator based on an average of selected Ichimoku system lines, enhanced with a dynamic safety margin (tolerance). Designed for traders seeking a simple yet effective tool for trend identification with breakout confirmation. The indicator offers flexible settings, line and label coloring, visual fills, and alerts for trend changes.
█ CONCEPT
The Ichimoku Cloud (Ichimoku Kinko Hyo) is an excellent, comprehensive technical analysis system, but for many traders—especially beginners—it remains difficult to interpret due to multiple overlapping lines and time displacements.
Experimentally, I decided to create a simplified version based on its foundations: combining selected lines into a single readable average (avgLine) and introducing a dynamic safety margin that acts as a buffer against market noise.
This is not the full Ichimoku system—it’s merely a clear method for determining trend, accessible even to beginners. The trend changes only after the price closes beyond the margin, eliminating false signals.
█ FEATURES
Ichimoku Lines:
- Tenkan-sen (Conversion Line) – Donchian average over 9 periods
- Kijun-sen (Base Line) – Donchian average over 26 periods
- Senkou Span A – average of Tenkan and Kijun
- Senkou Span B – Donchian average over 52 periods
- Chikou Span – close price (no offset)
Dynamic Average (avgLine):
- Arithmetic mean of only the enabled Ichimoku lines – full component selection flexibility.
Safety Margin (tolerance):
Calculated as:
- tolerance = multiplier × SMA(|open - close|, periods)
- Default: multiplier 1.8, period 100.
Trend Detection:
- Uptrend → when price > avgLine + tolerance
- Downtrend → when price < avgLine - tolerance
- Trend changes only after full margin breakout.
- Margin can be set to 0 – then signals trigger on avgLine crossover.
Signal Labels:
- “Buy” (green, upward arrow) – on shift to uptrend
- “Sell” (red, downward arrow) – on shift to downtrend
Visual Fills:
- Between avgLine and marginLine
- Between avgLine and price (with transparency)
- Colors: green (uptrend), red (downtrend)
Alerts:
- Trend Change Up – price crosses above margin
- Trend Change Down – price crosses below margin
█ HOW TO USE
Add to Chart: Paste code in Pine Editor or find in the indicator library.
Settings:
Ichimoku Parameters:
- Conversion Line Length → default 9
- Base Line Length → default 26
- Leading Span B Length → default 52
- Average Body Periods → default 100
- Tolerance Multiplier → default 1.8
Line Selection:
- Enable/disable: Tenkan, Kijun, Span A, Span B, Chikou
Visual Settings:
- Uptrend Color → default green
- Downtrend Color → default red
- Fill Between Price & Avg → enables shadow fill
Signal Interpretation:
- Average Line (avgLine): Primary trend reference level.
- Margin (marginLine): Buffer – price must break it to change trend. Set to 0 for signals on avgLine crossover.
- Buy/Sell Labels: Appear only on confirmed trend change.
- Fills: Visualize distance between price, average, and margin.
- Alerts: Set in TradingView → notifications on trend change.
█ APPLICATIONS
The indicator works well in:
- Trend-following: Enter on Buy/Sell, exit on reversal.
- Breakout confirmation: Ideal for breakout strategies with false signal protection.
- Noise filtering: Margin eliminates consolidation fluctuations.
Adjusting margin to trading style:
- Short-term trading (scalping, daytrading): Reduce or set margin to 0 → more and faster signals (but more false ones).
- Long-term strategies (swing, position): Increase margin (e.g. 2.0–3.0) → fewer signals, higher quality.
Entry signals are not limited to Buy/Sell labels – use like moving averages:
- Test and bounce off avgLine as support/resistance
- avgLine breakout as momentum signal
- Pullback to margin as trend continuation entry
Combine with:
- Support/resistance levels
- Fair Value Gaps (FVG)
- Volume or other momentum indicators
█ NOTES
- Works on all markets and timeframes.
- Adjust multiplier and periods to instrument volatility.
- Higher multiplier → fewer signals, higher quality.
- Disable unused Ichimoku lines to simplify the average.

Market SessionsMarket Sessions (Asian, London, NY, Pacific)
Summary
This indicator plots the main global market sessions (Asian, European, American, Pacific) as boxes on your chart, complete with dynamic high/low tracking.
It's an essential tool for intraday traders to track session-based volatility patterns and visualize key support/resistance levels (like the Asian Range) that often define price action for the rest of the day.
Who it’s for
Intraday traders, scalpers, and day traders who need to visualize market hours and session-based ranges. If your strategy depends on the London open, the New York close, or the Asian range, this script will map it out for you.
What it shows
Customizable Session Boxes: Four fully configurable boxes for the Asian, European (London), American (New York), and Pacific (Sydney) sessions.
Session High & Low: The script tracks and boxes the highest high and lowest low of each session, dynamically updating as the session progresses.
Session Labels: Clear labels (e.g., "AS", "EU") mark each session, anchored to the start time.
Key Features
Powerful Timezone Control: This is the core feature.
Use Exchange Timezone (Default): Simply enter session times (e.g., 8:00 for London) relative to the exchange's timezone (e.g., "NASDAQ" or "BINANCE").
Use UTC Offset: Uncheck the box and enter a UTC offset (e.g., +3 or -5). Now, all session times you enter are relative to that specific UTC offset. This gives you full control regardless of the chart you're on.
Fully Customizable: Toggle any session on/off.
Style Control: Change the fill color, border color, transparency, border width, and line style (Solid, Dashed, Dotted) for each session individually.
Smart Labels: Labels stay anchored to the start of the session (no "sliding") and float just above the session high.
Why this helps
Track Volatility & Market Behavior: Visually identify the "personality" of each session. Some sessions might consistently produce powerful pumps or dumps, while others are prone to sideways "chop" or accumulation. This indicator helps you see these repeating patterns.
Find Key Support/Resistance Levels: The High and Low of a session (e.g., the Asian Range) often become critical support and resistance levels for the next session (e.g., London). This script makes it easy to spot these "session-to-session" S/R flips and reactions.
Aid Statistical Analysis: The script provides the core visual data for your statistical research. You can easily track how often the London session breaks the Asian high, or which session is most likely to reverse the trend, helping you build a robust trading plan.
Context is King: Instantly see which market is active, which are overlapping (like the high-volume London-NY overlap), and which have closed.
Quick setup
Go to Timezone Settings.
Decide how you want to enter times:
Easy (Default): Leave Use Exchange Timezone checked. Enter session times based on the chart's native exchange (e.g., for BTC/USDT on Binance, use UTC+0 times).
Manual (Pro): Uncheck Use Exchange Timezone. Enter your UTC Offset (e.g., +2 for Berlin). Now, enter all session times as they appear on the clock in Berlin.
Go to each session tab (Asian, European...) to enable/disable it and set the correct start/end hours and minutes.
Style the colors to match your chart theme.
Disclaimer
For educational/informational purposes only; not financial advice. Trading involves risk—manage it responsibly.

Lateral Market DetectorOverview
The Lateral Market Detector is a TradingView indicator designed to identify and highlight range-bound market conditions (sideways movement) where price oscillates between defined support and resistance levels with minimal overall movement.
How It Works
The indicator analyzes price action using a dynamic range detection algorithm:
Range Calculation: Examines the last N candlesticks (default 50, adjustable 20-200) and calculates the difference between the highest high and lowest low within this period.
Laterality Detection: Compares the calculated range against a configurable tolerance threshold (in pips). If the range is smaller than the tolerance, the market is identified as laterally moving.
Confirmation Logic: Counts consecutive candlesticks that remain within the detected range. The indicator only confirms a lateral condition when the minimum number of consecutive candlesticks has been reached (default 15).
Visual Representation: Once confirmed, displays a colored rectangle (box) spanning from the range's start point to the current bar, with horizontal dashed lines marking the high and low levels.
Dynamic Update: Continuously updates the rectangle as new candlesticks form, adjusting the top and bottom boundaries if price remains within the lateral zone.
Key Features
Multi-Timeframe Optimization
Automatic timeframe adaptation using square root scaling
When enabled, parameters adjust proportionally based on the current timeframe (M1, M5, M15, M30, H1, D1, W1, MN)
Prevents the need for manual parameter adjustments across different timeframes
Formula: Adjusted_Tolerance = Base_Tolerance × √(Timeframe_Multiplier)
Customizable Parameters
Tolerance Pip (M1): Sets the maximum range width to identify laterality
Minimum Candlesticks: Minimum consecutive candles required to confirm a lateral zone
Candlesticks to Analyze: Lookback period for range calculation
Breakout Sensitivity: Controls the threshold for identifying range breakouts
Full Visual Customization
Rectangle color and transparency
High/Low line color and thickness
Automatic status display showing current timeframe, lateral confirmation, and active parameters
Use Cases
Range Trading: Identify optimal entry and exit points at support/resistance
Breakout Trading: Visual confirmation before entering breakout trades
Trend Analysis: Distinguish between trending and consolidating markets
Risk Management: Define clear stop-loss levels based on range boundaries
Technical Specifications
Indicator Type: Overlay
Maximum Boxes: 100 (prevents performance degradation)
Supported Assets: Forex, CFDs, Stocks, Cryptocurrencies
Pine Script Version: v5
Chart Display: Real-time updates on each new candlestick

Auto Fibonacci LevelsAuto Fibonacci Momentum Zones with Visible Range Table
Overview and Originality
The Auto Fibonacci Momentum Zones indicator offers a streamlined, static overlay of Fibonacci retracement levels inspired by extreme RSI momentum thresholds, enhanced with a dynamic table displaying the high and low of the currently visible chart range. This isn't a repackaged RSI oscillator or basic Fib drawer—common in TradingView's library—but a purposeful fusion of geometric harmony (Fibonacci ratios) with momentum psychology (RSI extremes at 35/85), projected as fixed horizontal reference lines on the price chart. The addition of the visible range table, powered by PineCoders' VisibleChart library, provides real-time context for the chart's current view, enabling traders to quickly assess range compression or expansion relative to these zones.
This script's originality stems from its "static momentum mapping": by hardcoding Fib levels on a dynamic chart, it creates universal psychological support/resistance lines that transcend specific assets or timeframes.
Unlike dynamic Fib tools that auto-adjust to price swings (risking noise in ranging markets) or standalone RSI plots (confined to panes), this delivers clean, bias-adjustable overlays for confluence analysis. The visible range table justifies the library integration—it's not a gratuitous add-on but a complementary tool that quantifies the "screen real estate" of price action, helping users correlate Fib touches with actual volatility. Drawn from original code (no auto-generation or public templates), it builds TradingView's body of knowledge by simplifying multi-tool workflows into one indicator, ideal for discretionary traders who value visual efficiency over algorithmic complexity.
How It Works: Underlying Concepts
Fibonacci retracements, derived from the Fibonacci sequence and the golden ratio (≈0.618), identify potential reversal points based on the idea that markets retrace prior moves in predictable proportions: shallow (23.6%, 38.2%), mid (50%), and deep (61.8%, 78.6%).
Adjustable Outputs
1. The "Invert Fibs" toggle (default: true) for bearish/topping bias, can be flipped aligning with trend context.
2. Fibonacci Levels: Seven semi-transparent horizontal lines are drawn using `hline()`:
- 0.0 at high (gray).
- 0.236: high - (range × 0.236) (light cyan, shallow pullback).
- 0.382: high - (range × 0.382) (teal, common retracement).
- 0.5: midpoint average (green, equilibrium).
- 0.618: high - (range × 0.618) (amber, golden pocket for reversals).
- 0.786: high - (range × 0.786) (orange, deep support).
- 1.0 at low (gray).
Colors progress from cool (shallow) to warm (deep) for intuitive scanning.
3. Optional Fib Labels: Right-edge text labels (e.g., "0.618") appear only if enabled, positioned at the last bar + offset for non-cluttering visibility.
4. Visible Range Table: Leveraging the VisibleChart library's `visible.high()` and `visible.low()` functions, a compact 2x2 table (top-right corner) updates on the last bar to show the extrema of bars currently in view. This mashup enhances utility: Fib zones provide fixed anchors, while the table's dynamic values reveal if price is "pinned" to a zone (e.g., visible high hugging 0.382 signals resistance). The library is invoked sparingly for performance, adding value by bridging static geometry with viewport-aware data—unavailable in built-ins without custom code.
How to Use It
1. Setup:
Add to any chart (e.g., 15M for scalps, Daily for swings). As an overlay, lines appear directly on price candles—adjust chart scaling if needed.
2. Input Tweaks:
Invert Fibs: Enable for downtrends (85 top), disable for uptrends (35 bottom).
Show Fibs: Toggle labels for ratio callouts (off for clean charts).
Show Table: Display/hide the visible high/low summary (red for high, green for low, formatted to 2 decimals).
3. Trading Application:
Zone Confluence: Seek price reactions at each fibonacci level—e.g., a doji at 0.618 + rising volume suggests entry; use 0.0/1.0 as invalidation.
Range Context: Check the table: If visible high/low spans <20% of the Fib arc (e.g., both near 0.5), anticipate breakout; wider spans signal consolidation.
Multi-Timeframe: Overlay on higher TF for bias, lower for precision—e.g., Daily Fibs guide 1H entries.
Enhancements: Pair with volume or candlesticks; set alerts on line crosses via TradingView's built-in tools. Backtest on your symbols to validate (e.g., equities favor 0.382, forex the 0.786).
This indicator automates advanced Fibonacci synthesis dynamically, eliminating manual measurement and calculations.
published by ozzy_livin

Ultimate Oscillator (ULTOSC)The Ultimate Oscillator (ULTOSC) is a technical momentum indicator developed by Larry Williams that combines three different time periods to reduce the volatility and false signals common in single-period oscillators. By using a weighted average of three Stochastic-like calculations across short, medium, and long-term periods, the Ultimate Oscillator provides a more comprehensive view of market momentum while maintaining sensitivity to price changes.
The indicator addresses the common problem of oscillators being either too sensitive (generating many false signals) or too slow (missing opportunities). By incorporating multiple timeframes with decreasing weights for longer periods, ULTOSC attempts to capture both short-term momentum shifts and longer-term trend strength, making it particularly valuable for identifying divergences and potential reversal points.
## Core Concepts
* **Multi-timeframe analysis:** Combines three different periods (typically 7, 14, 28) to capture various momentum cycles
* **Weighted averaging:** Assigns higher weights to shorter periods for responsiveness while including longer periods for stability
* **Buying pressure focus:** Measures the relationship between closing price and the true range rather than just high-low range
* **Divergence detection:** Particularly effective at identifying momentum divergences that precede price reversals
* **Normalized scale:** Oscillates between 0 and 100, with clear overbought/oversold levels
## Common Settings and Parameters
| Parameter | Default | Function | When to Adjust |
|-----------|---------|----------|---------------|
| Fast Period | 7 | Short-term momentum calculation | Lower (5-6) for more sensitivity, higher (9-12) for smoother signals |
| Medium Period | 14 | Medium-term momentum calculation | Adjust based on typical swing duration in the market |
| Slow Period | 28 | Long-term momentum calculation | Higher values (35-42) for longer-term position trading |
| Fast Weight | 4.0 | Weight applied to fast period | Higher weight increases short-term sensitivity |
| Medium Weight | 2.0 | Weight applied to medium period | Adjust to balance medium-term influence |
| Slow Weight | 1.0 | Weight applied to slow period | Usually kept at 1.0 as the baseline weight |
**Pro Tip:** The classic 7/14/28 periods with 4/2/1 weights work well for most markets, but consider using 5/10/20 with adjusted weights for faster markets or 14/28/56 for longer-term analysis.
## Calculation and Mathematical Foundation
**Simplified explanation:**
The Ultimate Oscillator calculates three separate "buying pressure" ratios using different time periods, then combines them using weighted averaging. Buying pressure is defined as the close minus the true low, divided by the true range.
**Technical formula:**
```
BP = Close - Min(Low, Previous Close)
TR = Max(High, Previous Close) - Min(Low, Previous Close)
BP_Sum_Fast = Sum(BP, Fast Period)
TR_Sum_Fast = Sum(TR, Fast Period)
Raw_Fast = 100 × (BP_Sum_Fast / TR_Sum_Fast)
BP_Sum_Medium = Sum(BP, Medium Period)
TR_Sum_Medium = Sum(TR, Medium Period)
Raw_Medium = 100 × (BP_Sum_Medium / TR_Sum_Medium)
BP_Sum_Slow = Sum(BP, Slow Period)
TR_Sum_Slow = Sum(TR, Slow Period)
Raw_Slow = 100 × (BP_Sum_Slow / TR_Sum_Slow)
ULTOSC = 100 × / (Fast_Weight + Medium_Weight + Slow_Weight)
```
Where:
- BP = Buying Pressure
- TR = True Range
- Fast Period = 7, Medium Period = 14, Slow Period = 28 (defaults)
- Fast Weight = 4, Medium Weight = 2, Slow Weight = 1 (defaults)
> 🔍 **Technical Note:** The implementation uses efficient circular buffers for all three period calculations, maintaining O(1) time complexity per bar. The algorithm properly handles true range calculations including gaps and ensures accurate buying pressure measurements across all timeframes.
## Interpretation Details
ULTOSC provides several analytical perspectives:
* **Overbought/Oversold conditions:** Values above 70 suggest overbought conditions, below 30 suggest oversold conditions
* **Momentum direction:** Rising ULTOSC indicates increasing buying pressure, falling indicates increasing selling pressure
* **Divergence analysis:** Divergences between ULTOSC and price often precede significant reversals
* **Trend confirmation:** ULTOSC direction can confirm or question the prevailing price trend
* **Signal quality:** Extreme readings (>80 or <20) indicate strong momentum that may be unsustainable
* **Multiple timeframe consensus:** When all three underlying periods agree, signals are typically more reliable
## Trading Applications
**Primary Uses:**
- **Divergence trading:** Identify when momentum diverges from price for reversal signals
- **Overbought/oversold identification:** Find potential entry/exit points at extreme levels
- **Trend confirmation:** Validate breakouts and trend continuations
- **Momentum analysis:** Assess the strength of current price movements
**Advanced Strategies:**
- **Multi-divergence confirmation:** Look for divergences across multiple timeframes
- **Momentum breakouts:** Trade when ULTOSC breaks above/below key levels with volume
- **Swing trading entries:** Use oversold/overbought levels for swing position entries
- **Trend strength assessment:** Evaluate trend quality using momentum consistency
## Signal Combinations
**Strong Bullish Signals:**
- ULTOSC rises from oversold territory (<30) with positive price divergence
- ULTOSC breaks above 50 after forming a base near 30
- All three underlying periods show increasing buying pressure
**Strong Bearish Signals:**
- ULTOSC falls from overbought territory (>70) with negative price divergence
- ULTOSC breaks below 50 after forming a top near 70
- All three underlying periods show decreasing buying pressure
**Divergence Signals:**
- **Bullish divergence:** Price makes lower lows while ULTOSC makes higher lows
- **Bearish divergence:** Price makes higher highs while ULTOSC makes lower highs
- **Hidden bullish divergence:** Price makes higher lows while ULTOSC makes lower lows (trend continuation)
- **Hidden bearish divergence:** Price makes lower highs while ULTOSC makes higher highs (trend continuation)
## Comparison with Related Oscillators
| Indicator | Periods | Focus | Best Use Case |
|-----------|---------|-------|---------------|
| **Ultimate Oscillator** | 3 periods | Buying pressure | Divergence detection |
| **Stochastic** | 1-2 periods | Price position | Overbought/oversold |
| **RSI** | 1 period | Price momentum | Momentum analysis |
| **Williams %R** | 1 period | Price position | Short-term signals |
## Advanced Configurations
**Fast Trading Setup:**
- Fast: 5, Medium: 10, Slow: 20
- Weights: 4/2/1, Thresholds: 75/25
**Standard Setup:**
- Fast: 7, Medium: 14, Slow: 28
- Weights: 4/2/1, Thresholds: 70/30
**Conservative Setup:**
- Fast: 14, Medium: 28, Slow: 56
- Weights: 3/2/1, Thresholds: 65/35
**Divergence Focused:**
- Fast: 7, Medium: 14, Slow: 28
- Weights: 2/2/2, Thresholds: 70/30
## Market-Specific Adjustments
**Volatile Markets:**
- Use longer periods (10/20/40) to reduce noise
- Consider higher threshold levels (75/25)
- Focus on extreme readings for signal quality
**Trending Markets:**
- Emphasize divergence analysis over absolute levels
- Look for momentum confirmation rather than reversal signals
- Use hidden divergences for trend continuation
**Range-Bound Markets:**
- Standard overbought/oversold levels work well
- Trade reversals from extreme levels
- Combine with support/resistance analysis
## Limitations and Considerations
* **Lagging component:** Contains inherent lag due to multiple moving average calculations
* **Complex calculation:** More computationally intensive than single-period oscillators
* **Parameter sensitivity:** Performance varies significantly with different period/weight combinations
* **Market dependency:** Most effective in trending markets with clear momentum patterns
* **False divergences:** Not all divergences lead to significant price reversals
* **Whipsaw potential:** Can generate conflicting signals in choppy markets
## Best Practices
**Effective Usage:**
- Focus on divergences rather than absolute overbought/oversold levels
- Combine with trend analysis for context
- Use multiple timeframe analysis for confirmation
- Pay attention to the speed of momentum changes
**Common Mistakes:**
- Over-relying on overbought/oversold levels in strong trends
- Ignoring the underlying trend direction
- Using inappropriate period settings for the market being analyzed
- Trading every divergence without additional confirmation
**Signal Enhancement:**
- Combine with volume analysis for confirmation
- Use price action context (support/resistance levels)
- Consider market volatility when setting thresholds
- Look for convergence across multiple momentum indicators
## Historical Context and Development
The Ultimate Oscillator was developed by Larry Williams and introduced in his 1985 article "The Ultimate Oscillator" in Technical Analysis of Stocks and Commodities magazine. Williams designed it to address the limitations of single-period oscillators by:
- Reducing false signals through multi-timeframe analysis
- Maintaining sensitivity to short-term momentum changes
- Providing more reliable divergence signals
- Creating a more robust momentum measurement tool
The indicator has become a standard tool in technical analysis, particularly valued for its divergence detection capabilities and its balanced approach to momentum measurement.
## References
* Williams, L. R. (1985). The Ultimate Oscillator. Technical Analysis of Stocks and Commodities, 3(4).
* Williams, L. R. (1999). Long-Term Secrets to Short-Term Trading. Wiley Trading.

Triangular Moving Average (TRIMA)The Triangular Moving Average (TRIMA) is a technical indicator that applies a triangular weighting scheme to price data, providing enhanced smoothing compared to simpler moving averages. Originating in the early 1970s as technical analysts sought more effective noise filtering methods, the TRIMA was first popularized through the work of market technician Arthur Merrill. Its formal mathematical properties were established in the 1980s, and the indicator gained widespread adoption in the 1990s as computerized charting became standard. TRIMA effectively filters out market noise while maintaining important trends through its unique center-weighted calculation method.
## Core Concepts
* **Double-smoothing process:** TRIMA can be viewed as applying a simple moving average twice, creating more effective noise filtering
* **Triangular weighting:** Uses a symmetrical weight distribution that emphasizes central data points and reduces emphasis toward both ends
* **Constant-time implementation:** Two $O(1)$ SMA passes with circular buffers preserve exact triangular weights while keeping update cost constant per bar
* **Market application:** Particularly effective for identifying the underlying trend in noisy market conditions where standard moving averages generate too many false signals
* **Timeframe flexibility:** Works across multiple timeframes, with longer periods providing cleaner trend signals in higher timeframes
The core innovation of TRIMA is its unique triangular weighting scheme, which can be viewed either as a specialized weight distribution or as a twice-applied simple moving average with adjusted period. This creates more effective noise filtering without the excessive lag penalty typically associated with longer-period averages. The symmetrical nature of the weight distribution ensures zero phase distortion, preserving the timing of important market turning points.
## Common Settings and Parameters
| Parameter | Default | Function | When to Adjust |
|-----------|---------|----------|---------------|
| Length | 14 | Controls the lookback period | Increase for smoother signals in volatile markets, decrease for responsiveness |
| Source | close | Price data used for calculation | Consider using hlc3 for a more balanced price representation |
**Pro Tip:** For a good balance between smoothing and responsiveness, try using a TRIMA with period N instead of an SMA with period 2N - you'll get similar smoothing characteristics but with less lag.
## Calculation and Mathematical Foundation
**Simplified explanation:**
TRIMA calculates a weighted average of prices where the weights form a triangle shape. The middle prices get the most weight, and weights gradually decrease toward both the recent and older ends. This creates a smooth filter that effectively removes random price fluctuations while preserving the underlying trend.
**Technical formula:**
TRIMA = Σ(Price × Weight ) / Σ(Weight )
Where the triangular weights form a symmetric pattern:
- Weight = min(i, n-1-i) + 1
- Example for n=5: weights =
- Example for n=4: weights =
Alternatively, TRIMA can be calculated as:
TRIMA(source, p) = SMA(SMA(source, (p+1)/2), (p+1)/2)
> 🔍 **Technical Note:** The double application of SMA explains why TRIMA provides better smoothing than a single SMA or WMA. This approach effectively applies smoothing twice with optimal period adjustment, creating a -18dB/octave roll-off in the frequency domain compared to -6dB/octave for a simple moving average, and the current implementation achieves $O(1)$ complexity through circular buffers and NA-safe warmup compensation.
## Interpretation Details
TRIMA can be used in various trading strategies:
* **Trend identification:** The direction of TRIMA indicates the prevailing trend
* **Signal generation:** Crossovers between price and TRIMA generate trade signals with fewer false alarms than SMA
* **Support/resistance levels:** TRIMA can act as dynamic support during uptrends and resistance during downtrends
* **Trend strength assessment:** Distance between price and TRIMA can indicate trend strength
* **Multiple timeframe analysis:** Using TRIMAs with different periods can confirm trends across different timeframes
## Limitations and Considerations
* **Market conditions:** Like all moving averages, less effective in choppy, sideways markets
* **Lag factor:** More lag than WMA or EMA due to center-weighted emphasis
* **Limited adaptability:** Fixed weighting scheme cannot adapt to changing market volatility
* **Response time:** Takes longer to reflect sudden price changes than directionally-weighted averages
* **Complementary tools:** Best used with momentum oscillators or volume indicators for confirmation
## References
* Ehlers, John F. "Cycle Analytics for Traders." Wiley, 2013
* Kaufman, Perry J. "Trading Systems and Methods." Wiley, 2013
* Colby, Robert W. "The Encyclopedia of Technical Market Indicators." McGraw-Hill, 2002

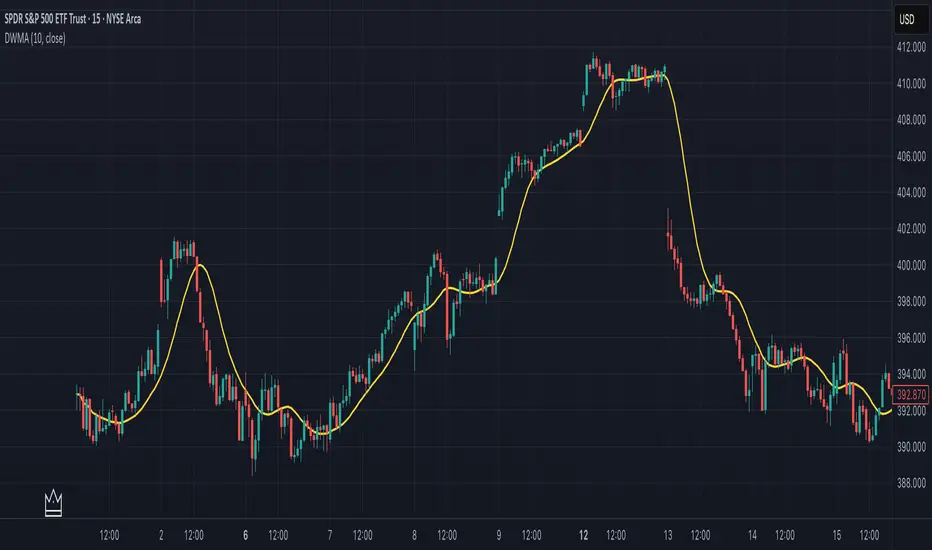
Double Weighted Moving Average (DWMA)# DWMA: Double Weighted Moving Average
## Overview and Purpose
The Double Weighted Moving Average (DWMA) is a technical indicator that applies weighted averaging twice in sequence to create a smoother signal with enhanced noise reduction. Developed in the late 1990s as an evolution of traditional weighted moving averages, the DWMA was created by quantitative analysts seeking enhanced smoothing without the excessive lag typically associated with longer period averages. By applying a weighted moving average calculation to the results of an initial weighted moving average, DWMA achieves more effective filtering while preserving important trend characteristics.
## Core Concepts
* **Cascaded filtering:** DWMA applies weighted averaging twice in sequence for enhanced smoothing and superior noise reduction
* **Linear weighting:** Uses progressively increasing weights for more recent data in both calculation passes
* **Market application:** Particularly effective for trend following strategies where noise reduction is prioritized over rapid signal response
* **Timeframe flexibility:** Works across multiple timeframes but particularly valuable on daily and weekly charts for identifying significant trends
The core innovation of DWMA is its two-stage approach that creates more effective noise filtering while minimizing the additional lag typically associated with longer-period or higher-order filters. This sequential processing creates a more refined output that balances noise reduction and signal preservation better than simply increasing the length of a standard weighted moving average.
## Common Settings and Parameters
| Parameter | Default | Function | When to Adjust |
|-----------|---------|----------|---------------|
| Length | 14 | Controls the lookback period for both WMA calculations | Increase for smoother signals in volatile markets, decrease for more responsiveness |
| Source | close | Price data used for calculation | Consider using hlc3 for a more balanced price representation |
**Pro Tip:** For trend following, use a length of 10-14 with DWMA instead of a single WMA with double the period - this provides better smoothing with less lag than simply increasing the period of a standard WMA.
## Calculation and Mathematical Foundation
**Simplified explanation:**
DWMA first calculates a weighted moving average where recent prices have more importance than older prices. Then, it applies the same weighted calculation again to the results of the first calculation, creating a smoother line that reduces market noise more effectively.
**Technical formula:**
```
DWMA is calculated by applying WMA twice:
1. First WMA calculation:
WMA₁ = (P₁ × w₁ + P₂ × w₂ + ... + Pₙ × wₙ) / (w₁ + w₂ + ... + wₙ)
2. Second WMA calculation applied to WMA₁:
DWMA = (WMA₁₁ × w₁ + WMA₁₂ × w₂ + ... + WMA₁ₙ × wₙ) / (w₁ + w₂ + ... + wₙ)
```
Where:
- Linear weights: most recent value has weight = n, second most recent has weight = n-1, etc.
- n is the period length
- Sum of weights = n(n+1)/2
**O(1) Optimization - Inline Dual WMA Architecture:**
This implementation uses an advanced O(1) algorithm with two complete inline WMA calculations. Each WMA uses the dual running sums technique:
1. **First WMA (source → wma1)**:
- Maintains buffer1, sum1, weighted_sum1
- Recurrence: `W₁_new = W₁_old - S₁_old + (n × P_new)`
- Cached denominator norm1 after warmup
2. **Second WMA (wma1 → dwma)**:
- Maintains buffer2, sum2, weighted_sum2
- Recurrence: `W₂_new = W₂_old - S₂_old + (n × WMA₁_new)`
- Cached denominator norm2 after warmup
**Implementation details:**
- Both WMAs fully integrated inline (no helper functions)
- Each maintains independent state: buffers, sums, counters, norms
- Both warm up independently from bar 1
- Performance: ~16 operations per bar regardless of period (vs ~10,000 for naive O(n²) implementation)
**Why inline architecture:**
Unlike helper functions, the inline approach makes all state variables and calculations visible in a single scope, eliminating function call overhead and making the dual-pass nature explicit. This is ideal for educational purposes and when debugging complex cascaded filters.
> 🔍 **Technical Note:** The dual-pass O(1) approach creates a filter that effectively increases smoothing without the quadratic increase in computational cost. Original O(n²) implementations required ~10,000 operations for period=100; this optimized version requires only ~16 operations, achieving a 625x speedup while maintaining exact mathematical equivalence.
## Interpretation Details
DWMA can be used in various trading strategies:
* **Trend identification:** The direction of DWMA indicates the prevailing trend
* **Signal generation:** Crossovers between price and DWMA generate trade signals, though they occur later than with single WMA
* **Support/resistance levels:** DWMA can act as dynamic support during uptrends and resistance during downtrends
* **Trend strength assessment:** Distance between price and DWMA can indicate trend strength
* **Noise filtering:** Using DWMA to filter noisy price data before applying other indicators
## Limitations and Considerations
* **Market conditions:** Less effective in choppy, sideways markets where its lag becomes a disadvantage
* **Lag factor:** More lag than single WMA due to double calculation process
* **Initialization requirement:** Requires more data points for full calculation, showing more NA values at chart start
* **Short-term trading:** May miss short-term trading opportunities due to increased smoothing
* **Complementary tools:** Best used with momentum oscillators or volume indicators for confirmation
## References
* Jurik, M. "Double Weighted Moving Averages: Theory and Applications in Algorithmic Trading Systems", Jurik Research Papers, 2004
* Ehlers, J.F. "Cycle Analytics for Traders," Wiley, 2013
Weighted Moving Average (WMA)This implementation uses O(1) algorithm that eliminates the need to loop through all period values on each bar. It also generates valid WMA values from the first bar and is not returning NA when number of bars is less than period.
## Overview and Purpose
The Weighted Moving Average (WMA) is a technical indicator that applies progressively increasing weights to more recent price data. Emerging in the early 1950s during the formative years of technical analysis, WMA gained significant adoption among professional traders through the 1970s as computational methods became more accessible. The approach was formalized in Robert Colby's 1988 "Encyclopedia of Technical Market Indicators," establishing it as a staple in technical analysis software. Unlike the Simple Moving Average (SMA) which gives equal weight to all prices, WMA assigns greater importance to recent prices, creating a more responsive indicator that reacts faster to price changes while still providing effective noise filtering.
## Core Concepts
* **Linear weighting:** WMA applies progressively increasing weights to more recent price data, creating a recency bias that improves responsiveness
* **Market application:** Particularly effective for identifying trend changes earlier than SMA while maintaining better noise filtering than faster-responding averages like EMA
* **Timeframe flexibility:** Works effectively across all timeframes, with appropriate period adjustments for different trading horizons
The core innovation of WMA is its linear weighting scheme, which strikes a balance between the equal-weight approach of SMA and the exponential decay of EMA. This creates an intuitive and effective compromise that prioritizes recent data while maintaining a finite lookback period, making it particularly valuable for traders seeking to reduce lag without excessive sensitivity to price fluctuations.
## Common Settings and Parameters
| Parameter | Default | Function | When to Adjust |
|-----------|---------|----------|---------------|
| Length | 14 | Controls the lookback period | Increase for smoother signals in volatile markets, decrease for responsiveness |
| Source | close | Price data used for calculation | Consider using hlc3 for a more balanced price representation |
**Pro Tip:** For most trading applications, using a WMA with period N provides better responsiveness than an SMA with the same period, while generating fewer whipsaws than an EMA with comparable responsiveness.
## Calculation and Mathematical Foundation
**Simplified explanation:**
WMA calculates a weighted average of prices where the most recent price receives the highest weight, and each progressively older price receives one unit less weight. For example, in a 5-period WMA, the most recent price gets a weight of 5, the next most recent a weight of 4, and so on, with the oldest price getting a weight of 1.
**Technical formula:**
```
WMA = (P₁ × w₁ + P₂ × w₂ + ... + Pₙ × wₙ) / (w₁ + w₂ + ... + wₙ)
```
Where:
- Linear weights: most recent value has weight = n, second most recent has weight = n-1, etc.
- The sum of weights for a period n is calculated as: n(n+1)/2
- For example, for a 5-period WMA, the sum of weights is 5(5+1)/2 = 15
**O(1) Optimization - Dual Running Sums:**
The key insight is maintaining two running sums:
1. **Unweighted sum (S)**: Simple sum of all values in the window
2. **Weighted sum (W)**: Sum of all weighted values
The recurrence relation for a full window is:
```
W_new = W_old - S_old + (n × P_new)
```
This works because when all weights decrement by 1 (as the window slides), it's mathematically equivalent to subtracting the entire unweighted sum. The implementation:
- **During warmup**: Accumulates both sums as the window fills, computing denominator each bar
- **After warmup**: Uses cached denominator (constant at n(n+1)/2), updates both sums in constant time
- **Performance**: ~8 operations per bar regardless of period, vs ~100+ for naive O(n) implementation
> 🔍 **Technical Note:** Unlike EMA which theoretically considers all historical data (with diminishing influence), WMA has a finite memory, completely dropping prices that fall outside its lookback window. This creates a cleaner break from outdated market conditions. The O(1) optimization achieves 12-25x speedup over naive implementations while maintaining exact mathematical equivalence.
## Interpretation Details
WMA can be used in various trading strategies:
* **Trend identification:** The direction of WMA indicates the prevailing trend with greater responsiveness than SMA
* **Signal generation:** Crossovers between price and WMA generate trade signals earlier than with SMA
* **Support/resistance levels:** WMA can act as dynamic support during uptrends and resistance during downtrends
* **Moving average crossovers:** When a shorter-period WMA crosses above a longer-period WMA, it signals a potential uptrend (and vice versa)
* **Trend strength assessment:** Distance between price and WMA can indicate trend strength
## Limitations and Considerations
* **Market conditions:** Still suboptimal in highly volatile or sideways markets where enhanced responsiveness may generate false signals
* **Lag factor:** While less than SMA, still introduces some lag in signal generation
* **Abrupt window exit:** The oldest price suddenly drops out of calculation when leaving the window, potentially causing small jumps
* **Step changes:** Linear weighting creates discrete steps in influence rather than a smooth decay
* **Complementary tools:** Best used with volume indicators and momentum oscillators for confirmation
## References
* Colby, Robert W. "The Encyclopedia of Technical Market Indicators." McGraw-Hill, 2002
* Murphy, John J. "Technical Analysis of the Financial Markets." New York Institute of Finance, 1999
* Kaufman, Perry J. "Trading Systems and Methods." Wiley, 2013

Liquidity Grab + RSI Divergence═══════════════════════════════════════════════════════════════
LIQUIDITY GRAB + RSI DIVERGENCE INDICATOR
═══════════════════════════════════════════════════════════════
📌 OVERVIEW
This indicator identifies high-probability reversals by combining:
• Liquidity sweeps (stop hunts)
• RSI divergence confirmation
• Filters false breakouts automatically
═══════════════════════════════════════════════════════════════
🟢 BUY SIGNAL (Green Triangle Up)
REQUIRES BOTH CONDITIONS:
1. Liquidity Grab Below Previous Low
• Price breaks BELOW recent low
• Candle CLOSES ABOVE that low
• Traps sellers who shorted the breakdown
2. Bullish RSI Divergence
• Price: Lower Low (LL)
• RSI: Higher Low (HL)
• Shows weakening downward momentum
➜ Result: Potential bullish reversal
═══════════════════════════════════════════════════════════════
🔴 SELL SIGNAL (Red Triangle Down)
REQUIRES BOTH CONDITIONS:
1. Liquidity Grab Above Previous High
• Price breaks ABOVE recent high
• Candle CLOSES BELOW that high
• Traps buyers who bought the breakout
2. Bearish RSI Divergence
• Price: Higher High (HH)
• RSI: Lower High (LH)
• Shows weakening upward momentum
➜ Result: Potential bearish reversal
═══════════════════════════════════════════════════════════════
📊 VISUAL INDICATORS
Main Signals:
🔺 Large Green Triangle = BUY (Liq Grab + Bullish Div)
🔻 Large Red Triangle = SELL (Liq Grab + Bearish Div)
Reference Levels:
━ Red Line = Previous High Level
━ Green Line = Previous Low Level
Additional Markers (Optional):
○ Small Green Circle = Liquidity grab low only
○ Small Red Circle = Liquidity grab high only
✕ Small Blue Cross = Bullish divergence only
✕ Small Orange Cross = Bearish divergence only
═══════════════════════════════════════════════════════════════
⚙️ SETTINGS
1. Lookback Period (Default: 20)
• Range: 5-100
• Sets how far back to identify previous highs/lows
• Higher = fewer but stronger levels
• Lower = more frequent but weaker levels
2. RSI Length (Default: 14)
• Range: 5-50
• Standard RSI calculation period
• 14 is industry standard
3. RSI Divergence Lookback (Default: 5)
• Range: 3-20
• Controls pivot point sensitivity
• Higher = fewer divergence signals
• Lower = more divergence signals
4. Show Labels (Default: ON)
• Toggle BUY/SELL text labels
• Disable for cleaner chart view
═══════════════════════════════════════════════════════════════
💡 HOW TO USE
Step 1: WAIT FOR CONFIRMATION
• Only trade LARGE TRIANGLE signals
• Ignore small circles/crosses alone
Step 2: CHECK TIMEFRAME
• Best on: 15min, 1H, 4H, Daily
• Avoid: 1min, 5min (too noisy)
Step 3: CONFIRM CONTEXT
• Check overall market trend
• Identify key support/resistance
• Look for confluence with price action
Step 4: ENTRY & RISK MANAGEMENT
• Enter on signal candle close or pullback
• Stop loss below/above the liquidity grab wick
• Target: Previous swing high/low or key levels
• Risk/Reward: Minimum 1:2 ratio
Step 5: SET ALERTS
• Create alert for "BUY Signal"
• Create alert for "SELL Signal"
• Never miss opportunities
═══════════════════════════════════════════════════════════════
✅ BEST PRACTICES
DO:
✓ Use on multiple timeframes for confluence
✓ Combine with support/resistance zones
✓ Wait for both conditions (liq grab + divergence)
✓ Practice on demo account first
✓ Use proper position sizing
DON'T:
✗ Trade every small circle/cross
✗ Use on very low timeframes (<15min)
✗ Ignore overall market context
✗ Trade without stop loss
✗ Risk more than 1-2% per trade
═══════════════════════════════════════════════════════════════
⚠️ IMPORTANT NOTES
• This is a CONFIRMATION tool, not a holy grail
• No indicator is 100% accurate
• Combine with your trading strategy
• Backtest on your preferred instruments
• Adjust parameters for your trading style
• Higher timeframes = more reliable signals
• Always use risk management
═══════════════════════════════════════════════════════════════
🔔 ALERTS INCLUDED
Two alert conditions are built-in:
1. "BUY Signal" - Liquidity Grab + Bullish RSI Divergence
2. "SELL Signal" - Liquidity Grab + Bearish RSI Divergence
═══════════════════════════════════════════════════════════════
📈 RECOMMENDED SETTINGS BY TIMEFRAME
5-15 Min Charts:
• Lookback: 10-15
• RSI Length: 14
• RSI Div Lookback: 3-5
1H-4H Charts:
• Lookback: 20-30
• RSI Length: 14
• RSI Div Lookback: 5-7
Daily Charts:
• Lookback: 30-50
• RSI Length: 14
• RSI Div Lookback: 7-10
═══════════════════════════════════════════════════════════════
Good luck and trade safe! 🚀

Ehlers Ultrasmooth Filter (USF)# USF: Ultrasmooth Filter
## Overview and Purpose
The Ultrasmooth Filter (USF) is an advanced signal processing tool that represents the pinnacle of noise reduction technology for financial time series. Developed by John Ehlers, this filter implements a complex algorithm that provides exceptional smoothing capabilities while minimizing the lag typically associated with heavy filtering. USF builds upon the Super Smooth Filter (SSF) with enhanced noise suppression characteristics, making it particularly valuable for identifying clear trends in extremely noisy market conditions where even traditional smoothing techniques struggle to produce clean signals.
## Core Concepts
* **Maximum noise suppression:** Provides the highest level of noise reduction among Ehlers' filter designs
* **Optimized coefficient structure:** Uses carefully designed mathematical relationships to achieve superior filtering performance
* **Market application:** Particularly effective for long-term trend identification and minimizing false signals in highly volatile market conditions
The core innovation of USF is its second-order filter structure with optimized coefficients that create an exceptionally smooth frequency response. By careful mathematical design, USF achieves near-optimal noise suppression characteristics while minimizing the lag and waveform distortion that typically accompany such heavy filtering. This makes it especially valuable for identifying major market trends amid significant short-term volatility.
## Common Settings and Parameters
| Parameter | Default | Function | When to Adjust |
|-----------|---------|----------|---------------|
| Length | 20 | Controls the cutoff period | Increase for smoother signals, decrease for more responsiveness |
| Source | close | Price data used for calculation | Consider using hlc3 for a more balanced price representation |
**Pro Tip:** USF is ideal for defining major market trends - try using it with a length of 40-60 on daily charts to identify dominant market direction and ignoring shorter-term noise completely.
## Calculation and Mathematical Foundation
**Simplified explanation:**
The Ultrasmooth Filter creates an extremely clean price representation by combining current and past price data with previous filter outputs using precisely calculated mathematical relationships. This creates a highly effective "averaging" process that removes virtually all market noise while still maintaining the essential trend information.
**Technical formula:**
USF = (1-c1)X + (2c1-c2)X₁ - (c1+c3)X₂ + c2×USF₁ + c3×USF₂
Where coefficients are calculated as:
- a1 = exp(-1.414π/length)
- b1 = 2a1 × cos(1.414 × 180/length)
- c1 = (1 + c2 - c3)/4
- c2 = b1
- c3 = -a1²
> 🔍 **Technical Note:** The filter combines both feed-forward (X terms) and feedback (USF terms) components in a second-order structure, creating a response with exceptional roll-off characteristics and minimal passband ripple.
## Interpretation Details
The Ultrasmooth Filter can be used in various trading strategies:
* **Major trend identification:** The direction of USF indicates the dominant market trend with minimal noise interference
* **Signal generation:** Crossovers between price and USF generate high-reliability trade signals with minimal false positives
* **Support/resistance levels:** USF can act as strong dynamic support during uptrends and resistance during downtrends
* **Market regime identification:** The slope of USF helps identify whether markets are in trending or consolidation phases
* **Multiple timeframe analysis:** Using USF across different chart timeframes creates a cohesive picture of nested trend structures
## Limitations and Considerations
* **Significant lag:** The extreme smoothing comes with increased lag compared to lighter filters
* **Initialization period:** Requires more bars than simpler filters to stabilize at the start of data
* **Less suitable for short-term trading:** Generally too slow-responding for short-term strategies
* **Parameter sensitivity:** Performance depends on appropriate length selection for the timeframe
* **Complementary tools:** Best used alongside faster-responding indicators for timing signals
## References
* Ehlers, J.F. "Cycle Analytics for Traders," Wiley, 2013
* Ehlers, J.F. "Rocket Science for Traders," Wiley, 2001

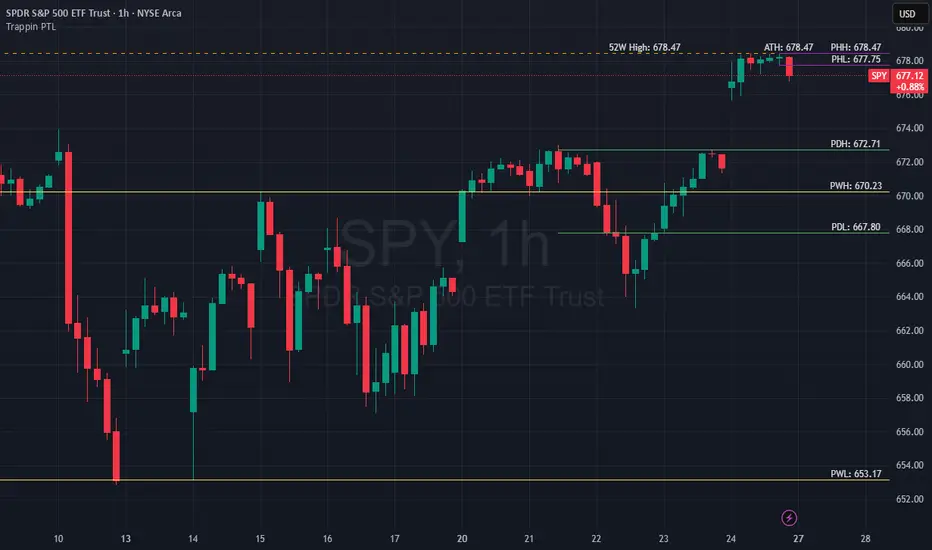
Trappin Previous Timeframe LevelsTrappin Previous Timeframe Levels (Trappin PTL)
Overview
Trappin PTL is a comprehensive multi-timeframe support and resistance indicator that displays key price levels from multiple timeframes on a single chart. This indicator helps traders identify critical price zones where reversals or breakouts are likely to occur, making it ideal for both intraday and swing trading strategies.
💡 Origin Story
I got tired of manually drawing these lines that I learned from watching Wallstreet Trapper on Trappin Tuesdays YouTube live streams. After repeatedly marking the same previous timeframe levels on every chart, I decided to automate the process. Hope it helps you as much as it helps me!
Key Features
📊 Multiple Timeframe Levels
The indicator tracks and displays high/low levels from:
Previous Hour (PHH/PHL) - Purple lines
Previous Day (PDH/PDL) - Green lines
Previous Week (PWH/PWL) - Yellow lines
Previous Month (PMH/PML) - Blue lines
All-Time High (ATH) - Red line
52-Week High - Orange line
🎨 Fully Customizable
Colors - Change the color of each timeframe independently
Line Styles - Choose between Solid, Dashed, or Dotted lines
Line Widths - Adjust thickness from 1-4 pixels
All settings organized in intuitive groups for easy access
📍 Smart Line Extension
Lines extend back to show when the level was established
Lines project forward to show current relevance
Historical context helps identify key support/resistance zones
🏷️ Clear Price Labels
Each level displays its exact price value (no currency symbols)
Labels positioned horizontally to avoid overlap
Adaptive text color for visibility on any chart theme (dark or light mode)
Why "Trappin"?
The name is a tribute to Wallstreet Trapper and his Trappin Tuesdays YouTube live streams, where I learned the importance of marking previous timeframe levels. The name also reflects the indicator's purpose: identifying price levels where traders often get "trapped" - whether it's bulls getting trapped below resistance or bears getting trapped above support. These levels represent zones where significant order flow and liquidity exist, making them prime areas for reversals or breakouts.
Credits
Created by resoh
Inspired by Wallstreet Trapper and Trappin Tuesdays YouTube live streams
This indicator is provided for educational and informational purposes. Always practice proper risk management and conduct your own analysis before making trading decisions.
Version History
v1.0 - Initial Release
Multi-timeframe high/low levels
All-time high tracking
52-week high tracking
Fully customizable colors, styles, and widths
Adaptive labels with price display
Smart line extension showing historical context
Dual Table Dashboard - Correct V3add RSI Data## 📈 Trading Applications
### 1. Trend Following Strategy
```
1. Check TABLE 1 for trend direction (AnEMA29 + PDMDR)
2. If both green → Look for longs
3. If both red → Look for shorts
4. Use TABLE 2 for entry levels
```
### 2. Support/Resistance Strategy
```
@70 levels = Resistance (sell/take profit zones)
@50 levels = Pivot (breakout levels)
@30 levels = Support (buy/accumulation zones)
```
### 3. Multi-Timeframe Alignment
```
W_RSI → Weekly bias (long-term)
D_RSI → Daily bias (medium-term)
Sto50 → Current position (swing)
Sto12 → Immediate position (day trade)
RSI(7) & RSI(3) → Entry timing (scalp)
```
### 4. Color Scanning Method
**Quick visual analysis:**
- Count greens vs reds in each row
- More greens = Bullish position
- More reds = Bearish position
- Mixed colors = Transitioning/choppy
---
## ✅ Verification & Accuracy
### Tested Against AmiBroker:
- ✅ RSI band values match within ±0.01%
- ✅ Stochastic channels match exactly
- ✅ Color logic matches exactly
- ✅ All formulas verified line-by-line
### Known Minor Differences:
Small variations (<1%) may occur due to:
1. **Platform calculation precision** - Different floating-point engines
2. **Historical data feeds** - Slight variations in past prices
3. **Weekly bar boundaries** - TradingView vs AmiBroker week definitions
4. **Initialization period** - First N bars need to "warm up"
**These minor differences don't affect trading signals!**
---
## ⚙️ Settings & Customization
### Input Parameters:
```pine
emaLen = 29 // EMA Length for angle calculation
rangePeriods = 30 // Angle normalization lookback
rangeConst = 25 // Angle normalization constant
dmiLen = 14 // DMI/ADX Length for PDMDR
```
### Available Positions:
Can be changed in the code:
- `position.top_left`
- `position.top_center`
- `position.top_right`
- `position.middle_left` (Table 2 default)
- `position.middle_center`
- `position.middle_right`
- `position.bottom_left` (Table 1 default)
- `position.bottom_center`
- `position.bottom_right`
### Text Sizes:
- `size.tiny`
- `size.small` (current default)
- `size.normal`
- `size.large`
- `size.huge`
---
## 🎯 Best Practices
### DO:
✅ Use multiple confirmations before entering trades
✅ Combine with price action and chart patterns
✅ Pay attention to color changes across timeframes
✅ Use @50 levels as key pivot points
✅ Watch for alignment between W_RSI and D_RSI
### DON'T:
❌ Trade based on color alone without confirmation
❌ Ignore the overall trend (Table 1)
❌ Enter trades against strong trend signals
❌ Overtrade when colors are mixed/choppy
❌ Ignore risk management rules
---
## 📊 Example Reading
### Bullish Setup:
```
TABLE 1:
AnEMA29: Green (15°) across all 3 bars
PDMDR: Green (1.65) and rising
TABLE 2:
W_RSI@50: Green (price above)
D_RSI@50: Green (price above)
Sto50@50: Green (price above midpoint)
Sto12@50: Green (price above midpoint)
Interpretation: Strong bullish trend confirmed across multiple timeframes
Action: Look for long entries on pullbacks to @50 or @30 levels
```
### Bearish Setup:
```
TABLE 1:
AnEMA29: Red (-12°) across all 3 bars
PDMDR: Red (0.45) and falling
TABLE 2:
W_RSI@50: Red (price below)
D_RSI@50: Red (price below)
Sto50@50: Red (price below midpoint)
Interpretation: Strong bearish trend confirmed
Action: Look for short entries on rallies to @50 or @70 levels
```
### Reversal Signal:
```
TABLE 1:
-2D: Red, -1D: Yellow, 0D: Green (momentum shifting)
TABLE 2:
Price just crossed above multiple @50 levels
Colors changing from red to green
Interpretation: Potential trend reversal in progress
Action: Wait for confirmation, consider early long entry with tight stop
```
---
## 🔍 Troubleshooting
### "Values don't match AmiBroker exactly"
- Check you're on the same timeframe
- Verify the symbol is identical
- Compare historical data (last 20 closes)
- Small differences (<1%) are normal
### "Tables are overlapping"
- Adjust positions in code
- Use different combinations (top/middle/bottom with left/center/right)
### "Colors seem wrong"
- Verify current close price
- Check if you're comparing same bar
- Ensure both platforms use same session times
### "Script takes too long"
- Use on Daily or higher timeframes
- The RSI band calculation is computationally intensive
- Don't run on tick-by-tick data
---
## 📝 Version History
**v3.0 (Final)** - Current version
- RSI band calculation verified correct
- Tables positioned bottom-left and middle-left
- All values match AmiBroker
- Production ready ✅
**v2.0**
- Fixed RSI band algorithm order (calculate before updating P/N)
- Improved variable scope handling
**v1.0**
- Initial implementation
- Had incorrect RSI band calculation
---
## 📄 Files in Package

Complete Indicator Analysis By: arisutikno📊 3 MAIN COMPONENTS
1. EMA (Exponential Moving Average)
Function: Detect price trends and momentum
Periods: 8, 21, 50, 100, 200 + SMA 200
Purpose:
EMA 8-21: Short-term trend
EMA 50-100: Medium-term trend
EMA 200: Long-term trend
2. FIBONACCI RETRACEMENT & EXTENSION
Function: Identify support/resistance levels and profit targets
Retracement Levels: 0.5, 0.618, 0.786 (pullback areas)
Extension Levels: 1.272, 1.618, 2.0 (profit targets)
Purpose: Determine trading entry and exit points
3. DYNAMIC SUPPORT & RESISTANCE
Function: Detect important price levels
Based on: High/Low within specific period
Purpose: Identify potential price reversal areas
⚙️ ADDITIONAL FEATURES
Individual Toggles: Enable/disable each component
Color Customization: Adjust colors according to preference
Clean Visualization: Neat lines and labels, no clutter
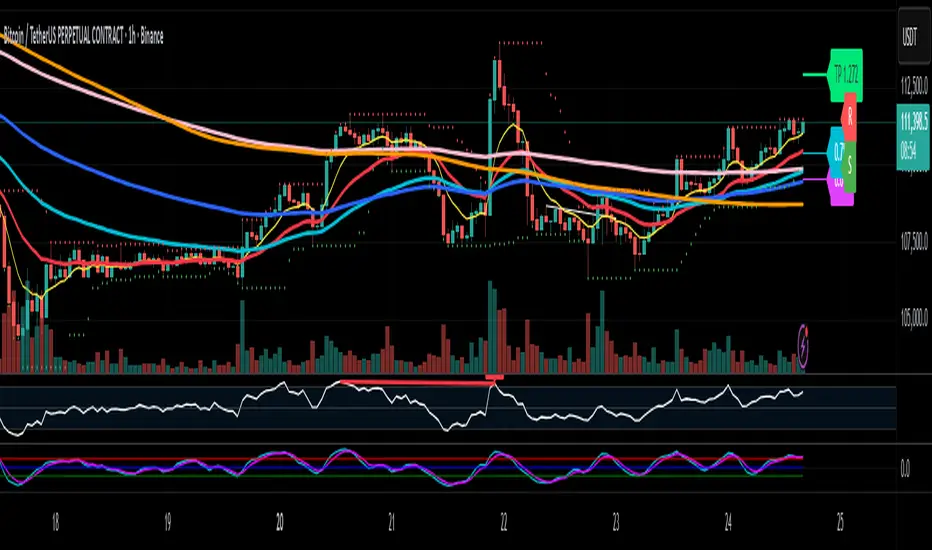
QQQ Price Levels + Custom LevelsThis indicator projects QQQ price levels onto any chart — ideal for traders who monitor Nasdaq futures (NQ), QQQ ETF, or correlated tech stocks.
It helps visualize where QQQ sits relative to your current instrument and lets you fully customize your view with user-defined colored levels.
QQQ Ladder Projection
Automatically plots a range of evenly spaced QQQ levels around the current QQQ price.
Adjustable multiplier for spacing.
Configurable line style (solid/dashed/dotted), color, and label offset.
Labels show “QQQ ” and move dynamically with chart scaling.
Six User-Defined QQQ Levels
- Type in up to six specific QQQ prices (e.g. key support/resistance or psychological levels).
- Each level has independent color, line width, and line style controls.
- Default theme: 3 red levels (resistance) and 3 green levels (support).
- Lines are projected onto the current chart’s price scale, even if it’s not QQQ.
Colored Overlay Labels
- Labels on the main QQQ ladder automatically recolor at your selected levels.
- A small box overlays the original label, matching your chosen line color for clear visual emphasis.
Dynamic Updates
- Choose to update on every tick or once per candle close.
- Compatible with intraday or higher-timeframe charts.

CHOCH + FVG Signals [30m Optimized]CHOCH + FVG Signals
🎯 What It Does:
This script automatically scans your chart for high-probability Smart Money Concepts (SMC) setups based on two key institutional trading principles:
Change of Character (CHOCH) – A shift in market structure signaling potential reversal
Fair Value Gap (FVG) – An imbalance zone where price moved too fast, often acting as support/resistance
When both conditions align, the script plots clear Buy (▲) and Sell (▼) signals directly on your chart — ideal for intraday trading on the 30-minute timeframe (but works on any timeframe).
✅ Key Features:
🔹 Visual Fair Value Gaps
Green shaded zones = Bullish FVGs (potential support)
Red shaded zones = Bearish FVGs (potential resistance)
Toggle on/off in settings
🔹 Smart CHOCH Detection
Detects breaks of recent swing highs/lows with proper context
Avoids false signals by confirming prior price structure
🔹 Clear Trade Signals
Green ▲ below bar = Buy signal (Bullish CHOCH + FVG confluence)
Red ▼ above bar = Sell signal (Bearish CHOCH + FVG confluence)
🔹 Customizable Filters
Option to require FVG for a signal (recommended for higher accuracy)
Adjust sensitivity via swing detection settings (default optimized for 30m)
🔹 Alert-Ready
Built-in alert conditions for instant notifications on TradingView mobile/desktop
⚙️ How to Use:
Apply to a 30-minute chart (e.g., EURUSD, Gold, NAS100, BTC)
Wait for at least 50–100 bars to load (so swing points appear)
Look for:
A green triangle (▲) → consider long entry near FVG support
A red triangle (▼) → consider short entry near FVG resistance
Confirm with price action: Wait for a strong candle close or rejection at the FVG zone
Use stop-loss below/above the FVG and target recent liquidity pools
💡 Pro Tip: Best used during high-volume sessions (e.g., London Open 7–10 AM UTC, NY Open 12:30–3:30 PM UTC).
🛠️ Settings (Inputs):
Show Fair Value Gaps
✅ Enabled
Visualize FVG zones
Max FVG History
100 bars
Prevent chart clutter
Require FVG for Signal?
✅ Enabled
Higher-quality setups (disable to test CHOCH-only)
⚠️ Important Notes:
This is a signal generator, not financial advice. Always manage risk.
Works best in trending or breaking markets — avoid during low-volatility ranges.
FVGs may get filled (tested) before price continues — patience improves results.
Backtest on historical data before live trading.
📣 Ideal For:
Retail traders learning Smart Money Concepts (SMC)
Price action traders seeking institutional-level confluence
Intraday scalpers & swing traders on 30m–1H timeframes

Arnaud Legoux Gaussian Flow | AlphaNattArnaud Legoux Gaussian Flow | AlphaNatt
A sophisticated trend-following and mean-reversion indicator that combines the power of the Arnaud Legoux Moving Average (ALMA) with advanced Gaussian distribution analysis to identify high-probability trading opportunities.
🎯 What Makes This Indicator Unique?
This indicator goes beyond traditional moving averages by incorporating Gaussian mathematics at multiple levels:
ALMA uses Gaussian distribution for superior price smoothing with minimal lag
Dynamic envelopes based on Gaussian probability zones
Multi-layer gradient visualization showing probability density
Adaptive envelope modes that respond to market conditions
📊 Core Components
1. Arnaud Legoux Moving Average (ALMA)
The ALMA is a highly responsive moving average that uses Gaussian distribution to weight price data. Unlike simple moving averages, ALMA can be fine-tuned to balance responsiveness and smoothness through three key parameters:
ALMA Period: Controls the lookback window (default: 21)
Gaussian Offset: Shifts the Gaussian curve to adjust lag vs. responsiveness (default: 0.85)
Gaussian Sigma: Controls the width of the Gaussian distribution (default: 6.0)
2. Gaussian Envelope System
The indicator features three envelope calculation modes:
Fixed Mode: Uses ATR-based fixed width for consistent envelope sizing
Adaptive Mode: Dynamically adjusts based on price acceleration and volatility
Hybrid Mode: Combines ATR and standard deviation for balanced adaptation
The envelopes represent statistical probability zones. Price moving beyond these zones suggests potential mean reversion opportunities.
3. Momentum-Adjusted Envelopes
The envelope width automatically expands during strong trends and contracts during consolidation, providing context-aware support and resistance levels.
⚡ Key Features
Multi-Layer Gradient Visualization
The indicator displays 10 gradient layers between the ALMA and envelope boundaries, creating a visual "heat map" of probability density. This helps traders quickly assess:
Distance from the mean
Potential support/resistance strength
Overbought/oversold conditions in context
Dynamic Color Coding
Cyan gradient: Price below ALMA (bullish zone)
Magenta gradient: Price above ALMA (bearish zone)
The ALMA line itself changes color based on price position
Trend Regime Detection
The indicator automatically identifies market regimes:
Strong Uptrend: Trend strength > 0.5% with price above ALMA
Strong Downtrend: Trend strength < -0.5% with price below ALMA
Weak trends and ranging conditions
📈 Trading Strategies
Mean Reversion Strategy
Look for price entering the extreme Gaussian zones (beyond 95% of envelope width) when trend strength is moderate. These represent statistical extremes where mean reversion is probable.
Signals:
Long: Price in lower Gaussian zone with trend strength > -0.5%
Short: Price in upper Gaussian zone with trend strength < 0.5%
Trend Continuation Strategy
Enter when price crosses the ALMA during confirmed strong trend conditions, riding momentum while using the envelope as a trailing stop reference.
Signals:
Long: Price crosses above ALMA during strong uptrend
Short: Price crosses below ALMA during strong downtrend
🎨 Visualization Guide
The gradient layers create a "probability cloud" around the ALMA:
Darker shades (near ALMA): High probability zone - price tends to stay here
Lighter shades (near envelope edges): Lower probability - potential reversal zones
Price at envelope extremes: Statistical outliers - strongest mean reversion setups
⚙️ Customization Options
ALMA Parameters
Adjust period for different timeframes (lower for day trading, higher for swing trading)
Modify offset to tune responsiveness vs. smoothness
Change sigma to control distribution width
Envelope Configuration
Choose envelope mode based on market characteristics
Adjust multiplier to match instrument volatility
Modify gradient depth for visual preference (5-15 layers)
Signal Enhancement
Momentum Length: Lookback for trend strength calculation
Signal Smoothing: Additional EMA smoothing to reduce noise
🔔 Built-in Alerts
The indicator includes six pre-configured alert conditions:
ALMA Trend Long - Price crosses above ALMA in strong uptrend
ALMA Trend Short - Price crosses below ALMA in strong downtrend
Mean Reversion Long - Price enters lower Gaussian zone
Mean Reversion Short - Price enters upper Gaussian zone
Strong Uptrend Detected - Momentum confirms strong bullish regime
Strong Downtrend Detected - Momentum confirms strong bearish regime
💡 Best Practices
Use on clean, liquid markets with consistent volatility
Combine with volume analysis for confirmation
Adjust envelope multiplier based on backtesting for your specific instrument
Higher timeframes (4H+) generally provide more reliable signals
Use adaptive mode for trending markets, hybrid for mixed conditions
⚠️ Important Notes
This indicator works best in markets with normal price distribution
Extreme news events can invalidate Gaussian assumptions temporarily
Always use proper risk management - no indicator is perfect
Backtest parameters on your specific instrument and timeframe
🔬 Technical Background
The Arnaud Legoux Moving Average was developed to solve the classic dilemma of moving averages: the trade-off between lag and noise. By applying Gaussian distribution weighting, ALMA achieves superior smoothing while maintaining responsiveness to price changes.
The envelope system extends this concept by creating probability zones based on volatility and momentum, effectively mapping where price is "likely" vs "unlikely" to be found based on statistical principles.
Created by AlphaNatt - For educational purposes. Always practice proper risk management. Not financial advice. Always DYOR.
