"supertrend" için komut dosyalarını ara

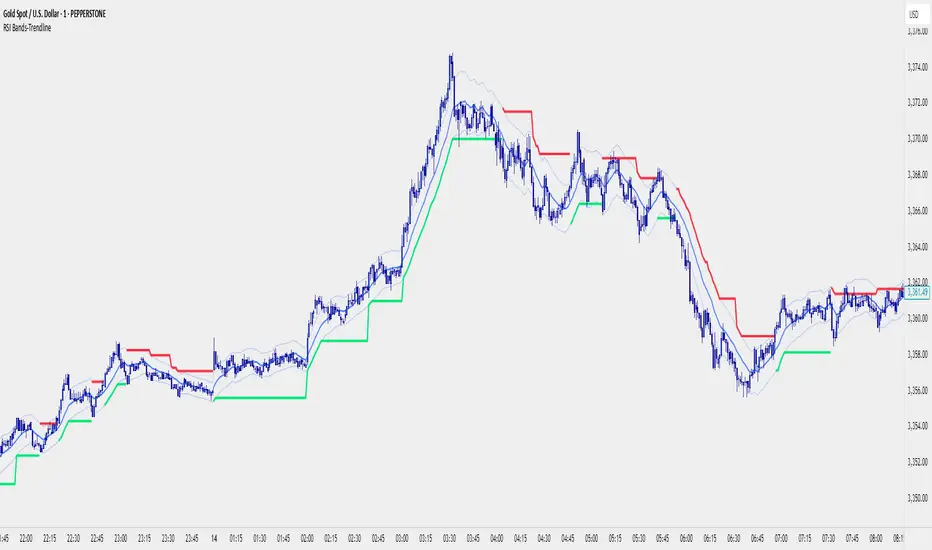
RSI Bands With RSI - ATR Trend LineRSI Bands With RSI - ATR Trend Line (Smoothed Baseline)
Overview
A trend-following tool that fuses RSI-based regime detection with a smoothed baseline and ATR bands. Trend line aims to stay with the RSI move, cut random noise, and flip cleanly. The line draws green in bulls and red in bears; signals fire only on candle close confirmed flips.
Key Features
✅ Dynamic Trend Detection
RSI (>50 / <50) sets bullish/bearish regime
Smoothed baseline adapts to price while damping whipsaw
ATR-based bands expand/contract with volatility
✅ Precise Signal Generation
Buy when trend flips to bullish (close confirms above the upper band)
Sell when trend flips to bearish (close confirms below the lower band)
Flips require a real band break → fewer false transitions
✅ Visual Clarity
Green line = bullish trend, Red line = bearish trend
✅ Customizable Settings
RSI Length (default 14)
Baseline Smoothing (default 26)
ATR Length (default 14)
ATR Multiplier (default 1.4)
Toggles for Signals and Labels
✅ TradingView Alerts
Built-in Buy & Sell alerts (recommend Once per bar close)
How It Works
Algorithm Logic
RSI Regime: RSI above/below 50 sets bull/bear. At exactly 50, the prior target is carried forward.
Target & Smoothing: A per-bar target is built from the bar’s range and RSI, then smoothed with an EMA-style filter (Baseline Smoothing) to form the baseline.
ATR Bands: Upper/Lower = baseline ± (ATR × Multiplier).
Flip Rule (Supertrend-like):
Close above upper band → bullish flip; trend line tracks the lower band (green).
Close below lower band → bearish flip; trend line tracks the upper band (red).
Between bands → prior trend line persists.
Signals/Alerts: A flip event generates a Buy/Sell signal and alert.
Best Use Cases
Trending Markets – Built to ride sustained moves in either direction.
Multiple Timeframes – Works from intraday to higher TFs; higher TFs usually produce cleaner flips.
Various Asset Classes – Forex, Indices, Stocks, Crypto, Commodities; ATR adapts to volatility.
Recommended Settings
Conservative (Lower Frequency)
RSI 14–20 • Baseline 34 • ATR 14–21 • Multiplier 1.8–2.2
Use for swing/position trading; calmer signal stream.
Balanced (Default)
RSI 14 • Baseline 26 • ATR 14 • Multiplier 1.4
Good general-purpose setup for swing or active intraday.
Aggressive (Higher Frequency)
RSI 10–14 • Baseline 13–21 • ATR 10–14 • Multiplier 1.1–1.3
For scalping/day trading; earlier but noisier flips.
🎨 Visual Elements
RSI Smooth baseline (soft blue)
Upper/Lower ATR Bands (faint blue)
Trend Line (Bull/Bear) drawn only in the active regime (green/red)
Optional Buy/Sell arrows and labels
⚠️ Important Notes
Signals on Close
Flips confirm on bar close. Intrabar crosses can revert; wait for confirmation.
Risk Management
Size positions appropriately; many traders trail beyond the opposite band/line.
Factor in spread, slippage, sessions, and news.
Confirmation & Testing
Combine with structure/volume/HTF bias if desired.
Backtest and forward-test per instrument and timeframe.
For research/education only; not financial advice.
TrendThis TradingView Pine Script indicator combines multiple technical systems (EMA Cross, EMA200 Bias, SuperTrend, Ichimoku, and ADX/DMI) into one consensus tool.
It identifies when all systems agree on a Bullish (BUY) or Bearish (SELL) trend, and also flags WEAK signals when consensus decreases.
Visual signals (labels on the chart) and alerts are included.

EMA Trend Regime Filter by JaeheeOverview
This indicator defines bullish/bearish regimes using a five-EMA stack and emits one signal per confirmed regime flip. Optional ATR gap gating and an ADX gate require structure and strength before a switch is confirmed. An optional, subtle center line improves readability. This is not a strategy and it does not execute trades.
Note: This tool is not the ATR-based Supertrend; it uses EMA stacking with ATR/ADX gating.
Why this combination (originality & value)
• EMA stacking provides a clear directional framework.
• ATR gap gating filters compressed/fragile stacks by requiring each adjacent EMA distance to exceed ATR × multiplier.
• A state machine limits signals to one per direction change, reducing alert fatigue.
• Confirm bars + ADX gate elevate the quality of regime recognition under directional pressure.
Together, these components interact to emphasize durable regime shifts while curbing noise typical of sideways phases.
How it works (concept)
EMA stack: Bullish when EMA1 > EMA2 > EMA3 > EMA4 > EMA5; bearish is the reverse.
ATR spacing (optional): When enabled, each EMA gap must exceed ATR × k to qualify for a flip.
Confirmation streak: Conditions must persist for confirmBars before a flip is validated.
Trend-strength gate: A flip is allowed only when ADX ≥ adxMin.
Flip & signal: On validation, a single marker/label is emitted; duplicates are suppressed.
Visual layer (optional): Subtle background/center line for context; visuals do not affect logic.
Why it’s useful
• Regime clarity: A binary bullish/bearish state reduces decision fatigue and aligns your playbook with market context.
• Counter-trend filter: In a bullish regime, counter-trend shorts are discouraged; in a bearish regime, counter-trend longs are discouraged—until the regime flips.
• Signal economy: One signal per confirmed flip helps avoid alert fatigue and over-trading.
• Volatility awareness: ATR gap gating filters compressed EMA stacks that often precede whipsaws.
• Strength confirmation: The ADX gate requires directional pressure before a switch is allowed.
Practical workflows (how it can be used)
• HTF compass (e.g., H4): Use a higher timeframe such as the 4-hour chart to set directional bias; execute on your lower timeframe with your own triggers and risk rules.
• Alignment rule: Trade in the direction of the active regime—prefer long setups during a bullish regime and short setups during a bearish regime—until a confirmed flip occurs.
• Pullback playbook: In a bullish regime, consider pullbacks to structure/MA confluence; in a bearish regime, consider rallies into resistance. Always size risk independently of the indicator.
• Parameter tuning: Adapt confirmBars, ATR × multiplier, and ADX minimum to the instrument’s volatility. Higher thresholds generally reduce noise but may delay flips.
• Alerts/automation: Set alerts on regime flips but confirm on bar close; intrabar values can update.
Context note (BTC, H4)
On higher timeframes such as the 4-hour chart, trends are often more stable. For BTC, the regime can help distinguish whether the broader market is trending up or down: when the H4 regime is bullish, favor long-side opportunities even if lower-timeframe candles retrace; when the regime turns bearish, favor short-side opportunities. This is context, not signals—entries/exits and risk management remain your responsibility.
Key inputs
• EMA lengths (1–5), Confirm Bars, Min Spacing by ATR
• ADX Length, ADX Minimum
• Visualization toggles (background opacity, center line, label/marker colors)
Alerts
• EMA REGIME LONG — fires once on a confirmed bullish regime
• EMA REGIME SHORT — fires once on a confirmed bearish regime
Notes & limitations
• Designed without future-bar references. Values can update intrabar, so confirm on close before acting on signals.
• This is an indicator for study purposes; it does not place trades.
• Parameters may require tuning across symbols/timeframes.
• Publish with a clean chart so the indicator’s output is clearly identifiable.
• Use on standard bar types (e.g., candles). Non-standard chart types can yield unrealistic behavior for signal logic.

Key Indicators Dashboard (KID)Key Indicators Dashboard (KID) — Comprehensive Market & Trend Metrics
📌 Overview
The Key Indicators Dashboard (KID) is an advanced multi-metric market analysis tool designed to consolidate essential technical, volatility, and relative performance data into a single on-chart table. Instead of switching between multiple indicators, KID centralizes these key measures, making it easier to assess a stock’s technical health, volatility state, trend status, and relative strength at a glance.
🛠 Key Features
⦿ Average Daily Range (ADR %): Measures average daily price movement over a specified period. It is calculated by averaging the daily price range (high - low) over a set number of days (default 20 days).
⦿ Average True Range (ATR): Measures volatility by calculating the average of a true range over a specific period (default 14). It helps traders gauge the typical extent of price movement, regardless of the direction.
⦿ ATR%: Expresses the Average True Range as a percentage of the price, which allows traders to compare the volatility of stocks with different prices.
⦿ Relative Strength (RS): Compares a stock’s performance to a chosen benchmark index (default NIFTYMIDSML400) over a specific period (default 50 days).
⦿ RS Score (IBD-style): A normalized 1–100 rating inspired by Investor’s Business Daily methodology.
How it works: The RS Score is based on a weighted average of price changes over 3 months (40%), 6 months (20%), 9 months (20%), and 12 months (20%).
The raw value is converted into a percentage return, then normalized over the past 252 trading days so the lowest value maps to 1 and the highest to 100.
This produces a percentile-style score that highlights the strongest stocks in relative terms.
⦿ Relative Volume (RVol): Compares a stock's current volume to its average volume over a specific period (default 50). It is calculated by dividing the current volume by the average historical volume.
⦿ Average ₹ Volume (Turnover): Represents the total monetary value of shares traded for a stock. It's calculated by multiplying a day's closing price by its volume, with the final value converted to crores for clarity. This metric is a key indicator of a stock's liquidity and overall market interest.
⦿ Moving Average Extension: Measures how far a stock's current price has moved from from a selected moving average (EMA or SMA). This deviation is normalized by the stock's volatility (ATR%), with a default threshold of 6 ATR used to indicate that the stock is significantly extended and is marked with a selected shape (default Red Flag).
⦿ 52-Weeks High & Low: Measures a stock's current price in relation to its highest and lowest prices over the past year. It calculates the percentage a stock is below its 52-week high and above its 52-week low.
⦿ Market Capitalization: Market Cap represents the total value of all outstanding.
⦿ Free Float: It is the value of shares readily available for public trading, with the Free Float Percentage showing the proportion of shares available to the public.
⦿ Trend: Uses Supertrend indicator to identify the current trend of a stock's price. A factor (default 3) and an ATR period (default 10) is used to signal whether the trend is up or down.
⦿ Minervini Trend Template (MTT): It is a set of technical criteria designed to identify stocks in strong uptrends.
Price > 50-DMA > 150-DMA > 200-DMA
200-DMA is trending up for at least 1 month
Price is at least 30% above its 52-week low.
Price is within at least 25 percent of its 52-week high
Table highlights when a stock meets all above criteria.
⦿ Sector & Industry: Display stock's sector and industry, provides categorical classification to assist sector-based analysis. The sector is a broad economic classification, while the industry is a more specific group within that sector.
⦿ Moving Averages (MAs): Plot up to four customizable Moving Averages on a chart. You can independently set the type (Simple or Exponential), the source price, and the length for each MA to help visualize a stock's underlying trend.
MA1: Default 10-EMA
MA2: Default 20-EMA
MA3: Default 50-EMA
MA4: Default 200-EMA
⦿ Moving Average (MA) Crossover: It is a trend signal that occurs when a shorter-term moving average crosses a longer-term one. This script identifies these crossover events and plots a marker on the chart to visually signal a potential change in trend direction.
User-configurable MAs (short and long).
A bullish crossover occurs when the short MA crosses above the long MA.
A bearish crossover occurs when the short MA crosses below the long MA.
⦿ Inside Bar (IB): An Inside Bar is a candlestick whose entire price range is contained within the range of the previous bar. This script identifies this pattern, which often signals consolidation, and visually marks bullish and bearish inside bars on the chart with distinct colors and labels.
⦿ Tightness: Identifies periods of low volatility and price consolidation. It compares the price range over a short lookback period (default 3) to the average daily range (ADR). When the lookback range is smaller than the ADR, the indicator plots a marker on the chart to signal consolidation.
⦿ PowerBar (Purple Dot): Identifies candles with a strong price move on high volume. By default, it plots a purple dot when a stock moves up or down by at least 5% and has a minimum volume of 500,000. More dots indicate higher volatility and liquidity.
⦿ Squeezing Range (SQ): Identifies periods of low volatility, which can often precede a significant price move. It checks if the Bollinger Bands have narrowed to a range that is smaller than the Average True Range (ATR) for a set number of consecutive bars (default 3).
(UpperBB - LowerBB) < (ATR × 2)
⦿ Mark 52-Weeks High and Low: Marks and labels a stock's 52-Week High and Low prices directly on the chart. It draws two horizontal lines extending from the candles where the highest and lowest prices occurred over the past year, providing a clear visual reference for long-term price extremes.
⏳PineScreener Filters
The indicator’s alert conditions act as filters for PineScreener.
Price Filter: Minimum and maximum price cutoffs (default ₹25 - ₹10000).
Daily Price Change Filter: Minimum and maximum daily percent change (default -5% and 5%).
🔔 Built-in Alerts
Supports alert creation for:
ADR%, ATR/ATR %, RS, RS Rating, Turnover
Moving Average Crossover (Bullish/Bearish)
Minervini Trend Template
52-Week High/Low
Inside Bars (Bullish/Bearish)
Tightness
Squeezing Range (SQ)
⚙️ Customizable Visualization
Switchable between vertical or horizontal layout.
Works in dark/light mode
User-configurable to toggle any indicator ON or OFF.
User-configurable Moving (EMA/SMA), Period/Lengths and thresholds.
⦿ (Optional) : For horizontal table orientation increase Top Margin to 16% in Chart (Canvas) settings to avoid chart overlapping with table.
⚡ Add this script to your chart and start making smarter trade decisions today! 🚀

Spice • Micro Suite (T/r & B/r)What it is
A single Pine v5 indicator that stacks:
EMA ribbon + a “special” EMA (11 vs 34) line that flips color on trend.
MTF-RSI “pressure” check with simple up/down arrows.
Bollinger-Band re-entry system with Top/Bottom triggers (T/B) and confirmations (r) in the next N bars.
Classic candlestick add-ons: 3-Line Strike and Leledc exhaustion dots.
Your Micro Dots engine (ATR-based regime + Variable Moving Average filter) + an optional VMA trend line.
Alerts for all the above.
Key signals (what prints on the chart)
EMAs (20/50/100/200): plotted faintly; EMA-34 is drawn and colored by the 11>34 trend.
RSI arrows
Checks RSI(6) on the current TF and (optionally) 5m/15m/30m/1h/4h/1D.
Down arrow: current RSI > 70 and the selected higher TF RSIs are also > 70 (pressure cluster just cooled; barssince(redZone)<2).
Up arrow: current RSI < 30 and selected higher TFs also < 30 (barssince(greenZone)<2).
Bollinger Reversals (your update)
T (Top trigger): first close back inside the upper BB (crossunder(close, upper)).
B (Bottom trigger): first close back inside the lower BB (crossover(close, lower)).
r (Confirm): within the next confirmBars bars (input), price also
closes below the T-bar’s low → top r above bar
closes above the B-bar’s high → bottom r below bar
Bar tinting
Only the T/B trigger bars are tinted (yellow/orange). Everything else stays your normal candle colors (unless you add the optional “trend candles” block I gave you).
3-Line Strike
Prints a small green/red circle when the 3-line strike pattern appears (bull/bear).
Leledc Exhaustion
Calculates a running buy/sell index; prints a small ∘ at major highs/lows when exhaustion conditions hit (major==-1 high, major==1 low).
Micro Dots (your second script, merged)
ATR “micro supertrend” defines regime (up/down).
A fast Variable Moving Average + a simple MA(18) filter.
Green dot below bar when: VMA < price, price > MA(18), regime up, and VMA not pointing down.
Red dot above bar for the bearish mirror.
Separate VMA trend line (length = Fast/Med/Slow) that colors green/red/orange by slope.
Inputs you’ll care about
Top/Bot Reversal → confirmBars (how many bars you allow to confirm the T/B trigger).
RSI Timeframes → toggle which HTFs must agree with the OB/OS condition.
EMAs → show/hide and lengths.
BB → show/hide basis/bands (used for T/B even if hidden).
Micro → show dots, show VMA line, choose intensity (Fast/Med/Slow).
Alerts
Prebuilt alerts for: RSI Up/Down, T/B triggers, T/B confirmations, 3-Line Strike bull/bear, Leledc highs/lows, EMA crosses (20/50/100/200), the special 11/34 trend change, Micro Dots, and VMA price cross. (Alert messages are const strings so they compile cleanly.)
How to read clusters (quick playbook)
Reversal short: see T on/near upper band → get an r within your window → bonus confidence if an RSI down arrow or Leledc ∘ high shows up around the same time.
Reversal long: mirror with B then r, plus RSI up arrow / Leledc ∘ low.
Continuation: ignore lone T/B if Micro Dot stays green (or red) and EMA-11 > EMA-34 remains true.
Why your candles look “normal”
By design, the script only colors bars on T or B trigger bars. If you want always-on trend candles, use the small block I gave you to color by EMA(20/50) (or any rule you like) and let T/B override on trigger bars.

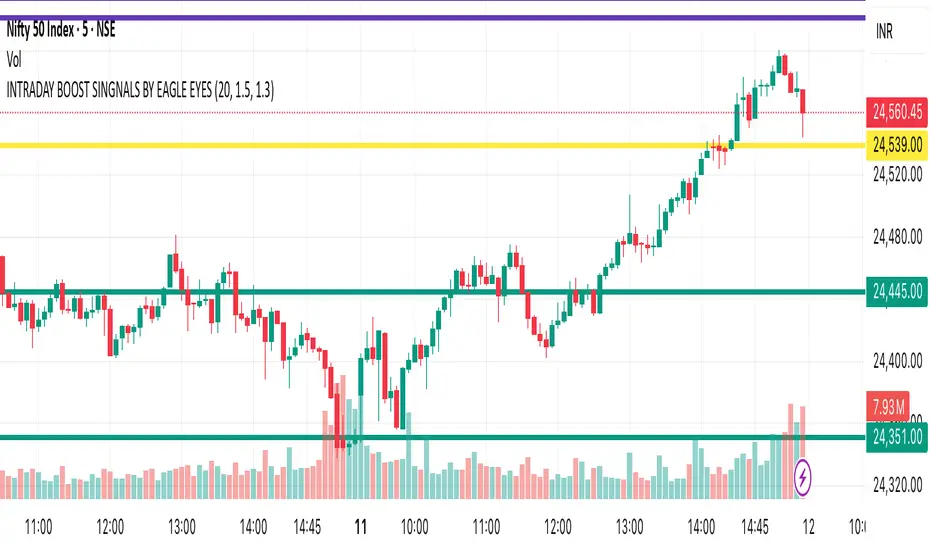
INTRADAY BOOST SINGNALS BY EAGLE EYESPurpose
Designed for short-term, high-activity traders who want quick trade entries and exits during market hours.
Likely focuses on momentum, volume spikes, and trend confirmation to catch intraday moves.
Key Features It Might Include
Signal Generation
Buy Signal: When upward momentum + volume surge + trend confirmation occurs.
Sell Signal: When downward momentum + high selling volume + trend reversal is detected.
Signals are probably marked with green arrows (buy) and red arrows (sell) on the chart.
Core Indicators Inside (probable)
Volume Filters: Detects strong participation behind the move.
Moving Average / EMA crossovers: Confirms short-term direction.
RSI / Stochastic: Filters out overbought/oversold traps.
Supertrend / UT Bot logic: Ensures signals follow a trend, not just noise.
Intraday Optimization
Works best on short timeframes like 1-min, 5-min, 15-min charts.
May include session filters so signals only trigger during active market hours.
Alerts
Configured so TradingView can send alerts for buy/sell signals in real-time.
Visuals
Arrows, colored bars, background shading for bullish/bearish momentum.
Possibly a dashboard showing trend strength, signal count, win ratio.
How It Helps Intraday Traders
Quick decision-making: Immediate visual and alert-based guidance.
Avoids overtrading: Filters false signals during sideways markets.
Momentum-based: Focuses on high-probability moves with strong backing.
OctaScalp Precision Pro [By TraderMan]What is OctaScalp Precision Pro ? 🚀
OctaScalp Precision is a powerful scalping indicator designed for fast, short-term trades. It combines eight technical indicators to generate 💪 high-accuracy buy 📗 and sell 📕 signals. Optimized for scalpers, this tool targets small price movements in low timeframes (1M, 5M). With visual lines 📈, labels 🎯, and Telegram alerts 📬, it simplifies quick decision-making, enhances risk management, and tracks trade performance.
What Does It Do? 🎯
Fast Signals: Produces reliable buy/sell signals using a consensus of eight indicators.
Risk Management: Offers automated Take Profit (TP) 🟢 and Stop Loss (SL) 🔴 levels with a 2:1 reward/risk ratio.
Trend Confirmation: Validates short-term trends with a 30-period EMA zone.
Performance Tracking: Records trade success rates (%) and the last 5 trades 📊.
User-Friendly: Displays market strength, signal type, and trade details in a top-right table.
Alerts: Sends Telegram-compatible notifications for new positions and trade results 📲.
How Does It Work? 🛠️
OctaScalp Precision integrates eight technical indicators (RSI, MACD, Stochastic, Momentum, 200-period EMA, Supertrend, CCI, OBV) for robust analysis. Each indicator contributes 0 or 1 point to a bullish 📈 or bearish 📉 score (max 8 points). Signals are generated as follows:
Buy Signal 📗: Bullish score ≥6 and higher than bearish score.
Sell Signal 📕: Bearish score ≥6 and higher than bullish score.
EMA Zone 📏: A zone (default 0.1%) around a 30-period EMA confirms trends. Price staying above or below the zone for 4 bars validates the direction:
Up Direction: Price above zone, color green 🟢.
Down Direction: Price below zone, color red 🔴.
Neutral: Price within zone, color gray ⚪.
Entry/Exit: Entries are triggered on new signals, with TP (2% profit) and SL (1% risk) auto-calculated.
Table & Alerts: Displays market strength (% bull/bear), signal type, entry/TP/SL, and success rate in a table. Telegram alerts provide instant notifications.
How to Use It? 📚
Setup 🖥️:
Add the indicator to TradingView and use default settings or customize (EMA length, zone width, etc.).
Best for low timeframes (1M, 5M).
Signal Monitoring 🔍:
Check the table: Bull Strength 📗 and Bear Strength 📕 percentages indicate signal reliability.
Confirm Buy (📗 BUY) or Sell (📕 SELL) signals when trendSignal is 1 or -1.
Entering a Position 🎯:
Buy: trendSignal = 1, bullish score ≥6, and higher than bearish score, enter at the entry price.
Sell: trendSignal = -1, bearish score ≥6, and higher than bullish score, enter at the entry price.
TP and SL: Follow the green (TP) 🟢 and red (SL) 🔴 lines on the chart.
Exiting 🏁:
If price hits TP, trade is marked ✅ successful; if SL, marked ❌ failed.
Results are shown in the “Last 5 Trades” 📜 section of the table.
Setting Alerts 📬:
Enable alerts in TradingView. Receive Telegram notifications for new positions and trade outcomes.
Position Entry Strategy 💡
Entry Conditions:
For Buy: Bullish score ≥6, trendSignal = 1, price above EMA zone 🟢.
For Sell: Bearish score ≥6, trendSignal = -1, price below EMA zone 🔴.
Check bull/bear strength in the table (70%+ is ideal for strong signals).
Additional Confirmation:
Use on high-volume assets (e.g., BTC/USD, EUR/USD).
Validate signals with support/resistance levels.
Be cautious in ranging markets; false signals may increase.
Risk Management:
Stick to the 2:1 reward/risk ratio (TP 2%, SL 1%).
Limit position size to 1-2% of your account.
Tips and Recommendations 🌟
Best Markets: Ideal for volatile markets (crypto, forex) and low timeframes (1M, 5M).
Settings: Adjust EMA length (default 30) or zone width (0.1%) based on the market.
Backtesting: Test on historical data to evaluate success rate 📊.
Discipline: Follow signals strictly and avoid emotional decisions.
OctaScalp Precision makes scalping fast, precise, and reliable! 🚀

Nifty50 Swing Trading Super Indicator# 🚀 Nifty50 Swing Trading Super Indicator - Complete Guide
**Created by:** Gaurav
**Date:** August 8, 2025
**Version:** 1.0 - Optimized for Indian Markets
---
## 📋 Table of Contents
1. (#quick-start-guide)
2. (#indicator-overview)
3. (#installation-instructions)
4. (#parameter-settings)
5. (#signal-interpretation)
6. (#trading-strategy)
7. (#risk-management)
8. (#optimization-tips)
9. (#troubleshooting)
---
## 🎯 Quick Start Guide
### What You Get
✅ **2 Complete Pine Script Indicators:**
- `swing_trading_super_indicator.pine` - Universal version for all markets
- `nifty_optimized_super_indicator.pine` - Specifically optimized for Nifty50 & Indian stocks
✅ **Key Features:**
- Multi-component signal confirmation system
- Optimized for daily and 3-hour timeframes
- Built-in risk management with dynamic stops and targets
- Real-time signal strength monitoring
- Gap analysis for Indian market characteristics
### Immediate Setup
1. Copy the Pine Script code from `nifty_optimized_super_indicator.pine`
2. Paste into TradingView Pine Editor
3. Add to chart on daily or 3-hour timeframe
4. Look for 🚀BUY and 🔻SELL signals
5. Use the information table for signal confirmation
---
## 🔍 Indicator Overview
### Core Components Integration
**🎯 Range Filter (35% Weight)**
- Primary trend identification using adaptive volatility filtering
- Optimized sampling period: 21 bars for Indian market volatility
- Enhanced range multiplier: 3.0 to handle market gaps
- Provides trend direction and strength measurement
**⚡ PMAX (30% Weight)**
- Volatility-adjusted trend confirmation using ATR-based calculations
- Dynamic multiplier adjustment based on market volatility
- 14-period ATR with 2.5 multiplier for swing trading sensitivity
- Offers trailing stop functionality
**🏗️ Support/Resistance (20% Weight)**
- Dynamic level identification using pivot point analysis
- Tighter channel width (3%) for precise Indian market levels
- Enhanced strength calculation with historical interaction weighting
- Provides entry/exit timing and breakout signals
**📊 EMA Alignment (15% Weight)**
- Multi-timeframe moving average confirmation
- Key EMAs: 9, 21, 50, 200 (popular in Indian markets)
- Hierarchical alignment scoring for trend strength
- Additional trend validation layer
### Advanced Features
**🌅 Gap Analysis**
- Automatic detection of significant price gaps (>2%)
- Gap strength measurement and impact on signals
- Specific optimization for Indian market overnight gaps
- Visual gap markers on chart
**⏰ Multi-Timeframe Integration**
- Higher timeframe bias from daily/weekly data
- Configurable daily bias weight (default 70%)
- 3-hour confirmation for precise entry timing
- Prevents counter-trend trades against major timeframe
**🛡️ Risk Management**
- Dynamic stop-loss calculation using multiple methods
- Automatic profit target identification
- Position sizing guidance based on signal strength
- Anti-whipsaw logic to prevent false signals
---
## 📥 Installation Instructions
### Step 1: Access TradingView
1. Open TradingView.com
2. Navigate to Pine Editor (bottom panel)
3. Create a new indicator
### Step 2: Copy the Code
**For Nifty50 & Indian Stocks (Recommended):**
```pinescript
// Copy entire content from nifty_optimized_super_indicator.pine
```
**For Universal Use:**
```pinescript
// Copy entire content from swing_trading_super_indicator.pine
```
### Step 3: Configure and Apply
1. Click "Add to Chart"
2. Select daily or 3-hour timeframe
3. Adjust parameters if needed (defaults are optimized)
4. Enable alerts for signal notifications
### Step 4: Verify Installation
- Check that all components are visible
- Confirm information table appears in top-right
- Test with known trending stocks for signal validation
---
## ⚙️ Parameter Settings
### 🎯 Range Filter Settings
```
Sampling Period: 21 (optimized for Indian market volatility)
Range Multiplier: 3.0 (handles overnight gaps effectively)
Source: Close (most reliable for swing trading)
```
### ⚡ PMAX Settings
```
ATR Length: 14 (standard for daily/3H timeframes)
ATR Multiplier: 2.5 (balanced for swing trading sensitivity)
Moving Average Type: EMA (responsive to price changes)
MA Length: 14 (matches ATR period for consistency)
```
### 🏗️ Support/Resistance Settings
```
Pivot Period: 8 (shorter for Indian market dynamics)
Channel Width: 3% (tighter for precise levels)
Minimum Strength: 3 (higher quality levels only)
Maximum Levels: 4 (focus on strongest levels)
Lookback Period: 150 (sufficient historical data)
```
### 🚀 Super Indicator Settings
```
Signal Sensitivity: 0.65 (balanced for swing trading)
Trend Strength Requirement: 0.75 (high quality signals)
Gap Threshold: 2.0% (significant gap detection)
Daily Bias Weight: 0.7 (strong higher timeframe influence)
```
### 🎨 Display Options
```
Show Range Filter: ✅ (trend visualization)
Show PMAX: ✅ (trailing stops)
Show S/R Levels: ✅ (key price levels)
Show Key EMAs: ✅ (trend confirmation)
Show Signals: ✅ (buy/sell alerts)
Show Trend Background: ✅ (visual trend state)
Show Gap Markers: ✅ (gap identification)
```
---
## 📊 Signal Interpretation
### 🚀 BUY Signals
**Requirements for BUY Signal:**
- Price above Range Filter with upward trend
- PMAX showing bullish direction (MA > PMAX line)
- Support/resistance breakout or favorable positioning
- EMA alignment supporting upward movement
- Higher timeframe bias confirmation
- Overall signal strength > 75%
**Signal Strength Indicators:**
- **90-100%:** Extremely strong - Maximum position size
- **80-89%:** Very strong - Large position size
- **75-79%:** Strong - Standard position size
- **65-74%:** Moderate - Reduced position size
- **<65%:** Weak - Wait for better opportunity
### 🔻 SELL Signals
**Requirements for SELL Signal:**
- Price below Range Filter with downward trend
- PMAX showing bearish direction (MA < PMAX line)
- Resistance breakdown or unfavorable positioning
- EMA alignment supporting downward movement
- Higher timeframe bias confirmation
- Overall signal strength > 75%
### ⚖️ NEUTRAL Signals
**Characteristics:**
- Conflicting signals between components
- Low overall signal strength (<65%)
- Range-bound market conditions
- Wait for clearer directional bias
### 📈 Information Table Guide
**Component Status:**
- **BULL/BEAR:** Current signal direction
- **Strength %:** Component contribution strength
- **Status:** Additional context (STRONG/WEAK/ACTIVE/etc.)
**Overall Signal:**
- **🚀 STRONG BUY:** All systems aligned bullish
- **🔻 STRONG SELL:** All systems aligned bearish
- **⚖️ NEUTRAL:** Mixed or weak signals
---
## 💼 Trading Strategy
### Daily Timeframe Strategy
**Setup:**
1. Apply indicator to daily chart of Nifty50 or Indian stocks
2. Wait for 🚀BUY or 🔻SELL signal with >75% strength
3. Confirm higher timeframe bias alignment
4. Check for significant support/resistance levels
**Entry:**
- Enter on signal bar close or next bar open
- Use 3-hour chart for precise entry timing
- Avoid entries during major news events
- Consider gap analysis for overnight positions
**Position Sizing:**
- **>90% Strength:** 3-4% of portfolio
- **80-89% Strength:** 2-3% of portfolio
- **75-79% Strength:** 1-2% of portfolio
- **<75% Strength:** Avoid or minimal size
### 3-Hour Timeframe Strategy
**Setup:**
1. Confirm daily timeframe bias first
2. Apply indicator to 3-hour chart
3. Look for signals aligned with daily trend
4. Use for entry/exit timing optimization
**Entry Refinement:**
- Wait for 3H signal confirmation
- Enter on pullbacks to key levels
- Use tighter stops for better risk/reward
- Monitor intraday support/resistance
### Risk Management Rules
**Stop Loss Placement:**
1. **Primary:** Use indicator's dynamic stop level
2. **Secondary:** Below/above nearest support/resistance
3. **Maximum:** 2-3% of portfolio per trade
4. **Trailing:** Move stops with PMAX line
**Profit Taking:**
1. **Target 1:** First resistance/support level (50% position)
2. **Target 2:** Second resistance/support level (30% position)
3. **Runner:** Trail remaining 20% with PMAX
**Position Management:**
- Review positions at daily close
- Adjust stops based on new signals
- Exit if trend changes to opposite direction
- Reduce size during high volatility periods
---
## 🎯 Optimization Tips
### For Nifty50 Trading
- Use daily timeframe for primary signals
- Monitor sector rotation impact
- Consider index futures for better liquidity
- Watch for RBI policy and global cues impact
### For Individual Stocks
- Verify stock follows Nifty correlation
- Check sector-specific news and events
- Ensure adequate liquidity for position size
- Monitor earnings calendar for volatility
### Market Condition Adaptations
**Trending Markets:**
- Increase position sizes for strong signals
- Use wider stops to avoid whipsaws
- Focus on trend continuation signals
- Reduce counter-trend trading
**Range-Bound Markets:**
- Reduce position sizes
- Use tighter stops and quicker profits
- Focus on support/resistance bounces
- Increase signal strength requirements
**High Volatility Periods:**
- Reduce overall exposure
- Use smaller position sizes
- Increase stop-loss distances
- Wait for clearer signals
### Performance Monitoring
- Track win rate and average profit/loss
- Monitor signal quality over time
- Adjust parameters based on market changes
- Keep trading journal for pattern recognition
---
## 🔧 Troubleshooting
### Common Issues
**Q: Signals appear too frequently**
A: Increase "Trend Strength Requirement" to 0.8-0.9
**Q: Missing obvious trends**
A: Decrease "Signal Sensitivity" to 0.5-0.6
**Q: Too many false signals**
A: Enable "3H Confirmation" and increase strength requirements
**Q: Indicator not loading**
A: Check Pine Script version compatibility (requires v5)
### Parameter Adjustments
**For More Sensitive Signals:**
- Decrease Signal Sensitivity to 0.5-0.6
- Decrease Trend Strength Requirement to 0.6-0.7
- Increase Range Filter multiplier to 3.5-4.0
**For More Conservative Signals:**
- Increase Signal Sensitivity to 0.7-0.8
- Increase Trend Strength Requirement to 0.8-0.9
- Enable all confirmation features
### Performance Issues
- Reduce lookback periods if chart loads slowly
- Disable some visual elements for better performance
- Use on liquid stocks/indices for best results
---
## 📞 Support & Updates
This super indicator combines the best of Range Filter, PMAX, and Support/Resistance analysis specifically optimized for Indian market swing trading. The multi-component approach significantly improves signal quality while the built-in risk management features help protect capital.
**Remember:** No indicator is 100% accurate. Always combine with proper risk management, market analysis, and your trading experience for best results.
**Happy Trading! 🚀**

anand ha + RsiHow it works:
Green Line: When RSI > 50 AND Heikin Ashi is bullish (uptrend)
Red Line: When RSI < 50 AND Heikin Ashi is bearish (downtrend)
The line dynamically positions itself below price during uptrends and above price during downtrends
Uses ATR to maintain appropriate distance from price action
Includes subtle background fill between price and the trend line
Key Features:
Single clean trend line (no candles, no extra indicators)
Color changes based on trend direction
Self-adjusting position using ATR
Smooth transitions to avoid whipsaws
Minimal visual clutter, just like SuperTrend
The line will stay green below price when both RSI is above 50 and Heikin Ashi shows bullish momentum, and red above price when both conditions turn bearish. This gives you a clear visual trend following system in a simple line format.
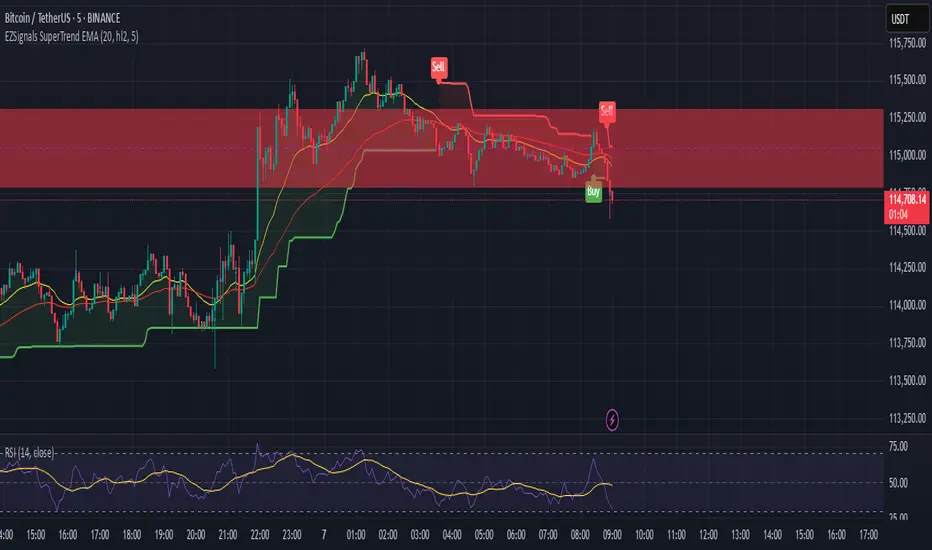
EZSignals SuperTrend EMAA technical indicator, even with high accuracy, must be rigorously backtested to assess its stability across various market conditions. Its effectiveness depends not only on the algorithm itself but also on how it is integrated into the overall trading system. Proper usage, combined with risk management and a solid understanding of market context, is essential to convert theoretical accuracy into practical trading advantage.

EZSignals SuperTrend EMAA technical indicator, even with high accuracy, must be rigorously backtested to assess its stability across various market conditions. Its effectiveness depends not only on the algorithm itself but also on how it is integrated into the overall trading system. Proper usage, combined with risk management and a solid understanding of market context, is essential to convert theoretical accuracy into practical trading advantage.
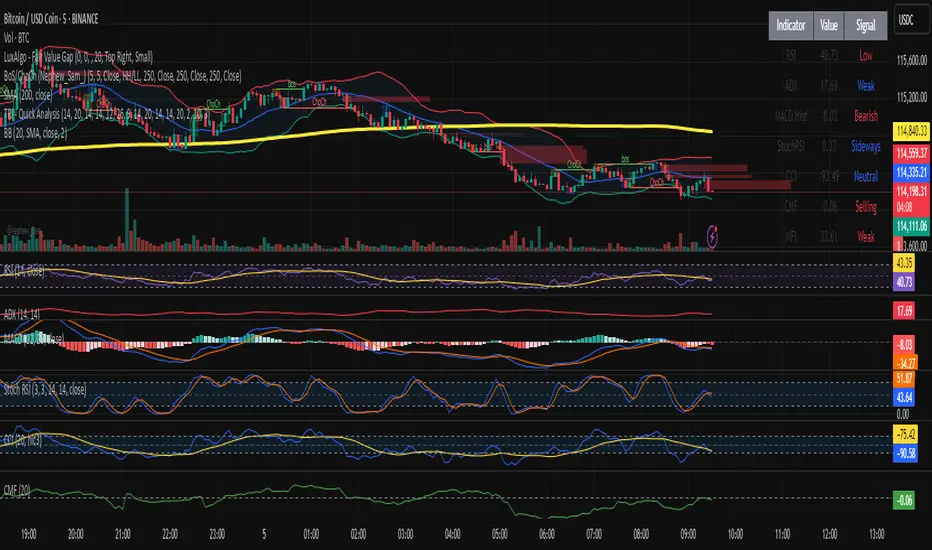
TRI - Quick Analysis"TRI - Quick Analysis" is a multi-indicator dashboard designed to give traders an immediate overview of market momentum, trend strength, volume flow, and volatility.
It visually summarizes key technical indicators in a compact table, including:
RSI (momentum)
MACD Histogram (trend momentum)
ADX + SuperTrend (trend strength & direction)
StochRSI (oversold/overbought)
CCI (price deviation)
CMF (volume flow)
MFI (volume-weighted momentum)
OBV (cumulative volume pressure)
ATR (volatility)
%B Bollinger (position within Bollinger Bands)
Each value is color-coded (green, red, blue) based on whether it's favorable, unfavorable, or neutral for a potential long position.
At the bottom of the table, a summary score dynamically aggregates signals from all indicators and provides a simple trading score.
This tool is designed for discretionary traders looking for a quick, color-coded insight into current market conditions without relying on a single signal.
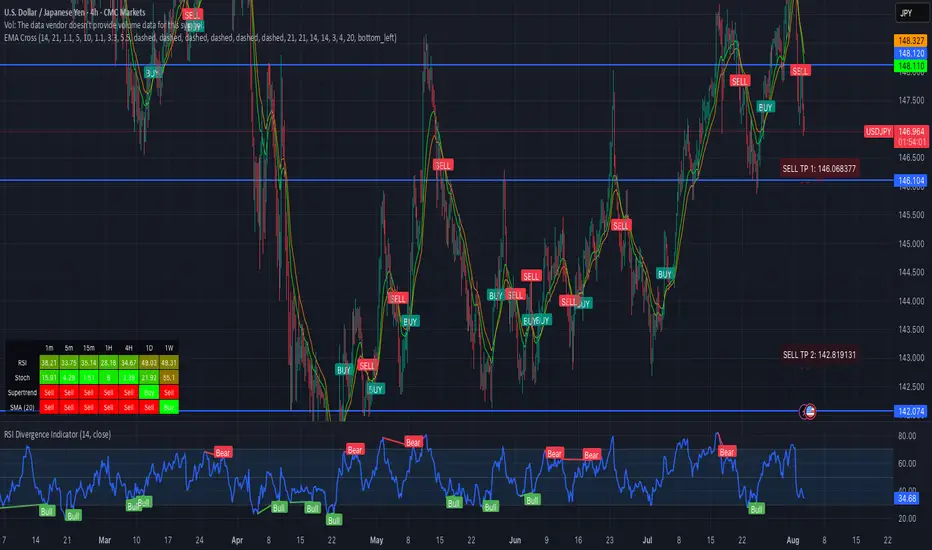
EMA Crossover ConfirmationFast ema crossover script to identify trend changes.
There is also supertrend for all time frames.
Modified from the script
BS | Buy&Sell Signals With EMA
Multi-Indicator DashboardOnline data on all timeframes for volatility.
Which allows you to conduct technical and indicator analysis faster.
Used indicators: SuperTrend, RSI, EMA.
There are alerts and settings for each indicators.

🕶️ StealthFlow™ Prime – Option Sniper Signal System🕶️ How to Use the StealthFlow™ Prime – Option Sniper Signal System
Welcome to the StealthFlow™ Prime – your edge in the fast-moving world of Nifty & Bank Nifty options.
🔑 Access Instructions:
1. I’ve granted access to your TradingView username.
2. Open your TradingView account.
3. Go to “Indicators” → “Invite-only scripts”
4. Search and click on:
🕶️ StealthFlow™ Prime – Option Sniper Signal System
✅ It will now load automatically on your chart.
📈 Recommended Chart Setup
Parameter Setting
Timeframe 5-minute or 15-minute (also check with 3 mins)
Symbol NIFTY or BANKNIFTY
Chart Type Candlestick
Session Intraday only
🧠 How It Works (Simplified)
This system detects momentum shifts and hidden price action flows based on:
• Supertrend logic (breakouts)
• Volume-weighted indicators (VWMA & VWAP)
• EMA for directional trend
🔔 Trade Signals:
• 🟢 BUY Signal:
A green “BUY” label appears below the candle when the system detects a bullish breakout.
• 🔴 SELL Signal:
A red “SELL” label appears above the candle when momentum flips bearish.
Use these signals to time your entry into CE/PE positions — especially after consolidation or breakout setups.
⚠️ Pro Tips for Option Traders:
• Only trade in high-volume sessions (9:30 AM – 11:30 PM IST)
• Avoid trades near big events (RBI policy, global news)
• Target ATM or slightly ITM options with 1–2 lots for low-risk entries
• Combine with price action at support/resistance for sniper accuracy
📲 Optional: Set Alerts
1. Click “Alerts”
2. Condition: Choose StealthFlow BUY Alert or SELL Alert
3. Set to: Once per Bar Close
4. Enable Push, Email, Popup as per your preference
5. Click Create
Now you’ll get instant notifications when a trade signal fires — no need to stare at charts all day.

Corys Buy and SellThe Cory’s Buy and Sell indicator is an advanced, all-in-one trading toolkit that combines dynamic trend detection, volatility breakout alerts, and visual EMA strength to help traders confidently identify high-probability buy and sell opportunities.
🔍 Key Features:
Adaptive Supertrend Engine
Powered by a modified Keltner Channel, this trend-following algorithm generates timely BUY 🚀 and SELL 😡 signals based on market momentum and volatility, with adjustable sensitivity and factor settings for full control.
EMA Energy Bands (Optional)
A cascade of 15 EMAs (from 9 to 51 periods) visually maps market energy. Colours shift from green (bullish) to red (bearish), showing short- to medium-term trend strength at a glance.
Trend Catcher Overlay
Highlights major shifts in trend using a fast/slow EMA crossover (10 vs 20 EMA). Bars are coloured to reflect bullish reversals for added confidence.
Pullback Signal Detection
Identifies bullish pullback opportunities when price reclaims key EMA levels after a crossover, marked with a green triangle for entry timing.
Built-in Range Detection System
Automatically highlights price consolidation zones using ATR-based logic. When price breaks above or below the detected range, the zone changes colour (green for breakout up, red for breakdown), helping traders spot breakout opportunities.
Smart Labels & Alerts
Instant BUY/SELL labels on the chart and built-in alert conditions make this indicator suitable for both discretionary and automated trading strategies.
⚙️ Customisable Inputs:
Sensitivity (for trend signals)
EMA Energy toggle
Keltner & ATR Lengths
Range Detection parameters and styling
Best For: Trend traders, breakout traders, and swing traders looking for a clean, powerful overlay that combines momentum, structure, and volatility in one tool.

MIGA Trader DNAMIGA Trader DNA is a composite indicator that integrates:
Trend Identification: Uses three exponential moving averages (fast, mid, slow) to determine market bias based on their order.
Momentum Filter: An adaptive RSI whose period automatically matches the fastest EMA highlights overbought or oversold conditions.
Entry Timing: A Stochastic %K crossover signals precise entry points when momentum aligns with trend direction.
Volatility Envelope: An optional, SuperTrend band adjusts dynamically to changing ATR-based volatility.
Visual Signals: Discrete “Buy” and “Sell” labels mark entry opportunities directly on the price chart when all conditions align.

Vilarso-style SuperTrend + Fibonacci SMAsThis indicator is based on mathematical calculations of the average price on the chart over a specified period. It takes into account trading volume, volatility, and candlestick patterns. For active trading, it includes a linear regression channel that calculates the price correlation coefficient.
The indicator identifies entry points into active buying and selling zones and detects local highs and lows. It considers the trend direction and repaints candles/bars accordingly. During sideways (flat) market conditions, temporary deviations from the trend logic may occur — this should be factored into technical analysis.
Signals are generated when candle volume increases — without delay. A signal is confirmed when a new candle opens. While the current candle is still open, the signal may be canceled depending on the logic (volume, candlestick structure, breakout above the average price, volatility period, etc.).
Thanks to this logic (signals on candle open), you can set up alerts according to your trading strategy and receive notifications via sound on your screen or in the TradingView mobile app. This helps you stay on top of market movements.
The indicator can be used on any timeframe — from 1 minute to monthly or yearly charts. It includes settings tailored to three main strategies:
• Active (intraday / scalping)
• Standard (swing / mid-term)
• Long-Term (monthly trend following)
Note:
• It is recommended to use this indicator alongside other technical analysis tools.
• Before using it in live trading, analyze its historical behavior on your chart.
• TradingView users can set personal alerts only with a paid subscription: PRO (10 alerts), PRO+ (30), Premium (200).
• For users without a paid subscription, there is an option to receive notifications via a Telegram channel — available to all users of the indicator.

Custom Screener with Alerts @RAMLAKSHMANDASScan the Nifty 50 directly on TradingView!
This script provides a real-time screener for the top 40 Nifty 50 stocks ranked by current index weightage (starting from RELIANCE, HDFCBANK, ICICIBANK, etc.), offering rapid on-chart multi-symbol analysis.
Features
Multi-symbol screener: Monitors the leading 40 Nifty constituents (NSE equities) in one view.
Full indicator table: Get snapshot values for Price, RSI, TSI, ADX, and SuperTrend for every symbol.
Dynamic filtering: Instantly filter results by any indicator value (e.g., highlight all stocks with RSI below 30).
Customizable symbols: Easily edit the symbol list to match updated Nifty composition or your stocks of interest.
Multi-timeframe support: Table values will update for any chosen chart timeframe.
Real-time alerts: Set up alerts for filtered stocks matching your strategy.

Reversal Point Dynamics⇋ Reversal Point Dynamics (RPD)
This is not an indicator; it is a complete system for deconstructing the mechanics of a market reversal. Reversal Point Dynamics (RPD) moves far beyond simplistic pattern recognition, venturing into a deep analysis of the underlying forces that cause trends to exhaust, pause, and turn. It is engineered from the ground up to identify high-probability reversal points by quantifying the confluence of market dynamics in real-time.
Where other tools provide a static signal, RPD delivers a dynamic probability. It understands that a true market turning point is not a single event, but a cascade of failing momentum, structural breakdown, and a shift in market order. RPD's core engine meticulously analyzes each of these dynamic components—the market's underlying state, its velocity and acceleration, its degree of chaos (entropy), and its structural framework. These forces are synthesized into a single, unified Probability Score, offering you an unprecedented, transparent view into the conviction behind every potential reversal.
This is not a "black box" system. It is an open-architecture engine designed to empower the discerning trader. Featuring real-time signal projection, an integrated Fibonacci R2R Target Engine, and a comprehensive dashboard that acts as your Dynamics Control Center , RPD gives you a complete, holistic view of the market's state.
The Theoretical Core: Deconstructing Market Dynamics
RPD's analytical power is born from the intelligent synthesis of multiple, distinct theoretical models. Each pillar of the engine analyzes a different facet of market behavior. The convergence of these analyses—the "Singularity" event referenced in the dashboard—is what generates the final, high-conviction probability score.
1. Pillar One: Quantum State Analysis (QSA)
This is the foundational analysis of the market's current state within its recent context. Instead of treating price as a random walk, QSA quantizes it into a finite number of discrete "states."
Formulaic Concept: The engine establishes a price range using the highest high and lowest low over the Adaptive Analysis Period. This range is then divided into a user-defined number of Analysis Levels. The current price is mapped to one of these states (e.g., in a 9-level system, State 0 is the absolute low, and State 8 is the absolute high).
Analytical Edge: This acts as a powerful foundational filter. The engine will only begin searching for reversal signals when the market has reached a statistically stretched, extreme state (e.g., State 0 or 8). The Edge Sensitivity input allows you to control exactly how close to this extreme edge the price must be, ensuring you are trading from points of maximum potential exhaustion.
2. Pillar Two: Price State Roc (PSR) - The Dynamics of Momentum
This pillar analyzes the kinetic forces of the market: its velocity and acceleration. It understands that it’s not just where the price is, but how it got there that matters.
Formulaic Concept: The psr function calculates two derivatives of price.
Velocity: (price - price ). This measures the speed and direction of the current move.
Acceleration: (velocity - velocity ). This measures the rate of change in that speed. A negative acceleration (deceleration) during a strong rally is a critical pre-reversal warning, indicating momentum is fading even as price may be pushing higher.
Analytical Edge: The engine specifically hunts for exhaustion patterns where momentum is clearly decelerating as price reaches an extreme state. This is the mechanical signature of a weakening trend.
3. Pillar Three: Market Entropy Analysis - The Dynamics of Order & Chaos
This is RPD's chaos filter, a concept borrowed from information theory. Entropy measures the degree of randomness or disorder in the market's price action.
Formulaic Concept: The calculateEntropy function analyzes recent price changes. A market moving directionally and smoothly has low entropy (high order). A market chopping back and forth without direction has high entropy (high chaos). The value is normalized between 0 and 1.
Analytical Edge: The most reliable trades occur in low-entropy, ordered environments. RPD uses the Entropy Threshold to disqualify signals that attempt to form in chaotic, unpredictable conditions, providing a powerful shield against whipsaw markets.
4. Pillar Four: The Synthesis Engine & Probability Calculation
This is where all the dynamic forces converge. The final probability score is a weighted calculation that heavily rewards confluence.
Formulaic Concept: The calculateProbability function intelligently assembles the final score:
A Base Score is established from trend strength and entropy.
An Entropy Score adds points for low entropy (order) and subtracts for high entropy (chaos).
A significant Divergence Bonus is awarded for a classic momentum divergence.
RSI & Volume Bonuses are added if momentum oscillators are in extreme territory or a volume spike confirms institutional interest.
MTF & Adaptive Bonuses add further weight for alignment with higher timeframe structure.
Analytical Edge: A signal backed by multiple dynamic forces (e.g., extreme state + decelerating momentum + low entropy + volume spike) will receive an exponentially higher probability score. This is the very essence of analyzing reversal point dynamics.
The Command Center: Mastering the Inputs
Every input is a precise lever of control, allowing you to fine-tune the RPD engine to your exact trading style, market, and timeframe.
🧠 Core Algorithm
Predictive Mode (Early Detection):
What It Is: Enables the engine to search for potential reversals on the current, unclosed bar.
How It Works: Analyzes intra-bar acceleration and state to identify developing exhaustion. These signals are marked with a ' ? ' and are tentative.
How To Use It: Enable for scalping or very aggressive day trading to get the earliest possible indication. Disable for swing trading or a more conservative approach that waits for full bar confirmation.
Live Signal Mode (Current Bar):
What It Is: A highly aggressive mode that plots tentative signals with a ' ! ' on the live bar based on projected price and momentum. These signals repaint intra-bar.
How It Works: Uses a linear regression projection of the close to anticipate a reversal.
How To Use It: For advanced users who use intra-bar dynamics for execution and understand the nature of repainting signals.
Adaptive Analysis Period:
What It Is: The main lookback period for the QSA, PSR, and Entropy calculations. This is the engine's "memory."
How It Works: A shorter period makes the engine highly sensitive to local price swings. A longer period makes it focus only on major, significant market structure.
How To Use It: Scalping (1-5m): 15-25. Day Trading (15m-1H): 25-40. Swing Trading (4H+): 40-60.
Fractal Strength (Bars):
What It Is: Defines the strength of the pivot detection used for confirming reversal events.
How It Works: A value of '2' requires a candle's high/low to be more extreme than the two bars to its left and right.
How To Use It: '2' is a robust standard. Increase to '3' for an even stricter definition of a structural pivot, which will result in fewer signals.
MTF Multiplier:
What It Is: Integrates pivot data from a higher timeframe for confluence.
How It Works: A multiplier of '4' on a 15-minute chart will pull pivot data from the 1-hour chart (15 * 4 = 60m).
How To Use It: Set to a multiple that corresponds to your preferred higher timeframe for contextual analysis.
🎯 Signal Settings
Min Probability %:
What It Is: Your master quality filter. A signal is only plotted if its score exceeds this threshold.
How It Works: Directly filters the output of the final probability calculation.
How To Use It: High-Quality (80-95): For A+ setups only. Balanced (65-75): For day trading. Aggressive (50-60): For scalping.
Min Signal Distance (Bars):
What It Is: A noise filter that prevents signals from clustering in choppy conditions.
How It Works: Enforces a "cooldown" period of N bars after a signal.
How To Use It: Increase in ranging markets to focus on major swings. Decrease on lower timeframes.
Entropy Threshold:
What It Is: Your "chaos shield." Sets the maximum allowable market randomness for a signal.
How It Works: If calculated entropy is above this value, the signal is invalidated.
How To Use It: Lower values (0.1-0.5): Extremely strict. Higher values (0.7-1.0): More lenient. 0.85 is a good balance.
Adaptive Entropy & Aggressive Mode:
What It Is: Toggles for dynamically adjusting the engine's core parameters.
How It Works: Adaptive Entropy can slightly lower the required probability in strong trends. Aggressive Mode uses more lenient settings across the board.
How To Use It: Keep Adaptive on. Use Aggressive Mode sparingly, primarily for scalping highly volatile assets.
📊 State Analysis
Analysis Levels:
What It Is: The number of discrete "states" for the QSA.
How It Works: More levels create a finer-grained analysis of price location.
How To Use It: 6-7 levels are ideal. Increasing to 9 can provide more precision on very volatile assets.
Edge Sensitivity:
What It Is: Defines how close to the absolute top/bottom of the range price must be.
How It Works: '0' means price must be in the absolute highest/lowest state. '3' allows a signal within the top/bottom 3 states.
How To Use It: '3' provides a good balance. Lower it to '1' or '0' if you only want to trade extreme exhaustion.
The Dashboard: Your Dynamics Control Center
The dashboard provides a transparent, real-time view into the engine's brain. Use it to understand the context behind every signal and to gauge the current market environment at a glance.
🎯 UNIFIED PROB SCORE
TOTAL SCORE: The highest probability score (either Peak or Valley) the engine is currently calculating. This is your main at-a-glance conviction metric. The "Singularity" header refers to the event where market dynamics align—the event RPD is built to detect.
Quality: A human-readable interpretation of the Total Score. "EXCEPTIONAL" (🌟) is a rare, A+ confluence event. "STRONG" (💪) is a high-quality, tradable setup.
📊 ORDER FLOW & COMPONENT ANALYSIS
Volume Spike: Shows if the current volume is significantly higher than average (YES/NO). A 'YES' adds major confirmation.
Peak/Valley Conf: This breaks down the probability score into its directional components, showing you the separate confidence levels for a potential top (Peak) versus a bottom (Valley).
🌌 MARKET STRUCTURE
HTF Trend: Shows the direction of the underlying trend based on a Supertrend calculation.
Entropy: The current market chaos reading. "🔥 LOW" is an ideal, ordered state for trading. "😴 HIGH" is a warning of choppy, unpredictable conditions.
🔮 FIB & R2R ZONE (Large Dashboard)
This section gives you the status of the Fibonacci Target Engine. It shows if an Active Channel (entry zone) or Stop Zone (invalidation zone) is active and displays the precise price levels for the static entry, target, and stop calculated at the time of the signal.
🛡️ FILTERS & PREDICTIVES (Large Dashboard)
This panel provides a status check on all the bonus filters. It shows the current RSI Status, whether a Divergence is present, and if a Live Pending signal is forming.
The Visual Interface: A Symphony of Data
Every visual element is designed for instant, intuitive interpretation of market dynamics.
Signal Markers: These are the primary outputs of the engine.
▼/▲ b: A fully confirmed signal that has passed all filters.
? b: A tentative signal generated in Predictive Mode, indicating developing dynamics.
◈ b: This diamond icon replaces the standard triangle when the signal is confirmed by a strong momentum divergence, highlighting it as a superior setup where dynamics are misaligned with price.
Harmonic Wave: The flowing, colored wave around the price.
What It Represents: The market's "flow dynamic" and volatility.
How to Interpret It: Expanding waves show increasing volatility. The color is tied to the "Quantum Color" in your theme, representing the underlying energy field of the market.
Entropy Particles: The small dots appearing above/below price.
What They Represent: A direct visualization of the "order dynamic."
How to Interpret Them: Their presence signifies a low-entropy, ordered state ideal for trading. Their color indicates the direction of momentum (PSR velocity). Their absence means the market is too chaotic (high entropy).
The Fibonacci Target Engine: The dynamic R2R system appearing post-signal.
Static Fib Levels: Colored horizontal lines representing the market's "structural dynamic."
The Green "Active Channel" Box: Your zone of consideration. An area to manage a potential entry.
Development Philosophy
Reversal Point Dynamics was engineered to answer a fundamental question: can we objectively measure the forces behind a market turn? It is a synthesis of concepts from market microstructure, statistics, and information theory. The objective was never to create a "perfect" system, but to build a robust decision-support tool that provides a measurable, statistical edge by focusing on the principle of confluence.
By demanding that multiple, independent market dynamics align simultaneously, RPD filters out the vast majority of market noise. It is designed for the trader who thinks in terms of probability and risk management, not in terms of certainties. It is a tool to help you discount the obvious and bet on the unexpected alignment of market forces.
"Markets are constantly in a state of uncertainty and flux and money is made by discounting the obvious and betting on the unexpected."
— George Soros
Trade with insight. Trade with anticipation.
— Dskyz, for DAFE Trading Systems

NSE/BSE Straddle/Strangle Candle ChartStraddle Candlestick Strategy Indicator
This custom Pine Script indicator is designed to visualize the price action of options using a candlestick chart for Nifty, BankNifty, FINNIFTY, and Midcap indices. It combines Call and Put options for multiple strikes around the underlying asset, creating a detailed view of market movement in a straddle strategy.
Key Features:
Candlestick Visualization: The indicator plots candlestick charts based on the combined price action of both Call and Put options, helping traders analyze price trends for different strikes.
Multi-Strike Options Analysis: It dynamically calculates and plots strike prices above and below the At-the-Money (ATM) strike, offering a comprehensive look at potential price movement across various strike levels.
Customizable Inputs: Users can adjust the strike interval, choose between different index symbols, and customize the appearance of the indicator (e.g., font size, table layout, and color themes).
User-Friendly Dashboard: A clear, customizable dashboard presents the strike price data, along with essential candlestick details, to help users understand the overall market trends at a glance.
Use Case:
This indicator is ideal for traders using straddle strategies on NSE options. It gives users a clear and intuitive visual representation of price action around the ATM strike, helping traders make informed decisions based on the options' movement.
Notes:
The VWAP (Volume-Weighted Average Price) is included for added insight, allowing traders to identify market direction and trends more effectively.
Focused on candlestick price action analysis, without including unnecessary indicators like RSI, Supertrend, or MA.
Perfect for options traders seeking clarity in price movement for better trade execution.

Custom Portfolio [BackQuant]Custom Portfolio {BackQuant]
Overview
This script turns TradingView into a lightweight portfolio optimizer with institutional-grade analytics and real-time position management capabilities.
Rank up to 15 tickers every bar using a pair-wise relative-strength "league table" that compares each asset against all others through your choice of 12 technical indicators.
Auto-allocate 100% of capital to the single strongest asset and optionally apply dynamic leverage when the aggregate market is trending, with full position tracking and rebalancing logic.
Track performance against a custom buy-and-hold benchmark while watching a fully fledged stats dashboard update in real time, including 15 professional risk metrics.
How it works
Relative-strength engine – Each asset is compared against every other asset with a user-selectable indicator (default: 9/21 EMA cross). The system generates a complete comparison matrix where Asset A vs Asset B, Asset A vs Asset C, and so on, creating strength scores. The summed scores crown a weekly/daily/hourly "winner" that receives the full allocation.
Regime filter – A second indicator applied to TOTAL crypto-market cap (or any symbol you choose) classifies the environment as trending or mean-reverting . Leverage activates only in trending regimes, protecting capital during choppy or declining markets. Choose from indicators like Universal Trend Model, Relative Strength Overlay, Momentum Velocity, or Custom RSI for regime detection.
Capital & position logic – Equity grows linearly when flat and multiplicatively while invested. The system tracks entry prices, calculates returns including leverage adjustments, and handles position transitions seamlessly. Optional intra-trade leverage rebalancing keeps exposure in sync with market conditions, recalculating position sizes as regime conditions change.
Risk & performance analytics – Every confirmed bar records return, drawdown, VaR/CVaR, Sharpe, Sortino, alpha/beta vs your benchmark, gain-to-pain, Calmar, win-rate, Omega ratio, portfolio variance, skewness, and annualized statistics. All metrics render in a professional table for instant inspection with proper annualization based on your selected trading days (252 for traditional markets, 365 for crypto).
Key inputs
Backtest window – Hard-code a start date or let the script run from series' inception with full date range validation.
Asset list (15 slots) – Works with spot, futures, indices, even synthetic spreads (e.g., BYBIT:BTCUSDT.P). The script automatically cleans ticker symbols for display.
Indicator universe – Switch the comparative metric to DEMA, BBPCT, LSMAz adaptive scores, Volatility WMA, DEMA ATR, Median Supertrend, and more proprietary indicators.
With more always being added!
Leverage settings – Max leverage from 1x to any multiple, auto-rebalancing toggle, trend/reversion thresholds with precision controls.
Visual toggles – Show/hide equity curve, rolling drawdown heat-map, daily PnL spikes, position label, advanced metrics table, buy-and-hold comparison equity.
Risk-free rate input – Customize the risk-free rate for accurate Sharpe ratio calculations, supporting both percentage and decimal inputs.
On-chart visuals
Color-coded equity curve with "shadow" offset for depth perception that changes from green (profitable) to red (losing) based on recent performance momentum.
Rolling drawdown strip that fades from light to deep red as losses widen, with customizable maximum drawdown scaling for visual clarity.
Optional daily-return histogram line and zero reference for understanding day-to-day volatility patterns.
Bottom-center table prints the current winning ticker in real time with clean formatting.
Top-right metrics grid updates every bar with 15 key performance indicators formatted to three decimal places for precision.
Benchmark overlay showing buy-and-hold performance of your selected index (default: SPX) for relative performance comparison.
Typical workflow
Add the indicator on a blank chart (overlay off).
Populate ticker slots with the assets you actually trade from your broker's symbol list.
Pick your momentum or mean-reversion metric and a regime filter that matches your market hypothesis.
Set max leverage (1 = spot only) and decide if you want dynamic rebalancing.
Press the little " L " on the price axis to view the equity curve in log scale for better long-term visualization.
Enable the metrics table to monitor Sharpe, Sortino, and drawdown in real time.
Iterate through different asset combinations and indicator settings; compare performance vs buy-and-hold; refine until you find robust parameters.
Who is it for?
Systematic crypto traders looking for a one-click, cross-sectional rotation model with professional risk management.
Portfolio quants who need rapid prototyping without leaving TradingView or exporting to Python/R.
Swing traders wanting an at-a-glance health check of their multi-coin basket with instant position signals.
Fund managers requiring detailed performance attribution and risk metrics for client reporting.
Researchers backtesting momentum and mean-reversion strategies across multiple assets simultaneously.
Important notes & tips
Set Trading Days in a Year to 252 for traditional markets; 365 for 24/7 crypto to ensure accurate annualization.
CAGR and Sharpe assume the backtest start date you choose—short windows can inflate stats, so test across multiple market cycles.
Leverage is theoretical; always confirm your broker's margin rules and account for funding costs not modeled here.
The script is computationally heavy at 15 assets due to the N×N comparison matrix—reduce the list or lengthen the timeframe if you hit execution limits.
Best results often come from mixing assets with different volatility profiles rather than highly correlated instruments.
The regime filter symbol can be changed from CRYPTOCAP:TOTAL to any broad market index that represents your asset universe.
