"supertrend" için komut dosyalarını ara
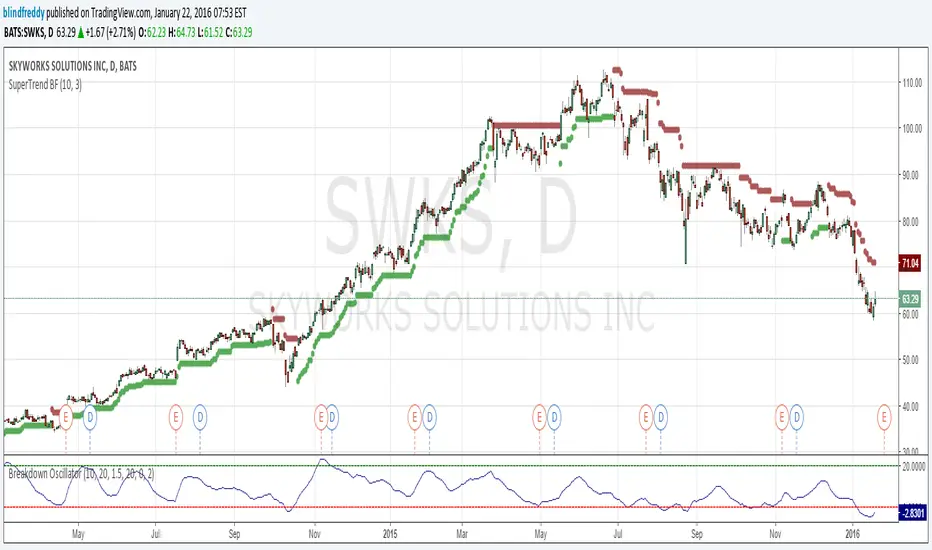
SuperTrend BFI am republishing this indicator as something changed within TradingView's script engine so that the old script ceased to function ( a minor syntax error that used to be acceptable but no longer is).
Anyhow here's the fixed version which as you can see has done a great job of keeping us on the right side of the trend with once-hot stocks like Skyworks !
Cup & Handle Visual Pattern Cup & Handle – Visual Breakout Strategy (with Buy/Sell Signals)
Strategy Objective
This strategy helps traders visually identify and trade bullish Cup & Handle patterns by:
Drawing the Cup and Handle structure directly on the chart
Highlighting key support and resistance zones
Providing clear BUY and SELL signals
Assisting decision-making without repainting
🔧 Concept Behind the Strategy
The Cup & Handle is a bullish continuation pattern:
The Cup shows long consolidation and accumulation
The Handle shows short-term profit booking
A breakout above resistance signals trend continuation
This script approximates the pattern using price structure and volatility logic and draws it visually, instead of trying to mathematically force a perfect pattern.
🟠 Cup Formation Logic
The script finds the highest high and lowest low over a fixed lookback period
The depth of the cup must exceed a minimum percentage, ensuring a meaningful base
Two horizontal lines are drawn:
Top line → Cup resistance
Bottom line → Cup base (support)
📌 This creates a visible U-shaped price zone
⬜ Handle Formation Logic
After the cup forms, price must consolidate in a narrow range below resistance
A box is drawn on the chart showing the handle area
This represents short-term pullback before breakout
📌 The handle must:
Stay above the cup low
Stay below the cup resistance
🟢 BUY Signal Logic
A BUY signal is generated when:
Cup depth condition is valid
Handle consolidation is confirmed
Price breaks above cup resistance
📌 A green ▲ arrow appears below the breakout candle.
🔴 SELL Signal Logic
A SELL signal is generated when:
Price breaks below the handle support
📌 A red ▼ arrow appears above the breakdown candle.
🛑 Risk Management (Manual / Trader-Controlled)
This strategy is visual-assisted, not auto-exit based:
Stop Loss: Below handle low
Target:
Measure cup depth and project upward
Or trail using Supertrend / Moving Average
⏱️ Best Usage
Style Timeframe
Swing Trading 1H / Daily
Positional Daily / Weekly
Best suited for:
Strong trending stocks
Breakout candidates
Post-consolidation markets
⭐ Strengths of This Strategy
✔ Visual pattern drawing (easy to understand)
✔ Avoids over-complicated math
✔ Clear breakout levels
✔ Non-repainting logic
✔ Works as a decision-support tool
⚠️ Important Notes
Cup & Handle cannot be perfectly automated
This strategy assists, not replaces, trader judgment
Works best when combined with:
RSI above 50
Volume expansion
Market trend confirmation.

FTMO Rules MonitorFTMO Rules Monitor: Stay on Track with Your FTMO Challenge Goals
TLDR; You can test with this template whether your strategy for one asset would pass the FTMO challenges step 1 then step 2, then with real money conditions.
Passing a prop firm challenge is ... challenging.
I believe a toolkit allowing to test in minutes whether a strategy would have passed a prop firm challenge in the past could be very powerful.
The FTMO Rules Monitor is designed to help you stay within FTMO’s strict risk management guidelines directly on your chart. Whether you’re aiming for the $10,000 or the $200,000 account challenge, this tool provides real-time tracking of your performance against FTMO’s rules to ensure you don’t accidentally breach any limits.
NOTES
The connected indicator for this post doesn't matter.
It's just a dummy double supertrends (see below)
The strategy results for this script post does not matter as I'm posting a FTMO rules template on which you can connect any indicator/strategy.
//@version=5
indicator("Supertrends", overlay=true)
// Supertrend 1 Parameters
var string ST1 = "Supertrend 1 Settings"
st1_atrPeriod = input.int(10, "ATR Period", minval=1, maxval=50, group=ST1)
st1_factor = input.float(2, "Factor", minval=0.5, maxval=10, step=0.5, group=ST1)
// Supertrend 2 Parameters
var string ST2 = "Supertrend 2 Settings"
st2_atrPeriod = input.int(14, "ATR Period", minval=1, maxval=50, group=ST2)
st2_factor = input.float(3, "Factor", minval=0.5, maxval=10, step=0.5, group=ST2)
// Calculate Supertrends
= ta.supertrend(st1_factor, st1_atrPeriod)
= ta.supertrend(st2_factor, st2_atrPeriod)
// Entry conditions
longCondition = direction1 == -1 and direction2 == -1 and direction1 == 1
shortCondition = direction1 == 1 and direction2 == 1 and direction1 == -1
// Optional: Plot Supertrends
plot(supertrend1, "Supertrend 1", color = direction1 == -1 ? color.green : color.red, linewidth=3)
plot(supertrend2, "Supertrend 2", color = direction2 == -1 ? color.lime : color.maroon, linewidth=3)
plotshape(series=longCondition, location=location.belowbar, color=color.green, style=shape.triangleup, title="Long")
plotshape(series=shortCondition, location=location.abovebar, color=color.red, style=shape.triangledown, title="Short")
signal = longCondition ? 1 : shortCondition ? -1 : na
plot(signal, "Signal", display = display.data_window)
To connect your indicator to this FTMO rules monitor template, please update it as follow
Create a signal variable to store 1 for the long/buy signal or -1 for the short/sell signal
Plot it in the display.data_window panel so that it doesn't clutter your chart
signal = longCondition ? 1 : shortCondition ? -1 : na
plot(signal, "Signal", display = display.data_window)
In the FTMO Rules Monitor template, I'm capturing this external signal with this input.source variable
entry_connector = input.source(close, "Entry Connector", group="Entry Connector")
longCondition = entry_connector == 1
shortCondition = entry_connector == -1
🔶 USAGE
This indicator displays essential FTMO Challenge rules and tracks your progress toward meeting each one. Here’s what’s monitored:
Max Daily Loss
• 10k Account: $500
• 25k Account: $1,250
• 50k Account: $2,500
• 100k Account: $5,000
• 200k Account: $10,000
Max Total Loss
• 10k Account: $1,000
• 25k Account: $2,500
• 50k Account: $5,000
• 100k Account: $10,000
• 200k Account: $20,000
Profit Target
• 10k Account: $1,000
• 25k Account: $2,500
• 50k Account: $5,000
• 100k Account: $10,000
• 200k Account: $20,000
Minimum Trading Days: 4 consecutive days for all account sizes
🔹 Key Features
1. Real-Time Compliance Check
The FTMO Rules Monitor keeps track of your daily and total losses, profit targets, and trading days. Each metric updates in real-time, giving you peace of mind that you’re within FTMO’s rules.
2. Color-Coded Visual Feedback
Each rule’s status is shown clearly with a ✓ for compliance or ✗ if the limit is breached. When a rule is broken, the indicator highlights it in red, so there’s no confusion.
3. Completion Notification
Once all FTMO requirements are met, the indicator closes all open positions and displays a celebratory message on your chart, letting you know you’ve successfully completed the challenge.
4. Easy-to-Read Table
A table on your chart provides an overview of each rule, your target, current performance, and whether you’re meeting each goal. The table adjusts its color scheme based on your chart settings for optimal visibility.
5. Dynamic Position Sizing
Integrated ATR-based position sizing helps you manage risk and avoid large drawdowns, ensuring each trade aligns with FTMO’s risk management principles.
Daveatt

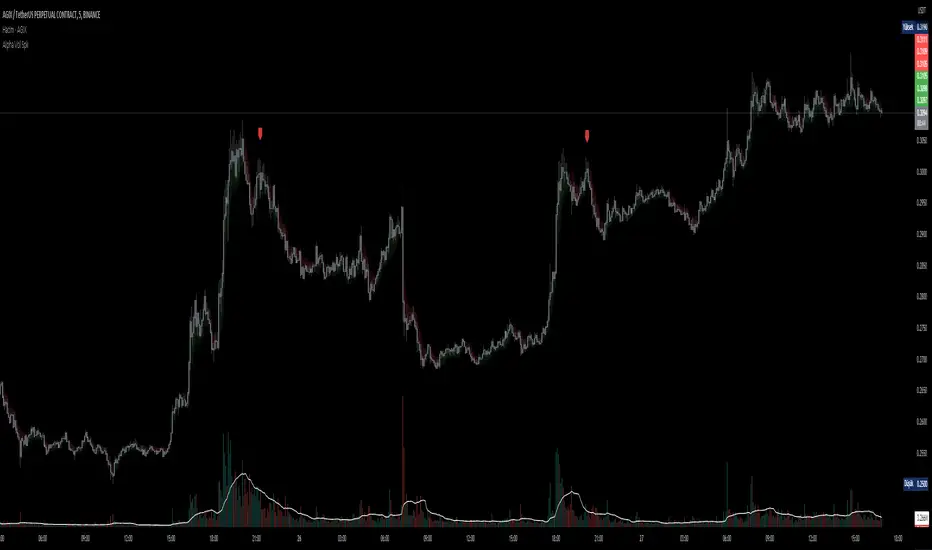
D-BoT Alpha Volume SpikeHello traders, Let me explain the code and provide an example of how to trade using this indicator.
The code you provided is a Pine Script indicator that combines multiple technical indicators, such as Supertrend, ADX, RSI, and MFI, to generate buy and sell signals. Here's a breakdown of the code:
User Settings:
The user can adjust parameters like overbought_limit, oversold_limit, volume_multiplier, volume_ma_length, volume_spike_multiple, lookback_period, and use_extremities_confirmation according to their preference.
Calculate Supertrend:
The Supertrend indicator is calculated using three different ATR lengths (supertrend_atr_period1, supertrend_atr_period2, supertrend_atr_period3) and corresponding factors (supertrend_factor1, supertrend_factor2, supertrend_factor3).
The supertrend_value1, supertrend_value2, and supertrend_value3 represent the Supertrend values, while trend_direction1, trend_direction2, and trend_direction3 indicate the trend direction (negative for downtrend, positive for uptrend).
Candle calculations:
The high and low values are checked to identify bullish and bearish candles based on specific conditions.
Volume Spikes:
Volume spikes are detected by comparing the current volume with a median volume over a specified lookback period.
If the volume exceeds a certain multiple of the median volume and the DI+ value is greater than the DI- value, an "up" signal is generated. Similarly, if the DI- value is greater than the DI+ value, a "down" signal is generated.
Additional Filters (RSI and MFI):
Relative Strength Index (RSI) and Money Flow Index (MFI) are used as additional filters.
The RSI and MFI parameters can be adjusted according to the user's preference.
The signals generated by the volume spikes are filtered based on RSI and MFI conditions.
Plotting:
The indicator plots shapes (triangles) to represent buy and sell signals.
The Supertrend lines are plotted using different colors and transparency levels based on the distance from the current price.
The "bodyMiddle" plot is used for filling the area between the Supertrend lines.
Example Trade Scenario:
Let's consider an example trade scenario using this indicator:
When the indicator generates an "up" signal (trendBuy = true), indicating a potential bullish trend, and all the confirmation conditions (RSI, MFI, Supertrend) are met, you can consider opening a long position.
Conversely, when the indicator generates a "down" signal (trendSell = true), indicating a potential bearish trend, and all the confirmation conditions are met, you can consider opening a short position.
Remember, this is just an example, and it's crucial to perform thorough analysis and consider other factors before making trading decisions. It's recommended to backtest the strategy, assess risk management, and apply appropriate position sizing techniques.
Please note that the code provided is a simplified version, and there might be additional factors and considerations specific to your trading strategy that are not included in this code. *******"I have also reviewed the following indicators, and the volume calculation approaches of my friends have been very helpful in creating this indicator: "Volume Spikes " © tradeforopp and "Volume Spikes & Growing Volume Signals With Alerts & Scanner" © FriendOfTheTrend."*******
The Quantum Leap: Renko + ML(Note: This indicator uses the BackQuant & SuperTrend which takes a 4-5 seconds to load)
This strategy uses the following indicators (please see source code)
Synthetic Renko: Ignores time and focuses purely on price movement to detect clear trend reversals (Red-to-Green).
ATR (Average True Range): Measures volatility to calculate the Renko brick sizes and SuperTrend sensitivity.
Adaptive SuperTrend: A trend filter that uses volatility clustering to confirm if the market is currently in a "Bearish" state.
RSI (Relative Strength Index): A momentum gauge ensuring the asset is "Oversold" (exhausted) before we consider a setup.
Monthly Pivots: Horizontal support lines based on last month's data acting as price "floors" (S1, S2, S3).
SMA (Simple Moving Average): A 100-bar average ensuring we are strictly buying below the long-term mean (deep value).
BackQuant (KNN): A Machine Learning engine that compares current data to historical patterns to predict immediate momentum.
This is a sophisticated, multi-stage strategy script. It combines "Old School" price action (Renko) with "New School" Machine Learning (KNN and Clustering).
Here is the high-level summary of how we will break this down:
Topic 1: The "Bottom Hunter" Setup. How the script uses Renko bricks and aggressive filtering (SuperTrend, SMA, RSI, Pivots) to find a potential market bottom.
Topic 2: The ML Engine (BackQuant & SuperTrend). How the script uses K-Nearest Neighbors (KNN) to predict momentum and Volatility Clustering to adjust the SuperTrend.
Topic 3: The "Leap" Execution. How the script synchronizes the Setup (Topic 1) with the ML Trigger (Topic 2) using a time window.
Topic 1: The "Bottom Hunter" Setup
This script is designed as a Mean Reversion strategy (often called "catching a falling knife" or "bottom fishing"). It is trying to find the exact moment a downtrend stops and reverses.
Most strategies buy when price is above the 200 SMA or above the SuperTrend. This script does the exact opposite.
The Logic:
Renko Bricks: It simulates Renko bricks internally (without changing your chart view). It waits for a specific pattern: A Red Brick followed immediately by a Green Brick (a reversal).
The "Bearish" Filters: To generate a "WATCH" signal, the following must be true:
Price < SuperTrend: The market must officially be in a downtrend.
Price < SMA: Long-term trend is down.
Price < Monthly Pivot: Price is deeply discounted.
RSI < Threshold: The asset is oversold (exhausted).
Recommended Settings for daily signals for Stocks :
Confirmation : 10. (How many bars after Renko Buy signal the AI has to identify a bullish move).
Percentage : 2 (This is the Renko bar size. This represents 2% move.)
SMA: 100 (Signal must be found below 100 SMA)
Price must be below: PIVOT (This is the monthly Pivot levels)

IU Trailing Stop Loss MethodsThe 'IU Trailing Stop Loss Methods' it's a risk management tool which allows users to apply 12 trailing stop-loss (SL) methods for risk management of their trades and gives live alerts when the trailing Stop loss has hit. Below is a detailed explanation of each input and the working of the Script.
Main Inputs:
- bar_time: Specifies the date from which the trade begins and entry price will be the open of the first candle.
- entry_type: Choose between 'Long' or 'Short' positions.
- trailing_method: Select the trailing stop-loss method. Options include ATR, Parabolic SAR, Supertrend, Point/Pip based, Percentage, EMA, Highest/Lowest, Standard Deviation, and multiple target-based methods.
- exit_after_close: If checked, exits the trade only after the candle closes.
Optional Inputs:
ATR Settings:
- atr_Length: Length for the ATR calculation.
- atr_factor: ATR multiplier for SL calculation.
Parabolic SAR Settings:
- start, increment, maximum: Parameters for the Parabolic SAR indicator.
Supertrend Settings:
- supertrend_Length, supertrend_factor: Length and factor for the Supertrend indicator.
Point/Pip Based:
- point_base: Set trailing SL in points/pips.
Percentage Based:
- percentage_base: Set SL as a percentage of entry price.
EMA Settings:
- ema_Length: Length for EMA calculation.
Standard Deviation Settings:
- std_Length, std_factor: Length and factor for standard deviation calculation.
Highest/Lowest Settings:
- highest_lowest_Length: Length for the highest/lowest SL calculation.
Target-Based Inputs:
- ATR, Point, Percentage, and Standard Deviation based target SL settings with customizable lengths and multipliers.
Entry Logic:
- Trades initiate based on the entry_type selected and the specified bar_time.
- If Long is selected, a long trade is initiated when the conditions match, and vice versa for Short.
Trailing Stop-Loss (SL) Methods Explained:
The strategy dynamically adjusts stop-loss based on the chosen method. Each method has its calculation logic:
- ATR: Stop-loss calculated using ATR multiplied by a user-defined factor.
- Parabolic SAR: Uses the Parabolic SAR indicator for trailing stop-loss.
- Supertrend: Utilizes the Supertrend indicator as the stop-loss line.
- Point/Pip Based: Fixed point-based stop-loss.
- Percentage Based: SL set as a percentage of entry price.
- EMA: SL based on the Exponential Moving Average.
- Highest/Lowest: Uses the highest high or lowest low over a specified period.
- Standard Deviation: SL calculated using standard deviation.
Exit Conditions:
- If exit_after_close is enabled, the position will only close after the candle confirms the stop-loss hit.
- If exit_after_close is disabled, the strategy will close the trade immediately when the SL is breached.
Visualization:
The script plots the chosen trailing stop-loss method on the chart for easy visualization.
Target-Based Trailing SL Logic:
- When a position is opened, the strategy calculates the initial stop-loss and progressively adjusts it as the price moves favorably.
- Each SL adjustment is stored in an array for accurate tracking and visualization.
Alerts and Labels:
- When the Entry or trailing stop loss is hit this scripts draws a label and give alert to the user that trailing stop has been hit for the trade.
Note - on the historical data The Script will show nothing if the entry and the exit has happened on the same candle, because we don't know what was hit first SL or TP (basically how the candle was formed on the lower timeframe).
Summary:
This script offers flexible trailing stop-loss options for traders who want dynamic risk management in their strategies. By offering multiple methods like ATR, SAR, Supertrend, and EMA, it caters to various trading styles and risk preferences.

RSI Momentum LockConcept & Philosophy This indicator is a unique hybrid trend-following system that combines the momentum power of RSI with the visual simplicity of the SuperTrend. Unlike standard indicators that flip constantly during choppy markets, the RSI Momentum Lock uses a "State Machine" logic to capture and hold strong trends.
How It Works The indicator creates a "Trend Lock" based on RSI breakout levels:
Bullish Lock (Green): Triggered ONLY when RSI closes above 70 (Overbought Breakout). The trend remains bullish even if RSI falls back to neutral levels (50-60), filtering out minor corrections.
Bearish Lock (Red): Triggered ONLY when RSI closes below 30 (Oversold Breakdown). The trend remains bearish until a new bullish breakout occurs.
Visuals The plot looks like a SuperTrend, calculated using ATR (Average True Range) to provide a dynamic Trailing Stop line.
Green Line: Support level during an uptrend.
Red Line: Resistance level during a downtrend.
Why Use This Indicator?
Filters Noise: It ignores sideways movement between RSI 30 and 70.
Early Entry: Catches the momentum explosion right at the breakout.
Longer Rides: Keeps you in the trade longer than traditional SuperTrends.
Settings
RSI Length: Default is 14.
Levels: Default triggers are 70 (Buy) and 30 (Sell).
ATR Factor: Controls the distance of the line from the price (Default 3.0).
الفكرة والفلسفة (Concept & Philosophy)
هذا المؤشر هو نظام اتجاه هجين فريد يجمع بين قوة زخم مؤشر RSI والبساطة البصرية لمؤشر SuperTrend.
على عكس المؤشرات التقليدية التي تغيّر اتجاهها باستمرار في الأسواق العرضية (المتذبذبة)، يعتمد مؤشر RSI Momentum Lock على منطق آلة الحالات (State Machine) لالتقاط الاتجاهات القوية والاحتفاظ بها لأطول فترة ممكنة.
كيف يعمل المؤشر؟ (How It Works)
يقوم المؤشر بإنشاء ما يُعرف بـ قفل الاتجاه (Trend Lock) بناءً على اختراقات مؤشر RSI:
قفل صاعد (Bullish Lock – أخضر)
يتم تفعيله فقط عندما يغلق مؤشر RSI أعلى مستوى 70 (اختراق تشبع شرائي).
يظل الاتجاه صاعدًا حتى لو عاد RSI إلى مناطق محايدة (50 – 60).
هذا الأسلوب يمنع الخروج المبكر بسبب التصحيحات البسيطة.
قفل هابط (Bearish Lock – أحمر)
يتم تفعيله فقط عندما يغلق مؤشر RSI أسفل مستوى 30 (اختراق تشبع بيعي).
يظل الاتجاه هابطًا حتى يحدث اختراق صاعد جديد.
يساعد على تجنب الإشارات الكاذبة أثناء التذبذب.
الشكل البصري (Visuals)
يظهر المؤشر بصريًا بشكل مشابه لـ SuperTrend، ويتم حسابه باستخدام ATR (متوسط المدى الحقيقي) لإنشاء خط وقف متحرك ديناميكي:
الخط الأخضر: مستوى دعم أثناء الاتجاه الصاعد.
الخط الأحمر: مستوى مقاومة أثناء الاتجاه الهابط.
لماذا تستخدم هذا المؤشر؟ (Why Use This Indicator?)
فلترة الضوضاء: يتجاهل الحركة العرضية عندما يكون RSI بين 30 و70.
دخول مبكر: يلتقط انفجار الزخم مباشرة عند الاختراق الحقيقي.
صفقات أطول: يبقيك داخل الصفقة لفترة أطول مقارنة بمؤشرات SuperTrend التقليدية.
الإعدادات (Settings)
طول RSI: القيمة الافتراضية 14
المستويات:
شراء: 70
بيع: 30
عامل ATR: يحدد بُعد الخط عن السعر (القيمة الافتراضية 3.0)

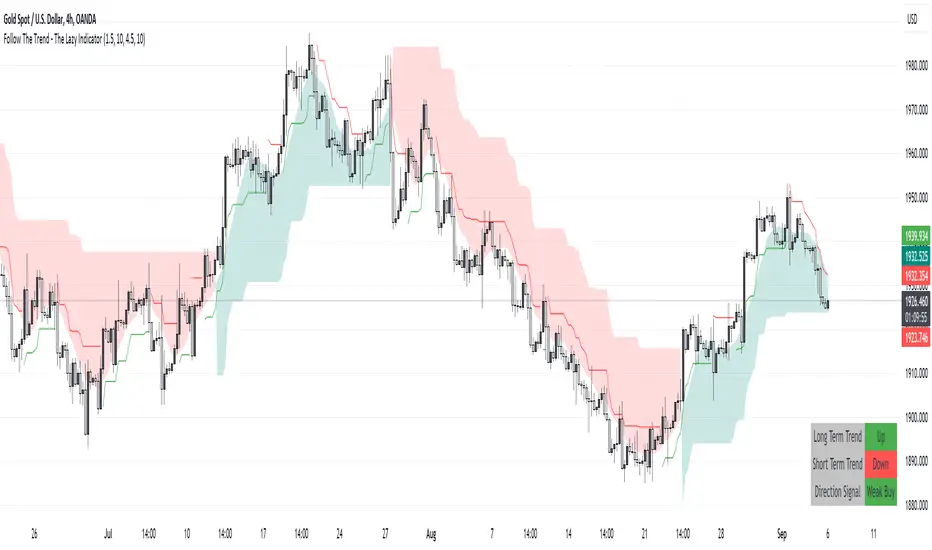
Follow The Trend - The Lazy Indicator**Understanding the 'Follow The Trend - The Lazy Indicator'**
This indicator is designed to help traders visualize the trend direction over both short-term and long-term periods. Let's dive deeper into understanding how it's designed and how it can be beneficial.
**1. How It's Designed:**
* **User Inputs:**
The first few lines ask the user for specific inputs related to the Average True Range (ATR) length and values for both short-term and long-term trends. ATR is a volatility indicator and, in this context, is used as part of the SuperTrend calculation.
* **SuperTrend Calculations:**
This indicator uses the SuperTrend, a popular trend-following indicator. Here, two SuperTrends are being calculated – one for short-term trends and another for long-term trends. The direction of the SuperTrend is also determined, signaling whether the trend is upwards or downwards.
* **Visual Representations:**
* The short-term SuperTrend is represented using green lines (for uptrend) and red lines (for downtrend).
* The indicator also provides a "cloud" between a Simple Moving Average (SMA) of the closing price (over the past 10 periods) and the long-term SuperTrend. This cloud changes color based on the direction of the long-term trend, providing another visual cue about market direction.
* **Signal Evaluation:**
This part of the code interprets the combination of short-term and long-term trends and assigns trading signals like "Strong Buy," "Weak Buy," "Strong Sell," "Weak Sell," and so on. This can act as a guide for traders, suggesting potential trading actions based on the prevailing trends.
* **Signal Coloration:**
The indicator also assigns colors to each signal. For instance, "Strong Buy" is green, "Strong Sell" is red, and there are transparency adjustments for weak signals to differentiate them from strong ones.
* **Tabular Presentation:**
At the end of the script, there’s a table displayed on the chart, summarizing the direction of both the long-term and short-term trends, as well as the overall trading signal. It provides a quick snapshot for traders to understand the current market scenario.
**2. How It May Be Helpful:**
* **Simplicity:**
The "Follow The Trend" indicator, despite its underlying complexity, is presented in a very user-friendly way. By just looking at the color cues and the table, traders can quickly understand the market's trend and potential direction.
* **Dual Trend Analysis:**
By analyzing both short-term and long-term trends, traders get a comprehensive view. This helps in understanding if the market is just having a short-term retracement (temporary reverse in direction) or if there's a genuine change in the long-term trend.
* **Adaptability:**
Traders can adjust the ATR values and lengths to customize the sensitivity of the indicator. This means it can be adapted to different assets or varying market conditions.
* **Actionable Signals:**
The signals like "Strong Buy" or "Weak Sell" are direct suggestions that can help in decision-making. Especially for beginners or those who might be overwhelmed by complex charts, such signals can be very beneficial.
* **Visual Appeal:**
The combination of trend lines, cloud coloring, and tabulated information provides a visually pleasing and easy-to-understand representation of market data. This can help reduce analysis fatigue and make chart reading more enjoyable.
In conclusion, the "Follow The Trend - The Lazy Indicator" is designed to make trend-following more accessible and actionable. By providing clear visual cues and combining short-term and long-term trend analysis, it offers traders a tool that's both comprehensive and user-friendly. Whether you're a beginner looking for clear signals or an experienced trader wanting an overview of the market trend, this indicator might be a useful addition to your toolkit.
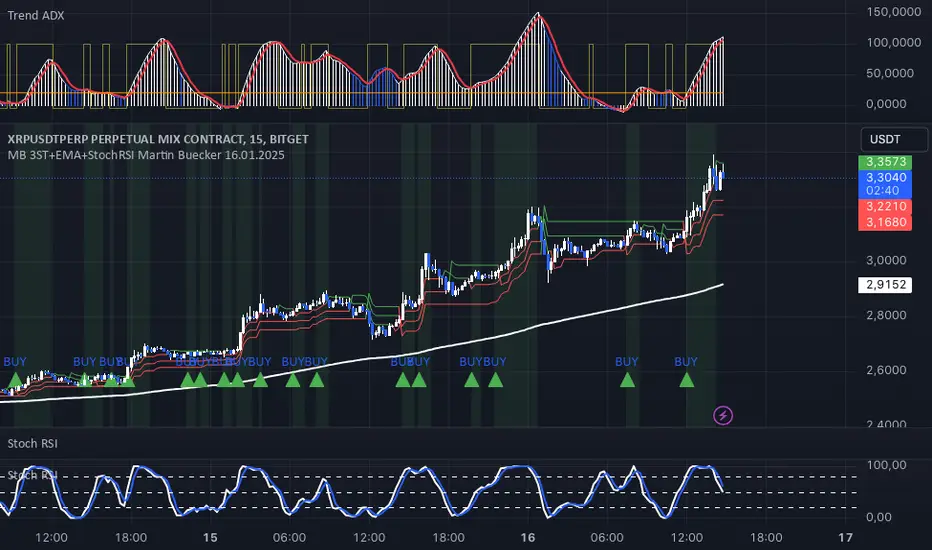
MB 3ST+EMA+StochRSI Martin Buecker 16.01.2025Short Description of the Indicator "MB 3ST+EMA+StochRSI Martin Buecker 16.01.2025"
This trend-following and momentum-based indicator combines Supertrend, EMA 200, and Stochastic RSI to generate buy and sell signals with improved accuracy.
1. Key Components
Supertrend (3 variations):
Uses three Supertrend indicators with different periods to confirm trend direction.
Buy signal when at least 2 Supertrends are bearish.
Sell signal when at least 2 Supertrends are bullish.
EMA 200 (Exponential Moving Average):
Buy signals only when the price is above EMA 200 (uptrend confirmation).
Sell signals only when the price is below EMA 200 (downtrend confirmation).
Multi-Timeframe Stochastic RSI:
Uses a higher timeframe Stoch RSI (default: 15 minutes) to filter signals.
Buy signal when %K crosses above %D (bullish momentum).
Sell signal when %K crosses below %D (bearish momentum).
2. Signal Generation
📈 Buy Signal Conditions:
✅ At least 2 of 3 Supertrends are bearish
✅ Price is above EMA 200
✅ Stoch RSI shows a bullish crossover (%K > %D)
📉 Sell Signal Conditions:
✅ At least 2 of 3 Supertrends are bullish
✅ Price is below EMA 200
✅ Stoch RSI shows a bearish crossover (%K < %D)
3. Visual Representation & Alerts
Supertrend Lines:
Green = Bullish, Red = Bearish
EMA 200: White Line
Buy/Sell Signals:
Green triangle (below bar) = Buy
Red triangle (above bar) = Sell
Alerts:
Notifies users when a buy or sell signal is triggered.
Background Coloring:
Green for Buy signals, Red for Sell signals
4. Purpose & Benefits
🔥 Combines trend (EMA 200, Supertrend) and momentum analysis (Stoch RSI) for better signal accuracy.
🔥 Works best in trending markets, filtering out false signals in sideways movements.
🔥 Suitable for scalping and day trading, providing clear and structured trade entries.
Three Bar Reversal Pattern [LuxAlgo]The Three Bar Reversal Pattern indicator identifies and highlights three bar reversal patterns on the user price chart.
The script also provides an option for incorporating various trend indicators used to filter out detected signals, allowing them to enhance their accuracy and help obtain a more comprehensive analysis.
🔶 USAGE
The script automates the detection of three-bar reversal patterns and provides a clear, visually identifiable signal for potential trend reversals.
When a reversal chart pattern is confirmed and price action aligns with the pattern, the pattern's boundaries are extended, forming levels, with the upper boundary often acting as a resistance and the lower boundary as a support.
The script allows users to filter patterns based on a specific trend direction detected by multiple trend indicators. Users can choose to view patterns that are either aligned with the detected trend or opposite to it.
Included trend indicators are: Moving Average Cloud, Supertrend, and Donchian Channels.
🔶 DETAILS
The three-bar reversal pattern is a technical analysis pattern that signals a potential reversal in the prevailing trend. The pattern consists of three consecutive bar formations:
First Bar and Second Bar: 2 consecutive of the same sentiment, representing the prevailing trend in the market.
Third Bar: Confirms the reversal by closing beyond the high or low of the first bar, signaling a potential change in market sentiment.
Various types of three-bar reversal patterns are documented. The script supports two main types:
Normal Pattern: Detects three-bar reversal patterns without requiring the third bar closing price to surpass the high (bullish pattern) or low (bearish pattern) of the first bar. It identifies basic formations signaling potential trend reversals.
Enhanced Pattern: Specifically identifies three-bar reversal patterns where the third bar closing price surpasses the high (bullish pattern) or low (bearish pattern) of the first bar. This type provides a more selective signal for stronger trend reversals.
🔶 SETTINGS
Pattern Type: Users can choose the type of 3-bar reversal patterns to detect: Normal, Enhanced, or All. "Normal" detects patterns that do not necessarily surpass the high/low of the first bar. "Enhanced" detects patterns where the third bar surpasses the high/low of the first bar. "All" detects both Normal and Enhanced patterns.
Derived Support and Resistance: Toggles the visibility of the support and resistance levels/zones.
🔹 Trend Filtering
Filtering: Allows users to filter patterns based on the trend indicators: Moving Average Cloud, Supertrend, and Donchian Channels. The "Aligned" option only detects patterns that align with the trend and conversely, the "Opposite" option detects patterns that go against the trend.
🔹 Trend Indicator Settings
Moving Average Cloud: Allows traders to choose the type of moving averages (SMA, EMA, HMA, etc.) and set the lengths for fast and slow-moving averages.
Supertrend: Options to set the ATR length and factor for Supertrend.
Donchian Channels: Option to set the length for the channel calculation.
🔶 RELATED SCRIPTS
Reversal-Candlestick-Structure .
Reversal-Signals .

Vinicius Setup ATR
Description:
This script is a strategy based on the Supertrend indicator combined with volume analysis, candle strength, and RSI. Its goal is to identify potential entry points for buy and sell trades based on technical criteria, without promising profitability or guaranteed results.
Script Components:
Supertrend: Used as the main trend compass. When the trend is positive (direction = 1), buy signals are considered; when negative (direction = -1), sell signals are considered.
Volume: Entries are only validated if the volume is above the average of the last 20 candles, adjusted with a 1.2 multiplier.
Candle Body: The candle body must be larger than a certain percentage of the ATR, ensuring sufficient strength and volatility.
RSI: Used as a filter to avoid trades in extreme overbought or oversold zones.
Support and Resistance: Identified based on simple pivots (5 periods before and after).
Customizable Parameters:
ATR Length and Multiplier: Controls the sensitivity of the Supertrend.
RSI Period: Adjusts the relative strength filter.
Minimum Volume and Candle Body: Settings to validate entry signals.
Entry Conditions:
Buy: Positive trend + strong candle + high volume + RSI below 70.
Sell: Negative trend + strong candle + high volume + RSI above 30.
Exit Conditions:
The trade is closed upon the appearance of an opposite signal.
Notes:
This is a technical system with no profit guarantees.
It is recommended to test with realistic capital values and parameters suited to your risk management.
The script is not optimized for specific profitability, but rather to support study and the construction of setups with objective criteria.

Fibonacci Levels on Any Indicator [By MUQWISHI]▋ INTRODUCTION :
A “Fibonacci Levels on Any Indicator” can be applied to any indicator to draw Fibonacci levels based on provided conditions of two price points to produce a sequence of horizontal line levels starting from 0% to 100% in addition to extension levels. The 0% level is measured as the start of retracement, while the 100% level is the beginning of the extension levels. This tool was developed to be easy to add to any indicator, and it could be valuable to some traders in terms of managing trades by setting targets and reducing risk in the trend direction.
_______________________
▋ USAGE:
➤ NEEDS TO IDENTIFY 4 ELEMENTS:
1. Starting Point. What’re the conditions / When will the drawing of the Fibonacci levels begin?
2. Ending Point. What’re the conditions / When will the drawing of the Fibonacci levels end?
3. High Point. What is the price for a 100% Fibonacci level (0% for the downside)?
4. Low Point. What is the price for a 0% Fibonacci level (100% for the downside)?
➤ STARTING & ENDING POINTS CONDITIONS:
Need to specify the condition when the drawing of Fibonacci levels starts and ends, and the indicator shows different prepared conditions.
New Phase: Import a value (plot) from an existing indicator, where its status changes from NaN to a real number.
Crosses Above/Below: Import a value(1) (plot) from an existing indicator, where it crosses above/below value(2).
Reversal Up/Down: Import a value(1) (plot) from an existing indicator, where it rises/decreases than the previous value(1).
First/Last Bar: Useful to draw stationary Fibonacci levels.
➤ UPPER & LOWER PIVOTS (0% & 100%):
Need to specify the two price points representing 0% & 100% Fibonacci levels to expose the sequence of Fibonacci lines.
Upper Pivot. By default, the ATR Upper Band. It’s possible to import a custom value from an existing indicator.
Lower Pivot. By default, the ATR Lower Band. It’s possible to import a custom value from an existing indicator.
➤ FIBONACCI STYLING OPTIONS:
Ability to customize line & label style, color, reverse, and hide/show levels.
_______________________
▋ IMPLEMENTATION:
Here are some examples of implementing the indicator.
Note: All presented examples below are for demonstration purposes, and they're not trading suggestions.
# Example 1: (Reversal Up/Down)
We want to implement Fibonacci levels on the Hull MA by mohamed982 . Our requirements are as follows:
Fibonacci levels start when the Hull MA reverses up.
Fibonacci levels end when the Hull MA reverses down.
Upper Pivot is the ATR Upper Band.
Lower Pivot is the ATR Lower Band.
After adding the required indicator (Hull MA), here’re the implementation and results
# Example 2: (Crosses Above/Below)
We want to implement Fibonacci Level on the Squeeze Momentum by LazyBear . Our requirements are as follows:
Fibonacci levels start when the Squeeze Momentum histogram crosses above 0.
Fibonacci levels end when the Squeeze Momentum histogram crosses below 0.
Upper Pivot is the Bollinger Upper Band.
Lower Pivot is the Bollinger Lower Band.
After adding the required indicators (Squeeze Momentum & Bollinger Band), here’re the implementation and results
# Example 3: (Crosses Above/Below)
We want to implement Fibonacci Level on the Crossing Moving Averages. Our requirements are as follows:
Fibonacci levels start when the 20-EMA crosses above 100-MA.
Fibonacci levels end when the 20-EMA crosses below 100-MA.
Upper Pivot is the ATR Upper Band.
Lower Pivot is the ATR Lower Band.
After adding the required indicators (20-EMA & 100-MA), here’re the implementation and results
# Example 4: (New Phase: When the previous value is NaN, and the current value is a real number.)
We want to implement Fibonacci Level on the Supertrend. Our requirements are as follows:
Fibonacci levels start when an up-Supertrend (green) line shows up.
Fibonacci levels end when a down-Supertrend (red) line shows up.
Upper Pivot is the down-Supertrend.
Lower Pivot is the up-Supertrend.
After adding the required indicator (Supertrend), here’re the implementation and results
# Example 5: (First/Last Bar)
We want to implement Fibonacci Level between two points, 330 & 300. Our requirements are as follows:
Fibonacci levels start at first bar on the chart.
Fibonacci levels end at last bar on the chart.
Upper Pivot is 330.
Lower Pivot is 300.
Here’re the implementation and results.
To customize the number of bars back (like 50 bars)
_______________________
▋ Final Comments:
The “Fibonacci Levels on Any Indicator” is made to apply on other indicators for planning Fibonacci Levels.
It can be implemented in different ways, along with presented examples.
This indicator does not work with plots that were developed by drawing classes.
Please let me know if you have any questions.
Thank you.

SupportResitanceAndTrendLibrary "SupportResitanceAndTrend"
Contains utilities for finding key levels of support, resistance and direction of trend.
superTrendPlus(multiple, h, l, atr, closeBars)
A more flexible version of SuperTrend that allows for supplying the series used and sensitivity adjustment by confirming close bars.
Parameters:
multiple : The multiple to apply to the average true range.
h : The high values.
l : The low values.
atr : The average true range values.
closeBars : The number of bars to confirm a change in trend.
Returns:
superTrend(multiple, period, mode, closeBars)
superTrendPlus with simplified parameters.
Parameters:
multiple : The multiple to apply to the average true range.
period : The number of bars to measure.
mode : The type of moving average to use with the true range.
closeBars : The number of bars to confirm a change in trend.
Returns:
superTrendCleaned(multiple, period, mode, closeBars, maxDeviation)
superTrendPlus with default compensation for extreme volatility.
Parameters:
multiple : The multiple to apply to the average true range.
period : The number of bars to measure.
mode : The type of moving average to use with the true range.
closeBars : The number of bars to confirm a change in trend.
maxDeviation : The optional standard deviation level to use when cleaning the series. The default is the value of the provided level.
Returns:
stochSR()
Identifies support and resistance levels by when a stochastic RSI reverses.
Returns:
stochAVWAP()
Identifies anchored VWAP levels by when a stochastic RSI reverses.
Returns:

VANILLA BUY SELLThis script uses three components:-
USEFUL MA by @ALEXGROVER
SUPERTREND INDICATOR(3 supertrend with different ATR and multiplier) provided by tradingview.
VIX FEAR GAUGE by @bizkitbr
To make it easy and line free, supertrend lines have been removed but the color fill has been kept. This makes the chart clean.
For option traders, direction and momentum is everything. Hence, two need to be really clear:-
a) BUY OR SELL
b) Whether momentum exists of not
While rise is charecterised by a steady pace, a fall is charecterized by a rapid decline.
So in order to make the best use of of the charecters, a careful interpretation and backtesting has been done to enable buy sell only when vix conditions are met.
BUY SIGNAL
A buy signal is generated on following conditions:-
a)PRICE CLOSE ABOVE USEFUL MA
B)ALL THREE SUPERTRENDS ARE GREEN
C)VIXFIX IS BELOW 0.18.
SELL SIGNAL
This is generated when following is met:-
A) PRICE BELOW USEFUL MA
B)ALL THREE SUPERTRENDS ARE RED
C)VIXFIX IS ABOBE 0.18
ADDITIONALLY, A SMALL BACKGROUND COLOR CHANGE PROVIDED FOR AREAS WHERE THERE IS A BUY OR SELL.
Either labels can be used or background colours referred for seeing buy or sell.
magic wand STSM"Magic Wand STSM" Strategy: Trend-Following with Dynamic Risk Management
Overview:
The "Magic Wand STSM" (Supertrend & SMA Momentum) is an automated trading strategy designed to identify and capitalize on sustained trends in the market. It combines a multi-timeframe Supertrend for trend direction and potential reversal signals, along with a 200-period Simple Moving Average (SMA) for overall market bias. A key feature of this strategy is its dynamic position sizing based on a user-defined risk percentage per trade, and a built-in daily and monthly profit/loss tracking system to manage overall exposure and prevent overtrading.
How it Works (Underlying Concepts):
Multi-Timeframe Trend Confirmation (Supertrend):
The strategy uses two Supertrend indicators: one on the current chart timeframe and another on a higher timeframe (e.g., if your chart is 5-minute, the higher timeframe Supertrend might be 15-minute).
Trend Identification: The Supertrend's direction output is crucial. A negative direction indicates a bearish trend (price below Supertrend), while a positive direction indicates a bullish trend (price above Supertrend).
Confirmation: A core principle is that trades are only considered when the Supertrend on both the current and the higher timeframe align in the same direction. This helps to filter out noise and focus on stronger, more confirmed trends. For example, for a long trade, both Supertrends must be indicating a bearish trend (price below Supertrend line, implying an uptrend context where price is expected to stay above/rebound from Supertrend). Similarly, for short trades, both must be indicating a bullish trend (price above Supertrend line, implying a downtrend context where price is expected to stay below/retest Supertrend).
Trend "Readiness": The strategy specifically looks for situations where the Supertrend has been stable for a few bars (checking barssince the last direction change).
Long-Term Market Bias (200 SMA):
A 200-period Simple Moving Average is plotted on the chart.
Filter: For long trades, the price must be above the 200 SMA, confirming an overall bullish bias. For short trades, the price must be below the 200 SMA, confirming an overall bearish bias. This acts as a macro filter, ensuring trades are taken in alignment with the broader market direction.
"Lowest/Highest Value" Pullback Entries:
The strategy employs custom functions (LowestValueAndBar, HighestValueAndBar) to identify specific price action within the recent trend:
For Long Entries: It looks for a "buy ready" condition where the price has found a recent lowest point within a specific number of bars since the Supertrend turned bearish (indicating an uptrend). This suggests a potential pullback or consolidation before continuation. The entry trigger is a close above the open of this identified lowest bar, and also above the current bar's open.
For Short Entries: It looks for a "sell ready" condition where the price has found a recent highest point within a specific number of bars since the Supertrend turned bullish (indicating a downtrend). This suggests a potential rally or consolidation before continuation downwards. The entry trigger is a close below the open of this identified highest bar, and also below the current bar's open.
Candle Confirmation: The strategy also incorporates a check on the candle type at the "lowest/highest value" bar (e.g., closevalue_b < openvalue_b for buy signals, meaning a bearish candle at the low, suggesting a potential reversal before a buy).
Risk Management and Position Sizing:
Dynamic Lot Sizing: The lotsvalue function calculates the appropriate position size based on your Your Equity input, the Risk to Reward ratio, and your risk percentage for your balance % input. This ensures that the capital risked per trade remains consistent as a percentage of your equity, regardless of the instrument's volatility or price. The stop loss distance is directly used in this calculation.
Fixed Risk Reward: All trades are entered with a predefined Risk to Reward ratio (default 2.0). This means for every unit of risk (stop loss distance), the target profit is rr times that distance.
Daily and Monthly Performance Monitoring:
The strategy tracks todaysWins, todaysLosses, and res (daily net result) in real-time.
A "daily profit target" is implemented (day_profit): If the daily net result is very favorable (e.g., res >= 4 with todaysLosses >= 2 or todaysWins + todaysLosses >= 8), the strategy may temporarily halt trading for the remainder of the session to "lock in" profits and prevent overtrading during volatile periods.
A "monthly stop-out" (monthly_trade) is implemented: If the lres (overall net result from all closed trades) falls below a certain threshold (e.g., -12), the strategy will stop trading for a set period (one week in this case) to protect capital during prolonged drawdowns.
Trade Execution:
Entry Triggers: Trades are entered when all buy/sell conditions (Supertrend alignment, SMA filter, "buy/sell situation" candle confirmation, and risk management checks) are met, and there are no open positions.
Stop Loss and Take Profit:
Stop Loss: The stop loss is dynamically placed at the upTrendValue for long trades and downTrendValue for short trades. These values are derived from the Supertrend indicator, which naturally adjusts to market volatility.
Take Profit: The take profit is calculated based on the entry price, the stop loss, and the Risk to Reward ratio (rr).
Position Locks: lock_long and lock_short variables prevent immediate re-entry into the same direction once a trade is initiated, or after a trend reversal based on Supertrend changes.
Visual Elements:
The 200 SMA is plotted in yellow.
Entry, Stop Loss, and Take Profit lines are plotted in white, red, and green respectively when a trade is active, with shaded areas between them to visually represent risk and reward.
Diamond shapes are plotted at the bottom of the chart (green for potential buy signals, red for potential sell signals) to visually indicate when the buy_sit or sell_sit conditions are met, along with other key filters.
A comprehensive trade statistics table is displayed on the chart, showing daily wins/losses, daily profit, total deals, and overall profit/loss.
A background color indicates the active trading session.
Ideal Usage:
This strategy is best applied to instruments with clear trends and sufficient liquidity. Users should carefully adjust the Your Equity, Risk to Reward, and risk percentage inputs to align with their individual risk tolerance and capital. Experimentation with different ATR Length and Factor values for the Supertrend might be beneficial depending on the asset and timeframe.

Uptrick: MultiTrend Squeeze System**Uptrick: MultiTrend Squeeze System Indicator: The Ultimate Trading Tool for Precision and Versatility 📈🔥**
### Introduction
The MultiTrend Squeeze System is a powerful, multi-faceted trading indicator designed to provide traders with precise buy and sell signals by combining the strengths of multiple technical analysis tools. This script isn't just an indicator; it's a comprehensive trading system that merges the power of SuperTrend, RSI, Volume Filtering, and Squeeze Momentum to give you an unparalleled edge in the market. Whether you're a day trader looking for short-term opportunities or a swing trader aiming to catch longer-term trends, this indicator is tailored to meet your needs.
### Key Features and Unique Aspects
1. **SuperTrend with Dynamic Adjustments 📊**
- **Adaptive SuperTrend Calculation:** The SuperTrend is a popular trend-following indicator that adjusts dynamically based on market conditions. It uses the Average True Range (ATR) to calculate upper and lower bands, which shift according to market volatility. This script takes it further by combining it with the RSI and Volume filtering to provide more accurate signals.
- **Direction Sensitivity:** The SuperTrend here is not static. It adjusts based on the direction of the previous SuperTrend value, ensuring that the indicator remains relevant even in choppy markets.
2. **RSI Integration for Overbought/Oversold Conditions 💹**
- **RSI Calculation:** The Relative Strength Index (RSI) is incorporated to identify overbought and oversold conditions, adding an extra layer of precision. This helps in filtering out false signals and ensuring that trades are taken only in optimal conditions.
- **Customizable RSI Settings:** The RSI settings are fully customizable, allowing traders to adjust the RSI length and the overbought/oversold levels according to their trading style and market.
3. **Volume Filtering for Enhanced Signal Confirmation 📉**
- **Volume Multiplier:** This unique feature integrates volume analysis, ensuring that signals are only generated when there is sufficient market participation. The Volume Multiplier can be adjusted to filter out weak signals that occur during low-volume periods.
- **Optional Volume Filtering:** Traders have the flexibility to turn the volume filter on or off, depending on their preference or market conditions. This makes the indicator versatile, allowing it to be used across different asset classes and market conditions.
4. **Squeeze Momentum Indicator (SMI) for Market Pressure Analysis 💥**
- **Squeeze Detection:** The Squeeze Momentum Indicator detects periods of market compression and expansion. This script goes beyond the traditional Bollinger Bands and Keltner Channels by incorporating true range calculations, offering a more nuanced view of market momentum.
- **Customizable Squeeze Settings:** The lengths and multipliers for both Bollinger Bands and Keltner Channels are customizable, giving traders the flexibility to fine-tune the indicator based on their specific needs.
5. **Visual and Aesthetic Customization 🎨**
- **Color-Coding for Clarity:** The indicator is color-coded to make it easy to interpret signals. Bullish trends are marked with a vibrant green color, while bearish trends are highlighted in red. Neutral or unconfirmed signals are displayed in softer tones to reduce noise.
- **Histogram Visualization:** The primary trend direction and strength are displayed as a histogram, making it easy to visualize the market's momentum at a glance. The height and color of the bars provide immediate feedback on the strength and direction of the trend.
6. **Alerts for Real-Time Trading 🚨**
- **Custom Alerts:** The script is equipped with custom alerts that notify traders when a buy or sell signal is generated. These alerts can be configured to send notifications through various channels, including email, SMS, or directly to the trading platform.
- **Immediate Reaction:** The alerts are triggered based on the confluence of SuperTrend, RSI, and Volume signals, ensuring that traders are notified only when the most robust trading opportunities arise.
7. **Comprehensive Input Customization ⚙️**
- **SuperTrend Settings:** Adjust the ATR length and factor to control the sensitivity of the SuperTrend. This allows you to adapt the indicator to different market conditions, whether you're trading a volatile cryptocurrency or a more stable stock.
- **RSI Settings:** Customize the RSI length and thresholds for overbought and oversold conditions, enabling you to tailor the indicator to your specific trading strategy.
- **Volume Settings:** The Volume Multiplier and the option to toggle the volume filter provide an additional layer of customization, allowing you to fine-tune the indicator based on market liquidity and participation.
- **Squeeze Momentum Settings:** The lengths and multipliers for Bollinger Bands and Keltner Channels can be adjusted to detect different levels of market compression, providing flexibility for both short-term and long-term traders.
### How It Works: A Deep Dive Into the Mechanics 🛠️
1. **SuperTrend Calculation:**
- The SuperTrend is calculated using the ATR, which measures market volatility. The indicator creates upper and lower bands around the price, adjusting these bands based on the current level of market volatility. The direction of the trend is determined by the position of the price relative to these bands.
- The script enhances the standard SuperTrend by ensuring that the bands do not flip-flop too quickly, reducing the chances of false signals in a choppy market. The direction is confirmed by checking the position of the close relative to the previous band, making the trend detection more reliable.
2. **RSI Integration:**
- The RSI is calculated over a customizable length and compared to user-defined overbought and oversold levels. When the RSI crosses below the oversold level, and the SuperTrend indicates a bullish trend, a buy signal is generated. Conversely, when the RSI crosses above the overbought level, and the SuperTrend indicates a bearish trend, a sell signal is triggered.
- The combination of RSI with SuperTrend ensures that trades are only taken when there is a strong confluence of signals, reducing the chances of entering trades during weak or indecisive market phases.
3. **Volume Filtering:**
- The script calculates the average volume over a 20-period simple moving average. The volume filter ensures that buy and sell signals are only valid when the current volume exceeds a multiple of this average, which can be adjusted by the user. This feature helps filter out weak signals that might occur during low-volume periods, such as just before a major news event or during after-hours trading.
- The volume filter is particularly useful in markets where volume spikes are common, as it ensures that signals are only generated when there is significant market interest in the direction of the trend.
4. **Squeeze Momentum:**
- The Squeeze Momentum Indicator (SMI) adds a layer of market pressure analysis. The script calculates Bollinger Bands and Keltner Channels, detecting when the market is in a "squeeze" — a period of low volatility that typically precedes a significant price move.
- When the Bollinger Bands are inside the Keltner Channels, the market is in a squeeze (compression phase). This is often a precursor to a breakout or breakdown. The script colors the histogram bars black during this phase, indicating a potential for a strong move. Once the squeeze is released, the bars are colored according to the direction of the SuperTrend, signaling a potential entry point.
5. **Integration and Signal Generation:**
- The script brings together the SuperTrend, RSI, Volume, and Squeeze Momentum to generate highly accurate buy and sell signals. A buy signal is triggered when the SuperTrend is bullish, the RSI indicates oversold conditions, and the volume filter confirms strong market participation. Similarly, a sell signal is generated when the SuperTrend is bearish, the RSI indicates overbought conditions, and the volume filter is met.
- The combination of these elements ensures that the signals are robust, reducing the likelihood of entering trades during weak or indecisive market conditions.
### Practical Applications: How to Use the MultiTrend Squeeze System 📅
1. **Day Trading:**
- For day traders, this indicator provides quick and reliable signals that can be used to enter and exit trades multiple times within a day. The volume filter ensures that you are trading during the most liquid times of the day, increasing the chances of successful trades. The Squeeze Momentum aspect helps you catch breakouts or breakdowns, which are common in intraday trading.
2. **Swing Trading:**
- Swing traders can use the MultiTrend Squeeze System to identify longer-term trends. By adjusting the ATR length and factor, you can make the SuperTrend more sensitive to catch longer-term moves. The RSI and Squeeze Momentum aspects help you time your entries and exits, ensuring that you get in early on a trend and exit before it reverses.
3. **Scalping:**
- For scalpers, the quick signals provided by this system, especially in combination with the volume filter, make it easier to take small profits repeatedly. The histogram bars give you a clear visual cue of the market's momentum, making it easier to scalp effectively.
4. **Position Trading:**
- Even position traders can benefit from this indicator by using it to confirm long-term trends. By adjusting the settings to less sensitive parameters, you can ensure that you are only entering trades when a strong trend is confirmed. The Squeeze Momentum indicator will help you stay in the trade during periods of consolidation, waiting for the next big move.
### Conclusion: Why the MultiTrend Squeeze System is a Game-Changer 🚀
The MultiTrend Squeeze System is not just another trading indicator; it’s a comprehensive trading strategy encapsulated within a single script. By combining the power
of SuperTrend, RSI, Volume Filtering, and Squeeze Momentum, this indicator provides a robust and versatile tool that can be adapted to various trading styles and market conditions.
**Why is it Unique?**
- **Multi-Dimensional Analysis:** Unlike many other indicators that rely on a single data point or calculation, this script incorporates multiple layers of analysis, ensuring that signals are based on a confluence of factors, which increases their reliability.
- **Customizability:** The vast range of input settings allows traders to tailor the indicator to their specific needs, whether they are trading forex, stocks, cryptocurrencies, or commodities.
- **Visual Clarity:** The color-coded bars, labels, and signals make it easy to interpret the market conditions at a glance, reducing the time needed to make trading decisions.
Whether you are a novice trader or an experienced market participant, the MultiTrend Squeeze System offers a powerful toolset to enhance your trading strategy, reduce risk, and maximize your potential returns. With its combination of trend analysis, momentum detection, and volume filtering, this indicator is designed to help you trade with confidence and precision in any market condition.

Gold Trade Setup Strategy
Title: Profitable Gold Setup Strategy with Adaptive Moving Average & Supertrend
Introduction:
This trading strategy for Gold (XAU/USD) combines the Adaptive Moving Average (AMA) and Supertrend, tailored for high-probability setups during specific trading hours. The AMA identifies the trend, while the Supertrend confirms entry and exit points. The strategy is optimized for swing and intraday traders looking to capitalize on Gold’s price movements with precise trade timing.
Strategy Components:
1. Adaptive Moving Average (AMA):
• Reacts dynamically to market conditions, filtering noise in choppy markets.
• Serves as the primary trend indicator.
2. Supertrend:
• Confirms entry signals with clear buy and sell levels.
• Acts as a trailing stop-loss to protect profits.
Trading Rules:
Trading Hours:
• Only take trades between 8:30 AM and 10:30 PM IST.
• Avoid trading outside these hours to reduce noise and low-volume setups.
Buy Setup:
1. Trend Confirmation: The Adaptive Moving Average (AMA) must be green.
2. Signal Confirmation: The Supertrend should turn green after the AMA is green.
3. Trigger: Take the trade when the high of the trigger candle (the candle that turned Supertrend green) is broken.
Sell Setup (Optional if included):
• Reverse the rules for a short trade: AMA and Supertrend should both indicate bearish conditions (red), and take the trade when the low of the trigger candle is broken.
Stop-Loss and Targets:
• Place the stop-loss at the low of the trigger candle for long trades.
• Set a 1:2 risk-reward ratio or use the Supertrend line as a trailing stop-loss.
Timeframes:
• Recommended timeframes: 1H, 4H, or Daily for swing trading.
• For intraday trading, use 15-minute or 30-minute charts.
Why This Strategy Works:
• Combines trend-following (AMA) with momentum-based entries (Supertrend).
• Focused trading hours filter out low-probability setups.
• Provides precise entry, stop-loss, and target levels for disciplined trading.
Conclusion:
This Gold Setup Strategy is designed for traders seeking a structured approach to trading Gold. Follow the rules strictly, backtest the strategy extensively, and share your results. Let’s master the Gold market together!
Tags: #Gold #XAUUSD #SwingTrading #Intraday #Supertrend #AMA #TechnicalAnalysis #GoldStrategy

ETH Signal 15m
This strategy uses the Supertrend indicator combined with RSI to generate buy and sell signals, with stop loss (SL) and take profit (TP) conditions based on ATR (Average True Range). Below is a detailed explanation of each part:
1. General Information BINANCE:ETHUSDT.P
Strategy Name: "ETH Signal 15m"
Designed for use on the 15-minute time frame for the ETH pair.
Default capital allocation is 15% of total equity for each trade.
2. Backtest Period
start_time and end_time: Define the start and end time of the backtest period.
start_time = 2024-08-01: Start date of the backtest.
end_time = 2054-01-01: End date of the backtest.
The strategy will only run when the current time falls within this specified range.
3. Supertrend Indicator
Supertrend is a trend-following indicator that provides buy or sell signals based on the direction of price changes.
factor = 2.76: The multiplier used in the Supertrend calculation (increasing this value makes the Supertrend less sensitive to price movements).
atrPeriod = 12: Number of periods used to calculate ATR.
Output:
direction: Determines the buy/sell direction based on Supertrend.
If direction decreases, it signals a buy (Long).
If direction increases, it signals a sell (Short).
4. RSI Indicator
RSI (Relative Strength Index) is a momentum indicator, often used to identify overbought or oversold conditions.
rsiLength = 12: Number of periods used to calculate RSI.
rsiOverbought = 70: RSI level considered overbought.
rsiOversold = 30: RSI level considered oversold.
5. Entry Conditions
Long Entry:
Supertrend gives a buy signal (ta.change(direction) < 0).
RSI must be below the overbought level (rsi < rsiOverbought).
Short Entry:
Supertrend gives a sell signal (ta.change(direction) > 0).
RSI must be above the oversold level (rsi > rsiOversold).
The strategy will only execute trades if the current time is within the backtest period (in_date_range).
6. Stop Loss (SL) and Take Profit (TP) Conditions
ATR (Average True Range) is used to calculate the distance for Stop Loss and Take Profit based on price volatility.
atr = ta.atr(atrPeriod): ATR is calculated using 12 periods.
Stop Loss and Take Profit are calculated as follows:
Long Trade:
Stop Loss: Set at close - 4 * atr (current price minus 4 times the ATR).
Take Profit: Set at close + 2 * atr (current price plus 2 times the ATR).
Short Trade:
Stop Loss: Set at close + 4 * atr (current price plus 4 times the ATR).
Take Profit: Set at close - 2.237 * atr (current price minus 2.237 times the ATR).
Summary:
This strategy enters a Long trade when the Supertrend indicates an upward trend and RSI is not in the overbought region. Conversely, a Short trade is entered when Supertrend signals a downtrend, and RSI is not oversold.
The trade is exited when the price reaches the Stop Loss or Take Profit levels, which are determined based on price volatility (ATR).
Disclaimer:
The content provided in this strategy is for informational and educational purposes only. It is not intended as financial, investment, or trading advice. Trading in cryptocurrency, stocks, or any financial markets involves significant risk, and you may lose more than your initial investment. Past performance is not indicative of future results, and no guarantee of profit can be made. You should consult with a professional financial advisor before making any investment decisions. The creator of this strategy is not responsible for any financial losses or damages incurred as a result of following this strategy. All trades are executed at your own risk.

Higher TF - Repainting + Limiting backtest resultsThis strategy is for illustration purpose only. Do not use this as there is massive repainting.
As usual, I was experimenting with adding different entry/exit filters to my main strategy. Thought of adding higher frame filter, picked the code for getting higher time frame supertrend from someone else's script and copied it without thinking much about it.
security(syminfo.tickerid, f_multiple_resolution(HTFMultiplier), supertrend(SupertrendMult, SupertrendPd), lookahead = true, gaps=true)
Started getting better results with this result. I was very much impressed and while trying to enhance further, I started disabling my other entry and exit filters which I generally use.
That worked pretty well without any of my other filters. Hence, thought I will forward test this on a smaller timeframe.
To my surprise, even in forward testing, i was not able to notice repainting very much. It also appeared that smaller timeframes yielded better results. (This wasn't the case with any of my strategies)
Which then prompted me to study the security function and lookahead and gap parameters. Learned that lookahead and gap when set to true will lead to massive repainting - specially if you are using higher timeframes. Hence, these parameters are not advisable to use in strategies.
Further information here: www.tradingview.com
I added three repaint options to further illustrate how security function will work:
Yes : Use security with lookahead and merge set to true
No - set lookahead false : Use security with lookahead and merge set to false
No - do not use security : Falls back to original command on current timeframe. Switch timeframe to HTF resolution to compare the difference.
Conclusion : Always set lookahead and gaps to false when using security function in strategies.
PS: Script also contains code to limit backtesting to certain days/months/years. This can be used as is in other scripts.

Akshay - TheOne, TheMostWanted, TheUnbeatable, TheEnd➤ All-in-One Solution (❌ No repaint):
This Technical Chart contains, MA24 Condition, Supertrend Indicator, HalfTrend Signal, Ichimoku Cloud Status, Parabolic SAR (P_SAR), First 5-Minute Candle Analysis (ORB5min), Volume-Weighted Moving Average (VWMA), Price-Volume Trend (PVT), Oscillator Composite, RSI Condition, ADX & Trend Strength.
Technicals don't lie.
🚀 Overview and Key Features
Comprehensive Multi-Indicator Approach:
The script is built to be an all-in-one technical indicator on TradingView. It integrates several well-known indicators and overlays—including Supertrend, HalfTrend, Ichimoku Cloud, various moving averages (EMA, SMA, VWMA), oscillators (Klinger, Price Oscillator, Awesome Oscillator, Chaikin Oscillator, Ultimate Oscillator, SMI Ergodic Oscillator, Chande Momentum Oscillator, Detrended Price Oscillator, Money Flow Index), ADX, and Donchian Channels—to create a composite picture of market sentiment.
Signal Generation and Alerts:
It not only calculates these indicators but also aggregates their output into “Master Candle” signals. Vertical lines are drawn on the chart with corresponding alerts to indicate potential buy or sell opportunities based on robust, combined conditions.
Visual Layering:
Through the use of colored histograms, custom candle plots, trend lines, and background color changes, the script offers a multi-layered visual representation of data, providing clarity about both short-term signals and overall market trends.
⚙️ How It Works and Functionality
MA24 Condition:
Uses the 24-period moving average as a proxy; if the price is above it, the bar is colored green, and red if below, with neutrality when conditions aren’t met.
Supertrend Indicator:
Evaluates price relative to the Supertrend level (calculated via ATR), coloring green when price is above it and red when below.
HalfTrend Signal:
Determines trend shifts by comparing the current close to a calculated trend level; green indicates an upward trend, while red suggests a downtrend.
Ichimoku Cloud Status:
Analyzes the relationship between the Conversion and Base lines; a bullish (green) signal is given when price is above both or the Conversion line is higher than the Base line.
Parabolic SAR (P_SAR):
Colors the signal based on whether the current price is above (green) or below (red) the Parabolic SAR marker, indicating stop and reverse conditions.
First 5-Minute Candle Analysis (ORB5min):
Uses key levels from the first 5-minute candle; if price exceeds the candle’s low, VWAP, and MA, it’s bullish (green), otherwise bearish (red).
Volume-Weighted Moving Average (VWMA):
Compares the current price to volume-weighted averages; a price above these levels is shown in green, below in red.
Price-Volume Trend (PVT):
Determines bullish or bearish momentum by comparing PVT to its VWAP—green when above and red when below.
Oscillator Composite:
Aggregates signals from multiple oscillators; a majority of positive results turn it green, while negative dominance results in red.
RSI Condition:
Uses a simple RSI threshold of 50, with values above signifying bullish (green) momentum and below marking bearish (red) conditions.
ADX & Trend Strength:
Reflects overall trend strength through ADX and directional movements; a combination favoring bullish conditions colors it green, with red signaling bearish pressure.
Master Candle Overall Signal:
Combines multiple indicator outputs into one “Master” signal—green for a consensus bullish trend and red for a bearish outlook.
Scalp Signal Variation:
Focused on short-term price changes, this signal adjusts quickly; green indicates improving short-term conditions, while red signals a downturn.
📊 Visualizations and 🎨 User Experience (❌ no repaint)
Dynamic Histograms & Bar Plots:
Each indicator is represented as a colored bar (with added vertical offsets) to facilitate easy comparison of their respective bullish or bearish contributions.
Clear Color-Coding & Labels:
Green (e.g., GreenFluorescent) indicates bullish sentiment.
Red (e.g., RedFluorescent) indicates bearish sentiment.
Custom labels and descriptive text accompany each bar for clarity.
Interactive Charting:
The overall background color adapts based on the “Master Candle” condition, offering an instant read on market sentiment.
The current candlestick is overlaid with color cues to reinforce the indicator’s signal, enhancing the trading experience.
Real-Time Alerts:
Vertical lines appear on signal events (buy/sell triggers), complemented by alerts that help traders stay on top of actionable market moves.
Sharp lines:
The Sharp lines are plotted based upon the EMA5 cross over with the same market trend, marks this as good time to reentry.
🔧 Settings and Customization
Flexible Timeframe Input:
Users can select their preferred timeframe for analysis, making the indicator adaptable to intraday or longer-term trading styles.
Customizable Indicator Parameters:
➤ Supertrend: Adjust ATR length and multiplier factors.
➤ HalfTrend: Tweak amplitude and channel deviation settings.
➤ Ichimoku Cloud & Oscillators: Fine-tune the conversion/base lines and oscillator lengths to match individual trading strategies.
Visual Customization:
The script’s color schemes and plotting styles can be altered as needed, giving users the freedom to tailor the interface to their taste or existing chart setups.
🌟 Uniqueness of the Concept
Integrated Multi-Indicator Synergy:
Combines a diverse range of trend, momentum, and volume-based indicators into a single cohesive system for a holistic market view.
Master Candle Aggregation:
Consolidates numerous individual signals into a "Master Candle" that filters out noise and provides a clear, consensus-based trading signal.
Layered Visual Feedback:
Uses color-coded histograms, adaptive background cues, and dynamic overlays to deliver a visually intuitive guide to market sentiment at a glance.
Customization and Flexibility:
Offers adjustable parameters for each indicator, allowing users to tailor the system to fit diverse trading styles and market conditions.
✅ Conclusion:
Robust Trading Tool & Non-Repainting Reliability:
This versatile technical analysis tool computes an extensive range of indicators, aggregates them into a stable, non-repainting “Master Candle” signal, and maintains consistent, verifiable outputs on historical data.
Holistic Market Insight & Consistent Signal Generation:
By combining trend detection, momentum oscillators, and volume analysis, the indicator delivers a comprehensive snapshot of market conditions and generates dependable signals across varying timeframes.
User-Centric Design with Rich Visual Feedback:
Customizable settings, clear color-coded outputs, adaptive backgrounds, and real-time alerts work together to provide actionable, transparent feedback—enhancing the overall trading experience.
A Unique All-in-One Solution:
The integrated approach not only simplifies complex market dynamics into an easy-to-read visual guide but also empowers systematic traders with a powerful, adaptable asset for accurate decision-making.
❤️ Credits:
Pine Script™ User Manual
Supertrend
Ichimoku Cloud
Parabolic SAR
Price Volume Trend (PVT)
Average Directional Index (ADX)
Volume Oscillator
HalfTrend
Donchian Trend

Asset Rotation System [InvestorUnknown]Overview
This system creates a comprehensive trend "matrix" by analyzing the performance of six assets against both the US Dollar and each other. The objective is to identify and hold the asset that is currently outperforming all others, thereby focusing on maintaining an investment in the most "optimal" asset at any given time.
- - - Key Features - - -
1. Trend Classification:
The system evaluates the trend for each of the six assets, both individually against USD and in pairs (assetX/assetY), to determine which asset is currently outperforming others.
Utilizes five distinct trend indicators: RSI (50 crossover), CCI, SuperTrend, DMI, and Parabolic SAR.
Users can customize the trend analysis by selecting all indicators or choosing a single one via the "Trend Classification Method" input setting.
2. Backtesting:
Calculates an equity curve for each asset and for the system itself, which assumes holding only the asset deemed optimal at any time.
Customizable start date for backtesting; by default, it begins either 5000 bars ago (the maximum in TradingView) or at the inception of the youngest asset included, whichever is shorter. If the youngest asset's history exceeds 5000 bars, the system uses 5000 bars to prevent errors.
The equity curve is dynamically colored based on the asset held at each point, with this coloring also reflected on the chart via barcolor().
Performance metrics like returns, standard deviation of returns, Sharpe, Sortino, and Omega ratios, along with maximum drawdown, are computed for each asset and the system's equity curve.
3 Alerts:
Supports alerts for when a new, confirmed optimal asset is identified. However, due to TradingView limitations, the specific asset cannot be included in the alert message.
- - - Usage - - -
1. Select Assets/Tickers:
Choose which assets or tickers you want to include in the rotation system. Ensure that all selected tickers are denominated in USD to maintain consistency in analysis.
2. Configure Trend Classification:
Decide on the trend classification method from the available options (RSI, CCI, SuperTrend, DMI, or Parabolic SAR, All) and adjust the settings to your preferences. This customization allows you to tailor the system to different market conditions or your specific trading strategy.
3. Utilize Backtesting for Calibration:
Use the backtesting results, including equity curves and performance metrics, to fine-tune your chosen trend indicators.
Be cautious not to overemphasize performance maximization, as this can lead to overfitting. The goal is to achieve a robust system that performs well across various market conditions, rather than just optimizing for past data.
- - - Parameters - - -
Tickers:
Asset 1: Select the symbol for the first asset.
Asset 2: Select the symbol for the second asset.
Asset 3: Select the symbol for the third asset.
Asset 4: Select the symbol for the fourth asset.
Asset 5: Select the symbol for the fifth asset.
Asset 6: Select the symbol for the sixth asset.
General Settings:
Trend Classification Method: Choose from RSI, CCI, SuperTrend, DMI, PSAR, or "All" to determine how trends are analyzed.
Use Custom Starting Date for Backtest: Toggle to use a custom date for beginning the backtest.
Custom Starting Date: Set the custom start date for backtesting.
Plot Perf. Metrics Table: Option to display performance metrics in a table on the chart.
RSI (Relative Strength Index):
RSI Source: Choose the price data source for RSI calculation.
RSI Length: Set the period for the RSI calculation.
CCI (Commodity Channel Index):
CCI Source: Select the price data source for CCI calculation.
CCI Length: Determine the period for the CCI.
SuperTrend:
SuperTrend Factor: Adjust the sensitivity of the SuperTrend indicator.
SuperTrend Length: Set the period for the SuperTrend calculation.
DMI (Directional Movement Index):
DMI Length: Define the period for DMI calculations.
Parabolic SAR:
PSAR Start: Initial acceleration factor for the Parabolic SAR.
PSAR Increment: Increment value for the acceleration factor.
PSAR Max Value: Maximum value the acceleration factor can reach.
Notes/Recommendations:
While this system is operational, it's important to recognize that it relies on "basic" indicators, which may not be ideal for generating trading signals on their own. I strongly suggest that users delve into the code to grasp the underlying logic of the system. Consider customizing it by integrating more sophisticated and higher-quality trend-following indicators to enhance its performance and reliability.
Disclaimer:
This system's backtest results are historical and do not predict future performance. Use for educational purposes only; not investment advice.

Liquidation Reversal Signals [AlgoAlpha]🟠 OVERVIEW
This tool detects potential liquidation-driven reversals by combining z-score analysis of up/down volume with the classic Supertrend. It watches for abnormal surges in directional volume (on a lower timeframe) and links them to trend flips on the main chart. When both align within a short window, it flags a probable reversal caused by forced liquidations. The goal is to help traders identify exhaustion points where aggressive liquidation moves may mark the end of a trend leg.
🟠 CONCEPTS
The logic revolves around Z-score normalization of up and down volume to locate statistical extremes. When up-volume z-scores exceed a threshold during a bearish Supertrend, it implies trapped shorts being squeezed; the opposite applies for long liquidations. The script tracks these liquidation spikes and monitors whether a Supertrend regime change follows soon after. If confirmed within the allowed timeout, a colored signal marks the event.
In essence:
Z-score outliers = potential forced liquidations.
Supertrend = structural regime context.
Combined = statistically confirmed reversal signals, not random flips.
This pairing reduces false positives by ensuring that both volatility structure and order-flow extremes agree before flagging a reversal.
🟠 FEATURES
Z-score detection for liquidation spikes with adjustable lookback and threshold.
Confirmation logic linking liquidations to Supertrend flips.
Alerts for liquidation spikes and confirmed reversal starts.
On-chart “No Volume” warning to avoid misreads on illiquid assets.
🟠 USAGE
Setup : Add the script to your main chart. Choose a lower timeframe (default 15m) to capture more granular liquidation flows. Adjust Z-Score Length to control how far back the script measures normal behavior and Threshold to decide what counts as extreme. Keep Timeout Bars low (e.g. 20–50) for faster reversals, or higher for slower markets.
Read the chart :
• Circles appear below bars when long liquidations occur; above bars for short liquidations.
• A Supertrend flip with a recent liquidation spike will display an arrow and color shift.
• Fills between candles and trend lines show which side dominates: green for bullish reversal, red for bearish.
• Candle color fades based on the magnitude of liquidation pressure.
Settings that matter :
• Z-Score Length : Longer smooths noise but delays signal; shorter reacts faster.
• Z-Score Threshold : Higher means only extreme liquidations trigger; lower finds smaller squeezes.
• Timeout Bars : Defines how long after a liquidation the Supertrend flip remains valid.
• Lower Timeframe : Determines the precision of volume readings; too low may increase noise.
