"supertrend" için komut dosyalarını ara


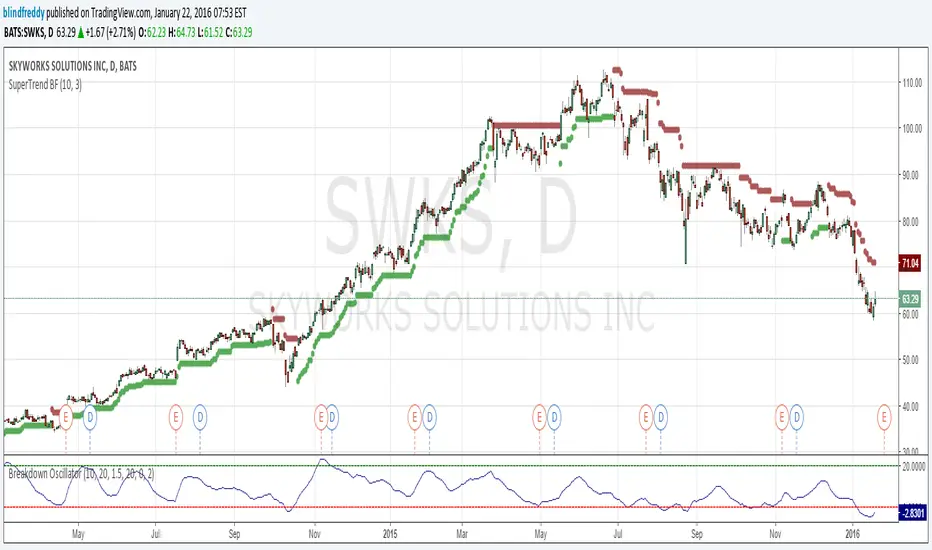
SuperTrend BFI am republishing this indicator as something changed within TradingView's script engine so that the old script ceased to function ( a minor syntax error that used to be acceptable but no longer is).
Anyhow here's the fixed version which as you can see has done a great job of keeping us on the right side of the trend with once-hot stocks like Skyworks !
OptionHawk1. What makes the script original?
• Unique concept: It integrates a Keltner based custom supertrend with a multi-EMA energy visualization, ATR based multi target management, and on chart options (CALL/PUT) trade signals—creating a toolkit not found in typical public scripts.
• Innovative use: Instead of off the shelf indicators, it reinvents them:
• Keltner bands used as dynamic Supertrend triggers.
• Fifteen EMAs layered for “energy” zones (bullish/bearish heatmaps).
• ATR dynamically scales multi-TP levels and stop loss.
These are creatively fused into a unified signal and automation engine.
________________________________________
2. What value does it provide to traders?
• Clear entries & exits: Labels for entry price/time, five TP levels, and SL structure eliminate guesswork.
• Visualization & automation: Real-time bar coloring and energy overlays allow quick momentum reads.
• Targeted to common pain points: Many traders struggle with manual TP/SL and entry timing—this automates that process.
• Ready for real use: Just plug into intraday (e.g., 5 min) or swing setups; no manual calculations. Signals are actionable out of the box.
________________________________________
3. Why invite only (worth paying)?
• Proprietary fusion: Public indicators like Supertrend or EMA are common—but your layered use, ATR based scaling, and label logic are exclusive.
• Auto-generated options format: Unique labeling for CALL/PUT, with graphical on chart signals, isn’t offered freely elsewhere.
• Time-saver & edge-provider: Saves traders hours of configuration and enhances consistency—worth the subscription cost over piecing together mash ups.
________________________________________
4. How does it work?
• Signal backbone: Custom supertrend uses Keltner bands crossing with close for direction, filtered by trend direction EMAs.
• Multi time logic: Trend defined by crossover of price over dynamic SMA thresholds built from ATR.
• Energy bar-colors/EMAs: 15 fast EMAs color-coded green/red to instantly show momentum.
• Entry logic: “Bull” when close crosses above supertrend; “Bear” when crosses below.
• Risk management: SL set at previous bar; up to 5 ATR scaled targets (or percentage based).
• Options formatted alerts: CALL/PUT labels with ₹¬currency values, embedded timestamp, SL/TP all printed on the chart.
________________________________________
5. How should traders use it?
• Best markets & timeframes: Ideal for intraday / low timeframe (1 15m) setups and 1 hour swing trades in equities, indices, options.
• Conditions: Works best in trending or volatility driven sessions—visible via Keltner bands and EMA energy alignment.
• Recommended combo: Use alongside volume filters or broader cycles; when supertrend & energy EMAs align, validation is stronger.
________________________________________
6. Proof of effectiveness?
• On chart visuals: Entry/exit labels, confirmed labels, TP and SL markers make past hits obvious.
• Real trade examples: Highlighted both bull & bear setups with full profit realization or SL hits.
• Performance is paint tested: Easy to showcase historic signals across multiple tickers.
• Data-backed: Users can export chart data to calculate win rate and avg return per trade.
________________________________________
Summary Pitch:
OptionHawk offers a holistic, execution-ready trading tool:
1. Proprietary blend of Keltner-supertrend and layered EMAs—beyond standard scripts.
2. Automates entries, multi-tier targets, SL, and options-format labels.
3. Visual energy overlays for quick momentum readings.
4. Use-tested in intraday and swing markets.
5. Installs on chart and works immediately—no setup complexity.
It's not a public indicator package; it's a self-contained, plug and play trade catalyst—worth subscribing for active traders seeking clarity, speed, and structure in their decision-making.
6. While OptionHawk is designed for clarity and structure, no script can predict the market. Always use with discretion and proper risk management.
---------------------------------------------------------------------------------------------------------------------
OptionHawk: A Comprehensive Trend-Following & Volatility-Adaptive Trading System
The "OptionHawk" script is a sophisticated trading tool designed to provide clear, actionable signals for options trading by combining multiple technical indicators and custom logic. It aims to offer a holistic view of market conditions, identifying trend direction, momentum, and potential entry/exit points with dynamic stop-loss and take-profit levels.
________________________________________
1. Why These Specific Indicators and Code Elements?
The "OptionHawk" script is a strategic fusion of the Supertrend indicator (modified with Keltner Channels), a multi-EMA "Energy" ribbon, dynamic trend lines (based on SMA and ATR), a 100-period Trend Filter EMA, and comprehensive trade management logic (SL/TP). My reason and motivation for this mashup stem from a desire to create a robust system that accounts for various market aspects often overlooked by individual indicators:
• Supertrend with Keltner Channels: The standard Supertrend is effective for trend identification but can sometimes generate whipsaws in volatile or ranging markets. By integrating Keltner Channels into the Supertrend calculation, the volatility measure becomes more adaptive, using the (high - low) range within the Keltner Channel for its ATR-like component. This aims to create a more responsive yet less prone-to-false-signals Supertrend.
• Multi-EMA "Energy" Ribbon: This visually striking element, composed of 15 EMAs, provides a quick glance at short-to-medium term momentum and potential support/resistance zones. When these EMAs are stacked and moving in one direction, it indicates strong "energy" behind the trend, reinforcing the signals from other indicators.
• Dynamic Trend Lines (SMA + ATR): These lines offer a visual representation of support and resistance that adapts to market volatility. Unlike static trend lines, their ATR-based offset ensures they remain relevant across different market conditions and asset classes, providing context for price action relative to the underlying trend.
• 100-Period Trend Filter EMA: A longer-period EMA acts as a higher-timeframe trend filter. This is crucial for confirming the direction identified by the faster-acting Supertrend, helping to avoid trades against the prevailing broader trend.
• Comprehensive Trade Management Logic: The script integrates automated calculation and display of stop-loss (SL) and multiple take-profit (TP) levels, along with trade confirmation and "TP Hit" labels. This is critical for practical trading, providing immediate, calculated risk-reward parameters that individual indicators typically don't offer.
This combination is driven by the need for a multi-faceted approach to trading that goes beyond simple signal generation to include trend confirmation, volatility adaptation, and essential risk management.
________________________________________
2. What Problem or Need Does This Mashup Solve?
This mashup addresses several critical gaps that existing individual indicators often fail to fill:
• Reliable Trend Identification in Volatile Markets: While Supertrend is good, it can be late or whipsaw. Integrating Keltner Channels helps it adapt to changing volatility, providing more reliable trend signals.
• Confirmation of Signals: A common pitfall of relying on a single indicator is false signals. "OptionHawk" uses the multi-EMA "Energy" ribbon and the 100-period EMA to confirm the trend identified by the Keltner-Supertrend, reducing false entries.
• Dynamic Support/Resistance & Trend Context: Static support and resistance levels can quickly become irrelevant. The dynamic SMA + ATR trend lines provide continually adjusting zones that reflect the current market's true support and resistance, giving traders a better understanding of price action within the trend.
• Integrated Risk and Reward Management: Most indicators just give entry signals. This script goes a significant step further by automatically calculating and displaying clear stop-loss and up to five take-profit levels (either ATR-based or percentage-based). This is a vital component for structured trading, allowing traders to pre-define their risk and reward for each trade.
• Visual Clarity and Actionable Information: Instead of requiring traders to layer multiple indicators manually, "OptionHawk" integrates them into a single, cohesive display with intuitive bar coloring, shape plots, and informative labels. This reduces cognitive load and presents actionable information directly on the chart.
In essence, "OptionHawk" provides a more comprehensive, adaptive, and actionable trading framework than relying on isolated indicators.
________________________________________
3. How Do the Components Work Together?
The various components of "OptionHawk" interact in a synergistic and often sequential manner to generate signals and manage trades:
• Keltner-Supertrend as the Primary Signal Generator: The supertrend function, enhanced by keltner_channel, is the core of the system. It identifies potential trend reversals and continuation signals (bullish/bearish crosses of the supertrendLine). The sensitivity and factor inputs directly influence how closely the Supertrend follows price and its responsiveness to volatility.
• Multi-EMA "Energy" Ribbon for Momentum and Confirmation: The 15 EMAs (from ema1 to ema15) are plotted to provide a visual representation of short-term momentum. When the price is above these EMAs and they are spread out and pointing upwards, it suggests strong bullish "energy." Conversely, when price is below them and they are pointing downwards, it indicates bearish "energy." This ribbon serves as a simultaneous visual confirmation for the Supertrend signals; a buy signal from Supertrend is stronger if the EMA ribbon is also indicating upward momentum.
• Dynamic Trend Lines for Context and Confirmation: The sma_high and sma_low lines, incorporating ATR, act as dynamic support and resistance. The trend variable, determined by price crossing these lines, provides an overarching directional bias. This component works conditionally with the Supertrend; a bullish Supertrend signal is more potent if the price is also above the sma_high (indicating an uptrend).
• 100-Period Trend Filter EMA for Macro Trend Confirmation: The ema100 acts as a macro trend filter. Supertrend signals are typically considered valid if they align with the direction of the ema100. For example, a "BUY" signal from the Keltner-Supertrend is ideally taken only if the price is also above the ema100, signifying that the smaller trend aligns with the larger trend. This is a conditional filter.
• Trade Confirmation and SL/TP Logic (Sequential and Conditional):
• Once a bull or bear signal is generated by the Keltner-Supertrend, the tradeSignalCall or tradeSignalPut is set to true.
• A confirmation step then occurs for a "BUY" signal, the script checks if the close of the next bar is higher than the entry bar's close. For a "SELL" signal, it checks if the close of the next bar is lower. This is a sequential confirmation step aimed at filtering out weak signals.
• Upon a confirmed signal, the stop-loss (SL) is immediately set based on the previous bar's low (for calls) or high (for puts).
• Multiple take-profit (TP) levels are calculated and stored in arrays. These can be based on a fixed percentage or dynamic ATR multiples, based on user input.
• The TP HIT logic continuously monitors price action simultaneously against these pre-defined target levels, displaying labels when a target is reached. The SL HIT logic similarly monitors for a stop-loss breach.
In summary, the Supertrend generates the initial signal, which is then confirmed by the dynamic trend lines and the 100-period EMA, and visually reinforced by the EMA "Energy" ribbon. The trade management logic then takes over, calculating and displaying vital risk-reward parameters.
________________________________________
4. What is the Purpose of the Mashup Beyond Simply Merging Code?
The purpose of "OptionHawk" extends far beyond merely combining different indicator codes; it's about creating a structured and informed decision-making process for options trading. The key strategic insights and functionalities added by combining these elements are:
• Enhanced Signal Reliability and Reduced Noise: By requiring multiple indicators to align (e.g., Keltner-Supertrend signal confirmed by EMA trend filter and dynamic trend lines), the script aims to filter out false signals and whipsaws that commonly plague individual indicators. This leads to higher-probability trade setups.
• Adaptive Risk Management: The integration of ATR into both the Supertrend calculation and the dynamic stop-loss/take-profit levels makes the entire system adaptive to current market volatility. This means stop-losses and targets are not static but expand or contract with the market's price swings, promoting more realistic risk management.
• Clear Trade Entry and Exit Framework: The script provides a complete trading plan with each signal: a clear entry point, a precise stop-loss, and multiple cascading take-profit levels. This holistic approach empowers traders to manage their trades effectively from initiation to conclusion, rather than just identifying a potential entry.
• Visual Confirmation of Market Strength: The "Energy" ribbon and dynamic trend lines provide an immediate visual understanding of the market's momentum and underlying trend strength, helping traders gauge conviction behind a signal.
• Improved Backtesting and Analysis: By combining these elements into one script, traders can more easily backtest a comprehensive strategy rather than trying to manually combine signals from multiple overlaying indicators, leading to more accurate strategy analysis.
• Suitability for Options Trading: Options contracts are highly sensitive to price movement and volatility. This script's focus on confirmed trend identification, dynamic volatility adaptation, and precise risk management makes it particularly well-suited for the nuanced demands of options trading, where timing and defined risk are paramount.
________________________________________
5. What New Functionality or Insight Does Your Script Offer?
"OptionHawk" offers several new functionalities and insights that significantly enhance decision-making, improve accuracy, and provide clearer signals and better timing for traders:
• "Smart" Supertrend: By basing the Supertrend's volatility component on the Keltner Channel's range instead of a simple ATR, the Supertrend becomes more sensitive to price action within its typical bounds while still adapting to broader market volatility. This can lead to earlier and more relevant trend change signals.
• Multi-Confirmation System: The script doesn't just provide a signal; it layers multiple confirmations (Keltner-Supertrend, multi-EMA "Energy" coloration, dynamic trend lines, and the 100-period EMA). This multi-layered validation significantly improves the accuracy of signals by reducing the likelihood of false positives.
• Automated and Dynamic Risk-Reward Display: This is a major functionality enhancement. The automatic calculation and clear display of stop-loss and five distinct take-profit levels (based on either ATR or percentage) directly on the chart, along with "TP HIT" and "SL HIT" labels, streamline the trading process. Traders no longer need to manually calculate these crucial levels, leading to enhanced decision-making and better risk management.
• Visual Trend "Energy" and Momentum: The vibrant coloring of the multi-EMA ribbon based on price relative to the EMA provides an intuitive and immediate visual cue for market momentum and "energy." This offers an insight into the strength of the current move, which isn't available from single EMA plots.
• Post-Signal Confirmation: The "Confirmation" label appearing on the bar after a signal, if the price continues in the signaled direction, adds an extra layer of real-time validation. This helps to improve signal timing by waiting for initial follow-through.
• Streamlined Options Trading Planning: For options traders, having clear entry prices, stop-losses, and multiple target levels directly annotated on the chart is invaluable. It helps in quickly assessing potential premium movements and managing positions effectively.
In essence, "OptionHawk" transitions from a collection of indicators to a semi-automated trading assistant, providing a comprehensive, visually rich, and dynamically adaptive framework for making more informed and disciplined trading decisions.
----------------------------------------------------------------------------------------------------------------
Performance & Claims
1. What is the claimed performance of the script or strategy?
Answer: The script does not claim any specific performance metrics (e.g., win rate, profit factor, percentage gains). It's an indicator designed to identify potential buy/sell signals and target/stop-loss levels. The labels it generates ("BUY CALL," "BUY PUT," "TP HIT," "SL HIT") are informational based on its internal logic, not a representation of actual trading outcomes.
2. Is there any proof or backtesting to support this claim?
Answer: No, the provided code does not include any backtesting functionality or historical performance proof. As an indicator, it simply overlays visual signals on the chart. To obtain backtesting results, the logic would need to be implemented as a Pine Script strategy with entry/exit rules and commission/slippage considerations.
3. Are there any unrealistic or exaggerated performance expectations being made?
Answer: The script itself does not make any performance expectations. It avoids quantitative claims. However, if this script were presented to users with implied promises of profit based solely on the visual signals, that would be unrealistic.
4. Have you clearly stated the limitations of the performance data (e.g., “based on backtesting only”)?
Answer: There is no statement of performance data or its limitations because the script doesn't generate performance data.
5. Do you include a disclaimer that past results do not guarantee future performance?
Answer: No, the script does not include any disclaimers about past or future performance. This is typically found in accompanying documentation or marketing materials for a trading system, not within the indicator's code itself.
________________________________________
Evidence & Transparency
6. How are your performance results measured (e.g., profit factor, win rate, Sharpe ratio)?
Answer: Performance results are not measured by this script. It's an indicator.
7. Are these results reproducible by others using the same script and settings?
Answer: The visual signals and calculated levels (Supertrend line, EMAs, target/SL levels) generated by the script are reproducible on TradingView when applied to the same instrument, timeframe, and with the same input settings. However, the actual trading results (profit/loss) are not generated or reproducible by this indicator.
8. Do you include enough data (charts, equity curves, trade logs) to support your claims?
Answer: No, the script does not include or generate equity curves or trade logs. It provides visual labels on the chart, which can be seen as a form of "data" to support the signal generation, but not the performance claims (as none are made by the code).
________________________________________
Future Expectations
9. Are you making any predictions about future market performance?
Answer: No, the script does not make any explicit predictions about future market performance. Its signals are based on historical price action and indicator calculations.
10. Have you stated clearly that the future is fundamentally uncertain?
Answer: No, the script does not contain any statements about the uncertainty of the future.
11. Are forward-looking statements presented with caution and appropriate language?
Answer: The script does not contain any forward-looking statements beyond the visual signals it generates based on real-time data.
________________________________________
Risk & Disclosure
12. Have you disclosed the risks associated with using your script or strategy?
Answer: No, the script does not include any risk disclosures. This is typically found in external documentation.
13. Do you explain that trading involves potential loss as well as gain?
Answer: No, the script does not contain any explanation about the potential for loss in trading.
________________________________________
Honesty & Integrity
14. Have you avoided hype words like “guaranteed,” “foolproof,” or “no losses”?
Answer: Yes, the script itself avoids these hype words. The language used within the code is technical and describes the indicator's logic.
15. Is your language grounded and realistic rather than promotional?
Answer: Yes, the language within the provided Pine Script code is grounded and realistic as it pertains to the technical implementation of an indicator.
16. Are you leaving out any important details that might mislead users (e.g., selective performance snapshots)?
Answer: From the perspective of the code itself, no, it's not "leaving out" performance details because it's not designed to generate them. However, if this indicator were to be presented as a "strategy" that implies profitability without accompanying disclaimers, backtesting results, and risk disclosures, then that external presentation could be misleading. The script focuses on signal generation and visual representation.
⚠️ Disclaimer:
This indicator is for informational and educational purposes only. It does not guarantee any future results or performance. All trading involves risk. Please assess your own risk tolerance and consult a licensed financial advisor if needed. Past performance does not indicate future returns.

D-BoT Alpha Volume SpikeHello traders, Let me explain the code and provide an example of how to trade using this indicator.
The code you provided is a Pine Script indicator that combines multiple technical indicators, such as Supertrend, ADX, RSI, and MFI, to generate buy and sell signals. Here's a breakdown of the code:
User Settings:
The user can adjust parameters like overbought_limit, oversold_limit, volume_multiplier, volume_ma_length, volume_spike_multiple, lookback_period, and use_extremities_confirmation according to their preference.
Calculate Supertrend:
The Supertrend indicator is calculated using three different ATR lengths (supertrend_atr_period1, supertrend_atr_period2, supertrend_atr_period3) and corresponding factors (supertrend_factor1, supertrend_factor2, supertrend_factor3).
The supertrend_value1, supertrend_value2, and supertrend_value3 represent the Supertrend values, while trend_direction1, trend_direction2, and trend_direction3 indicate the trend direction (negative for downtrend, positive for uptrend).
Candle calculations:
The high and low values are checked to identify bullish and bearish candles based on specific conditions.
Volume Spikes:
Volume spikes are detected by comparing the current volume with a median volume over a specified lookback period.
If the volume exceeds a certain multiple of the median volume and the DI+ value is greater than the DI- value, an "up" signal is generated. Similarly, if the DI- value is greater than the DI+ value, a "down" signal is generated.
Additional Filters (RSI and MFI):
Relative Strength Index (RSI) and Money Flow Index (MFI) are used as additional filters.
The RSI and MFI parameters can be adjusted according to the user's preference.
The signals generated by the volume spikes are filtered based on RSI and MFI conditions.
Plotting:
The indicator plots shapes (triangles) to represent buy and sell signals.
The Supertrend lines are plotted using different colors and transparency levels based on the distance from the current price.
The "bodyMiddle" plot is used for filling the area between the Supertrend lines.
Example Trade Scenario:
Let's consider an example trade scenario using this indicator:
When the indicator generates an "up" signal (trendBuy = true), indicating a potential bullish trend, and all the confirmation conditions (RSI, MFI, Supertrend) are met, you can consider opening a long position.
Conversely, when the indicator generates a "down" signal (trendSell = true), indicating a potential bearish trend, and all the confirmation conditions are met, you can consider opening a short position.
Remember, this is just an example, and it's crucial to perform thorough analysis and consider other factors before making trading decisions. It's recommended to backtest the strategy, assess risk management, and apply appropriate position sizing techniques.
Please note that the code provided is a simplified version, and there might be additional factors and considerations specific to your trading strategy that are not included in this code. *******"I have also reviewed the following indicators, and the volume calculation approaches of my friends have been very helpful in creating this indicator: "Volume Spikes " © tradeforopp and "Volume Spikes & Growing Volume Signals With Alerts & Scanner" © FriendOfTheTrend."*******
Trend Following Bundle [ActiveQuants]The Trend Following Bundle indicator is a comprehensive toolkit designed to equip traders with a suite of essential technical analysis tools focused on identifying , confirming , and capitalizing on market trends . By bundling popular indicators like Moving Averages , MACD , Supertrend , ADX , ATR , OBV , and the Choppiness Index into a single script, it streamlines chart analysis and enhances strategy development.
This bundle operates on the principle that combining signals from multiple, complementary indicators provides a more robust view of market trends than relying on a single tool. It integrates:
Trend Direction: Moving Averages, Supertrend.
Momentum: MACD.
Trend Strength: ADX.
Volume Pressure: On Balance Volume (OBV).
Volatility: Average True Range (ATR).
Market Condition Filter: Choppiness Index (Trend vs. Range).
By allowing users to selectively enable, customize, and view these indicators (potentially across different timeframes), the bundle facilitates nuanced and layered trend analysis.
█ KEY FEATURES
All-in-One Convenience: Access multiple core trend-following indicators within a single TradingView script slot.
Modular Design: Easily toggle each individual indicator (MAs, MACD, Supertrend, etc.) On or Off via the settings menu to customize your chart view.
Extensive Customization: Fine-tune parameters (lengths, sources, MA types, colors, etc.) for every included indicator to match your trading style and the specific asset.
Multi-Timeframe (MTF) Capability: Configure each indicator component to analyze data from a different timeframe than the chart's, allowing for higher-level trend context.
Integrated Alerts: Pre-built alert conditions for key events like Moving Average crossovers , MACD signals , Supertrend flips , and Choppiness Index threshold crosses . Easily set up alerts through TradingView's alert system.
When configuring your alerts in TradingView, pay close attention to the trigger option:
- Setting it to " Only Once " will trigger the alert the first time the condition is met, which might happen during an unclosed bar (intra-bar). This alert instance will then cease.
- Setting it to " Once Per Bar Close " will trigger the alert only after a bar closes if the condition was met on that finalized bar. This ensures signals are based on confirmed data and allows the alert to potentially trigger again on subsequent closing bars if the condition persists or reoccurs. Use this option for signals based on confirmed, closed-bar data.
MA Smoothing & Bands (Optional): Apply secondary smoothing or Bollinger Bands directly to the Fast and Slow Moving Averages for advanced analysis.
█ USER INPUTS
Fast MA:
On/Off: Enables/Disables the Fast Moving Average plot and related smoothing/bands.
Type: Selects the primary calculation type (SMA, EMA, SMMA (RMA), WMA, VWMA). Default: EMA.
Source: Input data for the MA calculation (e.g., close, open, hl2). Default: close.
Length: Lookback period for the primary MA calculation. Default: 9.
Color: Sets the color of the primary Fast MA line. Default: Yellow.
Line Width: Sets the thickness of the primary Fast MA line. Default: 2.
Smoothing Type: Selects secondary smoothing type applied to the primary MA (e.g., None, SMA, EMA) or adds Bollinger Bands (SMA + Bollinger Bands). Default: None.
Smoothing Length: Lookback period for the secondary smoothing MA or the basis MA for Bollinger Bands. Relevant only if Smoothing Type is not " None ". Default: 10.
BB StdDev: Standard deviation multiplier for Bollinger Bands. Relevant only if Smoothing Type is " SMA + Bollinger Bands ". Default: 2.0.
Timeframe: Sets a specific timeframe for the MA calculation. Default: Chart.
Wait TF Close: If a timeframe is set, waits for that timeframe's bar to close before plotting, preventing repainting. Default: true.
Slow MA:
On/Off: Enables/Disables the Slow Moving Average plot and related smoothing/bands.
Type: Selects the primary calculation type (SMA, EMA, SMMA (RMA), WMA, VWMA). Default: EMA.
Source: Input data for the MA calculation (e.g., close, open, hl2). Default: close.
Length: Lookback period for the primary MA calculation. Default: 9.
Color: Sets the color of the primary Slow MA line. Default: Yellow.
Line Width: Sets the thickness of the primary Slow MA line. Default: 2.
Smoothing Type: Selects secondary smoothing type applied to the primary MA (e.g., None, SMA, EMA) or adds Bollinger Bands (SMA + Bollinger Bands). Default: None.
Smoothing Length: Lookback period for the secondary smoothing MA or the basis MA for Bollinger Bands. Relevant only if Smoothing Type is not " None ". Default: 10.
BB StdDev: Standard deviation multiplier for Bollinger Bands. Relevant only if Smoothing Type is " SMA + Bollinger Bands ". Default: 2.0.
Timeframe: Sets a specific timeframe for the MA calculation. Default: Chart.
Wait TF Close: If a timeframe is set, waits for that timeframe's bar to close before plotting, preventing repainting. Default: true.
MACD:
On/Off: Enables/Disables the MACD plots (MACD line, Signal line, Histogram).
Fast Length: Lookback period for the fast MA in MACD calculation. Default: 12.
Slow Length: Lookback period for the slow MA in MACD calculation. Default: 26.
Source: Input data for the MACD MAs. Default: close.
Signal Smoothing: Lookback period for the Signal Line MA. Default: 9.
Oscillator MA Type: Calculation type for Fast and Slow MAs (SMA, EMA). Default: EMA.
Signal Line MA Type: Calculation type for Signal Line MA (SMA, EMA). Default: EMA.
MACD Color: Color of the MACD line. Default: #2962FF.
MACD Signal Color: Color of the Signal line. Default: #FF6D00.
Timeframe: Sets a specific timeframe for the MACD calculation. Default: Chart.
Wait TF Close: If a timeframe is set, waits for that timeframe's bar to close. Default: true.
On Balance Volume (OBV):
On/Off: Enables/Disables the OBV plot and its related MAs/Bands.
Type (MA Smoothing): Selects MA type for smoothing OBV (None, SMA, EMA, etc.) or SMA + Bollinger Bands. Default: None.
Length (MA Smoothing): Lookback period for the OBV smoothing MA. Default: 14.
BB StdDev: Standard deviation multiplier for Bollinger Bands if selected. Default: 2.0.
Color: Color of the main OBV line. Default: #2962FF.
Timeframe: Sets a specific timeframe for the OBV calculation. Default: Chart.
Wait TF Close: If a timeframe is set, waits for that timeframe's bar to close. Default: true.
ADX:
On/Off: Enables/Disables the ADX plot.
ADX Smoothing: Lookback period for the ADX smoothing component. Default: 14.
DI Length: Lookback period for the Directional Movement (+DI/-DI) calculation. Default: 14.
Color: Color of the ADX line. Default: Red.
Timeframe: Sets a specific timeframe for the ADX calculation. Default: Chart.
Wait TF Close: If a timeframe is set, waits for that timeframe's bar to close. Default: true.
ATR:
On/Off: Enables/Disables the ATR plot.
Length: Lookback period for the ATR calculation. Default: 14.
Smoothing: Selects the calculation type for ATR (SMMA (RMA), SMA, EMA, WMA). Default: SMMA (RMA).
Color: Color of the ATR line. Default: #B71C1C.
Timeframe: Sets a specific timeframe for the ATR calculation. Default: Chart.
Wait TF Close: If a timeframe is set, waits for that timeframe's bar to close. Default: true.
Supertrend:
On/Off: Enables/Disables the Supertrend plot and background fill.
ATR Length: Lookback period for the ATR calculation within Supertrend. Default: 10.
Factor: Multiplier for the ATR value used to calculate the Supertrend bands. Default: 3.0.
Up Trend Color: Color for the Supertrend line and background during an uptrend. Default: Green.
Down Trend Color: Color for the Supertrend line and background during a downtrend. Default: Red.
Timeframe: Sets a specific timeframe for the Supertrend calculation. Default: Chart.
Wait TF Close: If a timeframe is set, waits for that timeframe's bar to close. Default: true.
Choppiness Index:
On/Off: Enables/Disables the Choppiness Index plot and bands.
Length: Lookback period for the Choppiness Index calculation. Default: 14.
Offset: Shifts the plot left or right. Default: 0.
Color: Color of the Choppiness Index line. Default: #2962FF.
Timeframe: Sets a specific timeframe for the CI calculation. Default: Chart.
Wait TF Close: If a timeframe is set, waits for that timeframe's bar to close. Default: true.
█ STRATEGY EXAMPLES
The following strategy examples are provided for illustrative and educational purposes only to demonstrate how indicators within this bundle could be combined. They do not constitute financial advice or trading recommendations. Always conduct your own thorough research and backtesting before implementing any trading strategy.
Here are a few ways the indicators in this bundle can be combined:
1. MA Crossover with Multi-Factor Confirmation
Goal: Enter trends early with confirmation from momentum and trend strength, while filtering out choppy conditions.
Setup: Enable Fast MA (e.g., 9 EMA), Slow MA (e.g., 50 EMA), MACD, ADX, and Choppiness Index.
Entry (Long):
- Price > Slow MA (Establishes broader uptrend context).
- Fast MA crosses above Slow MA OR Price crosses above Fast MA.
- MACD Histogram > 0 (Confirms bullish momentum).
- ADX > 20 or 25 (Indicates sufficient trend strength).
- Choppiness Index < 61.8 (Filters out excessively choppy markets).
Entry (Short): Reverse logic (except for ADX and Choppiness Index).
Management: Consider using the Supertrend or an ATR multiple for stop-loss placement.
Image showing a chart with 2:1 long and short trades, highlighting a candle disqualified for a long entry due to ADX below 20.
2. Supertrend Breakout Strategy
Goal: Use Supertrend for primary signals and stops, confirming with volume and trend strength.
Setup: Enable Supertrend, Slow MA, ADX, and OBV.
Entry (Long):
- Supertrend line turns green and price closes above it.
- Price > Slow MA (Optional filter for alignment with larger trend).
- ADX is rising or above 20 (Confirms trending conditions).
- OBV is generally rising or breaks a recent resistance level (Confirms volume supporting the move).
Entry (Short): Reverse logic (except for ADX and OBV).
Management: Initial stop-loss placed just below the green Supertrend line (for longs) or above the red line (for shorts). Trail stop as Supertrend moves.
Image showing a chart with a 2:1 long trade, one candle disqualified for a short entry, and another disqualified for a long entry.
3. Trend Continuation Pullbacks
Goal: Enter established trends during pullbacks to value areas defined by MAs or Supertrend.
Setup: Enable Slow MA, Fast MA (or Supertrend), MACD, and ADX.
Entry (Long):
- Price is consistently above the Slow MA (Strong uptrend established).
- ADX > 25 (Confirms strong trend).
- Price pulls back towards the Fast MA or the green Supertrend line.
- MACD Histogram was decreasing during the pullback but turns positive again OR MACD line crosses above Signal line near the MA/Supertrend level (Indicates momentum resuming).
Entry (Short): Reverse logic (except for ADX) during a confirmed downtrend.
Management: Stop-loss below the recent swing low or the Slow MA/Supertrend level.
Image showing a chart with 2:1 long and short trades, where price pulls back to the fast MA and the MACD histogram changes color, indicating shifts in momentum during the pullbacks.
█ CONCLUSION
The Trend Following Bundle offers a powerful and flexible solution for traders focused on trend-based strategies. By consolidating essential indicators into one script with deep customization, multi-timeframe analysis, and built-in alerts, it simplifies the analytical workflow and allows for the development of robust, multi-conditional trading systems. Whether used for confirming entries, identifying trend strength, managing risk, or filtering market conditions, this bundle provides a versatile foundation for technical analysis.
█ IMPORTANT NOTES
⚠ Parameter Tuning: Indicator settings (lengths, factors, thresholds) are not one-size-fits-all. Adjust them based on the asset being traded, its typical volatility, and the timeframe you are analyzing for optimal performance. Backtesting is crucial .
⚠ Multi-Timeframe Use: Using the Timeframe input allows for powerful analysis but be mindful of potential lag, especially if Wait TF Close is disabled. Signals based on higher timeframes will update only when that higher timeframe bar closes (if Wait TF Close is enabled).
⚠ Confirmation is Key: While the bundle provides many tools, avoid relying on a single indicator's signal. Use combinations to build confluence and increase the probability of successful trades.
⚠ Chart Clarity: With many indicators available, only enable those relevant to your current strategy to avoid overwhelming your chart. Use the On/Off toggles frequently.
⚠ Confirmed Bars Only: Like most TradingView indicators, signals and plots are finalized on the close of the bar. Be cautious acting on intra-bar signals which may change before the bar closes.
█ RISK DISCLAIMER
Trading involves substantial risk of loss and is not suitable for every investor. The Trend Following Bundle indicator provides technical analysis tools for educational and informational purposes only; it does not constitute financial advice or a recommendation to buy or sell any asset. Indicator signals identify potential patterns based on historical data but do not guarantee future price movements or profitability. Always conduct your own thorough analysis, use multiple sources of information, and implement robust risk management practices before making any trading decisions. Past performance is not indicative of future results.
📊 Happy trading! 🚀

IU Trailing Stop Loss MethodsThe 'IU Trailing Stop Loss Methods' it's a risk management tool which allows users to apply 12 trailing stop-loss (SL) methods for risk management of their trades and gives live alerts when the trailing Stop loss has hit. Below is a detailed explanation of each input and the working of the Script.
Main Inputs:
- bar_time: Specifies the date from which the trade begins and entry price will be the open of the first candle.
- entry_type: Choose between 'Long' or 'Short' positions.
- trailing_method: Select the trailing stop-loss method. Options include ATR, Parabolic SAR, Supertrend, Point/Pip based, Percentage, EMA, Highest/Lowest, Standard Deviation, and multiple target-based methods.
- exit_after_close: If checked, exits the trade only after the candle closes.
Optional Inputs:
ATR Settings:
- atr_Length: Length for the ATR calculation.
- atr_factor: ATR multiplier for SL calculation.
Parabolic SAR Settings:
- start, increment, maximum: Parameters for the Parabolic SAR indicator.
Supertrend Settings:
- supertrend_Length, supertrend_factor: Length and factor for the Supertrend indicator.
Point/Pip Based:
- point_base: Set trailing SL in points/pips.
Percentage Based:
- percentage_base: Set SL as a percentage of entry price.
EMA Settings:
- ema_Length: Length for EMA calculation.
Standard Deviation Settings:
- std_Length, std_factor: Length and factor for standard deviation calculation.
Highest/Lowest Settings:
- highest_lowest_Length: Length for the highest/lowest SL calculation.
Target-Based Inputs:
- ATR, Point, Percentage, and Standard Deviation based target SL settings with customizable lengths and multipliers.
Entry Logic:
- Trades initiate based on the entry_type selected and the specified bar_time.
- If Long is selected, a long trade is initiated when the conditions match, and vice versa for Short.
Trailing Stop-Loss (SL) Methods Explained:
The strategy dynamically adjusts stop-loss based on the chosen method. Each method has its calculation logic:
- ATR: Stop-loss calculated using ATR multiplied by a user-defined factor.
- Parabolic SAR: Uses the Parabolic SAR indicator for trailing stop-loss.
- Supertrend: Utilizes the Supertrend indicator as the stop-loss line.
- Point/Pip Based: Fixed point-based stop-loss.
- Percentage Based: SL set as a percentage of entry price.
- EMA: SL based on the Exponential Moving Average.
- Highest/Lowest: Uses the highest high or lowest low over a specified period.
- Standard Deviation: SL calculated using standard deviation.
Exit Conditions:
- If exit_after_close is enabled, the position will only close after the candle confirms the stop-loss hit.
- If exit_after_close is disabled, the strategy will close the trade immediately when the SL is breached.
Visualization:
The script plots the chosen trailing stop-loss method on the chart for easy visualization.
Target-Based Trailing SL Logic:
- When a position is opened, the strategy calculates the initial stop-loss and progressively adjusts it as the price moves favorably.
- Each SL adjustment is stored in an array for accurate tracking and visualization.
Alerts and Labels:
- When the Entry or trailing stop loss is hit this scripts draws a label and give alert to the user that trailing stop has been hit for the trade.
Note - on the historical data The Script will show nothing if the entry and the exit has happened on the same candle, because we don't know what was hit first SL or TP (basically how the candle was formed on the lower timeframe).
Summary:
This script offers flexible trailing stop-loss options for traders who want dynamic risk management in their strategies. By offering multiple methods like ATR, SAR, Supertrend, and EMA, it caters to various trading styles and risk preferences.

Smart Liquidity 📊 # 💎 Smart Liquidity Indicator - User Guide
## 📋 Overview
**Smart Liquidity Indicator** is an advanced technical analysis tool for analyzing liquidity and volume in financial markets. It combines several powerful analytical tools to help you make informed trading decisions.
---
## 🎯 Main Components
### 1. 📊 Volume Profile
- **Function**: Displays volume distribution across different price levels
- **Benefit**: Identify strong support and resistance zones based on trading activity
- **Elements**:
- Colored boxes representing volume density at each level
- Labels showing HIGH/LOW of the price range
- PEAK FLOW line indicating the strongest volume level
### 2. 📦 Order Blocks
- **Function**: Identify bullish and bearish Order Block zones
- **Benefit**: Potential areas for price reversal or trend continuation
- **Displayed Information**:
- Delta %: Zone strength (difference between buying and selling pressure)
- Liquidity: Accumulated liquidity in the zone
- Buy/Sell ratios within the zone
### 3. 📈 SuperTrend (Market Direction)
- **Two lines for confirmation**:
- **🎯 Current SuperTrend** (Green/Red): Current timeframe direction
- **🔄 MTF SuperTrend** (Light Green/Red): Higher timeframe direction (4H default)
- **Benefit**: Trade with the overall market trend
### 4. 📊 Dashboard (Information Panel)
- Display current market status
- Trend and momentum information
- Active Order Blocks statistics
---
## 🚀 How to Use
### 1️⃣ **Reading Volume Profile**
- **Dense boxes** = High volume accumulation areas = Strong support/resistance
- **PEAK FLOW line** = Strongest price level (POC - Point of Control)
- **HIGH/LOW Labels** = Boundaries of the analyzed price range
### 2️⃣ **Analyzing Order Blocks**
- **Positive Delta (+)** = Strong buying pressure → Reliable bullish zone
- **Negative Delta (-)** = Strong selling pressure → Reliable bearish zone
- **Delta near 0** = Balance → Weak zone, avoid it
### 3️⃣ **Using SuperTrend**
- **Current TF (Green bullish / Red bearish)**: Current timeframe direction
- **MTF (Light Green bullish / Light Red bearish)**: Higher timeframe direction
- **Best Trading**: When both lines agree on the same direction
### 4️⃣ **Suggested Strategy**
```
✅ Strong Entry Signal:
1. Order Block with strong Delta (>30% or <-30%)
2. Current SuperTrend and MTF in the same direction
3. Volume Profile confirms the level (dense box or PEAK)
4. Price tests the zone for the first time
❌ Avoid Entry When:
- Weak Delta (between -10% and +10%)
- Conflict between Current and MTF SuperTrend
- Zone tested multiple times (weakened)
```
---
## 🎨 Understanding Colors
### Order Blocks
- 🟢 **Green**: Bullish Order Block
- 🔴 **Red**: Bearish Order Block
### SuperTrend
- 🟢 **Green**: Current SuperTrend bullish (same color as Order Blocks)
- 🔴 **Red**: Current SuperTrend bearish (same color as Order Blocks)
- 🟢 **Light Green**: MTF SuperTrend bullish
- 🔴 **Light Red**: MTF SuperTrend bearish
**Note**: Each SuperTrend has different transparency levels based on trend strength
### Volume Profile
- **Gradient from light to dark**: Represents volume density (darker = higher volume)
---
## ⚡ Performance Tips
### For Maximum Speed (Current Settings):
✅ **Enabled**:
- Order Blocks: 2 zones per side
- Volume Profile: 20 levels
- SuperTrends: Both active
- Strength Delta: Displayed
❌ **Disabled** (for speed):
- Gradient Fill
- Predictive Zones
- Background Fill
- MTF Calculations (in internal calculations)
### If Indicator is Slow:
1. Reduce `Profile Rows` from 20 → 15
2. Reduce `Lookback Period` from 50 → 40
3. Reduce `Max Zones` from 2 → 1
4. Turn off `Show OB Labels` if not needed
---
## 🔄 Additional Tools
### ♻️ Reset Now
- **Location**: Visual Tweaks
- **Usage**: If Volume Profile is cluttered, enable it to redraw
- **Note**: Disable after use
### 🎯 Draw Mode
- **Live**: Direct drawing on the last candle
- **Confirmed**: Draw only on closed candles (more stable)
---
## ⚠️ Disclaimer
### 🚨 Important Notice
**This indicator is a technical analysis tool only and is not considered financial advice or a trading recommendation.**
#### 📌 Please Note:
1. **Just an Analytical Tool**:
- The indicator provides technical information based on historical data
- Past results do not guarantee future results
2. **Personal Responsibility**:
- You are solely responsible for your own trading decisions
- Conduct your own research before making any investment decision
- Use appropriate risk management (Stop Loss, Position Sizing)
3. **No Guarantees**:
- There is no guarantee of profit or success in trading
- Financial markets carry high risks
- You may lose your entire invested capital
4. **Consult a Professional**:
- Consult a licensed financial advisor before making important investment decisions
- Ensure you fully understand the risks associated with trading
5. **Proper Use**:
- The indicator is designed as an assistive tool, not an automated trading system
- Preferably combine it with your own analysis and other tools
- Do not rely on a single signal alone
#### ⚖️ Acceptance:
By using this indicator, you acknowledge and agree that:
- The indicator developer is not responsible for any financial losses
- All trading decisions are your personal responsibility
- You understand the risks associated with trading in financial markets
---
## 💡 Final Advice
**"The best traders use tools wisely, not blindly"**
- Learn how the indicator works before relying on it
- Test settings on a demo account first
- Always use Stop Loss
- Don't risk more than you can afford to lose
---
## 📞 Contact and Support
**If you need any help or have any questions, feel free to contact me.**
I'm here to help you understand and use the indicator correctly! 🤝
---
**Good Luck & Trade Safe! 🚀📈**

区间顶底与超级趋势系统Overview:
This is a comprehensive trading system designed to capture both trend reversals and trend-following opportunities. This script combines three core modules: Long-term EMA Tunnels (Vegas Style), Dynamic Support/Resistance Zones (based on historical highs/lows), and the classic SuperTrend. It aims to help traders identify "buy low, sell high" opportunities in ranging markets and catch major waves during strong trends.
Core Features Explained
1. EMA Long-term Trend Tunnel
Configuration: The script includes three specific Exponential Moving Averages (EMAs): 144, 169, and 233.
Function: These lines form a long-term support and resistance band. Price action above these lines is generally considered a bullish trend, while price below indicates a bearish trend.
2. Dynamic Range Top/Bottom
Logic: Calculates the current market structure based on the highest and lowest prices over a specific lookback period (default 130 bars), combined with ATR (Average True Range).
Visualization: Automatically draws Resistance Boxes (Red zone) at the top and Support Boxes (Green zone) at the bottom.
Data Panel: Displays the current ATR volatility percentage and a count of Bullish/Bearish K-lines within the period to help gauge the balance of power between buyers and sellers.
Signals: Reversal arrows appear when price tests these extreme zones and shows signs of rejection.
3. SuperTrend Integration
Tool: A classic trend-following indicator based on ATR and median price.
Usage: Acts as a reliable market noise filter. When SuperTrend is green, it is recommended to look for long setups; when red, look for short setups.
Highlighting: The script supports background highlighting, allowing you to identify the current trend direction at a glance.
How to Use This System
Trend Following Strategy: When the EMA lines are aligned upwards and the SuperTrend shows a Buy signal (Green background), look for long entries on pullbacks to the SuperTrend support line or near the EMAs.
Range Reversal Strategy: When price hits the upper or lower limits of the "Dynamic Range" and a SuperTrend flip or arrow reversal signal occurs, consider counter-trend trades.
Stop Loss: It is recommended to place stop losses just outside the SuperTrend line or the Dynamic Range boxes.
Settings
EMA: You can toggle the visibility of the EMA lines on or off.
Dynamic Range: Customizable lookback period (Length) and extension settings to fit your timeframe.
SuperTrend: Fully adjustable ATR Period and Multiplier to adapt to different asset volatilities.
Disclaimer: This script is for educational purposes only and does not constitute financial advice.
概述:
这是一个专为捕捉趋势反转与顺势交易设计的综合交易系统。本脚本结合了三大核心模块:长期均线隧道(Vegas风格)、动态支撑阻力区间(基于历史高低点)以及经典的超级趋势(SuperTrend)。旨在帮助交易者在震荡行情中识别高抛低吸的机会,并在趋势行情中抓住主升浪。
核心功能解析
1. EMA 长期趋势隧道 (EMA Tunnel)
脚本内置了三条特定的指数移动平均线 (EMA):144、169 和 233。
这些均线构成了长期趋势的支撑与阻力带。当价格位于这些均线之上时,通常视为多头趋势;反之则为空头趋势。
2. 动态顶底区间 (Dynamic Range Top/Bottom)
原理:基于过去一定周期(默认130根K线)内的最高价和最低价,结合 ATR(平均真实波幅)计算出当前的市场结构。
视觉化:图表中会自动绘制出顶部的阻力箱体(红色区域)和底部的支撑箱体(绿色区域)。
数据面板:箱体旁会显示当前的 ATR 波动率百分比,以及该周期内的 K 线买入/卖出计数,帮助判断多空力量对比。
信号:当价格触及这些极限区域并出现反转迹象时,会显示箭头提示。
3. 超级趋势 (SuperTrend)
经典的趋势跟踪工具,基于 ATR 和价格中位数计算。
用法:用于过滤市场噪音。当超级趋势为绿色时,建议只寻找做多机会;为红色时,建议只寻找做空机会。
高亮显示:脚本支持背景高亮,让你一目了然当前的趋势方向。
如何使用本指标进行交易
顺势交易:当 EMA 均线向上排列且 SuperTrend 显示买入信号(绿色背景)时,关注回调至 SuperTrend 支撑线或 EMA 附近的做多机会。
区间反转:当价格触及“动态顶底区间”的上沿或下沿,并且出现 SuperTrend 变色或箭头反转信号时,可考虑反向操作。
止损建议:建议将止损设置在 SuperTrend 线或动态箱体的外侧。
设置说明
你可以开启/关闭 EMA 显示。
可以自定义顶底区间的计算周期(Length)和延伸长度。
可以调整 SuperTrend 的 ATR 周期和乘数以适应不同的波动率。

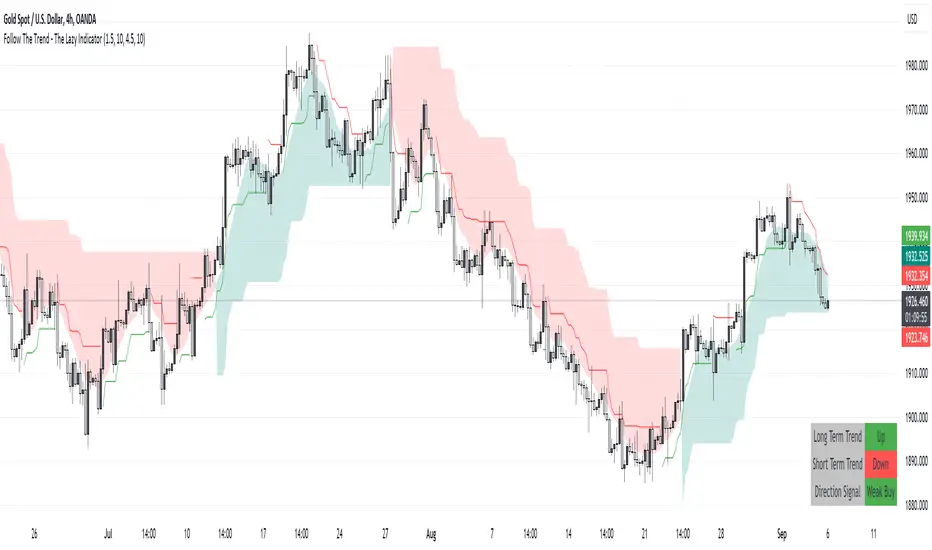
Follow The Trend - The Lazy Indicator**Understanding the 'Follow The Trend - The Lazy Indicator'**
This indicator is designed to help traders visualize the trend direction over both short-term and long-term periods. Let's dive deeper into understanding how it's designed and how it can be beneficial.
**1. How It's Designed:**
* **User Inputs:**
The first few lines ask the user for specific inputs related to the Average True Range (ATR) length and values for both short-term and long-term trends. ATR is a volatility indicator and, in this context, is used as part of the SuperTrend calculation.
* **SuperTrend Calculations:**
This indicator uses the SuperTrend, a popular trend-following indicator. Here, two SuperTrends are being calculated – one for short-term trends and another for long-term trends. The direction of the SuperTrend is also determined, signaling whether the trend is upwards or downwards.
* **Visual Representations:**
* The short-term SuperTrend is represented using green lines (for uptrend) and red lines (for downtrend).
* The indicator also provides a "cloud" between a Simple Moving Average (SMA) of the closing price (over the past 10 periods) and the long-term SuperTrend. This cloud changes color based on the direction of the long-term trend, providing another visual cue about market direction.
* **Signal Evaluation:**
This part of the code interprets the combination of short-term and long-term trends and assigns trading signals like "Strong Buy," "Weak Buy," "Strong Sell," "Weak Sell," and so on. This can act as a guide for traders, suggesting potential trading actions based on the prevailing trends.
* **Signal Coloration:**
The indicator also assigns colors to each signal. For instance, "Strong Buy" is green, "Strong Sell" is red, and there are transparency adjustments for weak signals to differentiate them from strong ones.
* **Tabular Presentation:**
At the end of the script, there’s a table displayed on the chart, summarizing the direction of both the long-term and short-term trends, as well as the overall trading signal. It provides a quick snapshot for traders to understand the current market scenario.
**2. How It May Be Helpful:**
* **Simplicity:**
The "Follow The Trend" indicator, despite its underlying complexity, is presented in a very user-friendly way. By just looking at the color cues and the table, traders can quickly understand the market's trend and potential direction.
* **Dual Trend Analysis:**
By analyzing both short-term and long-term trends, traders get a comprehensive view. This helps in understanding if the market is just having a short-term retracement (temporary reverse in direction) or if there's a genuine change in the long-term trend.
* **Adaptability:**
Traders can adjust the ATR values and lengths to customize the sensitivity of the indicator. This means it can be adapted to different assets or varying market conditions.
* **Actionable Signals:**
The signals like "Strong Buy" or "Weak Sell" are direct suggestions that can help in decision-making. Especially for beginners or those who might be overwhelmed by complex charts, such signals can be very beneficial.
* **Visual Appeal:**
The combination of trend lines, cloud coloring, and tabulated information provides a visually pleasing and easy-to-understand representation of market data. This can help reduce analysis fatigue and make chart reading more enjoyable.
In conclusion, the "Follow The Trend - The Lazy Indicator" is designed to make trend-following more accessible and actionable. By providing clear visual cues and combining short-term and long-term trend analysis, it offers traders a tool that's both comprehensive and user-friendly. Whether you're a beginner looking for clear signals or an experienced trader wanting an overview of the market trend, this indicator might be a useful addition to your toolkit.
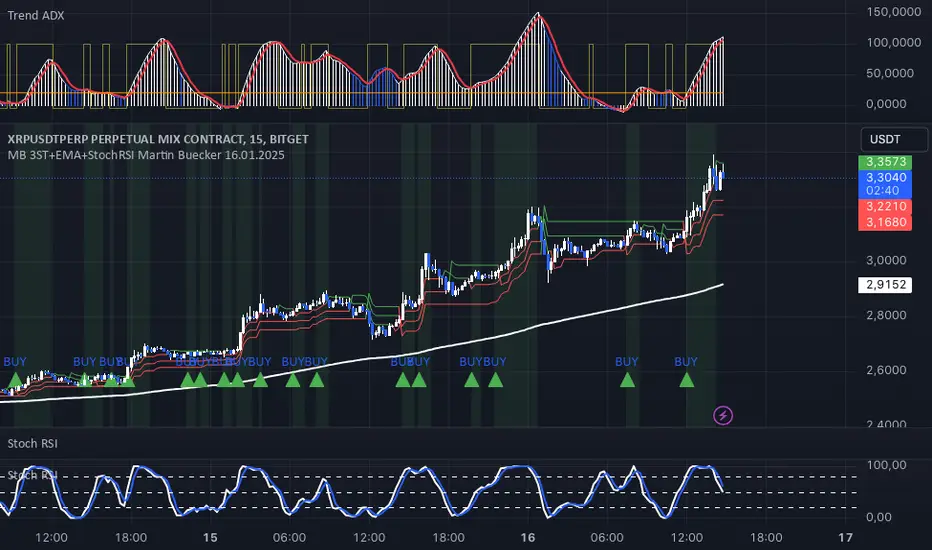
MB 3ST+EMA+StochRSI Martin Buecker 16.01.2025Short Description of the Indicator "MB 3ST+EMA+StochRSI Martin Buecker 16.01.2025"
This trend-following and momentum-based indicator combines Supertrend, EMA 200, and Stochastic RSI to generate buy and sell signals with improved accuracy.
1. Key Components
Supertrend (3 variations):
Uses three Supertrend indicators with different periods to confirm trend direction.
Buy signal when at least 2 Supertrends are bearish.
Sell signal when at least 2 Supertrends are bullish.
EMA 200 (Exponential Moving Average):
Buy signals only when the price is above EMA 200 (uptrend confirmation).
Sell signals only when the price is below EMA 200 (downtrend confirmation).
Multi-Timeframe Stochastic RSI:
Uses a higher timeframe Stoch RSI (default: 15 minutes) to filter signals.
Buy signal when %K crosses above %D (bullish momentum).
Sell signal when %K crosses below %D (bearish momentum).
2. Signal Generation
📈 Buy Signal Conditions:
✅ At least 2 of 3 Supertrends are bearish
✅ Price is above EMA 200
✅ Stoch RSI shows a bullish crossover (%K > %D)
📉 Sell Signal Conditions:
✅ At least 2 of 3 Supertrends are bullish
✅ Price is below EMA 200
✅ Stoch RSI shows a bearish crossover (%K < %D)
3. Visual Representation & Alerts
Supertrend Lines:
Green = Bullish, Red = Bearish
EMA 200: White Line
Buy/Sell Signals:
Green triangle (below bar) = Buy
Red triangle (above bar) = Sell
Alerts:
Notifies users when a buy or sell signal is triggered.
Background Coloring:
Green for Buy signals, Red for Sell signals
4. Purpose & Benefits
🔥 Combines trend (EMA 200, Supertrend) and momentum analysis (Stoch RSI) for better signal accuracy.
🔥 Works best in trending markets, filtering out false signals in sideways movements.
🔥 Suitable for scalping and day trading, providing clear and structured trade entries.
Three Bar Reversal Pattern [LuxAlgo]The Three Bar Reversal Pattern indicator identifies and highlights three bar reversal patterns on the user price chart.
The script also provides an option for incorporating various trend indicators used to filter out detected signals, allowing them to enhance their accuracy and help obtain a more comprehensive analysis.
🔶 USAGE
The script automates the detection of three-bar reversal patterns and provides a clear, visually identifiable signal for potential trend reversals.
When a reversal chart pattern is confirmed and price action aligns with the pattern, the pattern's boundaries are extended, forming levels, with the upper boundary often acting as a resistance and the lower boundary as a support.
The script allows users to filter patterns based on a specific trend direction detected by multiple trend indicators. Users can choose to view patterns that are either aligned with the detected trend or opposite to it.
Included trend indicators are: Moving Average Cloud, Supertrend, and Donchian Channels.
🔶 DETAILS
The three-bar reversal pattern is a technical analysis pattern that signals a potential reversal in the prevailing trend. The pattern consists of three consecutive bar formations:
First Bar and Second Bar: 2 consecutive of the same sentiment, representing the prevailing trend in the market.
Third Bar: Confirms the reversal by closing beyond the high or low of the first bar, signaling a potential change in market sentiment.
Various types of three-bar reversal patterns are documented. The script supports two main types:
Normal Pattern: Detects three-bar reversal patterns without requiring the third bar closing price to surpass the high (bullish pattern) or low (bearish pattern) of the first bar. It identifies basic formations signaling potential trend reversals.
Enhanced Pattern: Specifically identifies three-bar reversal patterns where the third bar closing price surpasses the high (bullish pattern) or low (bearish pattern) of the first bar. This type provides a more selective signal for stronger trend reversals.
🔶 SETTINGS
Pattern Type: Users can choose the type of 3-bar reversal patterns to detect: Normal, Enhanced, or All. "Normal" detects patterns that do not necessarily surpass the high/low of the first bar. "Enhanced" detects patterns where the third bar surpasses the high/low of the first bar. "All" detects both Normal and Enhanced patterns.
Derived Support and Resistance: Toggles the visibility of the support and resistance levels/zones.
🔹 Trend Filtering
Filtering: Allows users to filter patterns based on the trend indicators: Moving Average Cloud, Supertrend, and Donchian Channels. The "Aligned" option only detects patterns that align with the trend and conversely, the "Opposite" option detects patterns that go against the trend.
🔹 Trend Indicator Settings
Moving Average Cloud: Allows traders to choose the type of moving averages (SMA, EMA, HMA, etc.) and set the lengths for fast and slow-moving averages.
Supertrend: Options to set the ATR length and factor for Supertrend.
Donchian Channels: Option to set the length for the channel calculation.
🔶 RELATED SCRIPTS
Reversal-Candlestick-Structure .
Reversal-Signals .

[ADOL_]EasyTradingENG) EasyTrading Indicator(ET)
Introduce)
This is the result of long research and trial and error. This indicator is an indicator that marks the signal on the chart.
Short-term, mid-term, and long-term points are analyzed, and signals leading to long-term trends are marked with a background color.
Indicates oversold and overbought, and modified Ichimoku equilibrium. Indicates the criteria for the new TD.
It is the latest version of the signal indicator that complements the limitations of existing indicators.
Noise cancellation is the key to overcoming limitations.
Alerts are included in the signal notation, allowing integration with bots that utilize alerts.
So that even beginners can use it easily, we exclude miscellaneous functions and focus only on whether it is long or short.
principle)
Principle of Moving Average: Various moving averages (SMA, EMA, WMA, HMA, RMA, SWMA, VWMA) can be used. Simply using only moving averages cannot overcome the existing problems.
The problems that arise from existing signal indicators include structural problems in which entry and exit do not appear properly due to lagging and delay of indicators, and frequent overuse of RBIs.
In order to compensate for these limitations, BNF's disparate rate trading method was referred to. I did not use the existing moving average as it is, but I optimized the formula by reflecting my experience, so the existing moving average
It is characterized by the fact that it cannot be implemented according to the signal of the indicator.
The principle of oversold and overbought: implemented using RSI.
Short-term signal: The principle of the TD indicator has been utilized and modified. The setup principle of the TD indicator,
which compares the current candlestick and the four previous candlesticks and indicates numbers from 1 to 9, was modified by applying it to the moving average.
Intermediate Signal: Moving averages and Ichimoku balance have been modified. We applied the breakthrough of clouds (positive and negative) created in Ichimok balance.
Long-term signal: The principle of moving averages was used.
comparison with existing indicators)
Compared to Supertrends:
The top is the ET indicator, and the bottom is the supertrend indicator. Supertrend is set to 14,3, which is commonly used.
Looking at the background color representing the long-term signal of ET while the super trend repeatedly displays buy and sell and sees loss of intervals
ET does not see section loss as no signal appears in the middle after one entry.
The same goes for other sports.
Compared to the moving average (sma):
Even when compared to the golden cross and dead cross conditions that break through the moving average line, the moving average line accumulates losses due to frequent entries and exits in the section that moves sideways.
ET, which compensates for the limitations, continues the trend without noise.
Comparison with Ichimoku:
ET has less noise than entering a trade using Ichimoku's red cloud and green cloud.
Necessity)
In order to work with the bot, the key is to accurately implement the hitting point and remove noise. It is a basic approach to trading even if it is not linked to a bot.
In the setting of most indicators, if you increase the period, you can see the long-term trend, but the entry point is delayed, and if you decrease the period, the entry point becomes frequent and enters a place where you shouldn't enter.
ET catches the entry point and noise removal, and helps you approach the entry point correctly even if you don't trade often.
Catching the two rabbits was the most difficult. how many years...
chart)
Notation of background color:
Long-term signals are displayed in the background color so that trends can be grasped at a glance.
Long term signal:
It is indicated by an arrow on the chart.
Mid term signal:
The decline is indicated by a black gradient on the candle and a red circle above the candle.
The rise is indicated by a white gradient on the candle and a green circle below the candle.
short-term signal:
On the chart, the candlesticks are numbered from 1 to 9.
Oversold/Overbought:
Oversold conditions are indicated by yellow diamonds (◆).
Overbought is indicated by a blue diamond (◆).
Determine the TP on the first oversold or overbought bar. Split profit start.
timeframes and alerts)
It can be applied to all time frames, and the standard time at the center is 1h.
You can adjust the dot while viewing the 15-minute bar and the 1-hour bar together.
multi time frame. It is recommended to observe multiple times at the same time using the split screen.
Note)
This indicator is not a guarantee of absolute returns, and you are solely responsible for any trading decisions you make.
How to use)
It is set to be used by invited users only.
If you receive an invitation, tap Add indicator to favorites at the bottom of the indicator.
If you go to the chart screen and press the indicator at the top, there is a Favorites tab on the left tab.
Add an indicator by clicking on the indicator name in the Favorites tab (or Invite Only).
If a study error occurs when adding an indicator even though permission has been granted
You may be able to fix the problem by turning off all charts and restarting.
KOR) EasyTrading 지표(ET)
소개)
이것은 오랜 연구와 시행착오의 결과물입니다. 해당 지표는 차트에 시그널을 표기해주는 지표입니다.
단기, 중기, 장기 타점을 분석하며, 장기트렌드를 이끄는 시그널은 배경색으로 표기됩니다.
과매도와 과매수를 표시하며, 변형된 일목균형을 표시합니다. 새로운 TD의 기준을 표시합니다.
기존의 지표들이 가지는 한계를 보완한 시그널 지표의 가장 최신 버전입니다.
한계를 극복하는데는 노이즈 제거가 핵심이라고 볼 수 있습니다.
시그널 표기에는 얼러트가 포함되어, 얼러트를 활용하는 봇과 연동이 가능합니다.
초보자도 쉽게 활용할 수 있도록 잡다한 기능은 빼고, 롱이냐 숏이냐에만 집중합니다.
원리)
이동평균선의 원리 : 여러가지 이동평균선(SMA, EMA, WMA, HMA, RMA, SWMA, VWMA) 을 활용할 수 있습니다. 단순히 이동평균선만 활용하는 것으로는 기존의 문제점을 뛰어넘을 수 없습니다.
기존의 시그널 지표에서 발생하는 문제점은, 기본적으로 지표가 가지는 후행성과 지연으로 인해, 진입과 청산의 자리가 제대로 나오지 않는 구조적인 문제, 잦은 타점 남발 등이 있습니다.
이러한 한계를 보완하기 위해서 BNF의 괴리율 매매법을 참고하였습니다. 기존의 이평선을 그대로 쓰는 것이 아니라 저의 경험을 반영해 수식을 최적화하였기 때문에 기존의 이평선으로는
해당 지표의 시그널을 따라 구현할 수 없다는 것이 특징입니다.
과매도, 과매수의 원리 : RSI를 활용하여 구현하였습니다.
단기시그널 : TD 지표의 원리를 활용 및 변형하였습니다. 현재 캔들과 4개이전의 캔들을 비교해 1~9까지 숫자로 표기하는 TD 지표의 setup 원리를 이평선에 적용하여 변형하였습니다.
중기시그널 : 이평선 및 일목균형을 변형하였습니다. 일목균형에서 만들어지는 구름(양운과 음운)의 돌파를 응용하였습니다.
장기시그널 : 이평선의 원리를 활용하였습니다.
기존의 지표들과 비교)
슈퍼트렌드와 비교 :
상단은 ET지표, 하단은 슈퍼트렌드 지표입니다. 슈퍼트렌드는 일반적으로 많이 쓰는 14,3 으로 세팅하였습니다.
슈퍼트렌드가 buy와 sell을 반복적으로 띄우며 구간손실을 보는동안, ET의 장기시그널을 나타내는 배경색을 보면
ET는 한번의 진입후 중간에 시그널이 출현하지 않으면서 구간손실을 보지 않고 있습니다.
다른 종목에서도 마찬가지입니다.
이동평균선(sma)과 비교 :
이동평균선을 돌파하는 골든크로스와 데드크로스 조건과 비교해도 횡보하는 구간에서 이동평균선은 잦은 진입과 청산으로 손실을 누적하지만
한계를 보완한 ET는 노이즈 없이 추세를 이어나갑니다.
일목균형과 비교 :
일목균형의 양운과 음운을 활용하여 타점을 진입하는 것보다 노이즈가 적습니다.
필요성)
봇과 연동하기 위해서는 타점을 정확하게 구현하는 것과 노이즈의 제거가 핵심입니다. 봇과 연동하지 않더라도 매매의 기본적인 접근입니다.
대부분의 지표의 설정에서 기간을 늘리면 장기추세를 볼 수 있으나 진입점이 늦어지고, 기간을 줄이면 진입점이 잦아 들어가지 말아야 할 곳에 들어가게 됩니다.
ET는 진입점과 노이즈 제거 두마리 토끼를 잡아, 자주 매매하지 않더라도 바르게 진입점에 접근할 수 있도록 도와줍니다.
두마리 토끼를 잡는 것이 가장 어려웠습니다. 몇년의 시간..
차트로 설명)
배경색의 표기 :
장기시그널을 배경색으로 표기하여 트렌드를 한눈에 파악할 수 있도록 하였습니다.
장기시그널 :
차트상에서 화살표로 표기됩니다.
중기 시그널 :
하락은 캔들의 검정색 그라데이션과 캔들 위 빨간색 원으로 표시됩니다.
상승은 캔들의 하얀색 그라데이션과 캔들 아래 초록색 원으로 표시됩니다.
단기시그널 :
차트상에서 캔들에 1~9까지 숫자로 표시됩니다.
과매도/과매수 :
과매도는 노란색 다이아몬드(◆)로 표시됩니다.
과매수는 파란색 다이아몬드(◆)로 표시됩니다.
과매도, 과매수가 처음 발생하는 봉에서 TP를 결정합니다. 분할익절 시작.
타임프레임 및 얼러트)
모든 시간프레임에 적용 가능하며, 중심이 되는 기준시간은 1h 입니다.
15분봉과 1시간봉을 같이 보면서 타점을 조절할 수 있습니다.
멀티타임프레임. 화면분할을 활용하여 여러 시간을 동시에 관찰하는 것을 추천합니다.
참고사항)
해당지표는 절대수익을 보장하는 지표가 아니며, 귀하가 내리는 모든 거래 결정은 전적으로 귀하의 책임입니다.
사용방법 )
초대된 사용자만 사용할 수 있도록 설정이 되어있습니다.
초대를 받을 경우, 지표 하단의 즐겨찾기에 인디케이터 넣기를 누릅니다.
차트화면으로가서 상단에 지표를 눌러 왼쪽탭에 보면 즐겨찾기 탭이 있습니다.
즐겨찾기 탭 (또는, 인바이트 온리) 에서 지표이름을 눌러서 지표를 추가합니다.
권한이 부여됐음에도 지표추가시 study error가 발생할 경우
차트를 모두 끄고 재시작함으로써 문제점을 해결할 수 있습니다.

Dammu AI PROType & Purpose
Multi-functional trend, swing, and smart money concept indicator.
Combines SuperTrend, SMA, ATR-based risk management, swing structures, order blocks, EQH/EQL, and Fair Value Gaps (FVG).
Designed for identifying trends, entries/exits, and support/resistance zones.
2. Trend Detection
SuperTrend with ATR smoothing (nsensitivity*7 factor) for buy/sell signals.
SMA filter (8 & 9 periods) confirms trend strength.
Bar color changes:
Green if close > supertrend.
Red if close < supertrend.
Cirrus Cloud highlights trend zones with semi-transparent colors.
3. Swing & Structure
Detects pivot highs/lows and labels them as HH/LH (Highs), HL/LL (Lows).
Generates BOS (Break of Structure) and CHoCH (Change of Character) signals.
Internal swing structures and order blocks for short-term intraday moves.
4. Order Blocks
Internal Order Blocks (iOBs) and Swing Order Blocks (OBs).
Boxes drawn for bullish/bearish zones.
Auto-delete when broken.
Option to filter blocks by ATR or Cumulative Mean Range.
5. Risk Management
TP/SL levels based on ATR and user-defined % risk.
Shows lines and labels for:
Entry
Stop Loss
TP1, TP2, TP3
Adjustable line style (solid/dashed/dotted).
6. Fair Value Gaps (FVG)
Highlights bullish and bearish gaps.
Option for auto-threshold filtering.
Extendable FVG boxes.
7. EQH/EQL
Detects Equal Highs (EQH) and Equal Lows (EQL) for potential reversals.
Dotted lines with labels.
8. Smart Money Concepts (SMC) Features
Shows:
Swings (internal & swing structure)
Internal order blocks
Premium/Discount zones
Fair Value Gaps
Highs/Lows from previous day/week/month
Configurable for historical vs present display.
9. Alerts
Buy/Sell triggers:
bull = crossover of close above SuperTrend.
bear = crossunder of close below SuperTrend.
Alerts for BOS/CHoCH, EQH/EQL, and OB breaks.
10. Visualization
Trend clouds, colored bars, SMA markers, SuperTrend labels.
Multi-layered info displayed without cluttering the chart.
Customizable colors, line styles, and transparency.
✅ Summary:
This indicator is a comprehensive trading tool for trend detection, swing structure, order block analysis, and risk management. It’s built for smart money and SMC-based trading, offering visual cues and alerts for key trading decisions.

Trend Direction & Levels IdentifierOverview : Trend Direction & Levels Identifier (TDLI) provides you with two lines - Resistance/Support line (RSLine) and Trend Line. These two lines form a channel which is filled with a colour showing current market direction, which also prints Bullish or Bearish text. Trend Line calculation is similar but follows different approach than Super Trend indicator. RSLine calculation is done using EMA and dynamic ATR.
How does this work?
Firstly understand Supertrend - The Supertrend indicator is a freely available technical analysis tool that helps traders identify the direction of the trend . It is based on the concept of volatility, and it provides a simple way to identify whether the current market trend is bullish or bearish.
Here's a basic explanation of the Supertrend indicator's logic and how it is commonly used:
Supertrend Indicator Logic:
Calculation of Average True Range (ATR) : The first step involves calculating the Average True Range (ATR) over a specified period. ATR measures market volatility by considering the average range between the high and low prices over a given number of periods.
Multiplier Factor : A multiplier factor is then applied to the ATR. The multiplier is usually set by the trader or analyst and determines the sensitivity of the Supertrend to changes in volatility.
Calculation of Upper and Lower Bands:The Supertrend indicator calculates two bands - an upper band and a lower band.
Upper Band (UB) = High price - (Multiplier * ATR)
Lower Band (LB) = Low price + (Multiplier * ATR)
Determining Trend Direction : If the current market price is above the Upper Band, the Supertrend suggests a bearish trend (sell signal). If the current market price is below the Lower Band, the Supertrend suggests a bullish trend (buy signal).
Now, Let's understand how we use this logic with some modification to build our Trend line -
Let's break down the key differences:
1. Calculation of Trend Switch Points:
- Supertrend: The Supertrend indicator primarily relies on the Average True Range (ATR) to calculate the volatility of the market. It then determines trend direction based on whether the closing price is above or below the Supertrend line.
- Our Trend: We use a modified ATR for volatility measurement (ATR / x), our code introduces modifications in the calculation of trend switch points. It incorporates moving averages (SMA - Simple Moving Averages) to define high and low prices, adding a dynamic element to the identification of trend reversal points.
2. Trend States and Switch Logic:
- Supertrend: The Supertrend generally has two states: uptrend or downtrend. It switches its state when the closing price crosses the Supertrend line.
- Our Trend: Our code introduces an additional variable, which is not binary (0 or 1) but rather represents the state of the trend (0 for uptrend, 1 for downtrend). The indicator uses a more complex logic involving previous trend states and moving averages to determine trend switches.
So, our trend line incorporates additional elements such as moving averages, dynamic amplitude, and channel deviation to modify the Supertrend logic and provide a more nuanced and visually informative representation of market trends. These modifications offer traders more flexibility in adapting the indicator to different market conditions and trading preferences.
Remember the underlying logic is of Supertrend which is freely available to all.
Another line is RSLine, lets dive into its logic and calculation -
Average True Range (ATR) Calculation : Calculates the Average True Range, a measure of market volatility. The ATR can be dynamically adjusted based on user preference.
Chande Momentum Oscillator (CMO) and Variable (VAR) Calculation : Calculates the CMO, which measures momentum, and uses it to compute the VAR value. This introduces an adaptive element to the indicator.
Other Moving Averages : Calculates various moving averages, including Wilder's Moving Average (WWMA), Zero-Lag Exponential Moving Average (ZLEMA), and Time Series Forecast (TSF), providing different perspectives on trend direction.
Main Moving Average (MAvg) Calculation : Computes the main moving average based on EMA and length.
Stop Level Calculation : Determines stop levels for both long and short positions. The levels are influenced by the moving average (MAvg) and ATR, with an option to normalize them.
The Stop Levels forms the RSLine which acts as either resistance or support based on market direction.
Lets see how the indicator tells you probable market direction -
Direction Identification : Identifies the current trend direction (uptrend or downtrend) based on the relationship between the moving average and the previous stop level. It also prints Bullish or Bearish on chart based on crossovers and crossunders between the Trend Line and the RSLine.
Fill Coloring for Highlighting : It Fills the area between the Trend Line and RSLine with either green or red color to visually emphasize the trend direction. The colors change based on whether the Trend Line and MAvg is above or below the stop levels.
So there are 3 major things -
1. RSLine - Uses EMA and dynamic ATR to calculate stop levels. This acts as support or resistance to current trend. It is always red in colour.
2. Trend Line - Unlike Super Trend this Trend Line calculation uses a combination of highest high, lowest low, and EMA of a fixed range of candles to determine trend changes. It uses a fixed amplitude for calculating the highest high, lowest low, and EMA values, but it doesn't incorporate dynamic volatility adjustments like ATR. Its colour varies from red to green based on calculation.
3. Channel Colour - Channel colour is decided based on crossover of Trend Line and RSLine, if Trend Line crosses RSLine from bottom then channel colour becomes green, similarly red colour is calculated.
How to use this?
Refer this snapshot for content below -
1. Once a crossover happens between Trend Line and RSLine, bullish / bearish text is printed with change in colour of channel. RSLine acts as support/resistance.
2. Look for colour of Trend Line - when it matches channel colour, it means favourable direction is that colour (green - long, red - short)
3. Remember any ongoing trend can reverse any second, so follow price action for better results.
Preferred Timeframe : It works best in 5 minute timeframe, but can also be used in other time frames.
Reason to use these two lines ?
The Trend Line tells current trend direction using a line which keeps changing colours, for double confirmation we use the RSline and channel colour which is calculated using Trend line and RSLine crossover. When both Trend line and RSLine channel colour is same that gives a more solid confirmation (not 100%) of a trend
Why it is worth paying for :
As mentioned earlier this indicator is built over freely available Supertrend and EMA indicators. The modifications which we have done for better calculation and visualisation makes it worth.
The indicator may be considered valuable for traders who appreciate a visual representation of market trend direction and important stop levels. Normal indicators like supertrend just shows a line which gives you idea about the trend but our indicator apart from telling trend direction tells important levels and provide a channel filled with current trend direction significance which helps in following trend precisely.
1. The customization options and visual clarity could enhance decision-making for those who prefer a more tailored approach.
2. Traders willing to pay for this indicator may find it useful in complementing their existing analysis and strategy.
Although one should understand using premium indicator doesnt mean it will generate magic results, if you know price action and risk management properly then only consider trying our indicator else practice trading on free indicators first.
IMPORTANT : As Stock markets are dynamic in nature, no indicator is a magic indicator which will give you 100% accurate results on one click. You still have to use price action for best results.
DISCLAIMER : This indicator isn't a get rich quick scheme, neither it can provide 100% accurate results. It is meant to be used as an aid to Price Action Trading and proper risk management.
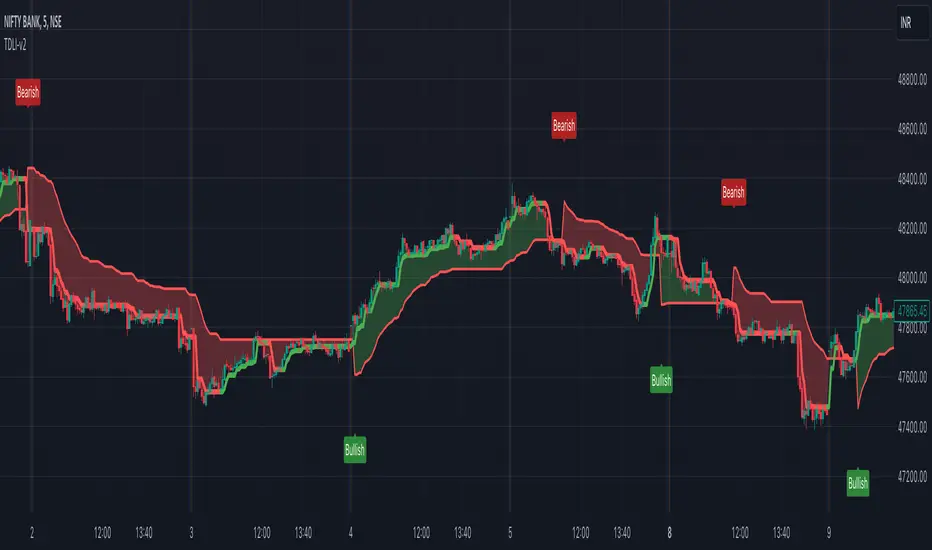
Dammu AI ADVANCED PRO1. Indicator Overview
Name: Dammu
Type: Overlay indicator (draws on price chart)
Purpose: Combines SuperTrend, SMA/EMA trends, Swing/Structure analysis, Order Blocks, Fair Value Gaps, High/Low levels, TP/SL labels, and alerts.
Pine Script Version: v5
2. SuperTrend Module
Computes SuperTrend line using ATR and sensitivity.
Signals:
Bullish: Price crosses above SuperTrend.
Bearish: Price crosses below SuperTrend.
Plots buy/sell labels 🚀🐻 based on SMA comparison and SuperTrend cross.
3. SMA/EMA Trend Components
SMA8 & SMA9: Used for additional trend confirmation.
EMA lines: Multiple EMAs with different multipliers for trend detection.
Trend Cloud: Uses Hull MA for trend smoothing.
4. Risk Management
TP/SL Levels: Automatic calculation of stop-loss and take-profit (TP1, TP2, TP3).
Configurable ATR-based risk percentage.
Lines and labels drawn for visual TP/SL.
5. Chart Features
Smooth Range Filter: Filters noise for trend detection.
Colored Trend Cloud: Upward trend = cyan, downward = red.
Sideways Market: ADX filter to color bars purple if trend is weak/sideways.
Bar Colors: Green/red based on SuperTrend signals.
6. Swing & Structure Analysis
Detects Swing Highs/Lows, labels as HH, LH, LL, HL.
Detects CHoCH (Change of Character) or BOS (Break of Structure).
Can show internal or swing structures with configurable label size and color.
7. Order Blocks (Smart Money Concepts)
Detects Internal Order Blocks (iOB) and Swing Order Blocks (OB).
Stores top/bottom/left/time/type in arrays.
Colors and shows boxes based on bullish/bearish type.
Automatically deletes OB if price breaks the block.
8. Fair Value Gaps (FVG)
Identifies gaps between candles as potential trading zones.
Configurable bullish/bearish colors and extension bars.
9. EQH/EQL (Equal Highs/Lows)
Detects equal highs/lows using a threshold.
Plots dotted lines and labels EQH/EQL.
10. High/Low Levels MTF
Optional plotting of previous daily, weekly, monthly highs/lows.
11. Premium/Discount Zones
Plots Premium, Discount, and Equilibrium Zones.
Colors: Premium = red, Discount = green, Equilibrium = gray.
12. Alerts
Buy/Sell alerts for:
SuperTrend crossover
BOS/CHoCH (swing/internal)
EQH/EQL triggers
13. Miscellaneous
Configurable visuals: line style, label size, transparency.
Adjustable volatility filters, ATR lengths, smoothing constants.
Integrated risk & reward visualization.
✅ In short:
This is an all-in-one Smart Money + Trend indicator with SuperTrend signals, swing/structure detection, order blocks, FVGs, EQH/EQL, TP/SL visualization, and optional alerts. It’s designed for both trend-following and order-block-based trading.
If you want, I can make a super-short 1-paragraph version that summarizes it even faster for quick reference.

Trend, Momentum and Price value analysis [deepakks444]Trend, Momentum, and Price Value Analysis
This indicator combines several key technical analysis tools to help traders evaluate the market's trend strength, momentum, and overall price behavior. It uses a variety of signals to generate a "Buy," "Sell," or "No Clear Indication" based on multiple indicators and plots them directly on the chart. A customizable table also summarizes these signals, making it easy to interpret the market conditions in real-time.
Key Features:
VWAP (Volume-Weighted Average Price): Indicates whether the price is above or below the VWAP line, helping to identify buying or selling opportunities based on fair value.
Alligator Indicator: Utilizes three simple moving averages (SMAs) to track trend direction, providing a clear "Buy" or "Sell" signal when the averages are aligned.
Supertrend: A widely-used trend-following indicator, this script identifies potential buy or sell zones based on the price's relationship with the Supertrend line.
20-period Moving Average (MA): A simple moving average to track the overall trend direction. The signal is based on the price crossing above or below the MA.
ADX (Average Directional Index): Measures the strength of the trend. A reading above 25 indicates a "Buy" signal, while a reading below suggests a "Sell."
RSI (Relative Strength Index): Generates a buy signal when RSI exceeds 60 and a sell signal when it drops below 40. Values between 40 and 60 indicate a neutral condition.
MACD (Moving Average Convergence Divergence): Provides a signal for buying when the MACD line crosses above the signal line, and selling when it crosses below.
Volume Signal: Compares current volume against the 20-period moving average to identify significant volume spikes. This helps in determining if the market is supported by strong volume.
Customization Options:
Moving Average Length: Customize the 20-period MA length to better fit your trading style or the asset you’re analyzing.
Supertrend Settings: Adjust the Supertrend factor and ATR period for different timeframes or volatility environments.
Table Position: Customize where the signal table is displayed on the chart (Top Right, Top Left, Bottom Right, or Bottom Left).
Table Appearance: Set the table background color and choose between small or tiny text size for better readability.
Signal Summary:
The indicator computes a combined signal based on the number of "Buy" or "Sell" signals from the individual indicators. If 5 or more indicators suggest a "Buy" or "Sell," the table will display a combined signal for easier decision-making. This feature consolidates the signals into one straightforward output, helping you filter noise and act on clear trends.
Table Display:
The customizable table organizes the signals of the key indicators, showing:
Indicator: Lists all the indicators in use, such as VWAP, Alligator, Supertrend, etc.
Signal: Displays "Buy," "Sell," or "Neutral" for each indicator based on the current market conditions.
Intended Use:
This script is designed to help traders monitor multiple technical indicators at once, giving them a clearer view of the market’s trend strength, momentum, and volatility. While it simplifies the process of interpreting various signals, users should use it in combination with their own research and risk management strategies.
Disclaimer: This script is for educational purposes only and should not be considered financial advice. All trading involves risk, and the performance of an indicator in the past does not guarantee future results. Always perform due diligence and use proper risk management techniques.
3 days ago
Release Notes
A "Buy" triangle is plotted below the bar if the signal changes to "Buy".
A "Sell" triangle is plotted above the bar if the signal changes to "Sell".
Script Name: Trend, Momentum, and Price Value Analysis
The Trend, Momentum, and Price Value Analysis script provides a multi-faceted approach to market analysis, combining several technical indicators into a single tool. This script offers an easy-to-interpret table summarizing various indicator signals, along with visual buy/sell signals on the chart.
Key Features:
VWAP (Volume Weighted Average Price):
The VWAP provides insights into whether the current price is above or below the average weighted price, helping traders identify potential buy or sell opportunities.
Alligator Indicator (Simplified):
Using three simple moving averages (SMAs), this tool helps identify the beginning of trends and potential buy/sell zones based on the Alligator jaw, teeth, and lips.
Supertrend:
A trend-following indicator that determines whether the market is in a bullish or bearish phase based on ATR and factor inputs. The Supertrend line is plotted on the chart.
20-period Moving Average (MA):
A basic moving average that assists in gauging price direction and the overall trend.
ADX (Average Directional Index):
Helps identify the strength of a trend. A value above 25 indicates a strong trend.
RSI (Relative Strength Index):
Measures momentum by identifying overbought and oversold conditions. A signal is triggered when RSI is above 60 (buy) or below 40 (sell).
MACD (Moving Average Convergence Divergence):
A momentum indicator that provides signals when the MACD line crosses the signal line.
Volume Signal:
Compares the current volume with a 20-period average to determine if volume supports the current trend direction.
Signal Table:
A table is generated on the chart, displaying real-time signals from each of the above indicators. The table is customizable with background colors and text sizes.
The position of the table can be set to any corner of the chart for convenience.
Combined Signal Logic:
The script calculates a Combined Signal based on the majority of buy or sell signals across all the indicators. If 5 or more indicators give a buy or sell signal, a combined signal is generated.
Buy/Sell Signal Plots:
The script plots buy (green triangle) and sell (red triangle) signals on the chart based on the combined signal when transitioning from a previous opposite signal.
Customizable Inputs:
Users can customize the length of the moving averages, adjust the background and text colors of the table, and choose the position of the table on the chart.
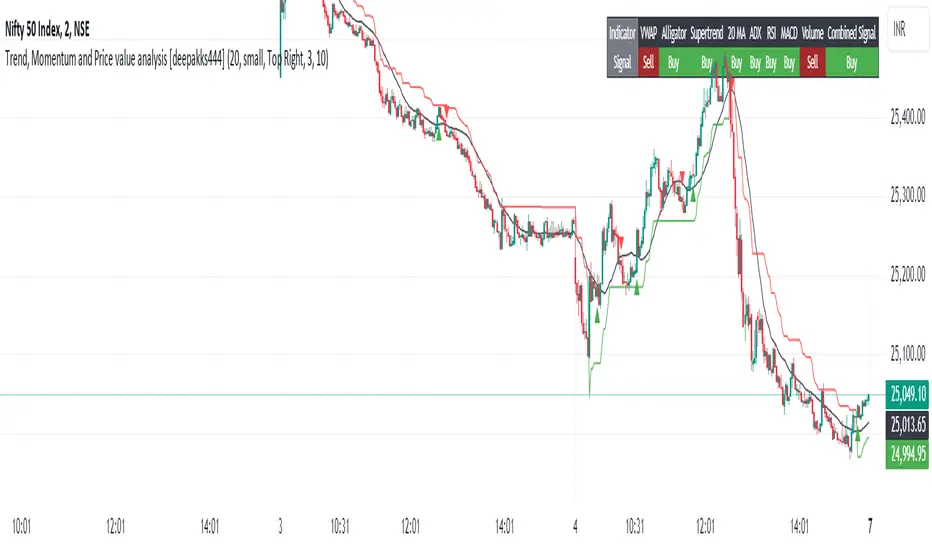
Fibonacci Levels on Any Indicator [By MUQWISHI]▋ INTRODUCTION :
A “Fibonacci Levels on Any Indicator” can be applied to any indicator to draw Fibonacci levels based on provided conditions of two price points to produce a sequence of horizontal line levels starting from 0% to 100% in addition to extension levels. The 0% level is measured as the start of retracement, while the 100% level is the beginning of the extension levels. This tool was developed to be easy to add to any indicator, and it could be valuable to some traders in terms of managing trades by setting targets and reducing risk in the trend direction.
_______________________
▋ USAGE:
➤ NEEDS TO IDENTIFY 4 ELEMENTS:
1. Starting Point. What’re the conditions / When will the drawing of the Fibonacci levels begin?
2. Ending Point. What’re the conditions / When will the drawing of the Fibonacci levels end?
3. High Point. What is the price for a 100% Fibonacci level (0% for the downside)?
4. Low Point. What is the price for a 0% Fibonacci level (100% for the downside)?
➤ STARTING & ENDING POINTS CONDITIONS:
Need to specify the condition when the drawing of Fibonacci levels starts and ends, and the indicator shows different prepared conditions.
New Phase: Import a value (plot) from an existing indicator, where its status changes from NaN to a real number.
Crosses Above/Below: Import a value(1) (plot) from an existing indicator, where it crosses above/below value(2).
Reversal Up/Down: Import a value(1) (plot) from an existing indicator, where it rises/decreases than the previous value(1).
First/Last Bar: Useful to draw stationary Fibonacci levels.
➤ UPPER & LOWER PIVOTS (0% & 100%):
Need to specify the two price points representing 0% & 100% Fibonacci levels to expose the sequence of Fibonacci lines.
Upper Pivot. By default, the ATR Upper Band. It’s possible to import a custom value from an existing indicator.
Lower Pivot. By default, the ATR Lower Band. It’s possible to import a custom value from an existing indicator.
➤ FIBONACCI STYLING OPTIONS:
Ability to customize line & label style, color, reverse, and hide/show levels.
_______________________
▋ IMPLEMENTATION:
Here are some examples of implementing the indicator.
Note: All presented examples below are for demonstration purposes, and they're not trading suggestions.
# Example 1: (Reversal Up/Down)
We want to implement Fibonacci levels on the Hull MA by mohamed982 . Our requirements are as follows:
Fibonacci levels start when the Hull MA reverses up.
Fibonacci levels end when the Hull MA reverses down.
Upper Pivot is the ATR Upper Band.
Lower Pivot is the ATR Lower Band.
After adding the required indicator (Hull MA), here’re the implementation and results
# Example 2: (Crosses Above/Below)
We want to implement Fibonacci Level on the Squeeze Momentum by LazyBear . Our requirements are as follows:
Fibonacci levels start when the Squeeze Momentum histogram crosses above 0.
Fibonacci levels end when the Squeeze Momentum histogram crosses below 0.
Upper Pivot is the Bollinger Upper Band.
Lower Pivot is the Bollinger Lower Band.
After adding the required indicators (Squeeze Momentum & Bollinger Band), here’re the implementation and results
# Example 3: (Crosses Above/Below)
We want to implement Fibonacci Level on the Crossing Moving Averages. Our requirements are as follows:
Fibonacci levels start when the 20-EMA crosses above 100-MA.
Fibonacci levels end when the 20-EMA crosses below 100-MA.
Upper Pivot is the ATR Upper Band.
Lower Pivot is the ATR Lower Band.
After adding the required indicators (20-EMA & 100-MA), here’re the implementation and results
# Example 4: (New Phase: When the previous value is NaN, and the current value is a real number.)
We want to implement Fibonacci Level on the Supertrend. Our requirements are as follows:
Fibonacci levels start when an up-Supertrend (green) line shows up.
Fibonacci levels end when a down-Supertrend (red) line shows up.
Upper Pivot is the down-Supertrend.
Lower Pivot is the up-Supertrend.
After adding the required indicator (Supertrend), here’re the implementation and results
# Example 5: (First/Last Bar)
We want to implement Fibonacci Level between two points, 330 & 300. Our requirements are as follows:
Fibonacci levels start at first bar on the chart.
Fibonacci levels end at last bar on the chart.
Upper Pivot is 330.
Lower Pivot is 300.
Here’re the implementation and results.
To customize the number of bars back (like 50 bars)
_______________________
▋ Final Comments:
The “Fibonacci Levels on Any Indicator” is made to apply on other indicators for planning Fibonacci Levels.
It can be implemented in different ways, along with presented examples.
This indicator does not work with plots that were developed by drawing classes.
Please let me know if you have any questions.
Thank you.

VANILLA BUY SELLThis script uses three components:-
USEFUL MA by @ALEXGROVER
SUPERTREND INDICATOR(3 supertrend with different ATR and multiplier) provided by tradingview.
VIX FEAR GAUGE by @bizkitbr
To make it easy and line free, supertrend lines have been removed but the color fill has been kept. This makes the chart clean.
For option traders, direction and momentum is everything. Hence, two need to be really clear:-
a) BUY OR SELL
b) Whether momentum exists of not
While rise is charecterised by a steady pace, a fall is charecterized by a rapid decline.
So in order to make the best use of of the charecters, a careful interpretation and backtesting has been done to enable buy sell only when vix conditions are met.
BUY SIGNAL
A buy signal is generated on following conditions:-
a)PRICE CLOSE ABOVE USEFUL MA
B)ALL THREE SUPERTRENDS ARE GREEN
C)VIXFIX IS BELOW 0.18.
SELL SIGNAL
This is generated when following is met:-
A) PRICE BELOW USEFUL MA
B)ALL THREE SUPERTRENDS ARE RED
C)VIXFIX IS ABOBE 0.18
ADDITIONALLY, A SMALL BACKGROUND COLOR CHANGE PROVIDED FOR AREAS WHERE THERE IS A BUY OR SELL.
Either labels can be used or background colours referred for seeing buy or sell.