Alxuse Supertrend 4EMA Buy and Sell for tutorialAll abilities of Supertrend, moreover :
Drawing 4 EMA band & the ability to change values, change colors, turn on/off show.
Sends Signal Sell and Buy in multi timeframe.
The ability used in the alert section and create customized alerts.
To receive valid alerts the replay section , the timeframe of the chart must be the same as the timeframe of the indicator.
Supertrend with a simple EMA Filter can improve the performance of the signals during a strong trend.
For detecting the continuation of the downward and upward trend we can use 4 EMA colors.
In the upward trend , the EMA lines are in order of green, blue, red, yellow from bottom to top.
In the downward trend, the EMA lines are in order of yellow, red, blue, green from bottom to top.
How it works:
x1 = MA1 < MA2 and MA2 < MA3 and MA3 < MA4 and ta.crossunder(MA3, MA4)
x2 = MA1 < MA2 and MA2 < MA3 and MA3 < MA4 and ta.crossunder(MA2, MA3)
x3 = MA1 < MA2 and MA2 < MA3 and MA3 < MA4 and ta.crossunder(MA1, MA2)
y1 = MA4 < MA3 and MA3 < MA2 and MA2 < MA1 and ta.crossover(MA3, MA4)
y2 = MA4 < MA3 and MA3 < MA2 and MA2 < MA1 and ta.crossover(MA2, MA3)
y3 = MA4 < MA3 and MA3 < MA2 and MA2 < MA1 and ta.crossover(MA1, MA2)
Red triangle = x1 or x2 or x3
Green triangle = y1 or y2 or y3
Long = BUY signal and followed by a Green triangle
Exit Long = SELL signal
Short = SELL signal and followed by a Red triangle
Exit Short = BUY signal
It is also possible to get help from the Stochastic RSI and MACD indicators for confirmation.
For receiving a signal with these two conditions or more conditions, i am making a video tutorial that I will release soon.
Supertrend
Definition
Supertrend is a trend-following indicator based on Average True Range (ATR). The calculation of its single line combines trend detection and volatility. It can be used to detect changes in trend direction and to position stops.
The basics
The Supertrend is a trend-following indicator. It is overlaid on the main chart and their plots indicate the current trend. A Supertrend can be used with varying periods (daily, weekly, intraday etc.) and on varying instruments.
The Supertrend has several inputs that you can adjust to match your trading strategy. Adjusting these settings allows you to make the indicator more or less sensitive to price changes.
For the Supertrend inputs, you can adjust atrLength and multiplier:
the atrLength setting is the lookback length for the ATR calculation;
multiplier is what the ATR is multiplied by to offset the bands from price.
When the price falls below the indicator curve, it turns red and indicates a downtrend. Conversely, when the price rises above the curve, the indicator turns green and indicates an uptrend. After each close above or below Supertrend, a new trend appears.
Summary
The Supertrend helps you make the right trading decisions. However, there are times when it generates false signals. Therefore, it is best to use the right combination of several indicators. Like any other indicator, Supertrend works best when used with other indicators such as MACD, Parabolic SAR, or RSI.
Exponential Moving Average
Definition
The Exponential Moving Average (EMA) is a specific type of moving average that points towards the importance of the most recent data and information from the market. The Exponential Moving Average is just like it’s name says - it’s exponential, weighting the most recent prices more than the less recent prices. The EMA can be compared and contrasted with the simple moving average.
Similar to other moving averages, the EMA is a technical indicator that produces buy and sell signals based on data that shows evidence of divergence and crossovers from general and historical averages. Additionally, the EMA tries to amplify the importance that the most recent data points play in a calculation.
It is common to use more than one EMA length at once, to provide more in-depth and focused data. For example, by choosing 10-day and 200-day moving averages, a trader is able to determine more from the results in a long-term trade, than a trader who is only analyzing one EMA length.
It’s best to use the EMA when for trending markets, as it shows uptrends and downtrends when a market is strong and weak, respectively. An experienced trader will know to look both at the line the EMA projects, as well as the rate of change that comes from each bar as it moves to the next data point. Analyzing these points and data streams correctly will help the trader determine when they should buy, sell, or switch investments from bearish to bullish or vice versa.
Short-term averages, on the other hand, is a different story when analyzing Exponential Moving Average data. It is most common for traders to quote and utilize 12- and 26-day EMAs in the short-term. This is because they are used to create specific indicators. Look into Moving Average Convergence Divergence (MACD) for more information. Similarly, the 50- and 200-day moving averages are most common for analyzing long-term trends.
Moving averages can be very useful for traders using technical analysis for profit. It is important to identify and realize, however, their shortcomings, as all moving averages tend to suffer from recurring lag. It is difficult to modify the moving average to work in your favor at times, often having the preferred time to enter or exit the market pass before the moving average even shows changes in the trend or price movement for that matter.
All of this is true, however, the EMA strives to make this easier for traders. The EMA is unique because it places more emphasis on the most recent data. Therefore, price movement and trend reversals or changes are closely monitored, allowing for the EMA to react quicker than other moving averages.
Limitations
Although using the Exponential Moving Average has a lot of advantages when analyzing market trends, it is also uncertain whether or not the use of most recent data points truly affects technical and market analysis. In addition, the EMA relies on historical data as its basis for operating and because news, events, and other information can change rapidly the indicator can misinterpret this information by weighting the current prices higher than when the event actually occurred.
Summary
The Exponential Moving Average (EMA) is a moving average and technical indicator that reflects and projects the most recent data and information from the market to a trader and relies on a base of historical data. It is one of many different types of moving averages and has an easily calculable formula.
The added features to the indicator are made for training, it is advisable to use it with caution in tradings.
"supertrend" için komut dosyalarını ara

Trailing Stop Loss SuperTrendThe Trailing Stop Loss SuperTrend indicator is a popular technical analysis tool used by traders to identify trends and determine optimal entry and exit points in financial markets. This indicator combines elements of the SuperTrend indicator and trailing stop loss orders to provide valuable insights into market trends and potential reversals. By incorporating Average True Range (ATR) calculations, it adapts to market volatility, making it suitable for various trading strategies. Let's explore the key use cases and benefits of the Trailing Stop Loss SuperTrend indicator:
Trend Identification:
The primary purpose of the Trailing Stop Loss SuperTrend indicator is to identify market trends. It plots two lines on the chart: an upper band (referred to as the "up" line) and a lower band (referred to as the "dn" line). The direction of these bands helps traders determine the prevailing trend. When the price is above the upper band, it suggests a bullish trend, and when it is below the lower band, it indicates a bearish trend.
Entry and Exit Signals:
The Trailing Stop Loss SuperTrend indicator generates entry and exit signals based on trend changes. When the trend changes from bearish to bullish, a buy signal is triggered, indicating a potential entry point. Conversely, when the trend changes from bullish to bearish, a sell signal is generated, suggesting a possible exit or short-selling opportunity. These signals can be used in conjunction with other trading strategies or indicators to enhance trading decisions.
Trailing Stop Loss Orders:
One of the distinguishing features of the Trailing Stop Loss SuperTrend indicator is its ability to incorporate trailing stop loss orders. Traders can use the indicator's upper and lower bands as trailing stop levels to protect profits and manage risk. For example, in a bullish trend, the stop loss level can be set at the lower band, and as the price rises, the stop loss level trails along with it, locking in profits and reducing potential losses.
Volatility Adaptation:
By incorporating the ATR (Average True Range) calculation, the Trailing Stop Loss SuperTrend indicator adjusts its sensitivity to market volatility. A higher ATR multiplier widens the distance between the price and the bands, accommodating higher volatility, while a lower multiplier tightens the bands during periods of lower volatility. This adaptability makes the indicator versatile and suitable for various market conditions.
Alerts and Notifications:
The Trailing Stop Loss SuperTrend indicator provides the ability to set alerts for specific events, such as trend changes, buy signals, and sell signals. Traders can receive real-time notifications via email, SMS, or on-platform alerts, ensuring they stay informed about potential trading opportunities and important market developments.
Conclusion:
The Trailing Stop Loss SuperTrend indicator is a valuable tool for traders seeking to identify trends, generate entry and exit signals, and effectively manage risk. Its ability to adapt to market volatility and incorporate trailing stop loss orders enhances trading strategies and decision-making. By combining the SuperTrend concept with trailing stop loss functionality, this indicator provides traders with a comprehensive approach to trend analysis and risk management. Whether used in isolation or in conjunction with other indicators, the Trailing Stop Loss SuperTrend indicator offers a powerful tool for navigating the dynamic world of financial markets.

TASC 2023.07 Keeping With The Larger Trend█ OVERVIEW
TASC's July 2023 edition of Traders' Tips features an article by Barbara Star titled "Stay On Track With The Supertrend Indicator". The article explores how the supertrend indicator , whether used as a standalone tool or in conjunction with other indicators, can assist traders in aligning with the larger trend. Drawing inspiration from the article, this script enhances the supertrend indicator with additional visual and analytical features, making it easier to analyze the readings and make informed trading decisions.
█ CONCEPTS
Over the past few years, the supertrend indicator has gained significant popularity among traders. Unlike moving averages, it incorporates both price and volatility information, enabling traders to navigate upward or downward trends despite occasional price disruptions.
When using the supertrend indicator, a trader may consider entering a long position when the price surpasses the supertrend line or retraces to it after the initial crossover. Similarly, for short positions, a trader could enter when the price drops below the supertrend line or retests it. Exiting these positions can be triggered by the opposite scenario, such as a price drop below the supertrend line for long positions or a price rise above the supertrend line for short positions. To assist in monitoring the distance between the price and the indicator line, this script introduces the following display features:
Breach levels, representing fractions of the most recent maximum distance.
On-chart signals indicating crossings of the highest and lowest breach levels.
An infobox displaying the average value of the maximum distance.
█ CALCULATIONS
For calculating the supertrend line, this script uses the built-in function ta.supertrend() . Additionally, the script showcases the use of state-of-the-art PineScript® functionality, including methods and tables .
Median TR SuperTrend | RakoQuantMedian TR SuperTrend | RakoQuant
A Robust Trend-Following Regime Indicator for Daily Crypto Markets
The Median TR SuperTrend is a modern trend-following indicator designed to help students and traders clearly identify the dominant market regime on higher timeframes (especially 1D crypto).
This tool is inspired by the classic SuperTrend framework, but enhanced with a more robust volatility engine, making it better suited for the extreme wick behavior and noise typical in cryptocurrency markets.
What This Indicator Does:
The Median TR SuperTrend answers one simple question:
Are we currently in a bullish trend regime or a bearish trend regime?
It is not meant for rapid scalping or frequent signals.
Instead, it is built to provide:
Clear directional context
Trend continuation bias
Regime-based positioning
Noise reduction on higher timeframes
This makes it ideal for students learning disciplined trend-following.
Core Concept: Trend Following, Not Prediction
This indicator does not attempt to predict tops or bottoms.
It follows trends by reacting only when price establishes a true breakout beyond a volatility-adjusted band.
That means:
Strong trends are captured early
Choppy markets are filtered
Signals are based on regime shifts, not candle-to-candle noise
What Makes It “Robust”?
Traditional SuperTrend systems use ATR (Average True Range) to define volatility.
Crypto markets, however, often produce outlier candles (wicks, liquidations, spikes) that distort ATR.
This version replaces ATR with:
Median True Range (MTR)
Median TR is more resistant to extreme one-off candles, providing:
Smoother volatility estimates
More stable trend bands
Less sensitivity to random spikes
This creates a more reliable trend structure in high-volatility environments.
How It Works (Simple Breakdown)
1. Median Baseline
The indicator begins by calculating a rolling median of price, forming a stable central trend reference.
2. Robust Volatility Bands
A volatility envelope is created using Median True Range:
Upper band = baseline + multiplier × MTR
Lower band = baseline − multiplier × MTR
3. SuperTrend Regime Logic
Only one band is active at a time:
Bull regime → trailing lower band
Bear regime → trailing upper band
Trend flips occur only when price breaks beyond the active band.
Visual Interpretation
Neon Aqua Band
Bullish regime
Trend-following long environment
Neon Magenta Band
Bearish regime
Defensive or short environment
Filled Trend Zone
Shows the active trend space clearly without clutter.
This indicator is designed for learning:
Market structure
Regime trading
Patience and higher timeframe discipline
Recommended workflow:
Use Median TR SuperTrend on 1D
Trade only in the direction of the active regime
Combine with a trigger tool if needed (RSI, momentum, breakout)
Ideal Markets
BTC, ETH, SOL
Daily swing trend environments
Portfolio regime filtering (RSPS / LTPI-style frameworks)
Disclaimer
This indicator is a regime and trend-following tool, not a complete trading system.
It should be used as part of a broader strategy with:
Risk management
Position sizing
Confirmation logic

MAD Supertrend [Alpha Extract]A sophisticated SuperTrend implementation that replaces traditional ATR calculations with Mean Absolute Deviation methodology for adaptive volatility measurement and band construction. Utilizing SMA baseline with MAD-based deviation bands and optional adaptive factor adjustments, this indicator delivers institutional-grade trend detection with strength-based filtering and dynamic visual feedback. The system's MAD approach provides superior noise reduction compared to ATR while maintaining responsiveness to genuine volatility changes, combined with momentum-based strength calculations for high-conviction signal generation.
🔶 Advanced MAD-Based Band Construction
Implements Mean Absolute Deviation calculation as volatility proxy, measuring absolute price deviations from mean and smoothing for stable band generation without ATR dependency. The system calculates SMA baseline, computes MAD from configurable lookback period, applies factor multipliers to create upper and lower bands, then implements classic SuperTrend ratcheting logic where bands only adjust when price violates previous levels or calculations warrant updates.
// Core MAD SuperTrend Framework
SMA_Value = ta.sma(src, SMA_Length)
Mean = ta.sma(src, MAD_Length)
Abs_Deviation = abs(src - Mean)
MAD_Value = ta.sma(Abs_Deviation, MAD_Length)
// Band Construction with Ratcheting
Upper_Band = SMA_Value + MAD_Factor * MAD_Value
Lower_Band = SMA_Value - MAD_Factor * MAD_Value
// Ratcheting logic prevents premature band adjustments
🔶 Adaptive Factor Adjustment Engine
Features optional adaptive multiplier system that modulates MAD factor based on normalized MAD magnitude relative to recent extremes, creating bands that automatically expand during high-volatility regimes and contract during consolidation. The system applies min-max normalization to MAD values over configurable lookback, multiplies by adaptation parameter, and adds to base factor for dynamic volatility sensitivity without manual recalibration.
🔶 Momentum-Based Strength Filter
Implements sophisticated strength calculation measuring price momentum relative to baseline divided by volatility-adjusted MAD bands, producing normalized 0-1 strength scores with exponential smoothing. The system calculates distance from SMA baseline, normalizes by MAD-derived band width, and applies configurable minimum threshold requiring sufficient momentum before trend signals activate, filtering weak or choppy market conditions.
🔶 SuperTrend Direction Logic
Utilizes classic SuperTrend methodology adapted for MAD bands where trend direction flips on opposite band violations with state persistence until confirmation. The system tracks whether price closes above upper band (bearish flip to bullish) or below lower band (bullish flip to bearish), maintains directional state until opposing violation occurs, and generates binary +1/-1 trend signals suitable for systematic position management.
🔶 Intelligent Candle Sticking System
Provides advanced line positioning option that anchors SuperTrend line to candle wicks or bodies rather than pure calculation values for enhanced visual clarity. The system supports two modes: Wick (positions at high/low extremes based on trend direction) and Body (constrains line between calculation and candle extremes), creating cleaner chart presentation while maintaining mathematical integrity of underlying signals.
🔶 Dynamic Gradient Visualization Framework
Implements color intensity modulation based on smoothed strength calculations, transitioning from muted to vivid hues as momentum conviction increases. The system applies gradient interpolation using strength ratio, creating visual feedback where strong trending moves display intense colors while weak or consolidating conditions show faded tones across trend line, channel bands, and candle coloring for immediate regime assessment.
🔶 MAD Channel Architecture
Features volatility-adjusted channel bands centered on baseline or candle-stuck line with configurable multiplier for support/resistance visualization. The system calculates upper and lower bounds using MAD values scaled by adaptive factors and channel multipliers, applies dynamic transparency based on trend strength, and creates filled regions that intensify during strong trends and fade during weak conditions.
🔶 Multi-Layer Glow Effect System
Provides sophisticated line rendering with triple-layer plot system creating glow effect through progressively wider and more transparent outer layers. The system plots core trend line at specified width with full color intensity, adds inner glow layer at +2 width with moderate transparency, and outer glow at +4 width with higher transparency, creating visual depth and emphasis without cluttering chart space.
🔶 Strength-Based State Management
Implements intelligent trend state logic requiring both directional signal and minimum strength threshold breach before confirming trend transitions. The system calculates raw SuperTrend direction, evaluates smoothed strength against configurable minimum, generates filtered trend state that can be bullish (+1), bearish (-1), or neutral (0), and maintains state persistence using hold logic that prevents oscillation during ambiguous conditions.
🔶 Comprehensive Alert Integration
Generates trend flip alerts when filtered state transitions from bearish to bullish or bullish to bearish with full confirmation requirements satisfied. The system detects state changes through comparison with previous bar, triggers single alert per transition rather than continuous notifications, and provides customizable message templates for automated trading system integration or manual notification preferences.
🔶 Performance Optimization Architecture
Utilizes efficient calculation methods with null value handling, nz() functions preventing errors during initialization bars, and optimized gradient calculations. The system includes intelligent state persistence minimizing recalculation overhead, streamlined MAD computation avoiding redundant mean calculations, and smooth visual updates maintaining consistent performance across extended historical periods.
This indicator delivers sophisticated SuperTrend analysis through Mean Absolute Deviation methodology providing superior statistical properties compared to traditional ATR-based approaches. MAD calculations offer more robust volatility measurement resistant to extreme outliers while maintaining sensitivity to genuine market regime changes. The system's adaptive factor adjustment, momentum-based strength filtering, and dynamic visual feedback make it essential for traders seeking reliable trend-following signals with reduced false breakouts during choppy conditions. The combination of MAD bands, candle-sticking options, gradient strength visualization, and comprehensive filtering creates institutional-grade trend detection suitable for systematic approaches across cryptocurrency, forex, and equity markets with clear entry/exit signals and comprehensive alert capabilities.

RSI Momentum SuperTrend█ OVERVIEW
RSI Momentum SuperTrend is a momentum-based trend oscillator that combines classic RSI with a SuperTrend mechanism calculated directly on RSI values. Instead of using price-based ATR, the indicator measures volatility of RSI itself, allowing dynamic adaptation to different markets and timeframes.
It is fast and responsive, designed for early detection of momentum shifts. It works especially well for divergence analysis, pullbacks within higher timeframe trends, and as a confirmation tool in contrarian strategies.
█ CONCEPT
The indicator was created to combine:
- the sensitivity of an oscillator (RSI)
- the stability of the SuperTrend mechanism
The key element is calculating “ATR” directly on RSI changes and then normalizing it. This allows:
- automatic adaptation to the instrument’s behavior
- consistent performance across different markets and timeframes
Dynamic upper and lower bands (RSI ± adaptive range) act as momentum control levels.
A trend change occurs only after these levels are broken, helping to reduce market noise.
█ FEATURES
Data source:
- RSI (default: close)
- RSI length
- EMA smoothing
Additional:
- Optional raw RSI display
(can be used to build custom strategies and to compare with the SuperTrend line)
Calculations:
- EMA-smoothed RSI
- Adaptive ATR calculated on RSI changes
- Volatility normalization
- Dynamic bands: RSI ± (ATR × multiplier)
- Trailing mechanism:
- Levels are dynamically updated according to trend direction
- Direction changes only after they are broken
- Trend change logic:
- Down → Up: RSI > upper band
- Up → Down: RSI < lower band
Visualization:
- RSI line with dynamic trend coloring
- SuperTrend line on RSI
- Gradient fill between RSI and ST
- Candle coloring according to trend
- Overbought / Oversold zones with fill
- Fog on Price (optional). Trend direction visualization directly on the price chart
Alerts:
- Trend change to UP
- Trend change to DOWN
█ HOW TO USE
Adding:
Paste the code into Pine Editor or search for “RSI Momentum SuperTrend”
Main settings:
- RSI Length → default 14
- RSI Smoothing → signal smoothing
- ATR Length (on RSI) → adaptation control
- ATR Multiplier → main sensitivity parameter
- Show Raw RSI → raw RSI preview
- Color Candles → candle coloring according to trend
- Fog on Price → trend visualization on price
Interpretation:
- Green color = uptrend
- Red color = downtrend
- Higher multiplier = fewer signals, higher quality
- Lower multiplier = faster reaction, more signals
█ APPLICATIONS
It is recommended to use the indicator together with other technical tools.
If you want to use it not as a trend indicator but as an entry tool, consider combining it with a slower trend indicator (e.g. classic SuperTrend). In this setup:
- the main trend is defined by the slower indicator
- entries are taken only in its direction
- RSI Momentum ST helps to identify local pullbacks within the trend
Ideal for:
- Divergences
e.g. price makes higher highs while RSI Momentum ST makes lower highs → possible trend weakness
similarly: price goes down while the indicator goes up
- Pullbacks in higher timeframe trends
e.g. H4 uptrend, while on M15 RSI Momentum ST enters oversold zone → potential end of pullback
- Contrarian strategies
e.g. strong downtrend, while RSI Momentum ST starts turning up → possible market reaction
Early detection of momentum shifts
Best combined with:
- Support and resistance levels
- Market structure (HH, HL, LH, LL)
- Volume
- Price action
- Higher timeframe analysis
█ NOTES
- Works on all markets and timeframes
- Faster than classic price-based trend indicators
- Best results are achieved when used with market context
- Not a standalone trading system

Adaptive Bull Ratio Strategy█ Overview: Why This Strategy
Most option strategies fall into two traps:
They are too rigid: A "Call Ratio Spread" works great in slow markets but gets destroyed if the market rallies hard.
They are too simple: A simple "Buy Call" suffers from time decay (Theta) if the market chops sideways.
The Adaptive Bull Ratio Strategy solves both . It is a living strategy that "shifts gears" based on price action.
It is called "Adaptive" because it morphs its structure three times during a trade. It starts conservative to harvest Time Decay, but if the market explodes upwards, it "uncaps" itself to ride the trend aggressively.
█ The Entry Philosophy: Why Supertrend?
The default setting uses the Supertrend indicator as the trigger. This is intentional:
Volatility Awareness: Supertrend adapts to market noise using ATR. In high volatility, bands widen to prevent false entries.
Trend Confirmation: Since Phase 1 involves selling options, entering "too early" against a falling market is dangerous. Supertrend forces patience, waiting for a confirmed reversal (Close > Trend Line), ensuring the momentum is actually in your favor before you commit capital.
The "Drift" Benefit: This strategy excels in markets that "drift" upwards. Supertrend identifies these trends while filtering out short-term chop.
Flexibility with External Sources:
While Supertrend is the default, the strategy is designed to be flexible. You can enable the 'Enable External Source' option in the settings to plug in any custom indicator (e.g., Moving Averages, Parabolic SAR, or a proprietary trendline).
The Golden Rule for External Sources: The script interprets a Bullish Signal whenever your External Source line is below the Close price (Ext Source < Close).
Compatibility: As long as your custom indicator behaves like a support line in an uptrend (plotting below the candles), it will work seamlessly with this strategy's logic.
█ The "Long Only" Rationale: Avoiding the Volatility Trap
Why not trade this on the short side (Puts) during crashes?
The Volatility Trap (Vega Risk): In Bull markets, Implied Volatility (IV) usually drops, helping your sold options decay faster. In Bear markets, IV explodes (panic). Selling OTM Puts during a crash is dangerous as their value skyrockets, neutralizing gains.
Velocity Risk: Bear markets crash fast ("Elevator Down"). Prices can blow through adjustment levels faster than the strategy can safely roll down, causing slippage.
Structural Skew: OTM Puts are inherently more expensive. Buying expensive ITM Puts and selling expensive OTM Puts shifts the breakeven further away, making V-shape recoveries painful.
█ How It Works & Stands Out
This strategy actively transforms risk profiles based on market movement:
Phase 1: The "Safe" Start (Entry)
Setup: Initiates a Call Ratio Spread (Buy 2 ITM, Sell 4 OTM) + Protective Puts.
Logic: Profits from sideways drift or slow rallies via Time Decay (Theta). The sold options finance the trade.
Phase 2: The "Shift" (Adjustment Level 1)
Trigger: Market moves above Leg 2 (3 OTM Call).
Action: Rolls Up the position. Exits initial legs, enters new higher legs, and adds a Short Put to finance the roll.
Impact: Aggressive. You bet the trend is strong enough to support the added downside risk of the short put.
Phase 3: The "Uncap" (Adjustment Level 2)
Trigger: Market moves above Leg 3 (4 OTM Call).
Action: Exits all Sold Calls.
Impact: Uncaps profit potential. The trade becomes a Net Long position (Long Calls + Short Puts), allowing you to ride a massive rally without a ceiling.
Phase 4: The "Lock-In" (Optional Trail Adjustment)
Trigger: The market goes parabolic (price rises X levels above Leg 3, configurable in settings).
Action (If Enabled):
Call Adj: Exits the Phase 3 calls and buys fresh 1-OTM calls (Rolling Up to lock profits).
Put Adj: Exits all Put legs (Removing downside risk completely).
Impact: Maximum Safety. This phase is about "banking" the windfall from a massive rally and leaving a smaller, risk-free runner to capture any final extension.
█ How to Start: A Quick Setup Guide
Step 1: Map Expiry Dates
Manually input your trading expiry dates in Settings -> Expiry Management.
Format: YYYY-MM-DD (e.g., 2025-12-25). Strict adherence required for DhanHQ.
Step 2: Configure Symbol & Size
Exchange/Symbol: Enter NSE and NIFTY (or your ticker).
Lot Multiplier: Default is 1. Set to 2 to double all quantities (e.g., Buy 2 becomes Buy 4).
Step 3: Understand Visuals
Entry Window (Light Blue): Strategy is scanning for new trades.
Non-Entry Window (Dark Blue): Trading blocked (Day before Expiry & Expiry Day). Only management allowed.
Green Box: Valid Late Entry Zone.
Red Dashed Line: Invalidation Level (if price touches this, no late entry).
Fuchsia Line: Trigger level for Special Trail Adjustments (Phase 4).
IMPORTANT: Broker & Technology Heads-Up:
The alerts generated by this script ({"secret": "...", "alertType": "multi_leg_order"...}) are specifically formatted for the DhanHQ webhook structure.
Dhan Users: Plug-and-play.
Other Brokers: You need middleware (NextLevelBot, Quantiply) to parse the JSON.
█ Risk Disclaimer & Advice
Trading options involves substantial risk.
The Whipsaw Risk: In Phase 2, you are Long Calls and Short Puts. A sharp reversal causes losses on both sides.
Margin: Selling options requires significant margin. Keep a 15-20% cash buffer to handle adjustments instantly.
Testing: This strategy is optimized for NIFTY Weekly Options. Effectiveness on BankNifty or Stocks is untested and may require parameter tuning.
Advice:
Backtest: Use TradingView Replay.
Paper Trade: Run for at least one expiry cycle before live deployment.
Consult: Seek professional financial advice before trading.
Practical Tips for Smooth Execution
For a new trader deploying this system, these operational tips are vital:
Capital Buffer: Do not trade at your limit. Always keep 10-15% free cash in your broker account. Adjustments (specifically Phase 2, where you sell an extra Put) require additional margin instantly. If margin is short, the order fails, and your hedge breaks.
Liquidity Awareness : The script trades "Far Deep OTM" options (Leg 4) to reduce margin. On indices like Nifty/BankNifty, this is fine. On individual stocks, these deep strikes might be illiquid. Check the option chain volume before deploying on stocks.
Trust the Process (but Verify) : While the algo drives, you are the pilot.
Check your API connection every morning.
Ensure the "Entry Window" background color on the chart matches your real-world date.
Verify that your broker executed all legs of a multi-leg order (partial fills are rare but possible).
The "Human" Stop: If major news breaks (e.g., unexpected election results, war announcements), volatility can expand faster than any algo can react. It is acceptable—and smart—to pause the strategy during known "Black Swan" events or earnings releases.
█ Timeframe Selection: The 30-Minute Standard
Critical Requirement: This indicator must be applied to a 30-minute chart.
Why?
Noise Filtering: The Supertrend logic is tuned to capture multi-day trends. Lower timeframes (5m, 15m) are full of "noise"—random fluctuations that look like trend changes but aren't.
Execution Logic (The Hybrid Engine): The script has a built-in "Dual Timeframe" architecture.
Decision Layer (30m): Uses the chart timeframe to decide when to be Bullish or Bearish.
Execution Layer (5m): Internally fetches 5-minute data to manage the how (Adjustments, Late Entries, and precise invalidation).
The Risk of Lower Timeframes: If you run the main chart on 5-minutes, you destroy this hierarchy. You will get too many signals, pay too much brokerage, and the internal logic may behave erratically.
Recommendation: Always keep your TradingView chart interval at 30m. Do not switch to lower timeframes expecting "faster" signals; you will likely just get "false" signals.
█ Testing Scope, Feedback
⚠️ Important Note on Asset Classes:
This strategy logic and the associated strike step calculations have been rigorously tested ONLY on NIFTY Index Options with Weekly Expiry.
BankNifty / Sensex / FinNifty: The volatility characteristics (ATR) and strike intervals of these instruments differ significantly from NIFTY. The effectiveness of this strategy on these other scripts has not been verified and may require different parameter tuning (e.g., strike_step or ATR Length).
Stocks: Individual stock options often lack the liquidity required for the "Deep OTM" legs, leading to potential execution failures.
We encourage traders to backtest this logic on other indices and share their findings! If you find a robust parameter set for BankNifty or observe unique behaviors on other scripts, please let us know in the comments below so we can improve the algorithm for everyone. Your feedback is appriciated.

Golden Vector Trend Orchestrator (GVTO)Golden Vector Trend Orchestrator (GVTO) is a composite trend-following strategy specifically engineered for XAUUSD (Gold) and volatile assets on H4 (4-Hour) and Daily timeframes.
This script aims to solve a common problem in trend trading: "Whipsaws in Sideways Markets." Instead of relying on a single indicator, GVTO employs a Multi-Factor Confluence System that filters out low-probability trades by requiring alignment across Trend Structure, Momentum, and Volatility.
🛠 Methodology & Logic
The strategy executes trades only when four distinct technical conditions overlap (Confluence). If any single condition is not met, the trade is filtered out to preserve capital.
1. Market Structure Filter (200 EMA)
Indicator: Exponential Moving Average (Length 200).
Logic: The 200 EMA acts as the baseline for the long-term trend regime.
Bullish Regime: Price must close above the 200 EMA.
Bearish Regime: Price must close below the 200 EMA.
Purpose: Prevents counter-trend trading against the macro direction.
2. Signal Trigger & Trailing Stop (Supertrend)
Indicator: Supertrend (ATR Length 14, Factor 3.5).
Logic: Uses Average True Range (ATR) to detect trend reversals while accounting for volatility.
Purpose: Provides the specific entry signal and acts as a dynamic trailing stop-loss to let profits run while cutting losses when the trend invalidates.
3. Volatility Gatekeeper (ADX Filter)
Indicator: Average Directional Index (Length 14).
Threshold: > 25.
Logic: A high ADX value indicates a strong trend presence, regardless of direction.
Purpose: This is the most critical filter. It prevents the strategy from entering trades during "choppy" or ranging markets (consolidation zones) where trend-following systems typically fail.
4. Momentum Confirmation (DMI)
Indicator: Directional Movement Index (DI+ and DI-).
Logic: Checks if the buying pressure (DI+) is physically stronger than selling pressure (DI-), or vice versa.
Purpose: Ensures that the price movement is backed by genuine momentum, not just a momentary price spike.
📋 How to Use This Strategy
🟢 LONG (BUY) Setup
A Buy signal is generated only when ALL of the following occur simultaneously:
Price Action: Price closes ABOVE the 200 EMA (Orange Line).
Trigger: Supertrend flips to GREEN (Bullish).
Strength: ADX is greater than 25 (Strong Trend).
Momentum: DI+ (Plus Directional Indicator) is greater than DI- (Minus).
🔴 SHORT (SELL) Setup
A Sell signal is generated only when ALL of the following occur simultaneously:
Price Action: Price closes BELOW the 200 EMA (Orange Line).
Trigger: Supertrend flips to RED (Bearish).
Strength: ADX is greater than 25 (Strong Trend).
Momentum: DI- (Minus Directional Indicator) is greater than DI+ (Plus).
🛡 Exit Strategy
Stop Loss / Take Profit: The strategy utilizes the Supertrend Line as a dynamic Trailing Stop.
Exit Long: When Supertrend turns Red.
Exit Short: When Supertrend turns Green.
Note: Traders can also use the real-time P/L Dashboard included in the script to manually secure profits based on their personal Risk:Reward ratio.
📊 Included Features
Real-Time P/L Dashboard: A table in the top-right corner displays the current trend status, ADX strength, and the Unrealized Profit/Loss % of the current active position.
Smart Labeling: Buy/Sell labels are coded to appear only on the initial entry trigger. They do not repaint and do not spam the chart if the trend continues (no pyramiding visualization).
Visual Aids: Background color changes (Green/Red) to visually represent the active trend based on the Supertrend status.
⚠️ Risk Warning & Best Practices
Asset Class: Optimized for XAUUSD (Gold) due to its high volatility nature. It also works well on Crypto (BTC, ETH) and Major Forex Pairs.
Timeframe: Highly recommended for H4 (4 Hours) or D1 (Daily). Using this on lower timeframes (M5, M15) may result in false signals due to market noise.
News Events: Automated strategies cannot predict economic news (CPI, NFP). Exercise caution or pause trading during high-impact economic releases.

Trend Tracer [AlgoAlpha]🟠 OVERVIEW
This tool builds a two-stage trend model that reacts to structure shifts while also showing how strong or weak the move is. It uses a mid-price band (from the highest high and lowest low over a lookback) and applies two Supertrend passes on top of it. The first pass smoothens the basis. The second pass refines that direction and produces the final trail used for signals. A gradient fill between the two trails uses RSI of price-to-trail distance to show when price is stretched or cooling off. The aim is to give traders a simple way to read trend alignment, pressure, and early turns without guessing.
🟠 CONCEPTS
The script starts with a mid-range basis. This is the average of the rolling highest high and lowest low. It acts as a stable structure reference instead of raw close or typical price. From there, two Supertrend layers are applied:
• The first Supertrend uses a shorter ATR period and lower factor. It reacts faster and sets the main regime.
• The second Supertrend uses a slightly longer ATR and higher factor. It filters noise, waits for confirmed continuation, and generates the signal line.
The interaction between these trails matters. The outer Supertrend provides context by defining the broader regime. The inner Supertrend provides timing by flipping earlier and marking possible shifts. The gradient fill uses RSI of (close − supertrend value) to display when price stretches away from the trail. This shows strength, exhaustion, or compression within the trend.
🟠 FEATURES
Bullish and bearish flip markers placed at recent highs/lows
Rejection signals off the trend tracer line
Alerts for bullish and bearish trend changes
🟠 USAGE
Setup : Add the script to your chart. Timeframe is flexible; lower timeframes show more flips while higher ones give cleaner swings. Adjust Length to change how wide the basis range is. Use the two ATR settings and factors to match the volatility of the market you trade.
Read the chart : When the refined trail (stv_) sits above price the regime is bearish; when below, it is bullish. The wide trail (stv) confirms the larger move. Watch the gradient fill: darker colors appear when price is stretched from the trail and lighter colors appear when the move is weakening. Flip markers ▲ or ▼ highlight the first clean shift of the refined trail.
Settings that matter : Increasing the Main Factor slows main-trend flips and filters chop. Increasing the Signal Factor delays the timing trail but reduces noise. Shortening Length makes the basis more reactive. ATR periods change how sensitive each Supertrend pass is to volatility.

SuperBandsI've been seeing a lot of volatility band indicators pop up recently, and after watching this trend for a while, I figured it was time to throw my two chips in. The original spark for this idea came years ago from RicardoSantos's Vector Flow Channel script, which used decay channels with timed events in an interesting way. That concept stuck with me, and I kept thinking about how to build something that captured the same kind of dynamic envelope behavior but with a different mathematical foundation. What I ended up with is a hybrid that takes the core logic of supertrend trailing stops, smooths them heavily with exponential moving averages, and wraps them in Donchian-style filled bands with momentum-based color gradients.
The basic mechanism here is pretty straightforward. Standard supertrend calculates a trailing stop based on ATR offset from price, then flips direction when price crosses the trail. This implementation does the same thing but adds EMA smoothing to the trail calculation itself, which removes a lot of the choppiness you get from raw supertrend during sideways periods. The smoothing period is adjustable, so you can tune how reactive versus stable you want the bands to be. Lower smoothing values make the bands track price more aggressively, higher values create wider, slower-moving envelopes that only respond to sustained directional moves.
Where this diverges from typical supertrend implementations is in the visual presentation and the separate treatment of bullish and bearish conditions. Instead of a single flipping line, you get persistent upper and lower bands that each track their own trailing stops independently. The bullish band trails below price and stays active as long as price doesn't break below it. The bearish band trails above price and remains active until price breaks above. Both bands can be visible simultaneously, which gives you a dynamic channel that adapts to volatility on both sides of price action. When price is trending strongly, one band will dominate and the other will disappear. During consolidation, both bands tend to compress toward price.
The color gradients are calculated by measuring the rate of change in each band's position and converting that delta into an angle using arctangent scaling. Steeper angles, which correspond to the band moving quickly to catch up with accelerating price, get brighter colors. Flatter angles, where the band is moving slowly or staying relatively stable, fade toward more muted tones. This gives you a visual sense of momentum within the bands themselves, not just from price movement. A rapidly brightening band often precedes expansion or breakout conditions, while fading colors suggest the trend is losing steam or entering consolidation.
The filled regions between price and each band serve a similar function to Donchian channels or Keltner bands, creating clearly defined zones that represent normal price behavior relative to recent volatility. When price hugs one band and the fill area compresses, you're in a strong directional regime. When price bounces between both bands and the fills expand, you're in a ranging environment. The transparency gradients in the fills make it easier to see when price is near the edge of the envelope versus safely inside it.
Configuration is split between bullish and bearish settings, which lets you asymmetrically tune the indicator if you find that your market or timeframe has different characteristics in uptrends versus downtrends. You can adjust ATR period, ATR multiplier, and smoothing independently for each direction. This flexibility is useful for instruments that exhibit different volatility profiles during bull and bear phases, or for strategies that want tighter trailing on longs than shorts, or vice versa.
The ATR period controls the lookback window for volatility measurement. Shorter periods make the bands react quickly to recent volatility spikes, which can be beneficial in fast-moving markets but also leads to more frequent whipsaws. Longer periods smooth out volatility estimates and create more stable bands at the cost of slower adaptation. The multiplier scales the ATR offset, directly controlling how far the bands sit from price. Smaller multipliers keep the bands tight, triggering more frequent direction changes. Larger multipliers create wider envelopes that give price more room to move without breaking the trail.
One thing to note is that this indicator doesn't generate explicit buy or sell signals in the traditional sense. It's a regime filter and envelope tool. You can use band breaks as directional cues if you want, but the primary value comes from understanding the current volatility environment and whether price is respecting or violating its recent behavioral boundaries. Pairing this with momentum oscillators or volume analysis tends to work better than treating band breaks as standalone entries.
From an implementation perspective, the supertrend state machine tracks whether each direction's trail is active, handles resets when price breaks through, and manages the EMA smoothing on the trail points themselves rather than just post-processing the supertrend output. This means the smoothing is baked into the trailing logic, which creates a different response curve than if you just applied an EMA to a standard supertrend line. The angle calculations use RMS estimation for the delta normalization range, which adapts to changing volatility and keeps the color gradients responsive across different market conditions.
What this really demonstrates is that there are endless ways to combine basic technical concepts into something that feels fresh without reinventing mathematics. ATR offsets, trailing stops, EMA smoothing, and Donchian fills are all standard building blocks, but arranging them in a particular way produces behavior that's distinct from each component alone. Whether this particular arrangement works better than other volatility band systems depends entirely on your market, timeframe, and what you're trying to accomplish. For me, it scratched the itch I had from seeing Vector Flow years ago and wanting to build something in that same conceptual space using tools I'm more comfortable with.

Mutanabby_AI | Ultimate Algo | Remastered+Overview
The Mutanabby_AI Ultimate Algo Remastered+ represents a sophisticated trend-following system that combines Supertrend analysis with multiple moving average confirmations. This comprehensive indicator is designed specifically for identifying high-probability trend continuation and reversal opportunities across various market conditions.
Core Algorithm Components
**Supertrend Foundation**: The primary signal generation relies on a customizable Supertrend indicator with adjustable sensitivity (1-20 range). This adaptive trend-following tool uses Average True Range calculations to establish dynamic support and resistance levels that respond to market volatility.
**SMA Confirmation Matrix**: Multiple Simple Moving Averages (SMA 4, 5, 9, 13) provide layered confirmation for signal strength. The algorithm distinguishes between regular signals and "Strong" signals based on SMA 4 vs SMA 5 relationship, offering traders different conviction levels for position sizing.
**Trend Ribbon Visualization**: SMA 21 and SMA 34 create a visual trend ribbon that changes color based on their relationship. Green ribbon indicates bullish momentum while red signals bearish conditions, providing immediate visual trend context.
**RSI-Based Candle Coloring**: Advanced 61-tier RSI system colors candles with gradient precision from deep red (RSI ≤20) through purple transitions to bright green (RSI ≥79). This visual enhancement helps traders instantly assess momentum strength and overbought/oversold conditions.
Signal Generation Logic
**Buy Signal Criteria**:
- Price crosses above Supertrend line
- Close price must be above SMA 9 (trend confirmation)
- Signal strength determined by SMA 4 vs SMA 5 relationship
- "Strong Buy" when SMA 4 ≥ SMA 5
- Regular "Buy" when SMA 4 < SMA 5
**Sell Signal Criteria**:
- Price crosses below Supertrend line
- Close price must be below SMA 9 (trend confirmation)
- Signal strength based on SMA relationship
- "Strong Sell" when SMA 4 ≤ SMA 5
- Regular "Sell" when SMA 4 > SMA 5
Advanced Risk Management System
**Automated TP/SL Calculation**: The indicator automatically calculates stop loss and take profit levels using ATR-based measurements. Risk percentage and ATR length are fully customizable, allowing traders to adapt to different market conditions and personal risk tolerance.
**Multiple Take Profit Targets**:
- 1:1 Risk-Reward ratio for conservative profit taking
- 2:1 Risk-Reward for balanced trade management
- 3:1 Risk-Reward for maximum profit potential
**Visual Risk Display**: All risk management levels appear as both labels and optional trend lines on the chart. Customizable line styles (solid, dashed, dotted) and positioning ensure clear visualization without chart clutter.
**Dynamic Level Updates**: Risk levels automatically recalculate with each new signal, maintaining current market relevance throughout position lifecycles.
Visual Enhancement Features
**Customizable Display Options**: Toggle trend ribbon, TP/SL levels, and risk lines independently. Decimal precision adjustments (1-8 decimal places) accommodate different instrument price formats and personal preferences.
**Professional Label System**: Clean, informative labels show entry points, stop losses, and take profit targets with precise price levels. Labels automatically position themselves for optimal chart readability.
**Color-Coded Momentum**: The gradient RSI candle coloring system provides instant visual feedback on momentum strength, helping traders assess market energy and potential reversal zones.
Implementation Strategy
**Timeframe Optimization**: The algorithm performs effectively across multiple timeframes, with higher timeframes (4H, Daily) providing more reliable signals for swing trading. Lower timeframes work well for day trading with appropriate risk adjustments.
**Sensitivity Adjustment**: Lower sensitivity values (1-5) generate fewer but higher-quality signals, ideal for conservative approaches. Higher sensitivity (15-20) increases signal frequency for active trading styles.
**Risk Management Integration**: Use the automated risk calculations as baseline parameters, adjusting risk percentage based on account size and market conditions. The 1:1, 2:1, 3:1 targets enable systematic profit-taking strategies.
Market Application
**Trend Following Excellence**: Primary strength lies in capturing significant trend movements through the Supertrend foundation with SMA confirmation. The dual-layer approach reduces false signals common in single-indicator systems.
**Momentum Assessment**: RSI-based candle coloring provides immediate momentum context, helping traders assess signal strength and potential continuation probability.
**Range Detection**: The trend ribbon helps identify ranging conditions when SMA 21 and SMA 34 converge, alerting traders to potential breakout opportunities.
Performance Optimization
**Signal Quality**: The requirement for both Supertrend crossover AND SMA 9 confirmation significantly improves signal reliability compared to basic trend-following approaches.
**Visual Clarity**: The comprehensive visual system enables rapid market assessment without complex calculations, ideal for traders managing multiple instruments.
**Adaptability**: Extensive customization options allow fine-tuning for specific markets, trading styles, and risk preferences while maintaining the core algorithm integrity.
## Non-Repainting Design
**Educational Note**: This indicator uses standard TradingView functions (Supertrend, SMA, RSI) with normal behavior patterns. Real-time updates on current candles are expected and standard across all technical indicators. Historical signals on closed candles remain fixed and unchanged, ensuring reliable backtesting and analysis.
**Signal Confirmation**: Final signals are confirmed only when candles close, following standard technical analysis principles. The algorithm provides clear distinction between developing signals and confirmed entries.
Technical Specifications
**Supertrend Parameters**: Default sensitivity of 4 with ATR length of 11 provides balanced signal generation. Sensitivity range from 1-20 allows adaptation to different market volatilities and trading preferences.
**Moving Average Configuration**: SMA periods of 8, 9, and 13 create multi-layered trend confirmation, while SMA 21 and 34 form the visual trend ribbon for broader market context.
**Risk Management**: ATR-based calculations with customizable risk percentage ensure dynamic adaptation to market volatility while maintaining consistent risk exposure principles.
Recommended Settings
**Conservative Approach**: Sensitivity 4-5, RSI length 14, higher timeframes (4H, Daily) for swing trading with maximum signal reliability.
**Active Trading**: Sensitivity 6-8, RSI length 8-10, intermediate timeframes (1H) for balanced signal frequency and quality.
**Scalping Setup**: Sensitivity 10-15, RSI length 5-8, lower timeframes (15-30min) with enhanced risk management protocols.
## Conclusion
The Mutanabby_AI Ultimate Algo Remastered+ combines proven trend-following principles with modern visual enhancements and comprehensive risk management. The algorithm's strength lies in its multi-layered confirmation approach and automated risk calculations, providing both novice and experienced traders with clear signals and systematic trade management.
Success with this system requires understanding the relationship between signal strength indicators and adapting sensitivity settings to match current market conditions. The comprehensive visual feedback system enables rapid decision-making while the automated risk management ensures consistent trade parameters.
Practice with different sensitivity settings and timeframes to optimize performance for your specific trading style and risk tolerance. The algorithm's systematic approach provides an excellent framework for disciplined trend-following strategies across various market environments.

Volume MAs Supertrend | Lyro RS📊 Volume MAs Supertrend | Lyro RS is an advanced trading tool that combines volume-adjusted moving averages with a dynamic Supertrend system. This indicator provides a robust framework for identifying market trends and entry/exit points.
✨ Key Features :
📈 Volume-Weighted Moving Averages (VWMA): Integrates price and volume data to provide a more accurate moving average, allowing for better trend analysis.
🔧 Multiple MA Types: Choose from SMA, EMA, WMA, VWMA, DEMA, TEMA, RMA, HMA, ALMA to suit your preferred trading strategy.
📊 Dual-Multiplier Supertrend System: Uses ATR to dynamically calculate upper and lower bands for long and short trends, with distinct multipliers for each.
🎨 Customizable Color Schemes: Choose from Classic, Mystic, Accented, and Royal color palettes or customize your own colors for bullish and bearish trends.
🔍 Visual Enhancements: Color-coded Supertrend lines, candlesticks, and bars for quick trend identification.
⏰ Alert System: Alerts for long and short signals based on trend changes.
🔧 How It Works :
The Supertrend line is calculated using ATR over a user-defined period, with separate multipliers for long and short positions.
📈 A bullish trend is signaled when the price crosses above the upper band, and a bearish trend is signaled when the price crosses below the lower band.
🎨 The Supertrend line changes color to reflect trend direction, with candlesticks and bars matching the trend's color for visual clarity.
⚙️ Customization Options :
🛠️ Moving Average Settings: Select your preferred moving average type (SMA, EMA, VWMA, etc.) and adjust the length for smoother or more responsive trend signals.
📐 Supertrend Parameters: Define the ATR period and adjust multipliers to fine-tune sensitivity for long and short signals.
🎨 Color Configuration: Choose from predefined color palettes or create your own custom scheme for trend signals.
📈 Use Cases :
✅ Confirm market trends before entering trades.
🚪 Identify potential entry/exit points as trend directions shift.
👀 Visually analyze market conditions with color-coded candlesticks and bars.
⚠️ Disclaimer :
This indicator should not be used as a standalone tool for making trading decisions. Always combine with other forms of analysis and risk management practices.

Heiken Ashi Supertrend ADXHeiken Ashi Supertrend ADX Indicator
Overview
This indicator combines the power of Heiken Ashi candles, Supertrend indicator, and ADX filter to identify strong trend movements across multiple timeframes. Designed primarily for the cryptocurrency market but adaptable to any tradable asset, this system focuses on capturing momentum in established trends while employing a sophisticated triple-layer stop loss mechanism to protect capital and secure profits.
Strategy Mechanics
Entry Signals
The strategy uses a unique blend of technical signals to identify high-probability trade entries:
Heiken Ashi Candles: Looks specifically for Heiken Ashi candles with minimal or no wicks, which signal strong momentum and trend continuation. These "full-bodied" candles represent periods where price moved decisively in one direction with minimal retracement. These are overlayed onto normal candes for more accuarte signalling and plotting
Supertrend Filter: Confirms the underlying trend direction using the Supertrend indicator (default factor: 3.0, ATR period: 10). Entries are aligned with the prevailing Supertrend direction.
ADX Filter (Optional) : Can be enabled to focus only on stronger trending conditions, filtering out choppy or ranging markets. When enabled, trades only trigger when ADX is above the specified threshold (default: 25).
Exit Signals
Positions are closed when either:
An opposing signal appears (Heiken Ashi candle with no wick in the opposite direction)
Any of the three stop loss mechanisms are triggered
Triple-Layer Stop Loss System
The strategy employs a sophisticated three-tier stop loss approach:
ATR Trailing Stop: Adapts to market volatility and locks in profits as the trend extends. This stop moves in the direction of the trade, capturing profit without exiting too early during normal price fluctuations.
Swing Point Stop: Uses natural market structure (recent highs/lows over a lookback period) to place stops at logical support/resistance levels, honoring the market's own rhythm.
Insurance Stop: A percentage-based safety net that protects against sudden adverse moves immediately after entry. This is particularly valuable when the swing point stop might be positioned too far from entry, providing immediate capital protection.
Optimization Features
Customizable Filters : All components (Supertrend, ADX) can be enabled/disabled to adapt to different market conditions
Adjustable Parameters : Fine-tune ATR periods, Supertrend factors, and ADX thresholds
Flexible Stop Loss Settings : Each of the three stop loss mechanisms can be individually enabled/disabled with customizable parameters
Best Practices for Implementation
[Recommended Timeframes : Works best on 4-hour charts and above, where trends develop more reliably
Market Conditions: Performs well across various market conditions due to the ADX filter's ability to identify meaningful trends
Performance Characteristics
When properly optimized, this has demonstrated profit factors exceeding 3 in backtesting. The approach typically produces generous winners while limiting losses through its multi-layered stop loss system. The ATR trailing stop is particularly effective at capturing extended trends, while the insurance stop provides immediate protection against adverse moves.
The visual components on the chart make it easy to follow the strategy's logic, with position status, entry prices, and current stop levels clearly displayed.
This indicator represents a complete trading system with clearly defined entry and exit rules, adaptive stop loss mechanisms, and built-in risk management through position sizing.

Heiken Ashi Supertrend ADX - StrategyHeiken Ashi Supertrend ADX Strategy
Overview
This strategy combines the power of Heiken Ashi candles, Supertrend indicator, and ADX filter to identify strong trend movements across multiple timeframes. Designed primarily for the cryptocurrency market but adaptable to any tradable asset, this system focuses on capturing momentum in established trends while employing a sophisticated triple-layer stop loss mechanism to protect capital and secure profits.
Strategy Mechanics
Entry Signals
The strategy uses a unique blend of technical signals to identify high-probability trade entries:
Heiken Ashi Candles: Looks specifically for Heiken Ashi candles with minimal or no wicks, which signal strong momentum and trend continuation. These "full-bodied" candles represent periods where price moved decisively in one direction with minimal retracement.
Supertrend Filter : Confirms the underlying trend direction using the Supertrend indicator (default factor: 3.0, ATR period: 10). Entries are aligned with the prevailing Supertrend direction.
ADX Filter (Optional) : Can be enabled to focus only on stronger trending conditions, filtering out choppy or ranging markets. When enabled, trades only trigger when ADX is above the specified threshold (default: 25).
Exit Signals
Positions are closed when either:
An opposing signal appears (Heiken Ashi candle with no wick in the opposite direction)
Any of the three stop loss mechanisms are triggered
Triple-Layer Stop Loss System
The strategy employs a sophisticated three-tier stop loss approach:
ATR Trailing Stop: Adapts to market volatility and locks in profits as the trend extends. This stop moves in the direction of the trade, capturing profit without exiting too early during normal price fluctuations.
Swing Point Stop : Uses natural market structure (recent highs/lows over a lookback period) to place stops at logical support/resistance levels, honoring the market's own rhythm.
Insurance Stop: A percentage-based safety net that protects against sudden adverse moves immediately after entry. This is particularly valuable when the swing point stop might be positioned too far from entry, providing immediate capital protection.
Optimization Features
Customizable Filters: All components (Supertrend, ADX) can be enabled/disabled to adapt to different market conditions
Adjustable Parameters: Fine-tune ATR periods, Supertrend factors, and ADX thresholds
Flexible Stop Loss Settings: Each of the three stop loss mechanisms can be individually enabled/disabled with customizable parameters
Best Practices for Implementation
Recommended Timeframes: Works best on 4-hour charts and above, where trends develop more reliably
Market Conditions: Performs well across various market conditions due to the ADX filter's ability to identify meaningful trends
Position Sizing: The strategy uses a percentage of equity approach (default: 3%) for position sizing
Performance Characteristics
When properly optimized, this strategy has demonstrated profit factors exceeding 3 in backtesting. The approach typically produces generous winners while limiting losses through its multi-layered stop loss system. The ATR trailing stop is particularly effective at capturing extended trends, while the insurance stop provides immediate protection against adverse moves.
The visual components on the chart make it easy to follow the strategy's logic, with position status, entry prices, and current stop levels clearly displayed.
This strategy represents a complete trading system with clearly defined entry and exit rules, adaptive stop loss mechanisms, and built-in risk management through position sizing.

Bollinger Bands + Supertrend by XoediacBollinger Bands with Supertrend Indicator by Xeodiac
This script combines two powerful technical analysis tools — Bollinger Bands and the Supertrend Indicator — to provide traders with a comprehensive view of market volatility and trend direction.
Bollinger Bands: These bands consist of a middle band (the simple moving average, or SMA) and two outer bands (calculated as standard deviations away from the middle). The upper and lower bands act as dynamic support and resistance levels, expanding during high volatility and contracting during low volatility.
Supertrend Indicator: The Supertrend is a trend-following indicator that uses the Average True Range (ATR) to calculate an adaptive threshold, indicating whether the market is in an uptrend or downtrend. The indicator changes color based on the trend direction, providing clear buy and sell signals.
Features of the Script:
Volatility-based Signals : By incorporating the Bollinger Bands, the script adjusts to market volatility. Traders can identify periods of high and low volatility, helping to gauge potential price breakouts or reversals.
Trend Confirmation: The Supertrend helps confirm the trend direction, ensuring that trades are aligned with the overall market trend. Green Supertrend signals indicate an uptrend, while red signals indicate a downtrend.
Enhanced Decision-making: By using both indicators together, traders can make more informed decisions. For instance, buying opportunities are validated when the price is near the lower Bollinger Band, and the Supertrend is in a bullish phase, and vice versa for selling.
Customizable Parameters: The script allows users to customize the settings for both the Bollinger Bands and the Supertrend, enabling fine-tuning based on trading preferences or market conditions.
Ideal Use Cases:
Identifying trend reversals or continuation patterns in trending markets.
Monitoring price action during periods of low volatility for breakout opportunities.
Filtering out false signals by combining volatility with trend strength.
25-75 Percentile SuperTrend | Mattes25-75 Percentile SuperTrend | Mattes
Overview
The 25-75 Percentile SuperTrend is an advanced trend-following indicator that enhances the traditional SuperTrend concept by incorporating percentile-based smoothing. Instead of using a simple moving average or median price, this indicator calculates the 25th and 75th percentiles over a user-defined period. These percentiles act as dynamic trend levels, adjusting more responsively to price volatility while reducing noise.
How It’s Calculated
Percentile Smoothing:
The 25th percentile of the selected source (low-end smoothing).
The 75th percentile of the selected source (high-end smoothing).
SuperTrend Logic:
The upper band is set at the 75th percentile + ATR multiplier.
The lower band is set at the 25th percentile - ATR multiplier.
The trend flips when the price crosses above/below these dynamic bands.
Signal Generation :
A bullish trend occurs when price remains above the lower band.
A bearish trend occurs when price remains below the upper band.
Trend shifts are highlighted with colored bars and lines for easy visualization.
How It Differs From Traditional SuperTrend
Uses Percentiles Instead of a Moving Average:
Traditional SuperTrend relies on ATR-based offsets from a moving average.
This version replaces the moving average with percentile smoothing, which adapts better to price behavior.
Better Noise Filtering:
Since percentiles are less sensitive to outliers, this indicator reduces false signals in choppy markets.
More Adaptive to Market Conditions:
The percentile smoothing dynamically adjusts trend detection based on price distribution rather than fixed calculations.
Why It’s Useful
✅ Reduces Whipsaws: Helps minimize false breakouts by using percentile-based bands instead of traditional ATR-only bands.
✅ Works in Different Market Conditions: Effective in both trending and ranging environments due to its adaptive nature.
✅ Enhances Trend Confidence: Provides clearer signals by filtering noise more effectively than standard SuperTrend indicators.
Application Examples
Trend Following: Use it to identify strong upward or downward trends.
Stop-Loss Placement: The upper and lower bands can serve as dynamic stop-loss levels.
Breakout Confirmation: Trend flips can confirm breakout signals from other indicators.
Mean Reversion Strategy Filtering: The 25-75 range helps identify strong versus weak reversals.
Risks & Disclaimers
Not a Standalone Strategy: This indicator should be used with other confirmation tools like volume analysis, momentum oscillators, or support/resistance levels.
False Signals in Sideways Markets: Although it reduces noise, choppy markets can still generate occasional false trend flips.
Market Adaptation Required: The best parameters may vary depending on the asset and timeframe.
This indicator was heavily inspired and influenced by the IRS/viResearch Median SuperTrend, improving upon its concept by transforming its median based calculation into a more responsive & effective counterpart of its former self.
Shoutout to all my Masterclass Brothers and L4 Gs !
DAILY Supertrend + EMA Crossover with RSI FilterThis strategy is a technical trading approach that combines multiple indicators—Supertrend, Exponential Moving Averages (EMAs), and the Relative Strength Index (RSI)—to identify and manage trades.
Core Components:
1. Exponential Moving Averages (EMAs):
Two EMAs, one with a shorter period (fast) and one with a longer period (slow), are calculated. The idea is to spot when the faster EMA crosses above or below the slower EMA. A fast EMA crossing above the slow EMA often suggests upward momentum, while crossing below suggests downward momentum.
2. Supertrend Indicator:
The Supertrend uses Average True Range (ATR) to establish dynamic support and resistance lines. These lines shift above or below price depending on the prevailing trend. When price is above the Supertrend line, the trend is considered bullish; when below, it’s considered bearish. This helps ensure that the strategy trades only in the direction of the overall trend rather than against it.
3. RSI Filter:
The RSI measures momentum. It helps avoid buying into markets that are already overbought or selling into markets that are oversold. For example, when going long (buying), the strategy only proceeds if the RSI is not too high, and when going short (selling), it only proceeds if the RSI is not too low. This filter is meant to improve the quality of the trades by reducing the chance of entering right before a reversal.
4. Time Filters:
The strategy only triggers entries during user-specified date and time ranges. This is useful if one wants to limit trading activity to certain trading sessions or periods with higher market liquidity.
5. Risk Management via ATR-based Stops and Targets:
Both stop loss and take profit levels are set as multiples of the ATR. ATR measures volatility, so when volatility is higher, both stops and profit targets adjust to give the trade more breathing room. Conversely, when volatility is low, stops and targets tighten. This dynamic approach helps maintain consistent risk management regardless of market conditions.
Overall Logic Flow:
- First, the market conditions are analyzed through EMAs, Supertrend, and RSI.
- When a buy (long) condition is met—meaning the fast EMA crosses above the slow EMA, the trend is bullish according to Supertrend, and RSI is below the specified “overbought” threshold—the strategy initiates or adds to a long position.
- Similarly, when a sell (short) condition is met—meaning the fast EMA crosses below the slow EMA, the trend is bearish, and RSI is above the specified “oversold” threshold—it initiates or adds to a short position.
- Each position is protected by an automatically calculated stop loss and a take profit level based on ATR multiples.
Intended Result:
By blending trend detection, momentum filtering, and volatility-adjusted risk management, the strategy aims to capture moves in the primary trend direction while avoiding entries at excessively stretched prices. Allowing multiple entries can potentially amplify gains in strong trends but also increases exposure, which traders should consider in their risk management approach.
In essence, this strategy tries to ride established trends as indicated by the Supertrend and EMAs, filter out poor-quality entries using RSI, and dynamically manage trade risk through ATR-based stops and targets.

Hyperbolic Tangent SuperTrend [InvestorUnknown]The Hyperbolic Tangent SuperTrend (HTST) is designed for technical analysis, particularly in markets with assets that have lower prices or price ratios. This indicator leverages the Hyperbolic Tangent Moving Average (HTMA), a custom moving average calculated using the hyperbolic tangent function, to smooth price data and reduce the impact of short-term volatility.
Hyperbolic Tangent Moving Average (HTMA):
The indicator's core uses a hyperbolic tangent function to calculate a smoothed average of the price. The HTMA provides enhanced trend-following capabilities by dampening the impact of sharp price swings and maintaining a focus on long-term market movements.
The hyperbolic tangent function (tanh) is commonly used in mathematical fields like calculus, machine learning and signal processing due to its properties of “squashing” inputs into a range between -1 and 1. The function provides a non-linear transformation that can reduce the impact of extreme values while retaining a certain level of smoothness.
tanh(x) =>
e_x = math.exp(x)
e_neg_x = math.exp(-x)
(e_x - e_neg_x) / (e_x + e_neg_x)
The HTMA is calculated by taking the difference between the price and its simple moving average (SMA), applying a multiplier to control sensitivity, and then transforming it using the hyperbolic tangent function.
htma(src, len, mul) =>
tanh_src = tanh((src - ta.sma(src, len)) * mul) * ta.stdev(src, len) + ta.sma(src, len)
htma = ta.sma(tanh_src, len)
Important Note: The Hyperbolic Tangent function becomes less accurate with very high prices. For assets priced above 100,000, the results may deteriorate, and for prices exceeding 1 million, the function may stop functioning properly. Therefore, this indicator is better suited for assets with lower prices or lower price ratios.
SuperTrend Calculation:
In addition to the HTMA, the indicator includes an Average True Range (ATR)-based SuperTrend calculation, which helps identify uptrends and downtrends in the market. The SuperTrend is adjusted dynamically using the HTMA to avoid false signals in fast-moving markets.
The ATR period and multiplier are customizable, allowing users to fine-tune the sensitivity of the trend signals.
pine_supertrend(src, calc_price, atrPeriod, factor) =>
atr = ta.atr(atrPeriod)
upperBand = src + factor * atr
lowerBand = src - factor * atr
prevLowerBand = nz(lowerBand )
prevUpperBand = nz(upperBand )
lowerBand := lowerBand > prevLowerBand or calc_price < prevLowerBand ? lowerBand : prevLowerBand
upperBand := upperBand < prevUpperBand or calc_price > prevUpperBand ? upperBand : prevUpperBand
int _direction = na
float superTrend = na
prevSuperTrend = superTrend
if na(atr )
_direction := 1
else if prevSuperTrend == prevUpperBand
_direction := calc_price > upperBand ? -1 : 1
else
_direction := calc_price < lowerBand ? 1 : -1
superTrend := _direction == -1 ? lowerBand : upperBand
Inbuilt Backtest Mode:
The HTST includes an inbuilt backtest mode that enables users to test the indicator's performance against historical data, similar to TradingView strategies.
The backtest mode allows you to compare the performance of different indicator settings with a simple buy and hold strategy to assess its effectiveness in different market conditions.
Hint Table for Display Modes:
The indicator includes a Hint Table that recommends the best pane to use for different display modes. For example, it suggests using the "Overlay" mode in the same pane as the price action, while the "Backtest Mode" is better suited for a separate pane. This ensures a more organized and clear visual experience.
The Hint Table appears as a small table at the bottom of the chart with easy-to-follow recommendations, ensuring the best setup for both visual clarity and indicator functionality.
With these features, the Hyperbolic Tangent SuperTrend Indicator offers traders a versatile and customizable tool for analyzing price trends while providing additional functionalities like backtesting and display mode hints for optimal usability.
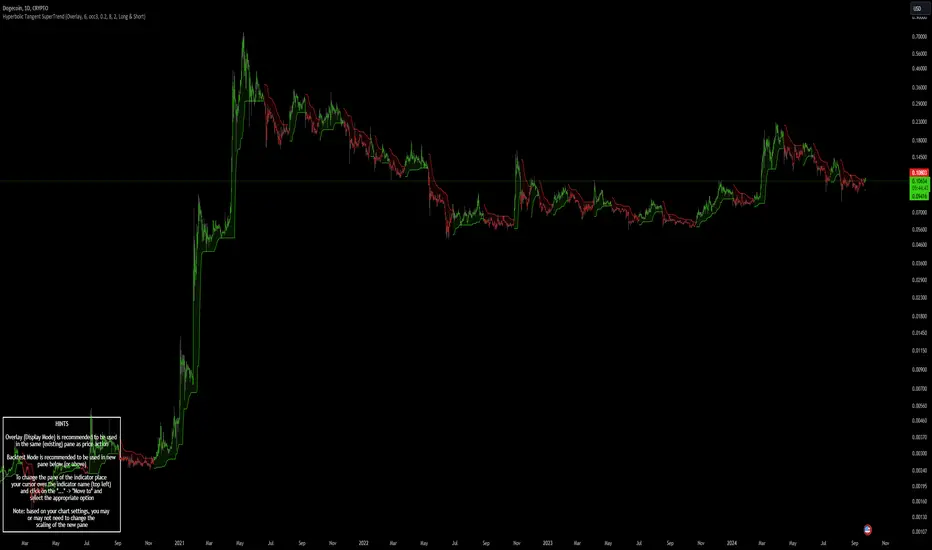
Trend Deviation strategy - BTC [IkkeOmar]Intro:
This is an example if anyone needs a push to get started with making strategies in pine script. This is an example on BTC, obviously it isn't a good strategy, and I wouldn't share my own good strategies because of alpha decay.
This strategy integrates several technical indicators to determine market trends and potential trade setups. These indicators include:
Directional Movement Index (DMI)
Bollinger Bands (BB)
Schaff Trend Cycle (STC)
Moving Average Convergence Divergence (MACD)
Momentum Indicator
Aroon Indicator
Supertrend Indicator
Relative Strength Index (RSI)
Exponential Moving Average (EMA)
Volume Weighted Average Price (VWAP)
It's crucial for you guys to understand the strengths and weaknesses of each indicator and identify synergies between them to improve the strategy's effectiveness.
Indicator Settings:
DMI (Directional Movement Index):
Length: This parameter determines the number of bars used in calculating the DMI. A higher length may provide smoother results but might lag behind the actual price action.
Bollinger Bands:
Length: This parameter specifies the number of bars used to calculate the moving average for the Bollinger Bands. A longer length results in a smoother average but might lag behind the price action.
Multiplier: The multiplier determines the width of the Bollinger Bands. It scales the standard deviation of the price data. A higher multiplier leads to wider bands, indicating increased volatility, while a lower multiplier results in narrower bands, suggesting decreased volatility.
Schaff Trend Cycle (STC):
Length: This parameter defines the length of the STC calculation. A longer length may result in smoother but slower-moving signals.
Fast Length: Specifies the length of the fast moving average component in the STC calculation.
Slow Length: Specifies the length of the slow moving average component in the STC calculation.
MACD (Moving Average Convergence Divergence):
Fast Length: Determines the number of bars used to calculate the fast EMA (Exponential Moving Average) in the MACD.
Slow Length: Specifies the number of bars used to calculate the slow EMA in the MACD.
Signal Length: Defines the number of bars used to calculate the signal line, which is typically an EMA of the MACD line.
Momentum Indicator:
Length: This parameter sets the number of bars over which momentum is calculated. A longer length may provide smoother momentum readings but might lag behind significant price changes.
Aroon Indicator:
Length: Specifies the number of bars over which the Aroon indicator calculates its values. A longer length may result in smoother Aroon readings but might lag behind significant market movements.
Supertrend Indicator:
Trendline Length: Determines the length of the period used in the Supertrend calculation. A longer length results in a smoother trendline but might lag behind recent price changes.
Trendline Factor: Specifies the multiplier used in calculating the trendline. It affects the sensitivity of the indicator to price changes.
RSI (Relative Strength Index):
Length: This parameter sets the number of bars over which RSI calculates its values. A longer length may result in smoother RSI readings but might lag behind significant price changes.
EMA (Exponential Moving Average):
Fast EMA: Specifies the number of bars used to calculate the fast EMA. A shorter period results in a more responsive EMA to recent price changes.
Slow EMA: Determines the number of bars used to calculate the slow EMA. A longer period results in a smoother EMA but might lag behind recent price changes.
VWAP (Volume Weighted Average Price):
Default settings are typically used for VWAP calculations, which consider the volume traded at each price level over a specific period. This indicator provides insights into the average price weighted by trading volume.
backtest range and rules:
You can specify the start date for backtesting purposes.
You can can select the desired trade direction: Long, Short, or Both.
Entry and Exit Conditions:
LONG:
DMI Cross Up: The Directional Movement Index (DMI) indicates a bullish trend when the positive directional movement (+DI) crosses above the negative directional movement (-DI).
Bollinger Bands (BB): The price is below the upper Bollinger Band, indicating a potential reversal from the upper band.
Momentum Indicator: Momentum is positive, suggesting increasing buying pressure.
MACD (Moving Average Convergence Divergence): The MACD line is above the signal line, indicating bullish momentum.
Supertrend Indicator: The Supertrend indicator signals an uptrend.
Schaff Trend Cycle (STC): The STC indicates a bullish trend.
Aroon Indicator: The Aroon indicator signals a bullish trend or crossover.
When all these conditions are met simultaneously, the strategy considers it a favorable opportunity to enter a long trade.
SHORT:
DMI Cross Down: The Directional Movement Index (DMI) indicates a bearish trend when the negative directional movement (-DI) crosses above the positive directional movement (+DI).
Bollinger Bands (BB): The price is above the lower Bollinger Band, suggesting a potential reversal from the lower band.
Momentum Indicator: Momentum is negative, indicating increasing selling pressure.
MACD (Moving Average Convergence Divergence): The MACD line is below the signal line, signaling bearish momentum.
Supertrend Indicator: The Supertrend indicator signals a downtrend.
Schaff Trend Cycle (STC): The STC indicates a bearish trend.
Aroon Indicator: The Aroon indicator signals a bearish trend or crossover.
When all these conditions align, the strategy considers it an opportune moment to enter a short trade.
Disclaimer:
THIS ISN'T AN OPTIMAL STRATEGY AT ALL! It was just an old project from when I started learning pine script!
The backtest doesn't promise the same results in the future, always do both in-sample and out-of-sample testing when backtesting a strategy. And make sure you forward test it as well before implementing it!
Furthermore this strategy uses both trend and mean-reversion systems, that is usually a no-go if you want to build robust trend systems .
Don't hesitate to comment if you have any questions or if you have some good notes for a beginner.

Pivot Percentile Trend - Strategy [presentTrading]
█ Introduction and How it is Different
The "Pivot Percentile Trend - Strategy" from PresentTrading represents a paradigm shift in technical trading strategies. What sets this strategy apart is its innovative use of pivot percentiles, a method that goes beyond traditional indicator-based analyses. Unlike standard strategies that might depend on single-dimensional signals, this approach takes a multi-layered view of market movements, blending percentile calculations with SuperTrend indicators for a more nuanced and dynamic market analysis.
This strategy stands out for its ability to process multiple data points across various timeframes and pivot lengths, thereby capturing a broader and more detailed picture of market trends. It's not just about following the price; it's about understanding its position in the context of recent historical highs and lows, offering a more profound insight into potential market movements.
BTC 6h L/S
Where traditional methods might react to market changes, the Pivot Percentile Trend strategy anticipates them, using a calculated approach to identify trend strengths and weaknesses. This foresight gives traders a significant advantage, allowing for more strategic decision-making and potentially increasing the chances of successful trades.
In essence, this strategy introduces a more comprehensive and proactive approach to trading, harnessing the power of advanced percentile calculations combined with the robustness of SuperTrend indicators. It's a strategy designed for traders who seek a deeper understanding of market dynamics and a more calculated approach to their trading decisions.
Local picture
█ Strategy, How It Works: Detailed Explanation
🔶 Percentile Calculations
- The strategy employs percentile calculations to assess the relative position of current market prices against historical data.
- For a set of lengths (e.g., `length * 1`, `length * 2`, up to `length * 7`), it calculates the 75th percentile for high values (`percentilesHigh`) and the 25th percentile for low values (`percentilesLow`).
- These percentiles provide a sense of where the current price stands compared to recent price ranges.
Length - 10
Length - 15
🔶 SuperTrend Indicator
- The SuperTrend indicator is a key component, providing trend direction signals.
- It uses the `currentTrendValue`, derived from the difference between bull and bear strengths calculated from the percentile data.
* used the Supertrend toolkit by @EliCobra
🔶 Trend Strength Counts
- The strategy calculates counts of bullish and bearish indicators based on comparisons between the current high and low against high and low percentiles.
- `countBull` and `countBear` track the number of times the current high is above the high percentiles and the current low is below the low percentiles, respectively.
- Weak bullish (`weakBullCount`) and bearish (`weakBearCount`) counts are also determined by how often the current lows and highs fall within the percentile range.
*The idea of this strength counts mainly comes from 'Trend Strength Over Time' @federalTacos5392b
🔶 Trend Value Calculation
- The `currentTrendValue` is a crucial metric, computed as `bullStrength - bearStrength`.
- It indicates the market's trend direction, where a positive value suggests a bullish trend and a negative value indicates a bearish trend.
🔶 Trade Entry and Exit Logic
- The entry points for trades are determined by the combination of the trend value and the direction indicated by the SuperTrend indicator.
- For a long entry (`shouldEnterLong`), the `currentTrendValue` must be positive and the SuperTrend indicator should show a downtrend.
- Conversely, for a short entry (`shouldEnterShort`), the `currentTrendValue` should be negative with the SuperTrend indicating an uptrend.
- The strategy closes positions when these conditions reverse.
█ Trade Direction
The strategy is versatile, allowing traders to choose their preferred trading direction: long, short, or both. This flexibility enables traders to tailor their strategies to their market outlook and risk appetite.
█ Default Settings and Customization
1. Trade Direction: Selectable as Long, Short, or Both, affecting the type of trades executed.
2. Indicator Source: Pivot Percentile Calculations, key for identifying market trends and reversals.
3. Lengths for Percentile Calculation: Various configurable lengths, influencing the scope of trend analysis.
4. SuperTrend Settings: ATR Length 20, Multiplier 18, affecting indicator sensitivity and trend detection.
5. Style Options: Custom colors for bullish (green) and bearish (red) trends, aiding visual interpretation.
6. Additional Settings: Includes contrarian signals and UI enhancements, offering strategic and visual flexibility.

Aleem Trend Supertrend EMA Title: "Supertrend and 200 EMA Crossover Strategy"
Description:
This script is designed to provide traders with a robust and original trading strategy by combining the Supertrend indicator with a 200-period Exponential Moving Average (EMA). The core concept is to utilize the strengths of both indicators to determine optimal entry and exit points.
The Supertrend indicator is well-regarded for its precision in signaling trend reversals by considering the volatility of the market, as measured by the Average True Range (ATR). It is particularly useful for identifying ongoing trends and potential reversals.
The 200 EMA is a widely-used indicator that many traders look to as a determinant of the long-term trend. When the price is above the 200 EMA, the overall market sentiment is considered bullish, and when below, bearish.
By combining these two, the script generates a Buy signal under the following conditions:
When the Supertrend turns bullish (color changes from red to green) with the closing price above the 200 EMA, or
When the price crosses above the 200 EMA while the Supertrend is already green.
A Sell signal is generated when:
The Supertrend turns bearish (color changes from green to red) with the closing price below the 200 EMA, or
The price crosses below the 200 EMA while the Supertrend is already red.
To avoid repetitive signals and to maintain clarity, the script has been enhanced with a feature to prevent multiple consecutive Buy or Sell signals. Once a Buy or Sell signal is generated, the script will not produce another identical signal until an opposing signal or an exit condition is met.
Exit signals for both Buy and Sell positions are provided to indicate when the trend is weakening or reversing, based on the Supertrend's color change in relation to the 200 EMA.
This strategy is flexible and can be utilized across various time frames and asset classes. It aims to aid traders in making more informed decisions by highlighting potential reversals and continuations in the market trend.
Usage:
To use this script, traders should observe the Buy and Sell signals as potential entry points. Exit signals should be taken as prompts to close positions or to protect profits with stop-loss adjustments. As with all strategies, it's recommended to use this in conjunction with other analysis methods and to backtest thoroughly before live implementation.
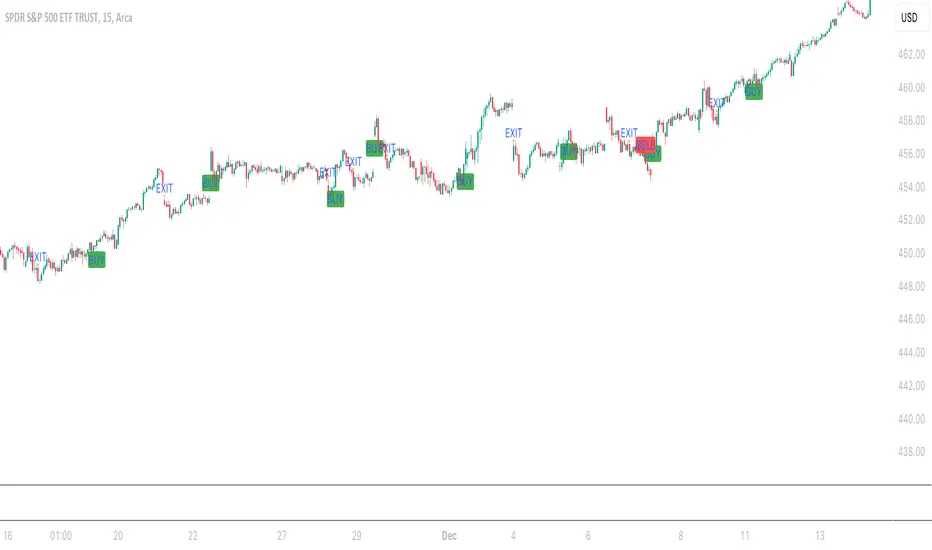
FlexiMA Variance Tracker - Strategy [presentTrading]█ Introduction and How It Is Different
The FlexiMA Variance Tracker by PresentTrading introduces a novel approach to technical trading strategies. Unlike traditional methods, it calculates deviations between a chosen indicator source (such as price or average) and a moving average with a variable length. This flexibility is achieved through a unique combination of a starting factor and an increment factor, allowing the moving average to adapt dynamically within a specified range. This strategy provides a more responsive and nuanced view of market trends, setting it apart from standard trading methodologies.
BTC 8h L/S
Local
█ Strategy, How It Works: Detailed Explanation
The FlexiMA Variance Tracker, developed by PresentTrading, stands at the forefront of trading strategies, distinguished by its adaptive and multifaceted approach to market analysis. This strategy intricately weaves various technical elements to construct a comprehensive trading logic. Here's an in-depth professional breakdown:
🔶Foundation on Variable-Length Moving Averages:
Central to this strategy is the concept of variable-length Moving Averages (MAs). Unlike traditional MAs with a fixed period, this strategy dynamically adjusts the length of the MA based on a starting factor and an incremental factor. This approach allows the strategy to adapt to market volatility and trend strength more effectively.
Each MA iteration offers a distinct temporal perspective, capturing short-term price movements to long-term trends. This aggregation of various time frames provides a richer and more nuanced market analysis, essential for making informed trading decisions.
🔶Deviation Analysis and Normalization:
The strategy calculates deviations of the price (or the chosen indicator source) from each of these MAs. These deviations are pivotal in identifying the immediate market direction relative to the average trend captured by each MA.
To standardize these deviations for comparability, they undergo a normalization process. The choice of normalization method (Max-Min or Absolute Sum) can significantly influence the interpretation of market conditions, offering distinct insights into price movements and trend strength.
🔹Normalization: Absolute Sum
🔶Composite Oscillator Construction:
A composite oscillator is derived from the median of these normalized deviations. The median serves as a balanced and robust central trend indicator, minimizing the impact of outliers and market noise.
Additionally, the standard deviation of these deviations is computed, providing a measure of market volatility. This volatility indicator is crucial for assessing market risk and can guide traders in setting appropriate stop-loss and take-profit levels.
🔶Integration with SuperTrend Indicator:
The FlexiMA strategy integrates the SuperTrend indicator, renowned for its effectiveness in identifying trend direction and reversals. The SuperTrend's incorporation enhances the strategy's ability to filter out false signals and confirm genuine market trends.
* The SuperTrend Toolkit is made by @QuantiLuxe
This combination of the variable-length MA oscillator with the SuperTrend indicator forms a potent duo, offering traders a dual-confirmation mechanism for trade signals.
🔹Supertrend's incorporation
🔶Strategic Trade Signal Generation:
Trade signals are generated when there is a confluence between the composite oscillator and the SuperTrend indicator. For example, a long position signal might be considered when the oscillator suggests an uptrend, and the SuperTrend flips to bullish.
The strategy's parameters are fully customizable, enabling traders to tailor the signal generation process to their specific trading style, risk tolerance, and market conditions.
█ Usage
To effectively employ the FlexiMA Variance Tracker strategy:
Traders should set their desired trade direction and fine-tune the starting and increment factors according to their market analysis and risk tolerance.
Indicator Length: 5
Indicator Length: 40
The strategy is suitable for a wide range of markets and can be adapted to different time frames, making it a versatile tool for various trading scenarios.
█ Default Settings Impact on Performance: FlexiMA Variance Tracker
1. Trade Direction (Configurable: Long, Short, Both): Determines trade types. 'Long' for buying, 'Short' for selling, 'Both' adapts to market trends.
2. Indicator Source: HLC3: Balances market sentiment by considering high, low, and close, providing comprehensive period analysis.
4. Indicator Length (Default: 10): Baseline for moving averages. Shorter lengths increase responsiveness but add noise, while longer lengths favor trends.
5. Starting and Increment Factor (Default: 1.0): Adjusts MA lengths range. Higher values capture broad market dynamics, lower values focus analysis.
6. Normalization Method (Options: None, Max-Min, Absolute Sum): Standardizes deviations. 'None' for raw deviations, 'Max-Min' for relative scaling, 'Absolute Sum' emphasizes relative strength.
7. SuperTrend Settings (ATR Length: 10, Multiplier: 15.0): Influences indicator sensitivity. Short ATR or high multiplier for short-term, long ATR or low multiplier for long-term trends.
8. Additional Settings (Mesh Style, Color Customization): Enhances visual clarity. Mesh style for detailed deviation view, colors for quick market condition identification.

AI SuperTrend - Strategy [presentTrading]
█ Introduction and How it is Different
The AI Supertrend Strategy is a unique hybrid approach that employs both traditional technical indicators and machine learning techniques. Unlike standard strategies that rely solely on traditional indicators or mathematical models, this strategy integrates the power of k-Nearest Neighbors (KNN), a machine learning algorithm, with the tried-and-true SuperTrend indicator. This blend aims to provide traders with more accurate, responsive, and context-aware trading signals.
*The KNN part is mainly referred from @Zeiierman.
BTCUSD 8hr performance
ETHUSD 8hr performance
█ Strategy, How it Works: Detailed Explanation
SuperTrend Calculation
Volume-Weighted Moving Average (VWMA): A VWMA of the close price is calculated based on the user-defined length (len). This serves as the central line around which the upper and lower bands are calculated.
Average True Range (ATR): ATR is calculated over a period defined by len. It measures the market's volatility.
Upper and Lower Bands: The upper band is calculated as VWMA + (factor * ATR) and the lower band as VWMA - (factor * ATR). The factor is a user-defined multiplier that decides how wide the bands should be.
KNN Algorithm
Data Collection: An array (data) is populated with recent n SuperTrend values. Corresponding labels (labels) are determined by whether the weighted moving average price (price) is greater than the weighted moving average of the SuperTrend (sT).
Distance Calculation: The absolute distance between each data point and the current SuperTrend value is calculated.
Sorting & Weighting: The distances are sorted in ascending order, and the closest k points are selected. Each point is weighted by the inverse of its distance to the current point.
Classification: A weighted sum of the labels of the k closest points is calculated. If the sum is closer to 1, the trend is predicted as bullish; if closer to 0, bearish.
Signal Generation
Start of Trend: A new bullish trend (Start_TrendUp) is considered to have started if the current trend color is bullish and the previous was not bullish. Similarly for bearish trends (Start_TrendDn).
Trend Continuation: A bullish trend (TrendUp) is considered to be continuing if the direction is negative and the KNN prediction is 1. Similarly for bearish trends (TrendDn).
Trading Logic
Long Condition: If Start_TrendUp or TrendUp is true, a long position is entered.
Short Condition: If Start_TrendDn or TrendDn is true, a short position is entered.
Exit Condition: Dynamic trailing stops are used for exits. If the trend does not continue as indicated by the KNN prediction and SuperTrend direction, an exit signal is generated.
The synergy between SuperTrend and KNN aims to filter out noise and produce more reliable trading signals. While SuperTrend provides a broad sense of the market direction, KNN refines this by predicting short-term price movements, leading to a more nuanced trading strategy.
Local picture
█ Trade Direction
The strategy allows traders to choose between taking only long positions, only short positions, or both. This is particularly useful for adapting to different market conditions.
█ Usage
ToolTips: Explains what each parameter does and how to adjust them.
Inputs: Customize values like the number of neighbors in KNN, ATR multiplier, and moving average type.
Plotting: Visual cues on the chart to indicate bullish or bearish trends.
Order Execution: Based on the generated signals, the strategy will execute buy/sell orders.
█ Default Settings
The default settings are selected to provide a balanced approach, but they can be modified for different trading styles and asset classes.
Initial Capital: $10,000
Default Quantity Type: 10% of equity
Commission: 0.1%
Slippage: 1
Currency: USD
By combining both machine learning and traditional technical analysis, this strategy offers a sophisticated and adaptive trading solution.
