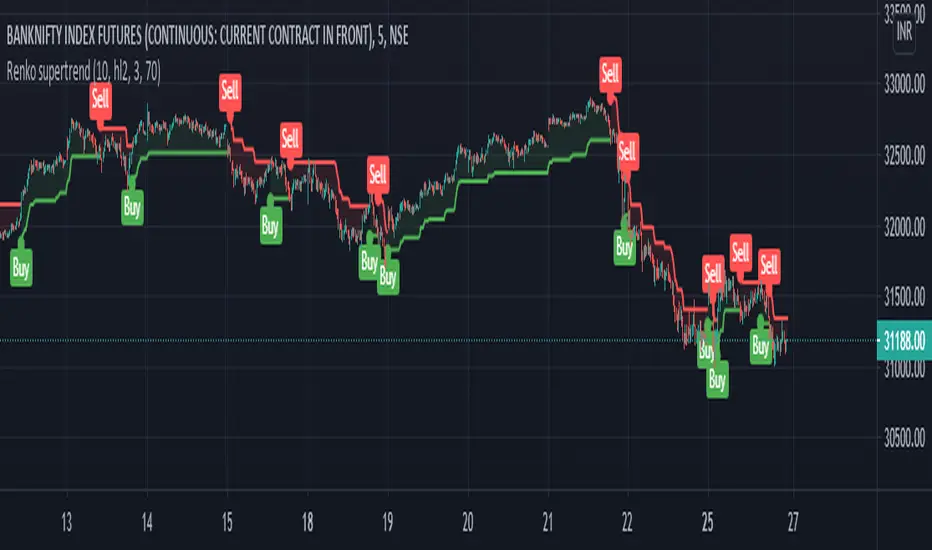
Renko supertrend by Ak
hi friends....publishing Renko supertrend indicator.
Renko charts are a great way to help those who can be spooked by the chaos of the markets (I'm one!), but they have a big drawback in that the price you see on renko chart is often significantly different from the real price that you would trade on. This brings issues of unrealistic expectations of profits/losses, and also makes back testing a strategy very difficult. I still wouldn't recommend ever using TradingView's "strategy" tool when using renko charts, but using this indicator you can do accurate manual back tests.
U have to chose box size..so its not repaint when u refresh chart..bcs on atr based chart its repaint when u refresh chart.
This uses Renko boxes as source on normal chart..don't use it on renko charts
There is an option for use normal japanes candle supertrend..so we can compare how this renko chart prevent false trades.
"supertrend" için komut dosyalarını ara
##Liquidity weighted Supertrend with MA Ribbon by AngelVery useful 2 indicators in 1. 2 liquidity weighted supertrends; all customizable settings to your likings and a 4 ma ribbon. MA 1 and 2 gives you buy/sell signal on the crossover and added a background trend color change for easy visual of price trend! enjoy!

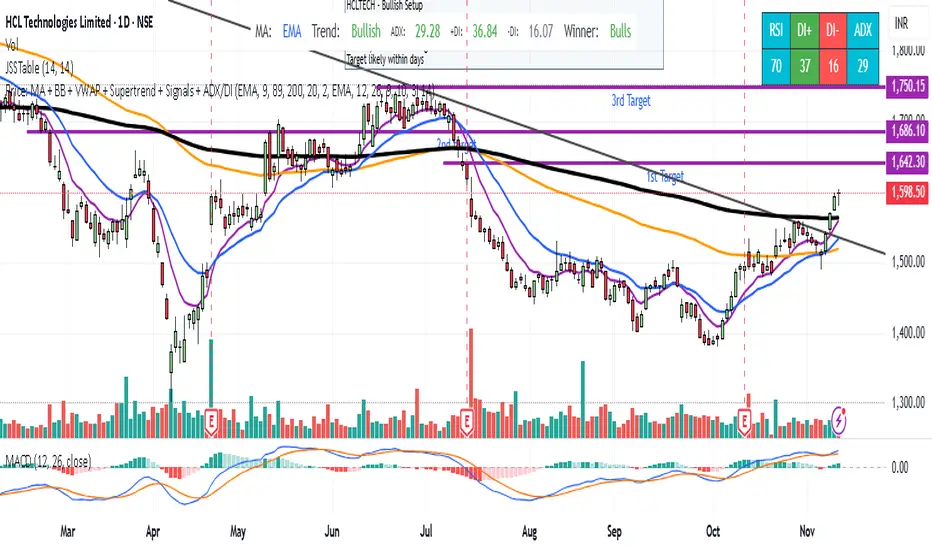
MA+BB+VWAP+Supertrend by JPthis indicator has combination of
1) Moving averages (4 moving averages , SMA & EMA both)
2) Bollinger Band
3) Vwap
4) SuperTrend.
Single indicator to make trader's life easy.
Easy Strategy BuilderHello, I focused on making this indicator as user-friendly as possible while designing it. I avoided complex structures, and as a result, I believe I have created an indicator that everyone can easily use.
With the Strategy Builder indicator, you can automate the strategy you use and visualize signals on the chart. This allows you to scale your strategy and stay informed of new signals through alerts.
How it works?
Firstly, we need to determine the entry condition for the trade. For this, you have 15 different sources at your disposal.
1. Price
2. RSI
3. RSI MA
4. CCI
5. STOCH K
6. STOCH D
7. MA 1
8. MA 2
9. ATR
10. DMI+
11. DMI-
12. SUPERTREND
13. BB Lower
14. BB Middle
15. BB Upper
Using the relationship between these sources or with a key level, we can generate signals. There are 7 different conditions available to control this relationship.
1. > x is greater than y
2. > = x is greater than or equal to y
3. < x is less than y
4. ≤ x is less than or equal to y
5. = x is equal to y
6. Cross Up = x has crossed above y. One bar ago, x was less than y, now x is greater than y.
7. Cross Down = x has crossed below y. One bar ago, x was greater than y, now x is less than y.
Let’s make a few examples
1.
- Entry Condition: RSI crosses above RSI moving average.
- Exit Condition: RSI crosses below RSI moving average.
Let's use more than one condition together
2.
Entry Condition: rsi<30 ve rsi cross up rsi Ma
Exit Condition: Rsi>70 ve rsi cross down rsi Ma
Let's strengthen the signal by adding different indicators and price.
3.
Entry Condition: rsi<30 and price70 and price> bb middle and rsi cross down rsi ma
What if things go wrong? Let's add stop loss
4.
Entry Condition: rsi<30 and price70 and price> bb higher and rsi cross down rsi ma
Stoploss: %2
That's how simple it is to create a strategy. Need a more complex strategy? Feel free to contact me.
Important notes:
1. Avoid continuously triggered conditions.
Example:
Entry Condition: RSI > 0
2. Determine logical entry and exit conditions.
3. Avoid placing stop losses too close to entry points.

Multiple Indicators ScreenerA screener for multiple indicators with nice table output.
I was asked many times to update custom screener to display results in a table form. This way it looks much better.
You can play with background colors depend on values you're looking for.
In the screener, for example, I'm highlighting overbought/oversold RSI values, big ADX levels and trend of the Supertrend.
In parameters you can change settings for all indicators and change/disable tickers if 40 is too many for you.
There is only 1 function that calculates all these indicators. Potentially you can change and even add more indicators to this function.
Writing code for these kind of screener is a bit time consuming, so I even created a code generator in Python for these kind of indicators :) .
Disclaimer
Please remember that past performance may not be indicative of future results.
Due to various factors, including changing market conditions, the strategy may no longer perform as well as in historical backtesting.
This post and the script don’t provide any financial advice.

Multi-Timeframe Supertrend + MACD + MTF Dashboard if you like it click source code and save it in notepad for back up .
The Multi-Timeframe Supertrend Dashboard is a powerful tool designed to give traders a clear view of market trends across multiple timeframes, all from a single dashboard. This indicator leverages the Supertrend method to calculate buy and sell signals based on the direction of price relative to dynamically calculated support and resistance lines. The dashboard is optimized for dark mode and provides easy-to-interpret color-coded signals for each timeframe.
How It Works
The Supertrend indicator is a trend-following indicator that uses the Average True Range (ATR) to set upper and lower bands around the price, adapting dynamically as volatility changes. When the price is above the Supertrend line, the market is considered in an uptrend, triggering a "BUY" signal. Conversely, when the price falls below the Supertrend line, the market is in a downtrend, triggering a "SELL" signal.
This Multi-Timeframe Supertrend Dashboard calculates Supertrend signals for the following timeframes:
1 minute
5 minutes
15 minutes
1 hour
Daily
Weekly
Monthly
For each timeframe, the dashboard shows either a "BUY" or "SELL" signal, allowing traders to assess whether trends align across timeframes. A "BUY" signal displays in green, and a "SELL" signal displays in red, giving a quick visual reference of the overall trend direction for each timeframe.
Customization Options
ATR Period: Defines the period for the Average True Range (ATR) calculation, which determines how responsive the Supertrend lines are to changes in market volatility.
Multiplier: Sets the sensitivity of the Supertrend bands to price movements. Higher values make the bands less sensitive, while lower values increase sensitivity, allowing quicker reactions to changes in price.
How to Interpret the Dashboard
The Multi-Timeframe Supertrend Dashboard allows traders to see at a glance if trends across multiple timeframes are aligned. Here’s how to interpret the signals:
BUY (Green): The current timeframe’s price is in an uptrend based on the Supertrend calculation.
SELL (Red): The current timeframe’s price is in a downtrend based on the Supertrend calculation.
For example:
If all timeframes display "BUY," the asset is in a strong uptrend across multiple time horizons, which may indicate a bullish market.
If all timeframes display "SELL," the asset is likely in a strong downtrend, signaling a bearish market.
Mixed signals across timeframes suggest market consolidation or differing trends across short- and long-term periods.
Use Cases
Trend Confirmation: Use the dashboard to confirm trends across multiple timeframes before entering or exiting a position.
Quick Market Analysis: Get a snapshot of market conditions across timeframes without having to change charts.
Multi-Timeframe Alignment: Identify alignment across timeframes, which is often a strong indicator of market momentum in one direction.
Dark Mode Optimization
The dashboard has been optimized for dark mode, with white text and contrasting background colors to ensure easy readability on darker TradingView themes.
Nov 4, 2024
Release Notes
Multi-Timeframe Supertrend Dashboard with Alerts
Overview
The Multi-Timeframe Supertrend Dashboard with Alerts is a powerful indicator designed to give traders a comprehensive view of market trends across multiple timeframes. This dashboard uses the Supertrend method to calculate buy and sell signals based on the direction of price relative to dynamic support and resistance levels. The indicator is optimized for dark mode and provides a color-coded display of buy and sell signals for each timeframe, along with optional alerts for trend alignment.
How It Works
The Supertrend indicator is a trend-following indicator that uses the Average True Range (ATR) to set upper and lower bands around the price, adjusting dynamically with market volatility. When the price is above the Supertrend line, the market is considered in an uptrend, triggering a "BUY" signal. Conversely, when the price falls below the Supertrend line, the market is in a downtrend, triggering a "SELL" signal.
The Multi-Timeframe Supertrend Dashboard displays Supertrend signals for the following timeframes:
1 minute
5 minutes
15 minutes
1 hour
Daily
Weekly
Monthly
For each timeframe, the dashboard shows either a "BUY" or "SELL" signal, allowing traders to assess trend alignment across multiple timeframes with a single glance. A "BUY" signal displays in green, and a "SELL" signal displays in red.
Alerts for Trend Alignment
This indicator includes built-in alert conditions that allow traders to receive notifications when all timeframes simultaneously align in a "BUY" or "SELL" signal. This is particularly useful for identifying moments of strong trend alignment across short-term and long-term timeframes. The alerts can be set to notify the trader when:
All timeframes display a "BUY" signal, indicating a strong bullish alignment across all time horizons.
All timeframes display a "SELL" signal, signaling a strong bearish alignment.
Customization Options
ATR Period: Defines the period for the Average True Range (ATR) calculation, which determines how responsive the Supertrend lines are to changes in market volatility.
Multiplier: Sets the sensitivity of the Supertrend bands to price movements. Higher values make the bands less sensitive, while lower values increase sensitivity, allowing quicker reactions to changes in price.
How to Interpret the Dashboard
BUY (Green): The price is above the Supertrend line, indicating an uptrend for that timeframe.
SELL (Red): The price is below the Supertrend line, indicating a downtrend for that timeframe.
Examples:
If all timeframes display "BUY," the asset is in a strong uptrend across multiple time horizons, signaling potential buying opportunities.
If all timeframes display "SELL," the asset is likely in a strong downtrend, signaling potential selling opportunities.
Mixed signals suggest a consolidation phase or differing trends across short- and long-term periods.
Use Cases
Trend Confirmation: Use the dashboard to confirm trends across multiple timeframes before entering or exiting a position.
Alert Notifications: Set alerts to receive notifications when all timeframes align in a "BUY" or "SELL" signal.
Quick Market Analysis: Get an instant overview of market conditions without switching between charts.
Multi-Timeframe Alignment: Identify alignment across timeframes, often a strong indicator of market momentum in one direction.
Dark Mode Optimization
The dashboard has been optimized for dark mode, with white text and contrasting background colors to ensure easy readability on darker TradingView themes.
Nov 6, 2024
Release Notes
Multi-Timeframe Supertrend Dashboard with Custom Alerts
Description:
This Multi-Timeframe Supertrend Dashboard indicator provides a powerful tool for traders who want to monitor multiple timeframes simultaneously and receive alerts when all timeframes align on a single trend (either BUY or SELL). The indicator uses the popular Supertrend calculation, with customizable ATR (Average True Range) period and multiplier values to tailor sensitivity to your trading style.
Key Features:
Customizable Timeframes:
Track and display up to six timeframes, fully configurable to meet any trading strategy. The default timeframes include 1 Minute, 5 Minutes, 15 Minutes, 1 Hour, 1 Day, and 1 Week but can be changed to any intervals supported by TradingView.
Selective Display Options:
With a user-friendly display selection, you can choose which timeframes to show on the dashboard. For example, you may choose to view only Timeframe 1 through Timeframe 5 or any combination of the six.
Real-Time Alignment Alerts:
Alerts can be set to trigger when all selected timeframes align on a BUY or SELL signal. This feature enables traders to catch strong trends across timeframes without constant monitoring. Alerts are fully configurable, allowing for sound notifications, email alerts, or even webhook notifications to automated trading systems.
Custom Supertrend Settings:
Adjust the ATR Period and Multiplier values to control the Supertrend's sensitivity. Lower values result in more frequent trend changes, while higher values smooth out the trend and focus on larger market moves.
Intuitive Color-Coded Dashboard:
The dashboard is visually optimized for quick insights:
Green cells indicate a BUY trend.
Red cells indicate a SELL trend.
Background color changes when all selected timeframes align, giving an instant visual cue for strong trends.
How to Use:
Select Timeframes:
Go to the input settings to choose the timeframes you want to monitor. Each timeframe is labeled (e.g., Timeframe 1, Timeframe 2) for easy reference.
Configure Display Preferences:
Enable or disable specific timeframes to customize your dashboard view. This is useful for focusing only on timeframes relevant to your strategy.
Set ATR and Multiplier Values:
Adjust these settings to define the Supertrend calculation's responsiveness. This customization allows adaptation to various markets, including stocks, forex, and cryptocurrencies.
Enable Alerts:
Turn on alerts to receive notifications when all active timeframes align. Customize the alert type and delivery (sound, popup, email, etc.) to ensure you’re notified on time.
Ideal For:
Trend Traders who want confirmation of trends across multiple timeframes.
Scalpers and Day Traders looking for quick trend changes with smaller timeframes.
Swing Traders who want a broader overview of market alignment across hourly and daily frames.
Automated System Developers looking for reliable signals across multiple timeframes to integrate with other strategies.

3TF Supertrend Resonance— 4H/1H/15m+ 3TP/SLMTF Supertrend — 4H / 1H / 15m Confluence + Dynamic TP/SL + Adaptive Trend/Range Filters
This script is a multi-timeframe Supertrend confluence system designed for traders who operate on lower timeframes (15m / 1m) but want higher-timeframe structure, trend confirmation, and dynamic TP/SL projections.
It combines 4H + 1H + 15m Supertrend, trend alignment detection, range filtering, and auto-projected risk-based targets, providing a complete directional framework for both scalping and intraday swing entries.
👉1. Multi-Timeframe Supertrend Framework (4H / 1H / 15m)
The script calculates Supertrend levels and direction on three major timeframes:
-4H Supertrend
-1H Supertrend
-15m Supertrend
Users can choose between:
-Confirmed HTF values (no repaint)
-Live HTF values (more sensitive but may repaint)
Each Supertrend level is plotted on the current chart as a horizontal line, extended far to the left and slightly to the right, with optional lightweight labels showing direction and price.
These levels function as HTF dynamic support/resistance during intraday trading.
👉2. Confluence Detection (4H = 1H = 15m)
A trend confluence occurs when:
-4H direction = 1H direction = 15m direction
When the three timeframes align:
A full-height vertical line marks the first candle of confluence (color-coded bullish/bearish).
An alert is triggered:
“Triple-TF Trend Confluence — First Candle”
This identifies the earliest moment when the market shifts into unified directional behavior.
👉3. Trend Background Coloring (15m + 1m)
When confluence is active:
-Bullish confluence → Green background
-Bearish confluence → Red background
Background visualization is applied on:
-15m timeframe (main directional chart)
-1m timeframe (scalping entries with HTF alignment)
This ensures lower-timeframe decisions always stay aligned with higher-timeframe direction.
👉4. Weak-Trend / Range Detection (Only on 15m)
Even if all three timeframes are aligned, momentum may be weak.
Range/weak-trend detection activates when:
-Confluence = true
-AND (ADX < threshold OR Choppiness > threshold)
On 15m charts:
A grey overlay appears, covering green/red confluence colors.
First candle entering range shows a vertical grey mark (optional).
Alert:
“Confluence but Weak Momentum — First Candle”
This identifies moments where the market is aligned but lacking trend strength — a “trend that doesn’t move.”
👉5. Dynamic TP/SL Projection (1.5R / 3R / 4.5R)
Using the current timeframe’s Supertrend as a structural stop-loss:
SL = current Supertrend line
Risk = | Close - SL |
The script auto-calculates:
TP1 = 1.5 × risk
TP2 = 3.0 × risk
TP3 = 4.5 × risk
All projected upward for bullish trends and downward for bearish trends.
Displayed visually:
Dotted short-range lines for SL, TP1, TP2, TP3
Lightweight left-side labels showing:
SL price + distance
Individual TP prices
This provides an immediate R-multiple framework for trade planning.
👉6. 15m Supertrend Flip Indicator (Minimalistic)
When the 15m Supertrend changes direction:
A tiny circle marker is plotted:
-Bullish flip → below the bar, green
-Bearish flip → above the bar, red
Alerts:
“15m ST Flip Up (Bear → Bull)”
“15m ST Flip Down (Bull → Bear)”
This highlights early shifts in short-term structure before confluence or major trend changes occur.
👉7. Alerts Included
The script provides alerts for:
-Triple-TF Trend Confluence — First Candle
-Weak Trend / Range Start
-15m Supertrend Flip Up
-15m Supertrend Flip Down
These are practical for automated notifications when key structural conditions appear.
Summary
This script provides:
✅ Higher-Timeframe Context
4H, 1H, and 15m Supertrend levels + direction.
✅ Directional Certainty
Triple-timeframe confluence with visual + alert confirmation.
✅ Smart Background Guidance
Color-coded trend zones for 15m & 1m.
✅ Range / Weak Trend Filtering
Avoid false trends using ADX + Choppiness.
✅ Actionable TP/SL Framework
Auto-projected 1.5R / 3R / 4.5R + SL lines based on Supertrend structure.
✅ Precise Intraday Signals
15m Supertrend flips marked with minimalistic dots.

Dema Supertrend | viResearchDema Supertrend | viResearch
Conceptual Foundation and Innovation
The "Dema Supertrend" indicator by viResearch combines the benefits of the Double Exponential Moving Average (DEMA) with the popular Supertrend method to provide an advanced tool for trend detection and volatility management. By integrating DEMA into the Supertrend calculation, the indicator reduces lag while enhancing responsiveness to market changes. This results in more accurate trend identification and a refined method for capturing directional movements.
Technical Composition and Calculation
The "Dema Supertrend" builds on the core principles of the Supertrend indicator by incorporating DEMA for smoother and more responsive trend detection. The key innovation lies in replacing the raw price data with the DEMA-smoothed values, allowing traders to identify trends with reduced noise and enhanced precision.
DEMA and ATR-Based Supertrend Calculation:
DEMA Calculation (demalen): The Double Exponential Moving Average is applied to the price data (hlc3 by default) over a user-defined length, providing a smoothed representation of the market trend. DEMA minimizes lag compared to simple or exponential moving averages, allowing for more timely trend identification.
Supertrend Bands (u, l): The Supertrend upper and lower bands are calculated by adding or subtracting a multiple of the Average True Range (ATR) from the DEMA value. These bands dynamically adjust to market volatility, acting as support and resistance levels to guide trading decisions.
Trend Logic (L, S): The script determines whether the price is above or below the bands to signal an uptrend (L) or downtrend (S). Crosses above or below these bands trigger visual alerts and trend changes, with alerts built in for potential long or short positions.
Trend Continuation and Reversal:
The indicator ensures that once a trend is identified, it persists until clear reversal criteria are met. This is achieved through a comparison of the current and previous values of the Supertrend bands, reducing the occurrence of false signals in volatile markets.
Features and User Inputs
The "Dema Supertrend" script offers a range of customizable options, allowing traders to tailor the indicator to different market conditions and trading strategies:
Supertrend Length: The length of the Supertrend period can be adjusted, allowing traders to control the sensitivity of the trend detection.
Multiplier: The ATR multiplier adjusts the distance between the DEMA and the Supertrend bands. A higher multiplier reduces the frequency of trend changes, while a lower multiplier increases sensitivity to price movements.
DEMA Length: The length of the DEMA calculation can be customized to smooth price data over different timeframes, helping traders capture long-term trends or short-term movements more effectively.
Practical Applications
The "Dema Supertrend" is an ideal tool for traders who seek to follow trends while minimizing the impact of market noise. Its combination of DEMA and Supertrend provides a clear, dynamic view of the market's direction, making it especially effective in volatile environments.
Key Uses:
- Trend Following: The Dema Supertrend helps traders align their positions with the prevailing market trend by providing clear signals for uptrends and downtrends based on DEMA-smoothened price action.
- Volatility Management: The integration of ATR ensures that the Supertrend bands adapt to changes in market volatility, allowing traders to avoid entering trades during choppy, unpredictable price movements.
- Signal Confirmation: The script includes visual and alert-based signals for trend continuation and reversal, enabling traders to confirm entries and exits with greater accuracy.
Advantages and Strategic Value
The "Dema Supertrend" offers several strategic advantages:
- Reduced Lag: By integrating DEMA into the Supertrend calculation, the indicator responds more quickly to price changes, reducing the lag inherent in traditional moving averages.
- Noise Reduction: The use of DEMA filters out short-term fluctuations, providing a clearer signal for traders looking to capture significant market trends.
- Dynamic Adjustments: The combination of ATR and DEMA allows the indicator to adapt to both trending and ranging markets, making it suitable for a variety of trading strategies.
Summary and Usage Tips
The "Dema Supertrend" is a powerful tool for trend-following traders, offering a precise and adaptive method for identifying and confirming market direction. Traders can experiment with different settings for the Supertrend and DEMA lengths, as well as the ATR multiplier, to optimize the indicator for various trading environments. For best results, use the "Dema Supertrend" in conjunction with other technical analysis tools to confirm trends and manage risk. Whether you're seeking to capture long-term market moves or react to short-term volatility, the "Dema Supertrend" provides a reliable and flexible solution for your trading strategy.

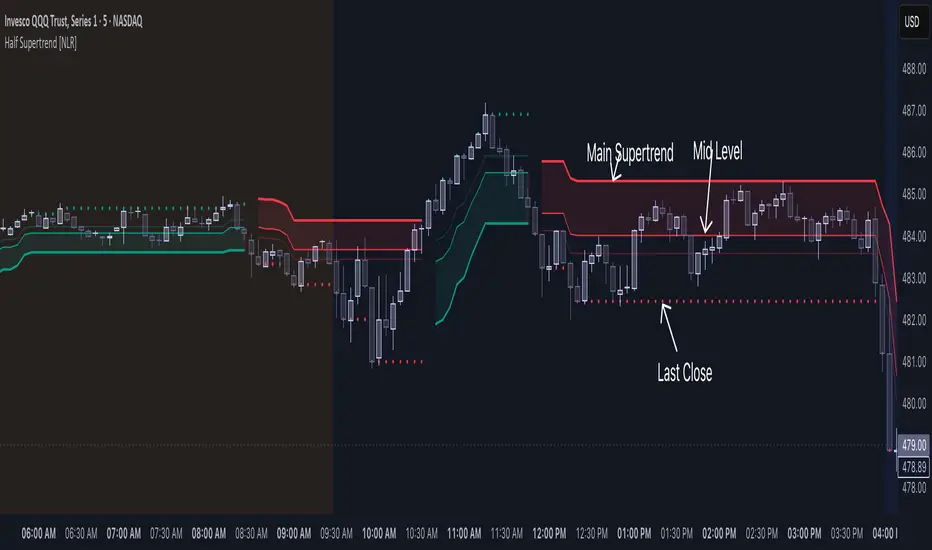
Half Supertrend [NLR]While the Supertrend is a popular tool, traders often face the challenge of false signals and uncertain entry points. The Half Supertrend indicator addresses these shortcomings by introducing a dynamic mid-level , offering a significantly improved way to identify true trend strength and potential high-probability entries.
Here's how the mid-level enhances your trend analysis:
Filter Out Noise: Instead of reacting to every Supertrend flip, the mid-level helps you identify the strength of the trend. Price moving strongly away from the mid-level confirms a higher conviction move.
Identify Optimal Pullback Entries: Waiting for price to pull back to the dynamic mid-level after a Supertrend direction change can provide better entry prices and potentially higher probability setups, capitalizing on established momentum. This approach helps avoid entering prematurely on weaker signals.
Gain Deeper Trend Insight: The position of the price relative to both the Supertrend line and the mid-level paints a clearer picture of the current trend's strength and potential for continuation or reversal.
Here's the technical edge you've been waiting for:
Enhanced Trend Confirmation: This indicator plots a mid-level derived from half the Average True Range (ATR) multiple, acting as a crucial intermediary for assessing trend strength.
Intra-Trend Strength Analysis:
Price above/below the mid-level: Indicates a strong trending move aligned with the Supertrend direction.
Price between the mid-level and the Supertrend line: Suggests a weaker trend and a higher probability of consolidation or reversal.
Early Reversal Detection: Price crossing the mid-level can serve as an early warning signal of a potential trend change.
Higher Timeframe Clarity: The user-configurable higher timeframe (HTF) input provides a robust, multi-timeframe trend bias.
Dynamic Entry Levels: Potential entry levels based on the mid-level are plotted for visual guidance.
Clear Visual Representation: Color-coded lines and filled areas simplify trend and strength assessment.
How it works under the hood:
This indicator utilizes the standard Supertrend calculation on the chosen higher timeframe, incorporating the Average True Range (ATR) to determine volatility-adjusted bands. The unique addition is the "half trend" line, calculated by adding or subtracting half of the ATR-based trailing stop value from the Supertrend line. This mid-level acts as a crucial intermediary zone for evaluating the conviction of the current trend.
// Calculate the mid-level line
half_line = supertrend + (atr * half_factor)
Key Input Parameters:
ATR Length: Determines the period for calculating the Average True Range (default: 10).
Factor: The multiplier applied to the ATR to determine the Supertrend band width (default: 3). The mid-level dynamically adjusts based on half of this factor.
Timeframe: Allows you to select a higher timeframe for the Supertrend calculation, providing a broader trend context.
Up Color/Down Color: Customize the colors for uptrend and downtrend indications.
Multi-Timeframe Supertrend Dashboard - EnhancedOverview
The Multi-Timeframe Supertrend Dashboard is a powerful tool designed to give traders a clear view of market trends across multiple timeframes, all from a single dashboard. This indicator leverages the Supertrend method to calculate buy and sell signals based on the direction of price relative to dynamically calculated support and resistance lines. The dashboard is optimized for dark mode and provides easy-to-interpret color-coded signals for each timeframe.
How It Works
The Supertrend indicator is a trend-following indicator that uses the Average True Range (ATR) to set upper and lower bands around the price, adapting dynamically as volatility changes. When the price is above the Supertrend line, the market is considered in an uptrend, triggering a "BUY" signal. Conversely, when the price falls below the Supertrend line, the market is in a downtrend, triggering a "SELL" signal.
This Multi-Timeframe Supertrend Dashboard calculates Supertrend signals for the following timeframes:
1 minute
5 minutes
15 minutes
1 hour
Daily
Weekly
Monthly
For each timeframe, the dashboard shows either a "BUY" or "SELL" signal, allowing traders to assess whether trends align across timeframes. A "BUY" signal displays in green, and a "SELL" signal displays in red, giving a quick visual reference of the overall trend direction for each timeframe.
Customization Options
ATR Period: Defines the period for the Average True Range (ATR) calculation, which determines how responsive the Supertrend lines are to changes in market volatility.
Multiplier: Sets the sensitivity of the Supertrend bands to price movements. Higher values make the bands less sensitive, while lower values increase sensitivity, allowing quicker reactions to changes in price.
How to Interpret the Dashboard
The Multi-Timeframe Supertrend Dashboard allows traders to see at a glance if trends across multiple timeframes are aligned. Here’s how to interpret the signals:
BUY (Green): The current timeframe’s price is in an uptrend based on the Supertrend calculation.
SELL (Red): The current timeframe’s price is in a downtrend based on the Supertrend calculation.
For example:
If all timeframes display "BUY," the asset is in a strong uptrend across multiple time horizons, which may indicate a bullish market.
If all timeframes display "SELL," the asset is likely in a strong downtrend, signaling a bearish market.
Mixed signals across timeframes suggest market consolidation or differing trends across short- and long-term periods.
Use Cases
Trend Confirmation: Use the dashboard to confirm trends across multiple timeframes before entering or exiting a position.
Quick Market Analysis: Get a snapshot of market conditions across timeframes without having to change charts.
Multi-Timeframe Alignment: Identify alignment across timeframes, which is often a strong indicator of market momentum in one direction.
Dark Mode Optimization
The dashboard has been optimized for dark mode, with white text and contrasting background colors to ensure easy readability on darker TradingView themes.

Power Root SuperTrend [AlgoAlpha]📈🚀 Power Root SuperTrend by AlgoAlpha - Elevate Your Trading Strategy! 🌟
Introducing the Power Root SuperTrend by AlgoAlpha, an advanced trading indicator that enhances the traditional SuperTrend by incorporating Root-Mean-Square (RMS) calculations for a more responsive and adaptive trend detection. This innovative tool is designed to help traders identify trend directions, potential take-profit levels, and optimize entry and exit points with greater accuracy, making it an excellent addition to your trading arsenal.
Key Features:
🔹 Root-Mean-Square SuperTrend Calculation : Utilizes the RMS of closing prices to create a smoother and more sensitive SuperTrend line that adapts quickly to market changes.
🔸 Multiple Take-Profit Levels : Automatically calculates and plots up to seven take-profit levels (TP1 to TP7) based on market volatility and the change in SuperTrend values.
🟢 Dynamic Trend Coloring : Visually distinguish between bullish and bearish trends with customizable colors for clearer market visualization.
📊 RSI-Based Take-Profit Signals : Incorporates the Relative Strength Index (RSI) of the distance between the price and the SuperTrend line to generate additional take-profit signals.
🔔 Customizable Alerts : Set alerts for trend direction changes, achievement of take-profit levels, and RSI-based take-profit conditions to stay informed without constant chart monitoring.
How to Use:
Add the Indicator : Add the indicator to favorites by pressing the ⭐ icon or search for "Power Root SuperTrend " in the TradingView indicators library and add it to your chart. Adjust parameters such as the ATR multiplier, ATR length, RMS length, and RSI take-profit length to suit your trading style and the specific asset you are analyzing.
Analyze the Chart : Observe the SuperTrend line and the plotted take-profit levels. The color changes indicate trend directions—green for bullish and red for bearish trends.
Set Alerts : Utilize the built-in alert conditions to receive notifications when the trend direction changes, when each TP level is drawn, or when RSI-based take-profit conditions are met.
How It Works:
The Power Root SuperTrend indicator enhances traditional SuperTrend calculations by applying a Root-Mean-Square (RMS) function to the closing prices, resulting in a more responsive trend line that better reflects recent price movements. It calculates the Average True Range (ATR) to determine the volatility and sets the upper and lower SuperTrend bands accordingly. When a trend direction change is detected—signified by the SuperTrend line switching from above to below the price or vice versa—the indicator calculates the change in the SuperTrend value. This change is then used to establish multiple take-profit levels (TP1 to TP7), each representing incremental targets based on market volatility. Additionally, the indicator computes the RSI of the distance between the current price and the SuperTrend line to generate extra take-profit signals when the RSI crosses under a specific threshold. The combination of RMS calculations, multiple TP levels, dynamic coloring, and RSI signals provides traders with a comprehensive tool for identifying trends and optimizing trade exits. Customizable alerts ensure that traders can stay updated on important market developments without needing to constantly watch the charts.
Elevate your trading strategy with the Power Root SuperTrend indicator and gain a smarter edge in the markets! 🚀✨

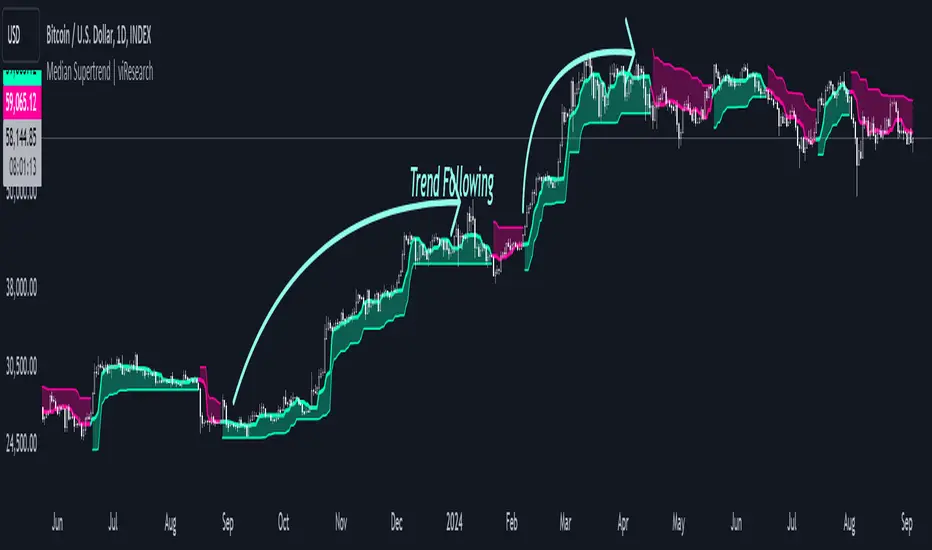
Median Supertrend | viResearchMedian Supertrend | viResearch
Conceptual Foundation and Innovation
The "Median Supertrend" indicator, developed by viResearch, offers a unique approach to identifying trends by combining a median-based smoothing mechanism with a modified Supertrend calculation. Unlike the traditional Supertrend, which relies solely on price data, this version calculates a median percentile of the closing price over a specified length, resulting in a more accurate representation of underlying trends.
Technical Composition and Calculation
The "Median Supertrend" enhances the conventional Supertrend formula by introducing improvements to minimize lag and improve responsiveness to market volatility.
Median Smoothing:
The script uses the 50th percentile of the closing price over a user-defined period to provide a smoother representation of price movements, reducing the influence of short-term price spikes or dips for more stable trend analysis.
Supertrend Calculation:
The indicator applies the Average True Range (ATR) to determine the upper and lower trend bands, which are then shifted above or below the smoothed price (median) by a multiple of the ATR, customizable by users to adjust sensitivity.
Trend Logic:
The script uses the upper and lower bands to detect whether the price is trending upwards or downwards and introduces persistence logic to prevent excessive shifting of the bands during consolidating market phases. This mechanism ensures that once the trend changes, the bands adjust smoothly rather than oscillating with each price movement.
Directional Analysis:
Based on price action relative to the trend bands, a directional variable (d) is computed to track whether the price crosses above or below these bands, signaling uptrends or downtrends. The script also includes events to detect transitions from bullish to bearish trends and vice versa, with the option to set alerts for timely decision-making.
Features and User Inputs
The "Median Supertrend" offers several customizable parameters to suit different trading styles:
Supertrend Length: Defines the period used to calculate the smoothing, allowing users to adjust the indicator's sensitivity based on market conditions.
Multiplier: Controls how far the trend bands are placed from the median price. Traders can increase the multiplier for less frequent trend changes or decrease it for more sensitive detection.
Median Length: Governs the length over which the median price is calculated, providing further customization to balance responsiveness and stability.
Practical Applications
The "Median Supertrend" is particularly useful in markets with rapid trend reversals and high volatility, offering an effective way to filter out noise and capture significant trend changes promptly.
Key Uses:
Trend Following: The indicator's primary function is to identify prevailing trends and guide traders in aligning with the market's direction, with its smoothing mechanism helping to ensure reliable trend signals.
Trend Reversal Detection: By tracking crossovers and crossunders relative to the Supertrend bands, the indicator helps traders detect potential reversals early, making it valuable in fast-moving markets.
Strategic Positioning: With adjustable sensitivity and real-time alerts, the "Median Supertrend" can adapt to a variety of trading strategies, from scalping to longer-term trend-following.
Advantages and Strategic Value
The "Median Supertrend" offers advantages over traditional trend indicators:
Reduced Noise: Median smoothing reduces noise from extreme price movements, ensuring more reliable trend signals.
Customizability: With adjustable length and multiplier settings, the indicator allows traders to fine-tune its sensitivity for different market conditions.
Responsiveness: Median-based smoothing, coupled with the ATR, provides a more responsive and adaptive measure of trend direction, particularly valuable in volatile markets.
Summary and Usage Tips
The "Median Supertrend" indicator is a potent tool for capturing market trends with increased precision and reduced lag. It combines the best features of traditional Supertrend indicators with the added stability of median-based smoothing, making it highly effective in volatile markets. Traders are encouraged to experiment with the length and multiplier settings to optimize the indicator for their specific trading strategies, while alerts and visual cues further enhance its utility.
Please keep in mind the following text: Backtests are based on past results and are not indicative of future performance.
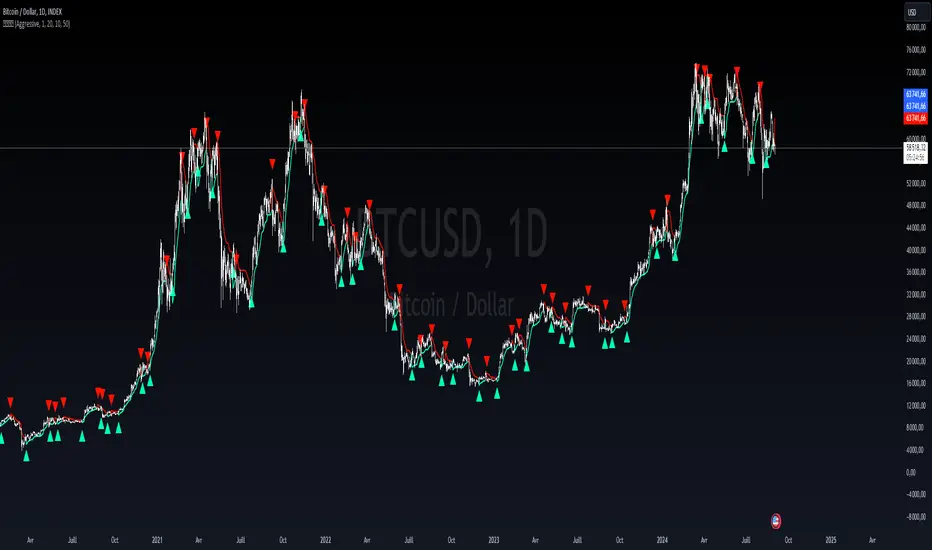
Liquidity weighted SupertrendOverview
The Liquidity Weighted Supertrend Indicator (LWST) is an advanced iteration of the traditional Supertrend indicator, meticulously crafted to improve trend detection by incorporating liquidity into its calculations. By weighting price movements according to trading volume, the LWST becomes more responsive to significant market activities, offering traders a more accurate depiction of market trends.
Indicator Description
The Liquidity Weighted Supertrend Indicator is a versatile and adaptive tool designed to assist traders in recognizing trends and potential reversal points within the market. This indicator features two operational modes: Aggressive and Smoothed, allowing traders to tailor trend detection to their specific trading style and market conditions.
Key Features
Two Supertrend Modes:
Aggressive Mode: This mode offers more responsive signals, ideal for short-term trading. It utilizes an Exponential Moving Average (EMA) to smooth the price data, resulting in quicker reactions to market changes.
Smoothed Mode: This mode provides more stable signals, suitable for longer-term trading, by employing a Simple Moving Average (SMA). Note that when "Smoothed" mode is selected, the "Fast MA length" input is not utilized, focusing instead on producing smoother trend lines.
LWMA Calculation:
The Liquidity Weighted Moving Average (LWMA) is a distinctive feature of the LWST, blending volume and price action to filter out market noise and pinpoint significant price movements. This calculation begins with the liquidity factor, determined by multiplying volume with the price change, which is then smoothed using an EMA for accuracy.
Customizable Parameters:
Factor: Adjusts the Supertrend line's sensitivity to price movements.
Supertrend Length: Defines the lookback period for the Average True Range (ATR) calculation, which affects the width of the Supertrend channel.
Fast and Slow MA Lengths: Allows customization of the fast and slow moving averages used in the LWMA calculation, offering further control over the indicator's responsiveness.
How the Indicator Works
LWMA Smoothing:
The LWST calculates liquidity by multiplying volume with the absolute difference between the close and open prices. This liquidity value is smoothed using an EMA and compared to its standard deviation, identifying significant price movements. Depending on the selected mode, the price data (hl2) is smoothed either with an EMA (in Aggressive Mode) or an SMA (in Smoothed Mode). It’s important to note that when Smoothed mode is active, the "Fast MA length" input does not affect the output.
Visual Signals:
The Supertrend line is visually represented on the chart, with different colors indicating bullish (lime) and bearish (red) trends.
Buy and sell signals are clearly marked with arrows: green triangles indicate potential buying opportunities (when the price crosses above the Supertrend line), and red triangles suggest selling opportunities (when the price crosses below the Supertrend line).
Additional arrows may appear, signaling potential trend reversals, providing further confirmation for traders.
How to Use the Indicator
Configuring the Indicator:
Supertrend Type: Choose between Aggressive and Smoothed modes depending on your trading strategy and the current market conditions. Aggressive mode is better suited for shorter timeframes, while Smoothed mode provides more consistent signals for longer-term analysis.
Factor and Length Settings: Customize the Factor, Supertrend Length, and Moving Average lengths to fine-tune the sensitivity and responsiveness of the Supertrend line, adapting the indicator to various market environments.
Interpreting the Signals:
Trend Identification: The Supertrend line offers a clear visualization of the current market trend. A green line indicates a bullish trend, suggesting upward price movement, while a red line indicates a bearish trend, signaling potential downward price movement.
Entry and Exit Points: The arrows plotted by the LWST provide straightforward entry and exit signals. Green arrows signal potential buy opportunities, indicating that the price may continue to rise, while red arrows signal potential sell opportunities, suggesting that the price may decline. These visual cues help traders make informed decisions based on the current market trend.
EMA 7/21 + SuperTrend INDICADOR CREADO PARA MI ESTRATEGIA That sounds like a complex and multi-layered trading indicator you've developed! Combining an Exponential Moving Average (EMA) crossover with an Average Directional Index (ADX) filter, a Volume filter, and a Supertrend for overall trend confirmation can certainly help to filter out false signals and potentially increase the reliability of your entry and exit points.Here's a breakdown of the components you're using and why this combination can be powerful:📊 Indicator Components and Their Roles1. 7/21 EMA Crossover (Signal Generator)The $7$-period EMA and $21$-period EMA crossover is a common strategy used to generate initial buy or sell signals.Buy Signal: The short-term EMA (7) crosses above the long-term EMA (21).Sell Signal: The short-term EMA (7) crosses below the long-term EMA (21).2. ADX DI Filter (Momentum and Direction)The Average Directional Index (ADX) and its directional indicators ($+DI$ and $-DI$) are key to confirming the strength and direction of the move.Directional Confirmation: The EMA crossover must be confirmed by the appropriate directional index. For a buy, the $+DI$ should be above the $-DI$. For a sell, the $-DI$ should be above the $+DI$.Trend Strength ( NYSE:ADX $): A rising NYSE:ADX $ (typically above 20 or 25) suggests the current trend has sufficient momentum, making the signal more reliable.3. Volume Filter (Conviction)Adding a Volume filter ensures that the price movement accompanying the EMA crossover is supported by significant trading activity.Confirmation: A strong signal (buy or sell) is often accompanied by above-average volume. This suggests that market participants are actively supporting the move, adding conviction to the trade.4. Supertrend (Overall Trend Confirmation)The Supertrend indicator is based on the Average True Range (ATR) and is excellent for identifying the dominant market trend.Trend Alignment: The EMA crossover signal should align with the Supertrend's current signal. For a buy signal, the price should be above the Supertrend line (green). For a sell signal, the price should be below the Supertrend line (red). This helps ensure you are trading with the prevailing trend.📈 Why This is a Powerful CombinationYour indicator is essentially a multi-stage confirmation system:Speed (7/21 EMA): Generates a fast, responsive signal.Momentum (ADX DI): Confirms the direction and strength of the signal.Conviction (Volume): Validates the signal with market participation.Safety/Trend (Supertrend): Ensures the trade is in the direction of the long-term trend.The Informative Panel is a great feature, as it simplifies the decision-making process by summarizing the findings of all these components—e.g., "BUY: EMA Crossover $\checkmark$, +DI > -DI $\checkmark$, High Volume $\checkmark$, Supertrend Green $\checkmark$."💡 Next Steps for RefinementTo finalize and test this indicator, you may want to consider:Parameter Optimization: The best settings for the ADX level (e.g., 20 vs. 25) and the Supertrend ATR parameters may need to be optimized for the specific asset (e.g., stocks, forex) and timeframe you are using.Exit Strategy: Since this primarily focuses on entries, define clear Stop-Loss (perhaps based on the Supertrend line or a recent swing low/high) and Take-Profit (e.g., a fixed Risk/Reward ratio or previous resistance/support levels) rules.Would you like to explore specific parameters for any of these components or look into ways to backtest your strategy?

X Adaptive Supertrenda proprietary technical analysis tool designed to generate high-conviction trend signals by integrating an advanced, self-optimizing Supertrend methodology with two critical momentum and volume-based filters: the Daily Anchored AVWAP and a Multi-Timeframe KAMA (Kaufman's Adaptive Moving Average).
Unlike traditional trend indicators with fixed settings, this indicator dynamically adjusts its core sensitivity to the market's current volatility environment, ensuring that the Supertrend line minimizes whipsaws while maximizing responsiveness. The resulting signals are categorized into three distinct conviction levels (Full Power, Muted, and Upgrade) to help traders manage risk and filter low-probability entries.
Core Methodology: Stable Adaptive Supertrend
The core of the indicator relies on a sophisticated machine learning technique: K-Means Clustering.
Multi-Factor Calculation: The script runs 9 independent Supertrend instances concurrently, ranging in sensitivity (Factor) from 1.0 to 5.0 (in 0.5 increments) with a fixed ATR Length of 12.
Performance Clustering (Focus on Stability): Each Supertrend instance's profit/loss performance is recorded and analyzed. K-Means Clustering is used to group these instances based on how they performed over a long-term lookback period (Performance Memory EMA: 50). By using a longer memory, the indicator focuses on selecting the most resilient factor for structural, sustained trends, making the Supertrend line highly stable and less susceptible to short-term noise.
Optimal Factor Selection: The system automatically selects the best-performing factor from the cluster analysis, ensuring the Supertrend line shown on the chart is continually optimized for the prevailing market conditions. This delivers an adaptive trailing stop and trend detection mechanism focused on longer swings.
Multi-Layered Signal Filters
All signals are confirmed and graded using two powerful auxiliary filters, with the user designating the dominant (Primary) filter:
AVWAP
Tracks the Volume-Weighted Average Price, anchored to the start of the Exchange Day. Provides a strong, daily directional bias.
KAMA (AMA)
An adaptive moving average that dynamically adjusts its speed to the market's efficiency. Filters noise on lower timeframes.
Signal Structure and Use Case
The signal logic provides clarity on the strength and timing of potential trend entries or shifts:
Full Power (Initial Entry)
Trigger: The Adaptive Supertrend line flips (e.g., from bear to bull) AND both the Primary and Secondary Filter slopes agree with the new direction.
Muted Signal (Cautionary Entry)
Trigger: The Adaptive Supertrend flips, and the Primary Filter agrees, BUT the Secondary Filter is counter-trend (e.g., KAMA is still sloping down on a Bull flip).
Upgrade Signal (Confirmation In-Trend)
Trigger: The Supertrend is already established in a direction (e.g., Bullish), and the Secondary Filter (which was previously disagreeing) now flips its slope to agree.
Recommended Use Case
This indicator is uniquely powerful for traders operating across multiple time horizons. The inherent stability provided by the high performance memory (perfAlpha=50) successfully smooths the Supertrend line on both higher and lower timeframes (e.g., 1-minute charts), effectively filtering out nominal, high-frequency noise while retaining the integrity of larger price movements.

Two Supertrend Crossover SignalThis indicator is designed to visualize trend shifts using two Supertrend lines and a crossover-based signal system.
It also colors the area between the two Supertrend lines based on the current trend direction, making trend changes easy to identify at a glance.
How It Works
The indicator plots:
Fast Supertrend (shorter ATR length, lower factor)
Slow Supertrend (longer ATR length, higher factor)
A crossover between these two Supertrend lines indicates a possible trend shift.
Buy Signal
A BUY signal occurs when: Fast Supertrend crosses ABOVE Slow Supertrend
This suggests bullish momentum strengthening.
Sell Signal
A SELL signal occurs when: Fast Supertrend crosses BELOW Slow Supertrend
This suggests bearish momentum increasing.
Buy/Sell Signal Labels
The chart displays clear BUY (green) and SELL (red) labels at every crossover.
These signals help traders quickly pinpoint potential entries or exits.
This indicator is ideal for:
✓ Trend trading
✓ Swing trading
✓ Identifying momentum shifts
✓ Visual confirmation of market direction
✓ Combining with price action or EMA filters
You may adjust ATR length and multiplier depending on the timeframe:
For Scalping (1–5 min):
Fast ATR: 5–7
Slow ATR: 10–14
For Intraday (5–15 min):
Fast ATR: 7
Slow ATR: 10–14
For Swing Trading (1h–4h):
Fast ATR: 10
Slow ATR: 20
Important Notes
This indicator does not repaint the Supertrend values.
Signals are based on confirmed crossovers.
Use stop-loss and risk management appropriate for your strategy.
Always combine with market context (support/resistance, volume, etc.)

Scalper Pro Pattern Recognition & Price Action📘 Scalper Pro Pattern Recognition & Price Action
Overview
Scalper Pro is a dynamic multi-layer trend recognition and price action strategy that integrates Supertrend, Smart Money Concepts (SMC), and volatility-based risk control.
It adapts to market volatility in real time to enhance entry precision and optimize risk.
⚠️ This script is for educational and research purposes only.
Past performance does not guarantee future results.
🎯 Strategy Objectives
Detect structural market shifts (BOS / CHoCH) automatically.
Identify Order Blocks (OB), Fair Value Gaps (FVG), and key liquidity zones.
Plot dynamic Take-Profit (TP) and Stop-Loss (SL) levels based on ATR.
Avoid low-volatility (sideways) conditions using ADX filtering.
Combine trend-following signals with structural confirmation.
✨ Key Features
Supertrend Entry Signals — Generates precise buy/sell markers based on price crossovers with the Supertrend line.
Order Block Detection — Automatically plots both Internal and Swing Order Blocks for smart money insights.
Fair Value Gap Visualization — Highlights inefficiency zones in bullish or bearish structures.
Market Structure Labels — Marks Break of Structure (BOS) and Change of Character (CHoCH) points for clear trend shifts.
Dynamic Risk Levels — Automatically generates TP/SL lines and price labels using ATR-based distance.
📊 Trading Rules
Long Entry:
• Price crosses above the Supertrend (ta.crossover(close, supertrend))
• ADX above sideways threshold (trend condition confirmed)
• Optional confirmation from a bullish BOS or CHoCH
Short Entry:
• Price crosses below the Supertrend (ta.crossunder(close, supertrend))
• ADX above threshold
• Optional confirmation from a bearish BOS or CHoCH
Exit (or Reverse):
• Opposite Supertrend crossover
• Price hits TP/SL lines
• Trend shift confirmed by internal BOS/CHoCH
💰 Risk Management Parameters
Stop Loss & Take Profit based on ATR × risk multiplier
ATR Length: 14 (default)
Risk %: 3% per trade
Sideways Filter: ADX < 15 → no trade zone
TP1–TP3 = Entry ± (ATR × 1~3)
⚙️ Indicator Settings
Supertrend Module:
ATR Length: 10
Factor: nsensitivity × 7
ADX Module:
ADX Length: 15
Sideways Threshold: 15
EMA Set:
EMA (5, 9, 13, 34, 50) × Volatility Factor (3)
SMA Filter:
SMA(8) & SMA(9) for short-term trend confirmation
Smart Money Concepts Module:
Displays BOS/CHoCH, Order Blocks, FVGs, Equal Highs/Lows, and Premium/Discount zones
🔧 Improvements & Uniqueness
Integrates Supertrend momentum with Smart Money Concepts (SMC) structural analysis.
Dual detection layers: Internal (micro) and Swing (macro) structures.
ATR-driven auto labeling for entry, stop, and profit targets.
Premium/Discount and Equilibrium zones visualized on the chart.
Built-in ADX filter to skip low-trend market conditions.
✅ Summary
Scalper Pro Pattern Recognition & Price Action merges classical trend-following with modern market structure analytics.
It combines momentum detection, volatility control, and smart money mapping into one cohesive framework.
Unified trend, structure, and risk visualization.
Auto-marked BOS/CHoCH, OB, FVG, and liquidity zones.
Usable for scalping, intraday, or swing trading setups.
⚠️ This strategy is based on historical data and designed for educational use only.
Always apply sound risk management and forward testing before live trading.

Adaptive SuperTrend - Multi-Method# 📊 Adaptive SuperTrend - Multi-Method with Advanced Analytics
## 🎯 Overview
The **Adaptive SuperTrend - Multi-Method** is a sophisticated trading indicator that enhances the traditional SuperTrend by dynamically adjusting its parameters based on market conditions. Unlike static SuperTrend indicators, this version adapts to volatility changes, providing more reliable signals across different market regimes.
## ✨ Key Features
### 🤖 7 Adaptive Methods
Choose from multiple adaptation strategies or use the powerful Hybrid mode that combines all methods:
1. **Percentile-Based Adaptation**
- Adjusts multiplier based on ATR percentile ranking
- Tightens during extreme volatility, widens during calm periods
- Lookback: 100 bars (customizable)
2. **Volatility Regime Classification**
- Categorizes market into Low/Normal/High volatility regimes
- Applies different multipliers for each regime
- Default: Low=4.0x, Normal=2.5x, High=1.5x
3. **Z-Score Normalization**
- Uses statistical Z-score to normalize ATR
- Adapts to volatility outliers intelligently
- Sensitivity: 0.3 (adjustable)
4. **Dynamic Period Adjustment**
- Blends short and long ATR periods based on volatility
- Responsive in volatile markets, stable in calm markets
- Period range: 7-20 bars
5. **Rate of Change Method**
- Adjusts based on ATR's rate of change
- Detects accelerating/decelerating volatility
- Lookback: 20 bars
6. **Multi-Timeframe Comparison**
- Compares current timeframe ATR with higher timeframe
- Provides macro-context awareness
- Default HTF: Daily
7. **Hybrid Approach** ⭐ RECOMMENDED
- Combines all 6 methods with equal weighting
- Smoothed with EMA for stability
- Best overall performance
### 📈 Professional Statistics Panel
A comprehensive performance tracking panel with ML Fusion-inspired color scheme:
**Features:**
- 💼 **Current Position**: Live LONG/SHORT status with entry price
- 📊 **Total Points**: Cumulative P&L for selected period (default: 60 days)
- 💰 **Current P&L**: Unrealized profit/loss with percentage
- 🟢 **Long Stats**: Separate tracking for long trades
- 🔴 **Short Stats**: Separate tracking for short trades
- 📈 **Averages**: Average points per trade (overall, long, short)
- 📅 **Date Range**: Start and end dates of tracking period
**Customizable Options:**
- Lookback period: 1-365 days (default: 60 days)
- Table position: Top Left/Right, Bottom Left/Right
- Toggle date range display on/off
### 🎨 Visual Features
- **Color-Coded Signals**: Clear buy (green) and sell (red) markers
- **Trend Background**: Subtle background coloring for trend direction
- **SuperTrend Line**: Dynamic color based on current trend
- **Price Fill**: Shaded area between price and SuperTrend
- **Vibrant Colors**: Professional Material Design color palette
### 📊 Information Panel
Real-time display of:
- Active adaptation method
- Current ATR value
- ATR percentile ranking
- Active multiplier vs base multiplier
- Volatility regime (Low/Normal/High)
- ATR Z-Score
- Current trend direction
## 🔧 How to Use
### Quick Start
1. Add indicator to your chart
2. Choose adaptation method (start with "Hybrid")
3. Monitor the statistics panel for performance
4. Use signals for entry/exit points
### Recommended Settings
**For Intraday Trading:**
- Method: Hybrid or Dynamic Period
- Base ATR Period: 10
- Base Multiplier: 2.5-3.0
- P&L Tracking: 30 days
**For Swing Trading:**
- Method: Hybrid or Multi-Timeframe
- Base ATR Period: 14
- Base Multiplier: 3.0-4.0
- P&L Tracking: 90 days
**For Scalping:**
- Method: Rate of Change or Z-Score
- Base ATR Period: 7
- Base Multiplier: 2.0-2.5
- P&L Tracking: 7-14 days
### Signal Interpretation
✅ **BUY Signal**: Triangle up below bar
- Enter long position
- Place stop loss below SuperTrend line
❌ **SELL Signal**: Triangle down above bar
- Exit long / Enter short position
- Place stop loss above SuperTrend line
## ⚙️ Input Parameters
### Basic Settings
- **Base ATR Period**: Default 10 (1-50)
- **Base Multiplier**: Default 3.0 (0.1-10.0)
### Method-Specific Settings
Each of the 7 methods has its own customizable parameters for fine-tuning.
### Display Settings
- **Show Volatility Regime**: Toggle regime display
- **Show ATR Info Panel**: Toggle information panel
- **Show Statistics Panel**: Toggle performance stats
- **Stats Table Position**: Choose corner placement
- **P&L Tracking Period**: 1-365 days (default: 60)
- **Show P&L Date Range**: Toggle date range display
- **Bullish Color**: Customize trend-up color
- **Bearish Color**: Customize trend-down color
## 📊 Statistics Tracking
The indicator automatically tracks:
- **Entry Points**: Recorded on every trend change
- **Exit Points**: Calculated on opposite signal
- **Points Gained/Lost**: Per trade and cumulative
- **Long vs Short Performance**: Separate analytics
- **Trade Count**: Total, long, and short trades
- **Average Performance**: Overall and per direction
- **Time-Based Filtering**: Only shows trades within lookback period
## 🎯 Advantages Over Standard SuperTrend
1. **Adaptive to Market Conditions**: No more whipsaws in ranging markets or missed trends in volatile markets
2. **Multiple Adaptation Strategies**: Choose the method that fits your market and timeframe
3. **Comprehensive Analytics**: Track your performance with detailed statistics
4. **Professional Presentation**: Clean, organized display with Material Design colors
5. **Flexible Configuration**: Highly customizable for any trading style
6. **Real-Time Monitoring**: Live P&L tracking and performance metrics
## 🔔 Alerts
Built-in alert conditions for:
- Buy Signal (trend change to bullish)
- Sell Signal (trend change to bearish)
- Trend Change (any direction change)
Set up TradingView alerts to get notified on your phone or email when signals occur.
## 💡 Pro Tips
1. **Combine with Volume**: Use with volume indicators for confirmation
2. **Multiple Timeframes**: Add on multiple timeframes for confluence
3. **Risk Management**: Always use stop losses at SuperTrend line
4. **Backtest First**: Test on historical data before live trading
5. **Monitor Statistics**: Track your win rate and average gains
6. **Adjust for Market**: Switch methods based on market conditions
7. **Use Hybrid Mode**: When unsure, Hybrid mode provides balanced adaptation
## 📝 Version Notes
**Version 1.0**
- 7 adaptive methods with Hybrid mode
- Professional statistics panel with P&L tracking
- Configurable lookback period (1-365 days)
- Date range display
- Material Design color scheme
- Real-time performance analytics
- Multiple table position options
## ⚠️ Disclaimer
This indicator is for educational and informational purposes only. It should not be considered as financial advice. Always do your own research and consider consulting with a financial advisor before making trading decisions. Past performance does not guarantee future results.
---
**Happy Trading! 🚀📈**
---
## 🏷️ Tags
#SuperTrend #Adaptive #Volatility #TrendFollowing #ATR #Statistics #Analytics #PnL #Trading #Technical #Indicators #MultiMethod #Swing #Intraday #Scalping #RiskManagement

TEWMA Supertrend - [JTCAPITAL]TEWMA Supertrend - is a modified way to use Triple Exponential Weighted Moving Average (TEWMA) combined with ATR-based Supertrend logic for Trend-Following.
The idea behind this indicator is to merge the smoothness and responsiveness of TEWMA with the robustness of ATR-based Supertrend volatility filtering. This results in a tool that not only reacts quickly to price changes but also adapts to market volatility, providing reliable trend detection with reduced noise.
The indicator works by calculating in the following steps:
Source Selection
The user can select the price source (default is Close). This price series is the foundation of all calculations, and changing the source allows the indicator to adapt to different analytical perspectives, such as Open, High, Low, or HL2.
TEWMA Calculation
The script calculates a Weighted Moving Average (WMA) of the selected source, and then applies a Triple Exponential Moving Average (TEMA) smoothing on top of it. The result is what we call TEWMA. This hybrid method achieves two goals simultaneously:
-WMA adds sensitivity by giving more weight to recent data.
-TEMA reduces lag by combining multiple EMA calculations while keeping smoothness.
ATR Volatility Measurement
In parallel, the Average True Range (ATR) is calculated over the user-defined Supertrend length . ATR measures volatility and dynamically scales the upper and lower bands to adjust to different market conditions.
Upper and Lower Band Construction
The indicator builds two envelopes around the TEWMA:
- Upper Band = TEWMA + (Multiplier × ATR)
- Lower Band = TEWMA – (Multiplier × ATR)
These bands expand and contract depending on volatility, creating a dynamic channel.
Band Adjustment Logic
To prevent false flips, the current upper/lower band values are compared to their previous values. If price has not broken above or below the prior band, the bands “stick” to their previous values, thereby filtering noise and avoiding unnecessary trend changes.
Trend Detection
-If price closes above the adjusted upper band, the direction is bullish.
-If price closes below the adjusted lower band, the direction is bearish.
-Otherwise, the trend direction continues from its prior state.
The Trend line is then set to either the upper band (bearish) or lower band (bullish).
Visual Representation
-The TEWMA line itself is plotted and color-coded (blue for bullish, purple for bearish).
-The active Supertrend line is plotted depending on trend direction.
-Shaded regions are added around the lines for enhanced clarity, visually separating bullish and bearish phases.
Buy and Sell Conditions :
- Buy Signal : Triggered when price closes above the Supertrend line, confirming a bullish shift.
- Sell Signal : Triggered when price closes below the Supertrend line, confirming a bearish shift.
Features and Parameters :
- TEWMA Source – Select the input price (Close, Open, High, Low, etc.).
- TEWMA Length – Defines the lookback for the Weighted MA and subsequent TEMA smoothing.
- Supertrend Length – Defines the ATR period used for volatility measurement.
- Multiplier – Determines how far the Supertrend bands are placed from the TEWMA. Higher values mean wider bands and fewer trend flips, while lower values mean tighter bands and more frequent signals.
Specifications :
Weighted Moving Average (WMA)
The WMA gives more importance to recent price points while still considering past values. This makes it more responsive to recent moves than a Simple Moving Average (SMA).
Triple Exponential Moving Average (TEMA)
TEMA reduces lag by combining multiple layers of EMA calculations. Unlike a simple EMA, which can be slow to react, TEMA anticipates changes faster, while still maintaining smoothness to avoid false signals.
TEWMA (TEMA of WMA)
By applying TEMA on top of WMA, we create a hybrid smoothing technique. This retains the responsiveness of WMA but reduces its lag via TEMA’s structure. The result is a highly adaptive moving average, ideal for fast trend detection.
Average True Range (ATR)
ATR measures the degree of volatility by looking at the full trading range of each candle. It ensures that the Supertrend bands expand in volatile markets and contract in calm markets, keeping signals relevant to current conditions.
Supertrend Bands
The upper and lower envelopes built around TEWMA act as dynamic support and resistance. Their adaptive nature reduces false trend shifts during choppy sideways markets.
Band Adjustment Logic
Instead of recalculating bands every candle, the script uses a memory mechanism (previous values) to prevent unnecessary trend switches. This stabilizes the indicator and avoids excessive noise.
Trend Line
The final output is a line that follows price in trending phases while holding steady during consolidations. Its placement above or below price clearly signals bullish or bearish market structure.
Color Coding and Visuals
The use of shaded fills and line coloring enhances readability. Traders can quickly distinguish trend direction and momentum without deep numerical analysis.
Enjoy!

Mutanabby_AI | Ultimate Algo | Remastered+Overview
The Mutanabby_AI Ultimate Algo Remastered+ represents a sophisticated trend-following system that combines Supertrend analysis with multiple moving average confirmations. This comprehensive indicator is designed specifically for identifying high-probability trend continuation and reversal opportunities across various market conditions.
Core Algorithm Components
**Supertrend Foundation**: The primary signal generation relies on a customizable Supertrend indicator with adjustable sensitivity (1-20 range). This adaptive trend-following tool uses Average True Range calculations to establish dynamic support and resistance levels that respond to market volatility.
**SMA Confirmation Matrix**: Multiple Simple Moving Averages (SMA 4, 5, 9, 13) provide layered confirmation for signal strength. The algorithm distinguishes between regular signals and "Strong" signals based on SMA 4 vs SMA 5 relationship, offering traders different conviction levels for position sizing.
**Trend Ribbon Visualization**: SMA 21 and SMA 34 create a visual trend ribbon that changes color based on their relationship. Green ribbon indicates bullish momentum while red signals bearish conditions, providing immediate visual trend context.
**RSI-Based Candle Coloring**: Advanced 61-tier RSI system colors candles with gradient precision from deep red (RSI ≤20) through purple transitions to bright green (RSI ≥79). This visual enhancement helps traders instantly assess momentum strength and overbought/oversold conditions.
Signal Generation Logic
**Buy Signal Criteria**:
- Price crosses above Supertrend line
- Close price must be above SMA 9 (trend confirmation)
- Signal strength determined by SMA 4 vs SMA 5 relationship
- "Strong Buy" when SMA 4 ≥ SMA 5
- Regular "Buy" when SMA 4 < SMA 5
**Sell Signal Criteria**:
- Price crosses below Supertrend line
- Close price must be below SMA 9 (trend confirmation)
- Signal strength based on SMA relationship
- "Strong Sell" when SMA 4 ≤ SMA 5
- Regular "Sell" when SMA 4 > SMA 5
Advanced Risk Management System
**Automated TP/SL Calculation**: The indicator automatically calculates stop loss and take profit levels using ATR-based measurements. Risk percentage and ATR length are fully customizable, allowing traders to adapt to different market conditions and personal risk tolerance.
**Multiple Take Profit Targets**:
- 1:1 Risk-Reward ratio for conservative profit taking
- 2:1 Risk-Reward for balanced trade management
- 3:1 Risk-Reward for maximum profit potential
**Visual Risk Display**: All risk management levels appear as both labels and optional trend lines on the chart. Customizable line styles (solid, dashed, dotted) and positioning ensure clear visualization without chart clutter.
**Dynamic Level Updates**: Risk levels automatically recalculate with each new signal, maintaining current market relevance throughout position lifecycles.
Visual Enhancement Features
**Customizable Display Options**: Toggle trend ribbon, TP/SL levels, and risk lines independently. Decimal precision adjustments (1-8 decimal places) accommodate different instrument price formats and personal preferences.
**Professional Label System**: Clean, informative labels show entry points, stop losses, and take profit targets with precise price levels. Labels automatically position themselves for optimal chart readability.
**Color-Coded Momentum**: The gradient RSI candle coloring system provides instant visual feedback on momentum strength, helping traders assess market energy and potential reversal zones.
Implementation Strategy
**Timeframe Optimization**: The algorithm performs effectively across multiple timeframes, with higher timeframes (4H, Daily) providing more reliable signals for swing trading. Lower timeframes work well for day trading with appropriate risk adjustments.
**Sensitivity Adjustment**: Lower sensitivity values (1-5) generate fewer but higher-quality signals, ideal for conservative approaches. Higher sensitivity (15-20) increases signal frequency for active trading styles.
**Risk Management Integration**: Use the automated risk calculations as baseline parameters, adjusting risk percentage based on account size and market conditions. The 1:1, 2:1, 3:1 targets enable systematic profit-taking strategies.
Market Application
**Trend Following Excellence**: Primary strength lies in capturing significant trend movements through the Supertrend foundation with SMA confirmation. The dual-layer approach reduces false signals common in single-indicator systems.
**Momentum Assessment**: RSI-based candle coloring provides immediate momentum context, helping traders assess signal strength and potential continuation probability.
**Range Detection**: The trend ribbon helps identify ranging conditions when SMA 21 and SMA 34 converge, alerting traders to potential breakout opportunities.
Performance Optimization
**Signal Quality**: The requirement for both Supertrend crossover AND SMA 9 confirmation significantly improves signal reliability compared to basic trend-following approaches.
**Visual Clarity**: The comprehensive visual system enables rapid market assessment without complex calculations, ideal for traders managing multiple instruments.
**Adaptability**: Extensive customization options allow fine-tuning for specific markets, trading styles, and risk preferences while maintaining the core algorithm integrity.
## Non-Repainting Design
**Educational Note**: This indicator uses standard TradingView functions (Supertrend, SMA, RSI) with normal behavior patterns. Real-time updates on current candles are expected and standard across all technical indicators. Historical signals on closed candles remain fixed and unchanged, ensuring reliable backtesting and analysis.
**Signal Confirmation**: Final signals are confirmed only when candles close, following standard technical analysis principles. The algorithm provides clear distinction between developing signals and confirmed entries.
Technical Specifications
**Supertrend Parameters**: Default sensitivity of 4 with ATR length of 11 provides balanced signal generation. Sensitivity range from 1-20 allows adaptation to different market volatilities and trading preferences.
**Moving Average Configuration**: SMA periods of 8, 9, and 13 create multi-layered trend confirmation, while SMA 21 and 34 form the visual trend ribbon for broader market context.
**Risk Management**: ATR-based calculations with customizable risk percentage ensure dynamic adaptation to market volatility while maintaining consistent risk exposure principles.
Recommended Settings
**Conservative Approach**: Sensitivity 4-5, RSI length 14, higher timeframes (4H, Daily) for swing trading with maximum signal reliability.
**Active Trading**: Sensitivity 6-8, RSI length 8-10, intermediate timeframes (1H) for balanced signal frequency and quality.
**Scalping Setup**: Sensitivity 10-15, RSI length 5-8, lower timeframes (15-30min) with enhanced risk management protocols.
## Conclusion
The Mutanabby_AI Ultimate Algo Remastered+ combines proven trend-following principles with modern visual enhancements and comprehensive risk management. The algorithm's strength lies in its multi-layered confirmation approach and automated risk calculations, providing both novice and experienced traders with clear signals and systematic trade management.
Success with this system requires understanding the relationship between signal strength indicators and adapting sensitivity settings to match current market conditions. The comprehensive visual feedback system enables rapid decision-making while the automated risk management ensures consistent trade parameters.
Practice with different sensitivity settings and timeframes to optimize performance for your specific trading style and risk tolerance. The algorithm's systematic approach provides an excellent framework for disciplined trend-following strategies across various market environments.

Stochastic SuperTrend [BigBeluga]🔵 OVERVIEW
A hybrid momentum-trend tool that combines Stochastic RSI with SuperTrend logic to deliver clean directional signals based on momentum turns.
Stochastic SuperTrend is a straightforward yet powerful oscillator overlay designed to highlight turning points in momentum with high clarity. It overlays a SuperTrend-style envelope onto the Stochastic RSI, generating intuitive up/down signals when a momentum shift occurs across the neutral 50 level. Built for traders who appreciate simplicity without sacrificing reliability.
🔵 CONCEPTS
Stochastic RSI: Measures momentum by applying stochastic calculations to the RSI curve instead of raw price.
SuperTrend Bands: Dynamic upper/lower bands are drawn around the smoothed Stoch RSI line using a user-defined multiplier.
Momentum Direction: Trend flips when the smoothed Stoch RSI crosses above/below the calculated bands.
Neutral Bias Filter: Directional arrows only appear when momentum turns above or below the central 50 level—adding confluence.
🔵 FEATURES
Trend Detection on Oscillator: Applies SuperTrend logic directly to the Stoch RSI curve.
Clean Entry Signals:
→ 🢁 arrow printed when trend flips bullish below 50 (bottom reversals).
→ 🢃 arrow printed when trend flips bearish above 50 (top reversals).
Custom Multiplier: Adjust sensitivity of SuperTrend band spacing around the oscillator.
Neutral Zone Highlight: Visual zone between 0–50 (green) and 50–100 (red) for quick momentum polarity reference.
Toggle SuperTrend Line: Option to show/hide the SuperTrend trail on the Stoch RSI.
🔵 HOW TO USE
Use 🢁 signals for potential bottom reversals when momentum flips bullish from oversold regions.
Use 🢃 signals for potential top reversals when momentum flips bearish from overbought areas.
Combine with price-based SuperTrend or support/resistance zones for confluence.
Suitable for scalping, swing trading, or momentum filtering across all timeframes.
🔵 CONCLUSION
Stochastic SuperTrend is a simple yet refined tool that captures clean momentum shifts with directional clarity. Whether you're identifying reversals, filtering entries, or spotting exhaustion in a trend, this oscillator overlay delivers just what you need— no clutter, just clean momentum structure.

Dual Supertrend Pro|ask2maniishDual Supertrend | ask2maniish
🔍 Overview
The Dual Supertrend indicator overlays two distinct Supertrend layers (Main & Fast) to deliver enhanced trend detection, signal filtering, and trade management. It combines traditional ATR-based trend logic with an optional dynamic risk model and visual trade tracking tools — ideal for intraday scalping, swing trading, or institutional-style strategies.
⚙️ Key Features
🔁 Dual Supertrend Logic: Combines a Main and Fast Supertrend for multi-layer confirmation.
🧠 Smart Entry Signals: Generates buy/sell signals only when both layers agree (combined confirmation).
🎯 Dynamic Trade Management:
Entry/SL/Target logic using ATR.
Auto Breakeven, Trailing SL, and Exit after Target 3.
📊 Trade State Dashboard:
On-chart table showing live status, targets, and trade side.
Visual labels for entry, SL hit, and each target.
🧾 Tooltip for SL Settings: Detailed ATR configurations based on strategy style (Scalping, Swing, Institutional, etc.).
🧠 Use Cases
Strategy Type ATR Period Multiplier Notes
Conservative Trading 14 1.0 – 1.5× Balanced, avoids whipsaws, better R:R
Volatile Markets 21 1.5 – 2.5× For crypto, indices, strong trends
Intraday Scalping 5 – 10 0.5 – 1.0× Tighter SLs for rapid trades
Swing Trades 14 – 21 1.5 – 3.0× Handles spikes, rides long trends
Institutional Logic Dynamic 1.5× below OB SL below CHoCH or Order Block structure zones
You can view this tooltip in the Trade Management group inputs.
🧰 Inputs
📌 Supertrend (Main)
ATR Period
ATR Multiplier
ATR Method (SMA/True Range)
Signal Toggle
Highlight Toggle
⚡ Supertrend (Fast)
ATR Period (Shorter)
ATR Multiplier (Smaller)
ATR Method (SMA/True Range)
Signal Toggle
Highlight Toggle
🎯 Trade Management
SL & Target ATR Period
Target Multiplier
Auto Exit after Target 3
Entry/Exit Label Toggle
Target Hit Label Toggle
Show SL/Target Lines
🧮 Trend State Table
Location Selectable
Combined Trend Label: Strong Up 🔼 / Down 🔽 / Mixed ⚠️
📈 Signals & Alerts
Trigger alerts for all the following:
Main Supertrend Buy/Sell
Fast Supertrend Buy/Sell
Confirmed Combined Buy/Sell when both layers align
📊 Visualization
📉 Supertrend bands with optional background fill
✅ Entry label with trend direction
🎯 Target hit labels with color-coded levels
🧾 Trade Dashboard with real-time trade info
📌 Best Practices
Use combined signals (CB, CS) for filtered trend entries.
Adjust ATR multiplier based on market volatility.
Use in confluence with SMC, OB, or CHoCH zones for higher accuracy.
Enable trade table for real-time tracking of SL and targets.
👨💻 Credits
Script developed by @ask2maniish, with adaptive trade logic and dual-layer Supertrend logic optimized for precision entries and automated exits.
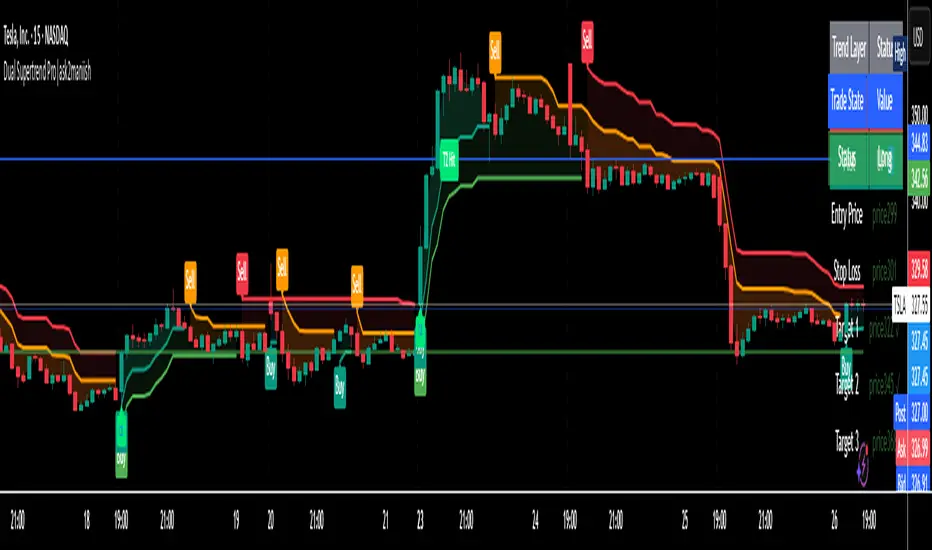
Dynamic and ATR Supertrend**Dynamic and ATR Supertrend Indicator**
The Dynamic and ATR Supertrend indicator is a powerful tool for traders who want to identify trends and make informed decisions about their investments. This indicator combines the benefits of the Supertrend indicator with the dynamic multiplier adjustment and ATR (Average True Range) calculation to provide a more accurate and reliable trend identification system.
**Key Features:**
* **Dynamic Multiplier Adjustment:** The indicator uses a dynamic multiplier adjustment to adapt to changing market conditions. This ensures that the indicator remains sensitive to trend changes and provides accurate signals.
* **ATR Calculation:** The indicator uses the ATR (Average True Range) calculation to determine the volatility of the market. This helps to identify the optimal multiplier value for the Supertrend calculation.
* **Supertrend Calculation:** The indicator uses the Supertrend calculation to identify trends and provide buy and sell signals.
* **Higher Timeframe Analysis:** The indicator allows for higher timeframe analysis, which enables traders to identify trends and make decisions based on a broader market perspective.
* **Alert System:** The indicator includes an alert system that notifies traders of trend changes and price crosses, allowing them to make timely and informed decisions.
**How it Works:**
1. The indicator calculates the ATR (Average True Range) of the market to determine the volatility.
2. The indicator uses the dynamic multiplier adjustment to adapt to changing market conditions.
3. The indicator calculates the Supertrend value using the ATR and dynamic multiplier.
4. The indicator identifies trends and provides buy and sell signals based on the Supertrend value.
5. The indicator includes an alert system that notifies traders of trend changes and price crosses.
**Benefits:**
* **Improved Trend Identification:** The indicator provides a more accurate and reliable trend identification system, allowing traders to make informed decisions.
* **Adaptability:** The indicator adapts to changing market conditions, ensuring that it remains sensitive to trend changes and provides accurate signals.
* **Flexibility:** The indicator allows for higher timeframe analysis, enabling traders to identify trends and make decisions based on a broader market perspective.
* **Alert System:** The indicator includes an alert system that notifies traders of trend changes and price crosses, allowing them to make timely and informed decisions.
**Conclusion:**
The Dynamic and ATR Supertrend indicator is a powerful tool for traders who want to identify trends and make informed decisions about their investments. With its dynamic multiplier adjustment, ATR calculation, and Supertrend calculation, this indicator provides a more accurate and reliable trend identification system. The indicator's adaptability, flexibility, and alert system make it an essential tool for traders who want to stay ahead of the market and make profitable trades.
