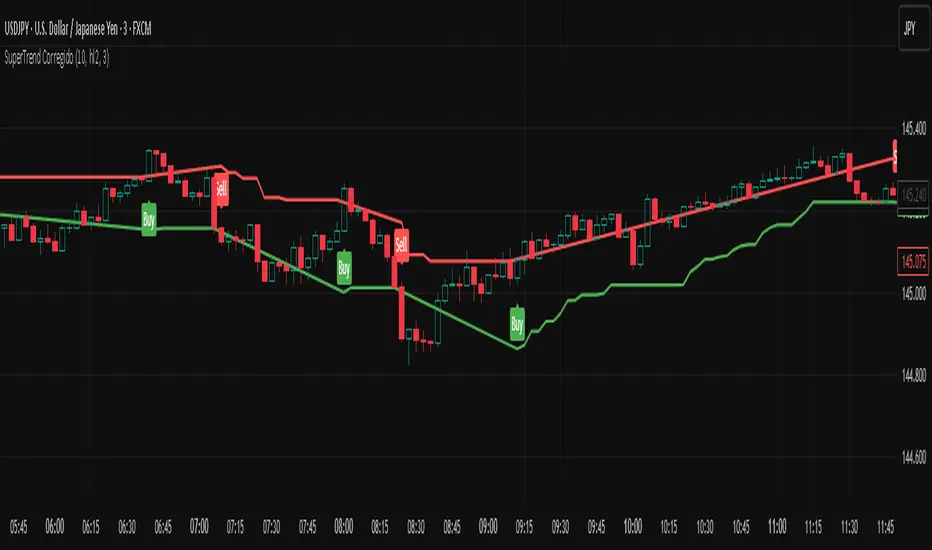
SuperTrend CorregidoThis script implements a SuperTrend indicator based on the Average True Range (ATR). It is designed to help traders identify trend direction and potential buy/sell opportunities with visual signals on the chart.
🔧 Key Features:
ATR-Based Trend Detection: Calculates trend shifts using the ATR and a user-defined multiplier.
Buy/Sell Signals: Displays "Buy" and "Sell" labels directly on the chart when the trend changes direction.
Visual Trend Lines: Plots green (uptrend) and red (downtrend) SuperTrend lines to highlight the current market bias.
Trend Highlighting: Optionally fills the background to emphasize whether the market is in an uptrend or downtrend.
Customizable Settings:
ATR period and multiplier
Option to switch ATR calculation method
Toggle for signal visibility and trend highlighting
🔔 Alerts Included:
SuperTrend Buy Signal
SuperTrend Sell Signal
SuperTrend Direction Change
This indicator is useful for identifying entries and exits based on trend momentum and can be used across various timeframes.
"supertrend" için komut dosyalarını ara
SuperTrend WMA V10.0 [2022]STRATEGY version of SuperTrend WMA V4.5 Indicator:
We added and fixed the PERIOD section, adjust the interval to only work for M3 M30 H4.
M3 used for daily processing
M30 used for weekly processing
H4 used for monthly processing
Each time period can tell a trend and a market journey.
The most important thing is to stay on top of the average probability. We are trying to create a model of mean that differs in the form of two time periods merged into one period.
SuperTrend WMA is the most important indicator for Market Trend analysis.
This is the version you can trade for the following. Trend by M15 is the most profitable trend on Trend following
SuperTrend V1.5 (2021) The settings cannot be modified because we believe that the numbers we set for the market will be exact and accurate. with trading experience and proper use
You can use the 1 minute ( M1 ) interval to check the market gap in the 1 day boundary.
You can use the 15 minute ( M15 ) interval to check the market gap in the 1 week boundary.
You can use the 4 hour ( H4 ) interval to check the market gap in the 1 Month boundary.
All three of these periods can be used together because they are the corresponding periods with the market averages.
We use averages to read market probabilities. It consists of complex time gaps built up to 3 different average levels.
The line WMA Green indicates an uptrend where we believe not to sell during that period. It will put you at risk of losing.
The line WMA Red indicates a possible downtrend. We intend not to make a purchase during that time as it may damage you.
Buy or sell signals are on the words. BUY OR SELL, The use of signals must be based on the trend.
For example, an uptrend would like to buy only, not sell because it is against the average.
We believe that anything can fool us, but the average cannot tell us this is why we intend for everyone to use the indicator SuperTrend WMA V4.5
And we sincerely hope that it'll be useful to everyone. And our team will continue to develop to make the use better.
This indicator develops from indicator SuperTrend WMA Version 4.5

Hikmet SupertrendSuperTrend is one of the most common ATR based trailing stop indicators.
In this version you can change the ATR calculation method from the settings. Default method is RMA, when the alternative method is SMA .
The indicator is easy to use and gives an accurate reading about an ongoing trend. It is constructed with two parameters, namely period and multiplier. The default values used while constructing a superindicator are 10 for average true range or trading period and three for its multiplier.
The average true range (ATR) plays an important role in 'Supertrend' as the indicator uses ATR to calculate its value. The ATR indicator signals the degree of price volatility .
The buy and sell signals are generated when the indicator starts plotting either on top of the closing price or below the closing price. A buy signal is generated when the ‘Supertrend’ closes above the price and a sell signal is generated when it closes below the closing price.
It also suggests that the trend is shifting from descending mode to ascending mode. Contrary to this, when a ‘Supertrend’ closes above the price, it generates a sell signal as the colour of the indicator changes into red.
A ‘Supertrend’ indicator can be used on equities, futures or forex, or even crypto markets and also on daily, weekly and hourly charts as well, but generally, it fails in a sideways-moving market.
Supertrend Volume OscillatorThe Supertrend Volume Oscillator is an innovative tool that integrates volume analysis with the established Supertrend indicator to offer a unique perspective on market conditions. By comparing directional volume against the aggregate volume over a designated lookback period, this oscillator adeptly signals overbought and oversold states through a volume-weighted methodology. Key settings such as the lookback period, Supertrend factor, and ATR period are adjustable, allowing traders to tailor the trend detection sensitivity to their preference.
Crucially, the oscillator delineates overbought and oversold zones via a channel parameter, with its value represented as a percentage ratio of directional to total volume, visually enhanced by a color gradient shifting from red to green based on oscillator readings. Background coloring further highlights market extremes for easy identification. A continuous line tracks the oscillator's value, anchored by a horizontal zero line as a neutral benchmark.
Additionally, the oscillator is equipped with alert conditions that notify traders when entering critical zones, facilitating informed trading decisions. This fusion of price trend analysis with volume metrics provides traders with a comprehensive tool for gauging market sentiment and trend strength, making the Supertrend Volume Oscillator a valuable addition to any trader's arsenal.

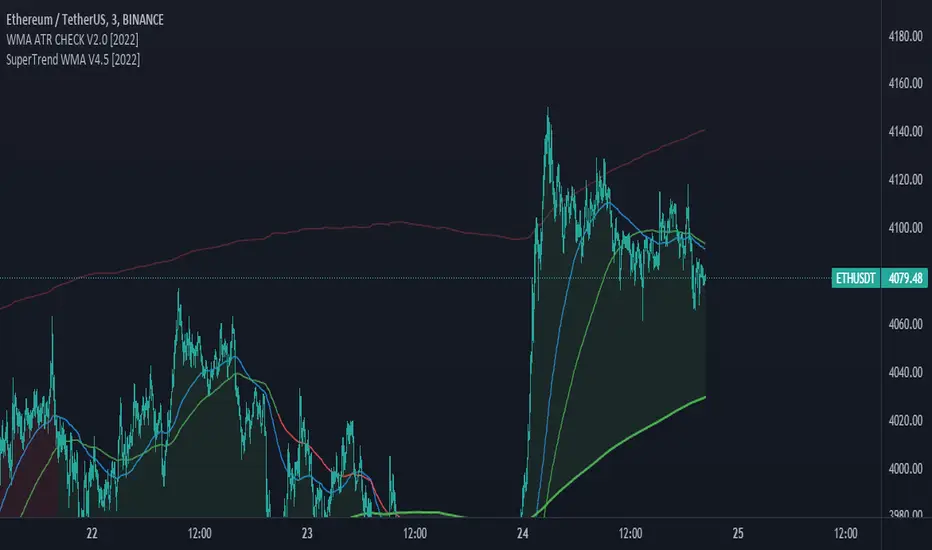
SuperTrend WMA V4.5 [2022]STRATEGY version of SuperTrend WMA V4.5 Indicator:
We added and fixed the PERIOD section, adjust the interval to only work for M3 M30 H4.
M3 used for daily processing
M30 used for weekly processing
H4 used for monthly processing
Each time period can tell a trend and a market journey.
The most important thing is to stay on top of the average probability. We are trying to create a model of mean that differs in the form of two time periods merged into one period.
SuperTrend WMA is the most important indicator for Market Trend analysis.
This is the version you can trade for the following. Trend by M15 is the most profitable trend on Trend following
SuperTrend V1.5 (2021) The settings cannot be modified because we believe that the numbers we set for the market will be exact and accurate. with trading experience and proper use
You can use the 1 minute ( M1 ) interval to check the market gap in the 1 day boundary.
You can use the 15 minute ( M15 ) interval to check the market gap in the 1 week boundary.
You can use the 4 hour ( H4 ) interval to check the market gap in the 1 Month boundary.
All three of these periods can be used together because they are the corresponding periods with the market averages.
We use averages to read market probabilities. It consists of complex time gaps built up to 3 different average levels.
The line WMA Green indicates an uptrend where we believe not to sell during that period. It will put you at risk of losing.
The line WMA Red indicates a possible downtrend. We intend not to make a purchase during that time as it may damage you.
Buy or sell signals are on the words. BUY OR SELL, The use of signals must be based on the trend.
For example, an uptrend would like to buy only, not sell because it is against the average.
We believe that anything can fool us, but the average cannot tell us this is why we intend for everyone to use the indicator SuperTrend WMA V4.5
And we sincerely hope that it'll be useful to everyone. And our team will continue to develop to make the use better.
SuperTrend WMA V1.5 (2021)STRATEGY version of SuperTrend WMA V1.5 (2021) Indicator:
The most important thing is to stay on top of the average probability. We are trying to create a model of mean that differs in the form of two time periods merged into one period.
SuperTrend WMA is the most important indicator for Market Trend analysis.
This is the version you can trade for the following. Trend by M15 is the most profitable trend on Trend following
SuperTrend V1.5 (2021) The settings cannot be modified because we believe that the numbers we set for the market will be exact and accurate. with trading experience and proper use
You can use the 1 minute ( M1 ) interval to check the market gap in the 1 day boundary.
You can use the 15 minute ( M15 ) interval to check the market gap in the 1 week boundary.
You can use the 4 hour ( H4 ) interval to check the market gap in the 1 Month boundary.
All three of these periods can be used together because they are the corresponding periods with the market averages.
We use averages to read market probabilities. It consists of complex time gaps built up to 3 different average levels.
The line WMA Green indicates an uptrend where we believe not to sell during that period. It will put you at risk of losing.
The line WMA Red indicates a possible downtrend. We intend not to make a purchase during that time as it may damage you.
Buy or sell signals are on the words. BUY OR SELL, The use of signals must be based on the trend.
For example, an uptrend would like to buy only, not sell because it is against the average.
We believe that anything can fool us, but the average cannot tell us this is why we intend for everyone to use the indicator SuperTrend WMA V1.5 ( 2021 )
And we sincerely hope that it'll be useful to everyone. And our team will continue to develop to make the use better.

SuperTrend MAAfter building SuperBands, I kept thinking about what happens at the midpoint between those two volatility-adaptive envelopes. The upper and lower bands are both trailing price based on ATR and EMA smoothing, but they're operating independently in opposite directions. Taking their average seemed like it might produce an interesting centerline that adapts to volatility in a way that regular moving averages don't. Turns out it does, and that's what this indicator is.
The core concept is straightforward. Instead of plotting the upper and lower SuperBands separately, this calculates both of them internally, averages their values, and then applies an additional smoothing pass with EMA to create a single centerline. That centerline sits roughly in the middle of where the bands would be, but because it's derived from ATR-offset trailing stops rather than direct price smoothing, it behaves differently than a standard moving average of the same length. During trending periods, the centerline tracks closer to price because one of the underlying bands is actively trailing while the other is dormant. During consolidation, both bands compress toward price and the centerline tends to oscillate more with shorter-term movements.
What's interesting is that this acts like a supertrend all by itself with directional behavior baked in. When one of the underlying supertrend waves dominates, meaning price is strongly trending in one direction and only one band is active, you get what feels like a "true" supertrend, whatever that means exactly. The centerline locks into trend-following mode and the color gradient reflects that commitment. You get bright bullish colors during sustained uptrends when the upper band is doing all the work, and strong bearish colors during downtrends when the lower band dominates. But when both bands are active and fighting for control, which happens during consolidation or choppy conditions, the centerline settles into more neutral tones that clearly signal you're in a ranging environment. The colors really do emphasize this behavior and make it visually obvious which regime you're in.
The smoothing parameter controls how aggressively the underlying SuperBand trails adapt to price, which indirectly affects how responsive the centerline is. Lower values make the bands tighter and more reactive, so the centerline follows price action more closely. Higher values create wider bands that only respond to sustained moves, which produces a smoother centerline that filters out more noise. The center smoothing parameter applies a second EMA pass specifically to the averaged midpoint, giving you independent control over how much additional lag you want on the final output versus the raw band average.
What makes this different from just slapping an EMA on price is that the underlying bands are already volatility-aware through their ATR calculations. When volatility spikes, the bands widen and the centerline adjusts its position relative to price based on where those bands settle. A traditional moving average would just smooth over the volatility spike without adjusting its distance from price. This approach incorporates volatility information into the centerline's positioning, which can help it stay relevant during regime changes where fixed-period moving averages tend to lag badly or whipsaw.
The color gradient adds a momentum overlay using the same angle-based calculation from SuperBands. The centerline's rate of change gets normalized by an RMS estimate of its historical movement range, converted to an angle through arctangent scaling, and then mapped to a color gradient. When the centerline is rising, it gradients from neutral toward your chosen bullish color, with brightness increasing as the rate of ascent steepens. When falling, it shifts toward the bearish color with intensity tied to the descent rate. This gives you an immediate visual sense of whether the centerline is accelerating, decelerating, or moving at a stable pace.
Configuration is simpler than SuperBands since you're only dealing with a single output line instead of separate bull and bear envelopes. The length parameter controls the underlying band behavior. ATR period and multiplier determine how much space the bands allocate around price before they trail. Center smoothing adds the extra EMA pass on the averaged midpoint. You can tune these independently to get different characteristics. A tight ATR multiplier with heavy center smoothing creates a smooth line that stays close to price. A wide multiplier with light center smoothing produces a line that swings more freely and adapts faster to directional changes.
From a practical standpoint, this works well as a trend filter or dynamic support and resistance reference. Price above the centerline with bullish coloring suggests a favorable environment for long positions. Price below with bearish coloring indicates the opposite. Crossovers can signal trend changes, though like any moving average system, you'll get whipsaws in choppy conditions. The advantage over traditional MAs is that the volatility adaptation tends to reduce false signals during transitional periods where volatility is expanding but direction hasn't fully committed.
The implementation reuses the entire SuperBands logic, which means all the smoothing and state management for the trailing stops is identical. The only addition is averaging the two band outputs and applying the final EMA pass. The color calculation follows the same RMS-normalized angle approach but applies it to the centerline's delta rather than the individual band deltas. This keeps the coloring consistent with how SuperBands handles momentum visualization while adapting it to a single line instead of dual envelopes.
What this really highlights is that you can derive moving averages from mechanisms other than direct price smoothing. By building the centerline from volatility-adjusted trailing stops, you get adaptive behavior that responds to both price movement and volatility regime without needing separate inputs or complex multi-stage calculations. Whether that adaptation provides a meaningful edge depends on your strategy and market, but it's a fundamentally different approach than the typical fixed-period or adaptive MAs that adjust length based on volatility or momentum indicators.

Supertrend ProSupertrend Pro - Multi-Trend Analysis and Trading Signal Filtering
OVERVIEW
This indicator calculates trend direction based on the Supertrend indicator and integrates dual-trend analysis, upper and lower trend bands, trading signal alerts, moving average filtering, and the EMA 200 bull-bear division line to provide traders with more precise trend identification and trading signals.
It is suitable for trend trading, short-term trading, and swing trading, effectively filtering market noise and improving trade accuracy.
IMPLEMENTATION PRINCIPLES
1. Primary Trend: Uses the Supertrend indicator to calculate major trend direction, suitable for long-term trend assessment.
2. Secondary Trend: Detects short-term trend changes, capturing finer market movements.
3. Upper and Lower Trend Bands: Utilizes ATR (Average True Range) to calculate dynamic trend channels, assisting in trend strength assessment.
4. Trading Signal Alerts: Provides buy/sell signals when trends reverse, with optional moving average filtering to reduce false signals.
5. Moving Average Filtering: Supports multiple MA types, such as EMA, SMA, HMA, McGinley, helping to filter market noise.
6. EMA 200 Bull-Bear Division Line: Combines ATR-based trend buffer zones to distinguish between long-term bull and bear markets, enhancing trend accuracy.
KEY FEATURES
1. Dual-Trend Analysis
• Primary trend is suitable for long-term trend tracking, reducing interference from short-term fluctuations.
• Secondary trend is ideal for short-term trading opportunities, allowing faster identification of market turning points.
• By combining both, traders can follow the major trend direction while using the secondary trend for optimized entry points, improving trade success rates.
2. Upper and Lower Trend Bands
• ATR-based dynamic bands adjust to market volatility, avoiding the limitations of fixed support and resistance levels.
• Trend confirmation: When the price reaches the upper or lower band, traders can determine whether the market is overheated or oversold, aiding trading decisions.
• Combining primary and secondary trend bands provides clearer trend validation, reducing false signals.
3. Trading Signal Alerts
• Automatic buy/sell signal alerts when the trend reverses, eliminating the need for manual trend assessment.
• Moving average filtering improves signal reliability, reducing false signals.
• Supports various signal markers (circles/arrows/labels) to help traders clearly visualize entry points.
4. Moving Average Filtering
• Supports multiple moving average types (SMA, EMA, HMA, WMA, McGinley, etc.), adapting to different trading styles.
• Prevents counter-trend trading:
· Long entries only when the price is above the MA filter.
· Short entries only when the price is below the MA filter.
• Customizable MA periods to suit different market conditions and prevent excessive signal noise.
5. Trading Reference Lines
• Short-term trend: HMA 25 serves as an entry reference line. Waiting for MA color changes before placing trades can improve stability.
• Long-term trend: EMA 200 as the bull-bear division line helps traders distinguish between long-term bullish and bearish trends, avoiding counter-trend trades.
• Dynamic buffer adjustment: Uses ATR-based volatility buffers to reduce false signals and enhance trend detection accuracy.
• Color-coded trend identification:
· Aqua (Bull Market): Price is above the buffer zone.
· Fuchsia (Bear Market): Price is below the buffer zone.
· White: Price is within the buffer zone, indicating an unclear market direction.
USAGE GUIDELINES
1. Applicable Markets
• Suitable for stocks, futures, cryptocurrencies, and forex
• Supports short-term trading, trend trading, and swing trading
2. Recommended Timeframes
• Short-term traders can use 5m, 15m, and 1H timeframes, leveraging secondary trend signals for quick market entries.
• Trend traders can use 4H and daily timeframes, relying on primary trend signals to assess major trends.
• Long-term investors can use the EMA 200 bull-bear division line to determine macro trend direction and avoid counter-trend trades.
3. Trading Strategy
• Long Entry:
The primary trend is bullish (Green).
The secondary trend triggers a buy signal (Long).
• Short Entry:
· The primary trend is bearish (Red).
· The secondary trend triggers a sell signal (Short).
• Enable Moving Average Filtering:
· Only enter long trades when the price is above the MA filter.
· Only enter short trades when the price is below the MA filter.
• Use EMA 200 for Market Direction:
· If the price is above EMA 200 + buffer, the market is in a bullish trend → favor long trades.
· If the price is below EMA 200 - buffer, the market is in a bearish trend → favor short trades.
• Market Volatility Considerations:
· Short timeframes (1m, 5m) may produce more noise, reducing signal reliability.
· Higher timeframes (1H, 4H, Daily) provide more stable trend signals but may miss some short-term trade opportunities.
RISK DISCLAIMER
• This indicator calculates trend direction based on historical data and cannot guarantee future market performance. When using this indicator for trading, always combine it with other technical analysis tools, fundamental analysis, and personal trading experience for comprehensive decision-making.
• Market conditions are uncertain, and trend signals may result in false positives or lag. Traders should avoid over-reliance on indicator signals and implement stop-loss strategies and risk management techniques to reduce potential losses.
• Leverage trading carries high risks and may result in rapid capital loss. If using this indicator in leveraged markets (such as futures, forex, or cryptocurrency derivatives), exercise caution, manage risks properly, and set reasonable stop-loss/take-profit levels to protect funds.
• All trading decisions are the sole responsibility of the trader. The developer is not liable for any trading losses. This indicator is for technical analysis reference only and does not constitute investment advice.
• Before live trading, it is recommended to use a demo account for testing to fully understand how to use the indicator and apply proper risk management strategies.
CHANGELOG
• v1.0: Initial release with a dual-trend system, dynamic upper and lower trend bands, trading signal alerts, moving average filtering, HMA trading reference line, and EMA 200 bull-bear division.

Supertrend with Buy/Sell SignalsThis simple Supertrend with Buy/Sell Signals is a trend-following indicator that helps identify market direction and potential entry/exit points. It uses the Average True Range (ATR) to calculate a dynamic support and resistance line:
Buy Signal: A green "BUY" label appears when the price crosses above the Supertrend line, indicating a possible bullish trend.
Sell Signal: A red "SELL" label appears when the price crosses below the Supertrend line, signaling a potential bearish trend.
The indicator also adapts to market volatility and displays the trend line in green for uptrends and red for downtrends. It is best used in trending markets.

Supertrend ATR Companion LinesThis is a full set of lines and labels for multi timeframe supertrend based ATRs that match the table in the Supertrend ATR Table indicator.
Each line and label can be individually switched on or off.
The labels have a default offset of -12 so they appear just to the right of the last bar but this is user configurable by input and so is the size of each label.
Please refer to the Supertrend ATR Table for a further description

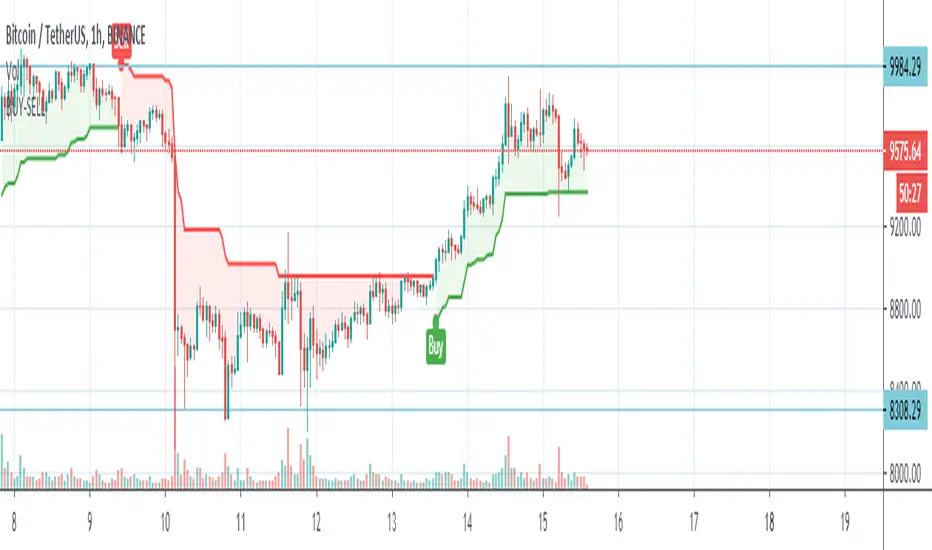
Supertrend NinjaSupertrend Ninja
The Basics
The Supertrend Ninja is a trend-following indicator. The indicator is optimised for daily, 2 days and 3 days candlesticks and can be used on varying trending markets.
Supertrend Ninja using 2 days candlesticks only gave 7 bullish signals in 2020 and 2 in 2021 for Bitcoin/USDT (based on Binance charts). Greatly reducing false signals. It can be used on lower time frames as well, although you will encounter more noise.
This indicator could be used as a compass for DCA or TV bots as well.
What To Look For
When the background of the candlestick closes green with an upwards pointing pink arrow. It indicates a possible bullish (up)trend. To enter a trade its best to place an order a few ticks above the candle high. This way we only enter a position, when there is trend continuation.
When the background of the candlestick closes red with a downwards pointing black arrow. It indicates a possible bearish (down)trend. To enter a trade its best to place an order a few ticks below the candle low.
Exits can be determined by Fibonacci extensions, orderblocks or other resistances to name a few. Or exit the trade when the opposite background color appears.
Final words
Disclaimer: Please use it with care and at own risk. The owner of this indicator is not liable for any financial losses.
Past performance is no guarantee of future returns.

SuperTrend With EMA100First of all, SuperTrend Indicator is an indicator developed by KivancOzbilgic and I would like to thank him for sharing this indicator with open source code.
In this version of Supertrend, I wanted to determine the best reaction point for upcoming dips in uptrends.
The indicator is easy to use and gives an accurate reading about an ongoing trend. EMA was determined as the source.
There are 3 parameters that you can edit. These are the EMA length, ATR period and ATR Multiplier.
The average true range (ATR) plays an important role in 'Supertrend' as the indicator uses ATR to calculate its value. The ATR indicator signals the degree of price volatility .
I've found it's a bestreaction point when these values are set to 100, 10 and 0.5 respectively. I tried to show them in the graph.

Supertrend with Chop SuppressionA Standard Supertrend indicator with Chop Suppression added to minimize bad entries when the market goes sideways. Chop Suppression will hide alerts/entry signals that otherwise would have been generated during sideway price action.
Recommend using this indicator with a secondary long-term trend indicator such as VWAP or 200 EMA . Trade with the long-term trend for higher success rates.
You can use either traditional fixed stop loss and profit taking or adjust the stop loss with the rising Supertrend line and exit when color of Supertrend changes.
Good luck!

SuperTrend BFThe SuperTrend overlay by Olivier Seban provides an excellent 'trailing stop' that can be used with any bar length for bullish or bearish moves. My preferred timeframe is weekly for capturing huge (Super) moves. For instance applying it to AAPL, this baby would have us reeling in a fivebagger over the course of three years. Patience and holding your nerve are key to trend following and I like to think of SuperTrend as a great big visual 'crutch' right there on the chart.
Essentially this is an average true range trailing stop, of which there are several versions available (eg see the Sylvain Vervoort version programmed by H Potter). SuperTrend differs by referring the stop back from the middle of the bar (High+Low)/2. This is similar to using the Vervoort with a tweak to the number of ATR's considered. At the end of the day its a matter of preference and what works best for you.

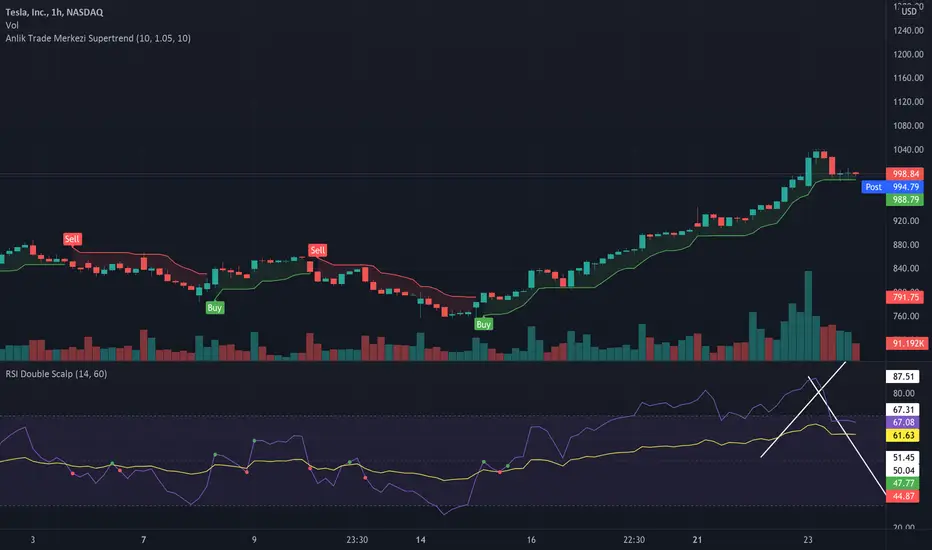
Anlik Trade Merkezi SupertrendSupertrend modified with vwma. In addition to the supertrend settings in the settings section, determine the vwma length and set it according to the chart timeframe.
Supertrend ATR TableThis is a multi timeframe table that shows a supertrend based ATR for timeframes from 5 minutes to monthly.
It is one half of a set of two indicators. This one is the table and the other one, Supertrend Lines Labels Full Set plots lines and labels.
The table is arranged left to right from shortest to highest timeframe
There are also alerts for each timeframe ATR that are best placed on a chart of 15 min or higher to avoid multiple repeat alerts within a short span of time.
One of the higher level uses is to track trend progression by seeing price move from timeframe ATR to another
User inputs cover colors, and how far in ticks "near" is defined as there are four colors in the table - up, down, up/near and down/near
The ATR settings are also changeable by user input


Supertrend Buy or Sell Signal - oringan fixI fixed SuperTrend little (origin if from LazyBear)
I love SuperTrend !!!!! so nice script!!!
and
I like alt-coin and 4hour candle.
That is why i fixed it.
Recommand 4hour and 4factor, 1pd.
and 1 trade per day.
It loose often but the loss ratio is about -8~15%
But when it win, it could earn much money!
If i have better idea, i will update this script
Korean : 4시간 봉 추천합니다. 하루에 한번정도의 매매를 목표로 설정했습니다. 더 좋은 설정값을 찾으면 업데이트할게요.
지표 추가 방법 간단 설명 (나중에 자세한 글 써서 스팀잇 할 예정)
아래 하단에 add to favorite 누르고, 차트 보는 중에 우클릭 - 지표넣기 - 즐겨찾기 - 지표이름찾아서 클릭.

Supertrend 1.0 with AlertsThe same as the original Supertrend 1.0 indicator except I have added alerts and set the bar colour based on the trend.
Original code is here:

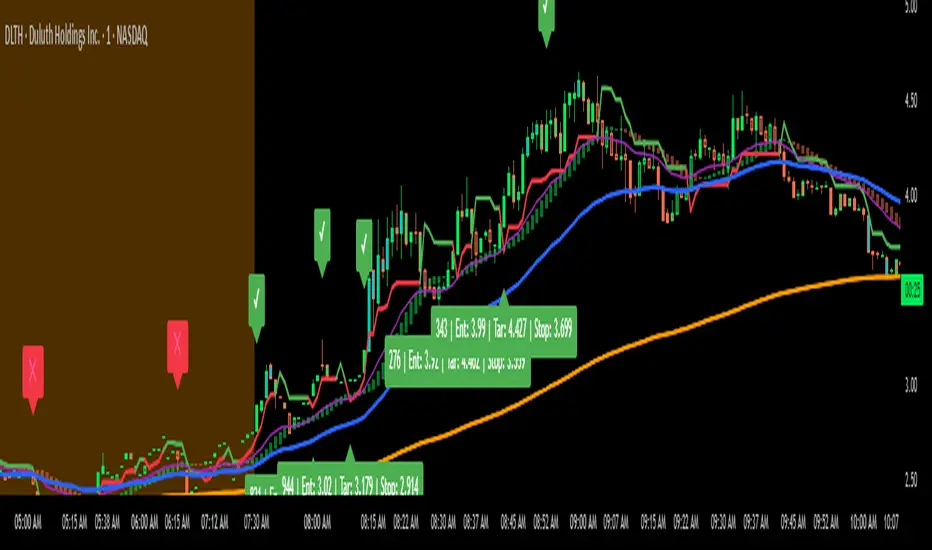
Supertrend Long/Short with Adjustable R:R by JJThis script is a Supertrend-based trading tool with:
Long/Short trade signals
Risk/reward calculation
Position sizing based on risk, capital, and max shares
Visual labels for entries, targets, and stops
Checkmarks (✔) for successful trades and crosses (❌) for stopped trades
Alerts for trade entries
It’s designed for visual analysis on charts, helping you see trades, their targets, and whether they hit profit or stop-loss.

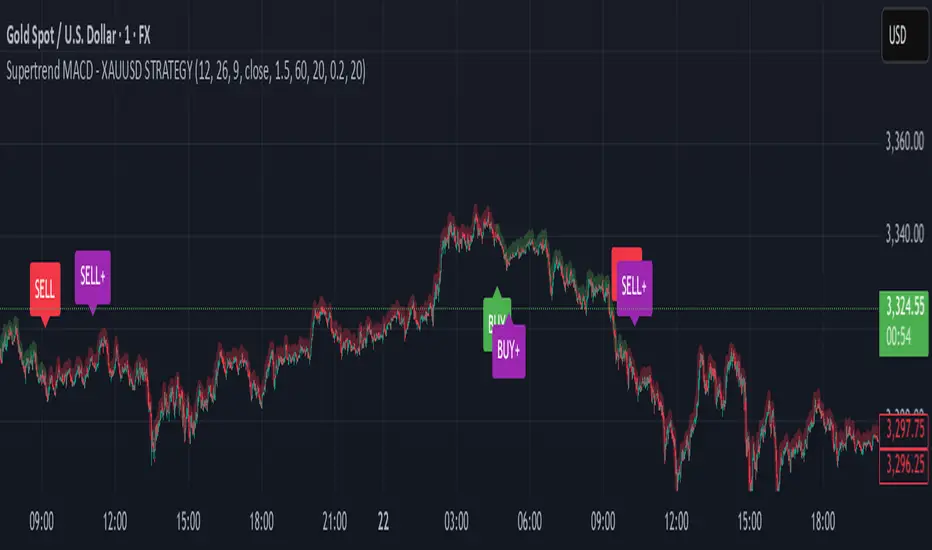
Supertrend MACD - XAUUSD STRATEGY 🔶 Supertrend MACD - XAUUSD STRATEGY (v6) (XAUUSD ONLY FOR NOW)
A high-performance, multi-filtered MACD-based strategy tailored for XAUUSD (Gold) traders seeking precision entries during trending conditions. This indicator intelligently combines multiple technical layers—momentum, trend strength, volatility, and market structure—to help identify high-probability trade setups with improved reliability.
🧠 Core Logic & Features Explained:
🔸 MACD Momentum Engine
At the heart of the strategy lies the traditional MACD indicator (Moving Average Convergence Divergence), calculating the difference between two EMAs (fast and slow) and smoothing it with a signal line.
Buy Signal: Triggered when the MACD line crosses above the signal line.
Sell Signal: Triggered when the MACD line crosses below the signal line.
These signals are the foundation, but only the beginning of a layered decision-making process.
🔸 Higher Timeframe (HTF) Trend Confirmation
To filter out noise and false breakouts, the indicator references MACD values from a higher timeframe (configurable by the user). This powerful multi-timeframe approach ensures that entries only occur in alignment with the dominant macro-trend.
Ensures entries are not taken counter to larger market movements.
Helps identify momentum continuation setups and avoid chop.
🔸 Support Arrow Display (Optional)
For visual traders, an option to display support arrows on the chart can be enabled. These assist in identifying visually intuitive entry points and enhance situational awareness.
⚙️ User-Customizable Inputs:
MACD Settings: Fast EMA, Slow EMA, Signal EMA lengths.
Signal Offset: For visual alignment and candle matching.
HTF MACD Settings: Select any timeframe for higher timeframe filtering.
ATR and ADX Thresholds: Fine-tune filters to match your trading style.
Structure Break Lookback: Adjust BOS+ logic sensitivity.
Arrow Toggles: Enable or disable visual support arrows as needed.
THIS indicator is in its alpha stage, currently it only works on XAUUSD pairs, i plan to update this indicator so that it functions on every single pair available on Trading view
Another note, the signals given only become solid after the second the candlestick, after this the signal becomes solid. REPAINTING CAN HAPPEN AFTER THE FIRST CANDLE STICK OF THE SIGNAL BUT NOT AFTER THE SECOND
As this indicator is only in its alpha stage it should be used as such, every person is responsible for there own personal investments
SuperTrend Momentum OscillatorOverview
The SuperTrend Momentum Oscillator (SMO) is a powerful technical analysis tool designed to identify trend direction and strength in financial markets. It combines short-term and long-term oscillator calculations to provide traders with a comprehensive view of market conditions through an intuitive candle-based visualization system.
Key Features
Dual-period oscillator system (short-term and long-term)
Candle-based visualization showing trend direction and alignment
Color-coded trend direction based on the main (slower) trend line
Candle size reflecting alignment between fast and slow components
High-confidence "Super" signals (green diamonds for buys, purple diamonds for sells)
Market liquidity insights through oscillator readings
Understanding the Candle Visualization
Main Trend vs. Fast Money
The SMO uses two key components that work together:
Main Trend Line (Slower): The longer-period oscillator that acts as the primary trend indicator
Dictates the overall color of the candles (green for uptrend, red for downtrend)
Represents the dominant market direction
Fast Line (Quicker): The shorter-period oscillator that reacts more quickly to price changes
Helps determine the size of candles through its alignment with the main trend
Represents "fast money" or shorter-term price reactions
Candle Components and Their Meaning
1. Candle Color
The color of each candle is determined by the direction of the main trend line:
Green Candles: Main trend line is rising (bullish)
Indicates an overall uptrend regardless of short-term fluctuations
Remains green even when the fast line temporarily moves against the trend
Red Candles: Main trend line is falling (bearish)
Indicates an overall downtrend regardless of short-term fluctuations
Remains red even when the fast line temporarily moves against the trend
2. Candle Body Size
The body size of each candle represents the alignment between fast and main trend lines:
Large Bodies: Both fast and main trend lines are moving in the same direction
Trading Action: Strong confirmation of the trend direction
Confidence Level: High confidence signals
Small Bodies: Fast line is moving against the main trend line
Trading Action: Exercise caution; potential for temporary pullback or consolidation
Confidence Level: Lower confidence in immediate continuation
3. Wick Length
Wicks (shadows) provide additional information about price rejection and volatility:
Long Wicks: Indicate price rejection and potential volatility
Trading Action: Be cautious of trend continuation when long wicks appear
Confidence Level: Reduced confidence in immediate trend continuation
Short Wicks: Indicate strong directional control with minimal rejection
Trading Action: More confidence in trend continuation
Confidence Level: Higher confidence in the current trend direction
Candle Patterns Over Time
The progression of candles provides valuable trend information:
Large Green Candles: Main trend is up and fast line confirms (strong bullish)
Trading Action: Consider entering or adding to long positions
Confidence Level: High confidence in uptrend
Small Green Candles: Main trend is up but fast line is moving down (caution in uptrend)
Trading Action: Hold existing long positions but wait before adding
Confidence Level: Moderate confidence in uptrend, possible short-term pullback
Large Red Candles: Main trend is down and fast line confirms (strong bearish)
Trading Action: Consider entering or adding to short positions
Confidence Level: High confidence in downtrend
Small Red Candles: Main trend is down but fast line is moving up (caution in downtrend)
Trading Action: Hold existing short positions but wait before adding
Confidence Level: Moderate confidence in downtrend, possible short-term bounce
Super Signals - High Confidence Trading Opportunities
The SMO focuses exclusively on high-confidence "Super" signals:
Green Diamond Super Buy Signals
Meaning: Both short-term and long-term oscillators are generating buy signals simultaneously
Visual Indicator: Green diamond markers at the bottom of the indicator (0 level)
Trading Action: Strong entry signal for long positions
Confidence Level: High confidence signal, especially when accompanied by large green candles
Purple Diamond Super Sell Signals
Meaning: Both short-term and long-term oscillators are generating sell signals simultaneously
Visual Indicator: Purple diamond markers at the top of the indicator (100 level)
Trading Action: Strong entry signal for short positions or exit signal for long positions
Confidence Level: High confidence signal, especially when accompanied by large red candles
Market Liquidity Concept
The SMO provides a unique perspective on market conditions that goes beyond traditional oscillator interpretations:
Low Oscillator Readings (Below 20)
When the oscillator shows low readings (below 20), this indicates:
Traditional interpretation: Market is oversold, potential for upward reversal
Liquidity interpretation: Insufficient money in the market
This suggests thin trading conditions where large orders may have outsized impact
Price movements may be more erratic and less predictable
Breakouts may lack follow-through due to insufficient participation
High Oscillator Readings (Above 80)
When the oscillator shows high readings (above 80), this indicates:
Traditional interpretation: Market is overbought, potential for downward reversal
Liquidity interpretation: Abundant money in the market
This suggests deep trading conditions with high participation
Price movements tend to be more orderly and trend-based
Breakouts may have stronger follow-through due to high participation
Trading Strategies with SMO
Strategy 1: Main Trend with Alignment Confirmation
This strategy uses the main trend direction with alignment confirmation:
Entry Criteria:
Main trend direction is established (green or red candles)
Fast line aligns with main trend (large candles)
Super signal confirms (green or purple diamond)
Exit Criteria:
For long positions: When candles turn red or Super Sell signal appears
For short positions: When candles turn green or Super Buy signal appears
Stop Loss Placement:
For long positions: Below recent swing low
For short positions: Above recent swing high
Strategy 2: Counter-Trend Opportunity Detection
This strategy identifies potential counter-trend opportunities:
Entry Criteria:
Small candles appear (indicating disagreement between fast and main trend lines)
Oscillator reaches extreme levels (above 80 or below 20)
Wait for candle color change before entering
Position Sizing:
Use smaller position sizes for counter-trend trades
Increase size only when main trend confirms the new direction
Exit Criteria:
Take profit at the first sign of alignment in the opposite direction
Use tighter stops than with trend-following trades
Strategy 3: Market Liquidity Strategy
This strategy incorporates the market liquidity concept:
For Low Liquidity Conditions (Readings below 20):
Wait for Super Buy signals (green diamond)
Use smaller position sizes
Be prepared for potentially erratic price movements
Look for signs of increasing liquidity (expanding candle bodies) before adding to positions
For High Liquidity Conditions (Readings above 80):
Consider holding positions longer despite "overbought" readings
Use trailing stops to capture extended moves
Be aware that trends may persist longer than expected
Practical Trading Scenarios
Scenario 1: Strong Trend Confirmation
Candle Pattern: Series of large green candles (main trend up, fast line confirms)
Signal: Green diamond Super Buy marker at the bottom (0 level)
Background: Intensifying green gradient
Action: Enter long position with confidence
Stop Loss: Below recent swing low
Take Profit: When candles become small or turn red
Scenario 2: Trend Weakening Detection
Candle Pattern: Green candles becoming smaller (main trend still up, but fast line diverging)
Signal: No new signals
Background: Fading green gradient
Action: Tighten stops on long positions, prepare for potential reversal
Reasoning: Fast money is starting to move against the main trend
Scenario 3: Trend Reversal Identification
Candle Pattern: Transition from small green candles to red candles (main trend changing)
Signal: Appearance of purple diamond Super Sell marker at the top (100 level)
Background: Changing from green to red gradient
Action: Exit long positions and potentially enter short positions
Timing: Most effective when reversal occurs near overbought (80) level
