Luxy BIG beautiful Dynamic ORBThis is an advanced Opening Range Breakout (ORB) indicator that tracks price breakouts from the first 5, 15, 30, and 60 minutes of the trading session. It provides complete trade management including entry signals, stop-loss placement, take-profit targets, and position sizing calculations.
The ORB strategy is based on the concept that the opening range of a trading session often acts as support/resistance, and breakouts from this range tend to lead to significant moves.
What Makes This Different?
Most ORB indicators simply draw horizontal lines and leave you to figure out the rest. This indicator goes several steps further:
Multi-Stage Tracking
Instead of just one ORB timeframe, this tracks FOUR simultaneously (5min, 15min, 30min, 60min). Each stage builds on the previous one, giving you multiple trading opportunities throughout the session.
Active Trade Management
When a breakout occurs, the indicator automatically calculates and displays entry price, stop-loss, and multiple take-profit targets. These lines extend forward and update in real-time until the trade completes.
Cycle Detection
Unlike indicators that only show the first breakout, this tracks the complete cycle: Breakout → Retest → Re-breakout. You can see when price returns to test the ORB level after breaking out (potential re-entry).
Failed Breakout Warning
If price breaks out but quickly returns inside the range (within a few bars), the label changes to "FAILED BREAK" - warning you to exit or avoid the trade.
Position Sizing Calculator
Built-in risk management that tells you exactly how many shares to buy based on your account size and risk tolerance. No more guessing or manual calculations.
Advanced Filtering
Optional filters for volume confirmation, trend alignment, and Fair Value Gaps (FVG) to reduce false signals and improve win rate.
Core Features Explained
### 1. Multi-Stage ORB Levels
The indicator builds four separate Opening Range levels:
ORB 5 - First 5 minutes (fastest signals, most volatile)
ORB 15 - First 15 minutes (balanced, most popular)
ORB 30 - First 30 minutes (slower, more reliable)
ORB 60 - First 60 minutes (slowest, most confirmed)
Each level is drawn as a horizontal range on your chart. As time progresses, the ranges expand to include more price action. You can enable or disable any stage and assign custom colors to each.
How it works: During the opening minutes, the indicator tracks the highest high and lowest low. Once the time period completes, those levels become your ORB high and low for that stage.
### 2. Breakout Detection
When price closes outside the ORB range, a label appears:
BREAK UP (green label above price) - Price closed above ORB High
BREAK DOWN (red label below price) - Price closed below ORB Low
The label shows which ORB stage triggered (ORB5, ORB15, etc.) and the cycle number if tracking multiple breakouts.
Important: Signals appear on bar close only - no repainting. What you see is what you get.
### 3. Retest Detection
After price breaks out and moves away, if it returns to test the ORB level, a "RETEST" label appears (orange). This indicates:
The original breakout level is now acting as support/resistance
Potential re-entry opportunity if you missed the first breakout
Confirmation that the level is significant
The indicator requires price to move a minimum distance away before considering it a valid retest (configurable in settings).
### 4. Failed Breakout Detection
If price breaks out but returns inside the ORB range within a few bars (before the breakout is "committed"), the original label changes to "FAILED BREAK" in orange.
This warns you:
The breakout lacked conviction
Consider exiting if already in the trade
Wait for better setup
Committed Breakout: The indicator tracks how many bars price stays outside the range. Only after staying outside for the minimum number of bars does it become a committed breakout that can be retested.
### 5. TP/SL Lines (Trade Management)
When a breakout occurs, colored horizontal lines appear showing:
Entry Line (cyan for long, orange for short) - Your entry price (the ORB level)
Stop Loss Line (red) - Where to exit if trade goes against you
TP1, TP2, TP3 Lines (same color as entry) - Profit targets at 1R, 2R, 3R
These lines extend forward as new bars form, making it easy to track your trade. When a target is hit, the line turns green and the label shows a checkmark.
Lines freeze (stop updating) when:
Stop loss is hit
The final enabled take-profit is hit
End of trading session (optional setting)
### 6. Position Sizing Dashboard
The dashboard (bottom-left corner by default) shows real-time information:
Current ORB stage and range size
Breakout status (Inside Range / Break Up / Break Down)
Volume confirmation (if filter enabled)
Trend alignment (if filter enabled)
Entry and Stop Loss prices
All enabled Take Profit levels with percentages
Risk/Reward ratio
Position sizing: Max shares to buy and total risk amount
Position Sizing Example:
If your account is $25,000 and you risk 1% per trade ($250), and the distance from entry to stop loss is $0.50, the calculator shows you can buy 500 shares (250 / 0.50 = 500).
### 7. FVG Filter (Fair Value Gap)
Fair Value Gaps are price inefficiencies - gaps left by strong momentum where one candle's high doesn't overlap with a previous candle's low (or vice versa).
When enabled, this filter:
Detects bullish and bearish FVGs
Draws semi-transparent boxes around these gaps
Only allows breakout signals if there's an FVG near the breakout level
Why this helps: FVGs indicate institutional activity. Breakouts through FVGs tend to be stronger and more reliable.
Proximity setting: Controls how close the FVG must be to the ORB level. 2.0x means the breakout can be within 2 times the FVG size - a reasonable default.
### 8. Volume & Trend Filters
Volume Filter:
Requires current volume to be above average (customizable multiplier). High volume breakouts are more likely to sustain.
Set minimum multiplier (e.g., 1.5x = 50% above average)
Set "strong volume" multiplier (e.g., 2.5x) that bypasses other filters
Dashboard shows current volume ratio
Trend Filter:
Only shows breakouts aligned with a higher timeframe trend. Choose from:
VWAP - Price above/below volume-weighted average
EMA - Price above/below exponential moving average
SuperTrend - ATR-based trend indicator
Combined modes (VWAP+EMA, VWAP+SuperTrend) for stricter filtering
### 9. Pullback Filter (Advanced)
Purpose:
Waits for price to pull back slightly after initial breakout before confirming the signal.
This reduces false breakouts from immediate reversals.
How it works:
- After breakout is detected, indicator waits for a small pullback (default 2%)
- Once pullback occurs AND price breaks out again, signal is confirmed
- If no pullback within timeout period (5 bars), signal is issued anyway
Settings:
Enable Pullback Filter: Turn this filter on/off
Pullback %: How much price must pull back (2% is balanced)
Timeout (bars): Max bars to wait for pullback (5 is standard)
When to use:
- Choppy markets with many fake breakouts
- When you want higher quality signals
- Combine with Volume filter for maximum confirmation
Trade-off:
- Better signal quality
- May miss some valid fast moves
- Slight entry delay
How to Use This Indicator
### For Beginners - Simple Setup
Add the indicator to your chart (5-minute or 15-minute timeframe recommended)
Leave all default settings - they work well for most stocks
Watch for BREAK UP or BREAK DOWN labels to appear
Check the dashboard for entry, stop loss, and targets
Use the position sizing to determine how many shares to buy
Basic Trading Plan:
Wait for a clear breakout label
Enter at the ORB level (or next candle open if you're late)
Place stop loss where the red line indicates
Take profit at TP1 (50% of position) and TP2 (remaining 50%)
### For Advanced Traders - Customized Setup
Choose which ORB stages to track (you might only want ORB15 and ORB30)
Enable filters: Volume (stocks) or Trend (trending markets)
Enable FVG filter for institutional confirmation
Set "Track Cycles" mode to catch retests and re-breakouts
Customize stop loss method (ATR for volatile stocks, ORB% for stable ones)
Adjust risk per trade and account size for accurate position sizing
Advanced Strategy Example:
Enable ORB15 only (disable others for cleaner chart)
Turn on Volume filter at 1.5x with Strong at 2.5x
Enable Trend filter using VWAP
Set Signal Mode to "Track Cycles" with Max 3 cycles
Wait for aligned breakouts (Volume + Trend + Direction)
Enter on retest if you missed the initial break
### Timeframe Recommendations
5-minute chart: Scalping, very active trading, crypto
15-minute chart: Day trading, balanced approach (most popular)
30-minute chart: Swing entries, less screen time
60-minute chart: Position trading, longer holds
The indicator works on any intraday timeframe, but ORB is fundamentally a day trading strategy. Daily charts don't make sense for ORB.
DEFAULT CONFIGURATION
ON by Default:
• All 4 ORB stages (5/15/30/60)
• Breakout Detection
• Retest Labels
• All TP levels (1/1.5/2/3)
• TP/SL Lines (Detailed mode)
• Dashboard (Bottom Left, Dark theme)
• Position Size Calculator
OFF by Default (Optional Filters):
• FVG Filter
• Pullback Filter
• Volume Filter
• Trend Filter
• HTF Bias Check
• Alerts
Recommended for Beginners:
• Leave all defaults
• Session Mode: Auto-Detect
• Signal Mode: Track Cycles
• Stop Method: ATR
• Add Volume Filter if trading stocks
Recommended for Advanced:
• Enable ORB15 + ORB30 only (disable 5 & 60)
• Enable: Volume + Trend + FVG
• Signal Mode: Track Cycles, Max 3
• Stop Method: ATR or Safer
• Enable HTF Daily bias check
## Settings Guide
The settings are organized into logical groups. Here's what each section controls:
### ORB COLORS Section
Show Edge Labels: Display "ORB 5", "ORB 15" labels at the right edge of the levels
Background: Fill the area between ORB high/low with color
Transparency: How see-through the background is (95% is nearly invisible)
Enable ORB 5/15/30/60: Turn each stage on or off individually
Colors: Assign colors to each ORB stage for easy identification
### SESSION SETTINGS Section
Session Mode: Choose trading session (Auto-Detect works for most instruments)
Custom Session Hours: Define your own hours if needed (format: HHMM-HHMM)
Auto-Detect uses the instrument's natural hours (stocks use exchange hours, crypto uses 24/7).
### BREAKOUT DETECTION Section
Enable Breakout Detection: Master switch for signals
Show Retest Labels: Display retest signals
Label Size: Visual size for all labels (Small recommended)
Enable FVG Filter: Require Fair Value Gap confirmation
Show FVG Boxes: Display the gap boxes on chart
Signal Mode: "First Only" = one signal per direction per day, "Track Cycles" = multiple signals
Max Cycles: How many breakout-retest cycles to track (6 is balanced)
Breakout Buffer: Extra distance required beyond ORB level (0.1-0.2% recommended)
Min Distance for Retest: How far price must move away before retest is valid (2% recommended)
Min Bars Outside ORB: Bars price must stay outside for committed breakout (2 is balanced)
### TARGETS & RISK Section
Enable Targets & Stop-Loss: Calculate and show trade management
TP1/TP2/TP3 checkboxes: Select which profit targets to display
Stop Method: How to calculate stop loss placement
- ATR: Based on volatility (best for most cases)
- ORB %: Fixed % of ORB range
- Swing: Recent swing high/low
- Safer: Widest of all methods
ATR Length & Multiplier: Controls ATR stop distance (14 period, 1.5x is standard)
ORB Stop %: Percentage beyond ORB for stop (20% is balanced)
Swing Bars: Lookback period for swing high/low (3 is recent)
### TP/SL LINES Section
Show TP/SL Lines: Display horizontal lines on chart
Label Format: "Short" = minimal text, "Detailed" = shows prices
Freeze Lines at EOD: Stop extending lines at session close
### DASHBOARD Section
Show Info Panel: Display the metrics dashboard
Theme: Dark or Light colors
Position: Where to place dashboard on chart
Toggle rows: Show/hide specific information rows
Calculate Position Size: Enable the position sizing calculator
Risk Mode: Risk fixed $ amount or % of account
Account Size: Your total trading capital
Risk %: Percentage to risk per trade (0.5-1% recommended)
### VOLUME FILTER Section
Enable Volume Filter: Require volume confirmation
MA Length: Average period (20 is standard)
Min Volume: Required multiplier (1.5x = 50% above average)
Strong Volume: Multiplier that bypasses other filters (2.5x)
### TREND FILTER Section
Enable Trend Filter: Require trend alignment
Trend Mode: Method to determine trend (VWAP is simple and effective)
Custom EMA Length: If using EMA mode (50 for swing, 20 for day trading)
SuperTrend settings: Period and Multiplier if using SuperTrend mode
### HIGHER TIMEFRAME Section
Check Daily Trend: Display higher timeframe bias in dashboard
Timeframe: What TF to check (D = daily, recommended)
Method: Price vs MA (stable) or Candle Direction (reactive)
MA Period: EMA length for Price vs MA method (20 is balanced)
Min Strength %: Minimum strength threshold for HTF bias to be considered
- For "Price vs MA": Minimum distance (%) from moving average
- For "Candle Direction": Minimum candle body size (%)
- 0.5% is balanced - increase for stricter filtering
- Lower values = more signals, higher values = only strong trends
### ALERTS Section
Enable Alerts: Master switch (must be ON to use any alerts)
Breakout Alerts: Notify on ORB breakouts
Retest Alerts: Notify when price retests after breakout
Failed Break Alerts: Notify on failed breakouts
Stage Complete Alerts: Notify when each ORB stage finishes forming
After enabling desired alert types, click "Create Alert" button, select this indicator, choose "Any alert() function call".
## Tips & Best Practices
### General Trading Tips
ORB works best on liquid instruments (stocks with good volume, major crypto pairs)
First hour of the session is most important - that's when ORB is forming
Breakouts WITH the trend have higher success rates - use the trend filter
Failed breakouts are common - use the "Min Bars Outside" setting to filter weak moves
Not every day produces good ORB setups - be patient and selective
### Position Sizing Best Practices
Never risk more than 1-2% of your account on a single trade
Use the built-in calculator - don't guess your position size
Update your account size monthly as it grows
Smaller accounts: use $ Amount mode for simplicity
Larger accounts: use % of Account mode for scaling
### Take Profit Strategy
Most traders use: 50% at TP1, 50% at TP2
Aggressive: Hold through TP1 for TP2 or TP3
Conservative: Full exit at TP1 (1:1 risk/reward)
After TP1 hits, consider moving stop to breakeven
TP3 rarely hits - only on strong trending days
### Filter Combinations
Maximum Quality: Volume + Trend + FVG (fewest signals, highest quality)
Balanced: Volume + Trend (good quality, reasonable frequency)
Active Trading: No filters or Volume only (many signals, lower quality)
Trending Markets: Trend filter essential (indices, crypto)
Range-Bound: Volume + FVG (avoid trend filter)
### Common Mistakes to Avoid
Chasing breakouts - wait for the bar to close, don't FOMO into wicks
Ignoring the stop loss - always use it, move it manually if needed
Over-leveraging - the calculator shows MAX shares, you can buy less
Trading every signal - quality > quantity, use filters
Not tracking results - keep a journal to see what works for YOU
## Pros and Cons
### Advantages
Complete all-in-one solution - from signal to position sizing
Multiple timeframes tracked simultaneously
Visual clarity - easy to see what's happening
Cycle tracking catches opportunities others miss
Built-in risk management eliminates guesswork
Customizable filters for different trading styles
No repainting - what you see is locked in
Works across multiple markets (stocks, forex, crypto)
### Limitations
Intraday strategy only - doesn't work on daily charts
Requires active monitoring during first 1-2 hours of session
Not suitable for after-hours or extended sessions by default
Can produce many signals in choppy markets (use filters)
Dashboard can be overwhelming for complete beginners
Performance depends on market conditions (trends vs ranges)
Requires understanding of risk management concepts
### Best For
Day traders who can watch the first 1-2 hours of market open
Traders who want systematic entry/exit rules
Those learning proper position sizing and risk management
Active traders comfortable with multiple signals per day
Anyone trading liquid instruments with clear sessions
### Not Ideal For
Swing traders holding multi-day positions
Set-and-forget / passive investors
Traders who can't watch market open
Complete beginners unfamiliar with trading concepts
Low volume / illiquid instruments
## Frequently Asked Questions
Q: Why are no signals appearing?
A: Check that you're on an intraday timeframe (5min, 15min, etc.) and that the current time is within your session hours. Also verify that "Enable Breakout Detection" is ON and at least one ORB stage is enabled. If using filters, they might be blocking signals - try disabling them temporarily.
Q: What's the best ORB stage to use?
A: ORB15 (15 minutes) is most popular and balanced. ORB5 gives faster signals but more noise. ORB30 and ORB60 are slower but more reliable. Many traders use ORB15 + ORB30 together.
Q: Should I enable all the filters?
A: Start with no filters to see all signals. If too many false signals, add Volume filter first (stocks) or Trend filter (trending markets). FVG filter is most restrictive - use for maximum quality but fewer signals.
Q: How do I know which stop loss method to use?
A: ATR works for most cases - it adapts to volatility. Use ORB% if you want predictable stop placement. Swing is for respecting chart structure. Safer gives you the most room but largest risk.
Q: Can I use this for swing trading?
A: Not really - ORB is fundamentally an intraday strategy. The ranges reset each day. For swing trading, look at weekly support/resistance or moving averages instead.
Q: Why do TP/SL lines disappear sometimes?
A: Lines freeze (stop extending) when: stop loss is hit, the last enabled take-profit is hit, or end of session arrives (if "Freeze at EOD" is enabled). This is intentional - the trade is complete.
Q: What's the difference between "First Only" and "Track Cycles"?
A: "First Only" shows one breakout UP and one DOWN per day maximum - clean but might miss opportunities. "Track Cycles" shows breakout-retest-rebreak sequences - more signals but busier chart.
Q: Is position sizing accurate for options/forex?
A: The calculator is designed for shares (stocks). For options, ignore the share count and use the risk amount. For forex, you'll need to adapt the lot size calculation manually.
Q: How much capital do I need to use this?
A: The indicator works for any account size, but practical day trading typically requires $25,000 in the US due to Pattern Day Trader rules. Adjust the "Account Size" setting to match your capital.
Q: Can I backtest this strategy?
A: This is an indicator, not a strategy script, so it doesn't have built-in backtesting. You can visually review historical signals or code a strategy script using similar logic.
Q: Why does the dashboard show different entry price than the breakout label?
A: If you're looking at an old breakout, the ORB levels may have changed when the next stage completed. The dashboard always shows the CURRENT active range and trade setup.
Q: What's a good win rate to expect?
A: ORB strategies typically see 40-60% win rate depending on market conditions and filters used. The strategy relies on positive risk/reward ratios (2:1 or better) to be profitable even with moderate win rates.
Q: Does this work on crypto?
A: Yes, but crypto trades 24/7 so you need to define what "session start" means. Use Session Mode = Custom and set your preferred daily reset time (e.g., 0000-2359 UTC).
## Credits & Transparency
### Development
This indicator was developed with the assistance of AI technology to implement complex ORB trading logic.
The strategy concept, feature specifications, and trading logic were designed by the publisher. The implementation leverages modern development tools to ensure:
Clean, efficient, and maintainable code
Comprehensive error handling and input validation
Detailed documentation and user guidance
Performance optimization
### Trading Concepts
This indicator implements several public domain trading concepts:
Opening Range Breakout (ORB): Trading strategy popularized by Toby Crabel, Mark Fisher and many more talanted traders.
Fair Value Gap (FVG): Price imbalance concept from ICT methodology
SuperTrend: ATR-based trend indicator using public formula
Risk/Reward Ratio: Standard risk management principle
All mathematical formulas and technical concepts used are in the public domain.
### Pine Script
Uses standard TradingView built-in functions:
ta.ema(), ta.atr(), ta.vwap(), ta.highest(), ta.lowest(), request.security()
No external libraries or proprietary code from other authors.
## Disclaimer
This indicator is provided for educational and informational purposes only. It is not financial advice.
Trading involves substantial risk of loss and is not suitable for every investor. Past performance shown in examples is not indicative of future results.
The indicator provides signals and calculations, but trading decisions are solely your responsibility. Always:
Test strategies on paper before using real money
Never risk more than you can afford to lose
Understand that all trading involves risk
Consider seeking advice from a licensed financial advisor
The publisher makes no guarantees regarding accuracy, profitability, or performance. Use at your own risk.
---
Version: 3.0
Pine Script Version: v6
Last Updated: October 2024
For support, questions, or suggestions, please comment below or send a private message.
---
Happy trading, and remember: consistent risk management beats perfect entry timing every time.
"stop loss" için komut dosyalarını ara

Synapse Dynamics - Market Structure📊 SYNAPSE DYNAMICS - MARKET STRUCTURE INDICATOR
An educational tool for learning and practicing Smart Money Concepts (SMC) methodology through visual representation of institutional price action patterns.
═══════════════════════════════════════════════════
🎯 WHAT THIS INDICATOR DISPLAYS
This indicator visualizes Smart Money Concepts patterns on your chart:
- Order Blocks (OB) - Supply and demand zones based on institutional order flow theory. The indicator identifies these areas using price action criteria including the final opposing candle before a strong directional move.
- Breaker Blocks - Failed order blocks that may act as support/resistance. These occur when an order block is invalidated but price returns to the zone, potentially reversing its role.
- Fair Value Gaps (FVG) - Three-candle imbalance patterns where price gaps create inefficiencies. The indicator marks these zones for reference in analysis.
- Market Structure - Break of Structure (BOS) and Change of Character (CHoCH) patterns based on swing high/low breaks. These help identify potential trend continuation or reversal points.
- Reference Entry Signals - The indicator calculates potential entry zones with accompanying stop loss and take profit reference levels based on order block and FVG locations. These are for educational reference only.
- Higher Timeframe Context - Optional filter that displays the higher timeframe trend direction to provide additional market context.
- Information Panel - On-screen dashboard showing active reference signals, their status, and relevant price levels.
- Swing Point Mapping - Labels recent higher highs (HH), higher lows (HL), lower highs (LH), and lower lows (LL) based on configurable swing detection parameters.
═══════════════════════════════════════════════════
⚙️ HOW IT WORKS
The indicator uses the following methodology:
**Order Block Detection:** Identifies the last opposing candle before a strong directional move that breaks structure. Filters blocks by size to reduce noise.
**Market Structure Analysis:** Tracks swing points and identifies when price breaks previous highs/lows to determine BOS or CHoCH patterns.
**Fair Value Gap Identification:** Detects three-candle patterns where candle 1's high/low doesn't overlap with candle 3's low/high, creating an imbalance zone.
**Reference Signal Generation:** Combines order block proximity, FVG presence, and market structure breaks to suggest potential study areas. Optional HTF trend filter can be enabled.
**Timeframe Adaptation:** Automatically adjusts swing detection sensitivity based on the chart timeframe (using multipliers for intraday vs. higher timeframes).
═══════════════════════════════════════════════════
📚 EDUCATIONAL PURPOSE & IMPORTANT LIMITATIONS
**This indicator is designed as an educational tool for:**
- Learning Smart Money Concepts methodology
- Practicing pattern recognition
- Understanding institutional price action theories
- Analyzing market structure visually
**Critical Understanding:**
- All signals and levels are REFERENCE POINTS for study - not trading recommendations
- The indicator displays patterns based on historical price action - it cannot predict future movements
- Smart Money Concepts is a theoretical framework - market behavior varies
- Backtested or historical results shown do not guarantee future performance
- No indicator can account for all market variables, news events, or changing conditions
**Proper Use:**
This tool is meant to assist in learning technical analysis concepts. Users must develop their own analysis skills, risk management strategies, and trading plans. The displayed patterns require interpretation within broader market context.
═══════════════════════════════════════════════════
⚙️ CUSTOMIZATION OPTIONS
**Adjustable Parameters:**
- Order Block: Minimum size threshold, maximum count displayed
- Fair Value Gaps: Toggle visibility, maximum count
- Market Structure: Swing detection length, BOS/CHoCH display
- Signals: Entry/SL/TP calculation method, HTF filter toggle
- Visual Settings: Colors, line styles, label sizes, panel position
**Timeframe Compatibility:**
Works on all timeframes from 1-minute to monthly charts. The swing detection automatically scales based on timeframe.
═══════════════════════════════════════════════════
⚠️ DISCLAIMER
This indicator is for educational and informational purposes only. It does not constitute financial advice or trading recommendations. Trading involves substantial risk of loss. Past patterns and historical analysis do not indicate future results. Users are responsible for their own trading decisions and risk management. The author assumes no liability for trading losses.
═══════════════════════════════════════════════════
🔧 ALERT FUNCTIONALITY
Built-in alert conditions notify you when:
- New order blocks are detected
- Market structure changes occur (BOS/CHoCH)
- Reference entry signals appear
Configure alerts through TradingView's alert system.

U.T.M.S v2🇷🇺 ОПИСАНИЕ (РУССКИЙ)
U.T.M.S v2 — Чистый EMA-кроссовер с фильтрами
Стратегия для 15м (в первую очередь) и 1ч таймфреймов.
Генерирует сигналы при пересечении EMA(8) и EMA(19) только при подтверждении тренда, объёма, волатильности и времени суток.
Каждая сделка закрывается по фиксированному Take Profit и Stop Loss.
✅ Минимум ложных входов
✅ Работает только в ликвидные часы
✅ Полная фильтрация шума и флэта
🔧 Настройки:
Fast EMA / Slow EMA — периоды скользящих (по умолчанию 8 / 19)
Take Profit % — уровень фиксации прибыли (рек. 2.5%)
Stop Loss % — уровень стоп-лосса (рек. 2.0%)
Фильтры (все включены по умолчанию):
Use 1H Trend Filter — вход разрешён только по направлению тренда на 1H (EMA50 > EMA200 для лонга)
Use Volume Filter — объём должен быть ≥ 1.5× среднего за 20 баров
Min Volume Multiplier — нижний порог объёма (рек. 1.5)
Max Volume Multiplier — верхний порог (рек. 3.0–4.0), отсекает аномальные пампы
Use ATR Volatility Filter — минимальная волатильность (рек. 0.3%)
Use Time Filter (UTC) — торговля только в часы высокой ликвидности: 12:00–18:00 и 20:00–02:00 UTC
💡 Идеальна для ручной торговли или подключения сигнальных ботов.
🇬🇧 DESCRIPTION (ENGLISH)
U.T.M.S v2 — Clean EMA Crossover with Filters
Strategy for 15m (primarily) and 1h timeframes.
Generates signals when the EMA(8) and EMA(19) cross, only if trend, volume, volatility, and time of day are confirmed.
Each trade is closed with a fixed Take Profit and Stop Loss.
✅ Low noise, high-quality signals
✅ Active only during high-liquidity hours
✅ Fully protected against flat and fakeouts
🔧 Inputs:
Fast EMA / Slow EMA — moving average periods (default: 8 / 19)
Take Profit % — profit target (suggested: 2.5%)
Stop Loss % — stop loss level (suggested: 2.0%)
Filters (all enabled by default):
Use 1H Trend Filter — trades only in 1H trend direction (EMA50 > EMA200 for long)
Use Volume Filter — volume must be ≥ 1.5× 20-bar average
Min Volume Multiplier — minimum volume threshold (suggested: 1.5)
Max Volume Multiplier — maximum volume cap (suggested: 3.0–4.0), filters out pumps/dumps
Use ATR Volatility Filter — minimum volatility (suggested: 0.3%)
Use Time Filter (UTC) — active only during high-liquidity sessions: 12:00–18:00 & 20:00–02:00 UTC
💡 Perfect for manual trading or webhook-based signal bots.

PRO Scalper(EN)
## What it is
**PRO Scalper** is an intraday price–action and liquidity map that helps you see where the market is likely to move **now**, not just where it has been.
It combines five building blocks that professional scalpers often watch together:
1. **Session Volume-Weighted Average Price (VWAP)** — the intraday “fair value” anchor.
2. **Opening Range** — the first minutes of the session that set the day’s balance.
3. **Trend filter** — higher-timeframe bias using **Exponential Moving Averages (EMA)** and optional **Average Directional Index (ADX)** strength.
4. **Two independent Supply/Demand zone engines** — zones are drawn from confirmed swing pivots, with midlines and **touch counters**.
5. **Order-flow style visuals**:
* **Delta bubbles** (green/red circles) show where buying or selling pressure was unusually strong, using a safe **delta proxy** (no external feeds).
* **Liquidity densities** (subtle rectangular bands) highlight clusters of large activity that often act as magnets or barriers and disappear when “eaten” by strong moves.
This mix gives you a **complete intraday picture**: the mean (VWAP), the day’s initial balance (Opening Range), the higher-timeframe push (trend filter), the nearby fuel or brakes (zones), and the live pressure points (bubbles and densities).
---
## Why these components
* **VWAP** tracks where the bulk of traded value sits. Price tends to rotate around it or accelerate away from it — a perfect compass for scalps.
* **Opening Range** frames the early auction. Many intraday breaks, fades and retests start at its boundaries.
* **EMA bias + ADX strength** separates trending conditions from chop, so you can keep only the zones that agree with the bigger push.
* **Pivot-based zones (two pairs at once)** are simple, objective and fast. Midlines help with confirmations; touch counters quantify how many times the zone was tested.
* **Bubbles and densities** add the “effort” layer: where the push appeared and where liquidity is concentrated. You see **where** a move is likely to continue or fail.
Together they reduce ambiguity: **context + level + effort** — all on one screen.
---
## How it works (plain language)
* **VWAP** resets each day and is calculated as the cumulative sum of typical price multiplied by volume divided by total volume.
* **Opening Range** is either automatic (a multiple of your chart timeframe) or a manual number of minutes. While it is forming, the highest high and lowest low are captured and plotted as the range.
* **Trend filter**
* **EMA Fast** and **EMA Slow** define directional bias.
* **ADX (optional)** adds “trend strength”: only when the Average Directional Index is above the chosen threshold do we treat the move as strong. You can source this from a higher timeframe.
* **Zones**
* There are **two independent pairs** of pivots at the same time (for example 10-left 10-right and 5-left 5-right).
* Each detected pivot creates a **Supply** (from a swing high) or **Demand** (from a swing low) box. Box depth = **zone depth × Average True Range** for adaptive sizing; the boxes **extend forward**.
* Midline (optional dashed line inside the box) is the “balance” of the zone.
* **“Only in trend”** mode can hide boxes that go against the higher-timeframe bias.
* The **touch counter** increases when price revisits the box. Labels show the pair name and the number of touches.
* **Bubbles**
* A safe **delta proxy** measures bar pressure (for example, range-weighted close vs open).
* A **quantile filter** shows only unusually large pressure: choose lookback and percentile, and the script draws a circle sized by intensity (green = bullish pressure, red = bearish).
* **Densities**
* The script marks heavy activity clusters as **subtle bands** around price (depth = fraction of Average True Range).
* If price **breaks** a density with volume above its moving average, the band **disappears** (“eaten”), which often precedes continuation.
---
## How to use — practical playbooks
> Recommended chart: crypto or index futures, one to five minutes. Use **one hour** or **fifteen minutes** for the higher-timeframe bias.
### 1) Trend pullback scalp (continuation)
1. Enable **Only in trend** zones.
2. In an uptrend: wait for a pullback into a **Demand** zone that overlaps with VWAP or sits just below the Opening Range midpoint.
3. Look for **green bubbles** near the zone’s bottom or a fresh **density** under price.
4. Enter on a candle closing **back above the zone midline**.
5. Stop-loss: below the bottom of the zone or a small multiple of Average True Range.
6. Targets: previous swing high, Opening Range high, fixed risk multiples, or VWAP.
Mirror the logic for downtrends using Supply zones, red bubbles and densities above price.
### 2) Reversion with liquidity sweep (fade)
1. Bias neutral or countertrend allowed.
2. Price **wicks through** a zone boundary (or an Opening Range line) and **closes back inside** the zone.
3. The bubble color often flips (absorption).
4. Enter toward the **inside** of the zone; stop beyond the sweep wick; first target = zone midline, second = opposite side of the zone or VWAP.
### 3) Opening Range break and retest
1. Wait for the Opening Range to complete.
2. A break with a large bubble suggests intent.
3. Look for a **retest** into a nearby zone aligned with VWAP.
4. Trade continuation toward the next zone or the session extremes.
### 4) Density “eaten” continuation
1. When a density band **disappears** on high volume, it often means the resting liquidity was consumed.
2. Trade in the direction of the break, toward the nearest opposing zone.
---
## Settings — quick guide
**Core**
* *ATR Length* — used for zone and density depths.
* *Show VWAP / Show Opening Range*.
* *Opening Range*: Auto (multiple of timeframe minutes) or Manual minutes.
**Trend Filter**
* *Mode*: Off, EMA only, or EMA with ADX strength.
* *Use higher timeframe* and its value.
* *EMA Fast / EMA Slow*, *ADX Length*, *ADX threshold*.
* *Plot EMA filter* to display the moving averages.
**Zones (two pairs)**
* *Pivot A Left / Right* and *Pivot B Left / Right*.
* *Zone depth × ATR*, *Extend bars*.
* *Show zone midline*, *Only in trend zones*.
* Labels automatically show the touch counters.
**Bubbles**
* *Show Bubbles*.
* *Quantile lookback* and *Quantile percent* (higher percent = stricter filter, fewer bubbles).
**Densities**
* *Metric*: absolute delta proxy or raw volume.
* *Quantile lookback / percent*.
* *Depth × ATR*, *Extend bars*, *Merge distance* (in ATR),
* *Break condition*: volume moving average length and multiplier,
* *Midline for densities* (optional dashed line).
---
## Tips and risk management
* This script **does not use external order-flow feeds**. Delta is a **proxy** suitable for TradingView; tune quantiles per symbol and timeframe.
* Do not trade every bubble. Combine **context (trend + VWAP + Opening Range)** with **level (zone)** and **effort (bubble/density)**.
* Set stop-losses beyond the zone or at a fraction of Average True Range. Predefine risk per trade.
* Backtest your rules with a strategy script before using real funds.
* Markets differ. Parameters that work on Bitcoin may not transfer to low-liquidity altcoins or stocks.
* Nothing here is financial advice. Scalping is high-risk; slippage and over-trading can quickly damage your account.
---
## What makes PRO Scalper unique
* Two **independent** zone engines run in parallel, so you can see both **larger structure** and **fine intraday levels** at the same time.
* Clean **“only in trend” rendering** — zones and midlines against the bias can be hidden, reducing clutter and hesitation.
* **Touch counters** convert “feel” into numbers.
* **Self-contained order-flow visuals** (bubbles and densities) that require no extra data sources.
* Careful defaults: subtle colors for densities, clearer zones, and responsive auto Opening Range.
---
(RU)
## Что это такое
**PRO Scalper** — это индикатор для внутридневной торговли, который показывает **контекст и ликвидность прямо сейчас**.
Он объединяет пять модулей, которыми профессиональные скальперы пользуются вместе:
1. **VWAP** — средневзвешенная по объему цена за сессию, «справедливая стоимость» дня.
2. **Opening Range** — первая часть сессии, задающая баланс дня.
3. **Фильтр тренда** — направление старшего таймфрейма по **экспоненциальным средним** и при желании по силе тренда **Average Directional Index**.
4. **Две независимые системы зон спроса/предложения** — зоны строятся от подтвержденных экстремумов (пивотов), имеют **среднюю линию** и **счетчик касаний**.
5. **Визуализация «ордер-флоу»**:
* **Пузыри дельты** (зеленые/красные круги) — места повышенного покупательного/продажного давления, рассчитанные через безопасный **прокси-дельты**.
* **Плотности ликвидности** (ненавязчивые прямоугольные ленты) — скопления объема, которые нередко притягивают цену или удерживают ее и исчезают, когда «разъедаются» сильным движением.
Итог — **полная картинка момента**: среднее (VWAP), баланс дня (Opening Range), старшая сила (фильтр тренда), ближайшие уровни топлива/тормозов (зоны), текущие точки усилия (пузыри и плотности).
---
## Почему именно эти элементы
* **VWAP** показывает, где сосредоточена стоимость; цена либо вращается вокруг него, либо быстро уходит — идеальный ориентир скальпера.
* **Opening Range** фиксирует ранний аукцион — от его границ часто начинаются пробои, возвраты и ретесты.
* **EMA + ADX** отделяют тренд от «пилы», позволяя оставлять на графике только зоны по направлению старшего таймфрейма.
* **Зоны от пивотов** просты, объективны и быстры; средняя линия помогает подтверждать разворот, счетчик касаний переводит субъективность в цифры.
* **Пузыри и плотности** добавляют слой «усилия»: где именно возник толчок и где сконцентрирована ликвидность.
Комбинация **контекста + уровня + усилия** уменьшает двусмысленность и ускоряет принятие решения.
---
## Как это работает (простыми словами)
* **VWAP** каждый день стартует заново: сумма «типичной цены × объем» делится на суммарный объем.
* **Opening Range** — автоматический (кратный минутам вашего таймфрейма) или вручную заданный период; пока он формируется, фиксируются максимум и минимум.
* **Фильтр тренда**
* Две экспоненциальные средние задают направление.
* **ADX** (по желанию) добавляет «силу». Источник можно взять со старшего таймфрейма.
* **Зоны**
* Одновременно работает **две пары** пивотов (например 10-лево 10-право и 5-лево 5-право).
* От пивота строится зона **предложения** (от максимума) или **спроса** (от минимума). Глубина зоны = **коэффициент × Average True Range**; зона тянется вперед.
* Внутри рисуется **средняя линия** (по желанию).
* Режим **«только по тренду»** скрывает зоны против старшего направления.
* **Счетчик касаний** увеличивается, когда цена снова входит в зону; подпись показывает пару и количество касаний.
* **Пузыри**
* Используется безопасный **прокси-дельты** — измерение «напряжения» внутри свечи.
* Через **квантильный фильтр** выводятся только необычно сильные места: настраиваются окно и процент квантиля; размер кружка — сила, цвет: зеленый покупатели, красный продавцы.
* **Плотности**
* Крупные активности отмечаются **ненавязчивыми прямоугольниками** (глубина — доля Average True Range).
* Если плотность **пробивается** объемом выше среднего, она **исчезает** — часто это предвещает продолжение.
---
## Как пользоваться — практические схемы
> Рекомендация: крипто или фьючерсы, таймфрейм 1–5 минут. Для старшего фильтра удобно взять **1 час** или **15 минут**.
### 1) Скальп на откат по тренду
1. Включите **«только по тренду»**.
2. В восходящем тренде дождитесь отката в **зону спроса**, желательно рядом с **VWAP** или серединой **Opening Range**.
3. Подтверждение — **зеленые пузыри** у нижней границы зоны или свежая **плотность** под ценой.
4. Вход после закрытия свечи **выше средней линии** зоны.
5. Стоп-лосс: за нижнюю границу зоны или небольшой множитель Average True Range.
6. Цели: предыдущий максимум, верх Opening Range, фиксированные R-множители, либо VWAP.
Для нисходящего тренда зеркально: зоны предложения, красные пузыри и плотности над ценой.
### 2) Контрдвижение с «выбиванием ликвидности»
1. Нейтральный или контртрендовый режим.
2. Цена **выносит хвостом** границу зоны (или линию Opening Range) и **закрывается обратно внутри**.
3. Цвет пузыря часто меняется (поглощение).
4. Вход внутрь зоны; стоп — за хвост выбивания; цели: средняя линия, противоположная граница зоны или VWAP.
### 3) Пробой Opening Range + ретест
1. Дождитесь завершения диапазона.
2. Сильный пробой с крупным пузырем — признак намерения.
3. Ищите **ретест** в зоне по тренду рядом с линией диапазона и VWAP.
4. Торгуйте продолжение к следующей зоне.
### 4) Продолжение после «съеденной» плотности
1. Когда прямоугольник плотности **исчезает** на повышенном объеме, это значит, что ликвидность поглощена.
2. Торгуйте в сторону пробоя к ближайшей противоположной зоне.
---
## Настройки — краткая шпаргалка
**Core**
— Длина Average True Range (для размеров зон и плотностей).
— Включение VWAP и Opening Range.
— Длина Opening Range: автоматическая (кратная минутам ТФ) или ручная.
**Trend Filter**
— Режим: выкл., только средние, либо средние + ADX.
— Источник со старшего таймфрейма и его значение.
— Длины средних, длина ADX и порог силы.
— Показать/скрыть линий средних.
**Zones (две пары одновременно)**
— Пара A: лев/прав; Пара B: лев/прав.
— Глубина зоны × Average True Range, продление по барам.
— Средняя линия, режим **«только по тренду»**.
— Подписи со счетчиком касаний.
**Bubbles**
— Вкл./выкл., окно поиска и процент квантиля (чем выше процент — тем реже пузыри).
**Densities**
— Метрика: абсолютная прокси-дельты или чистый объем.
— Окно/квантиль, глубина × Average True Range, продление,
— Порог объединения (в Average True Range),
— Условие «разъедания» по объему,
— Средняя линия плотности (по желанию).
---
## Советы и риски
* Индикатор **не использует внешние потоки ордер-флоу**. Дельта — **прокси**, подходящая для TradingView; подбирайте квантили под инструмент и таймфрейм.
* Не торгуйте каждый пузырь. Склейте **контекст (тренд + VWAP + Opening Range)** с **уровнем (зона)** и **усилием (пузырь/плотность)**.
* Стоп-лосс — за границей зоны или по Average True Range. Риск на сделку задавайте заранее.
* Перед реальными деньгами протестируйте правила в стратегии.
* Разные рынки ведут себя по-разному; настройки из Биткоина могут не подойти малоликвидным альткоинам или акциям.
* Это не инвестиционная рекомендация. Скальпинг — высокий риск; проскальзывание и переизбыток сделок быстро наносят ущерб капиталу.
---
## Чем уникален PRO Scalper
* Две **одновременные** системы зон показывают и **крупную структуру**, и **точные локальные уровни**.
* Режим **«только по тренду»** чистит экран от лишних уровней и ускоряет решение.
* **Счетчики касаний** дают количественную опору.
* **Самодостаточные визуализации усилия** (пузыри и плотности) — без сторонних источников данных.
* Аккуратная цветовая схема: плотности — мягко, зоны — ясно; Opening Range — адаптивный.
Пусть он станет вашей «картой местности» для быстрых и дисциплинированных решений внутри дня.

FVG Buy/Sell [Multi-TF] by akshaykiriti1443The FVG Buy/Sell indicator is a precision trading tool designed for traders who operate with a clear directional bias. It excels at identifying high-probability entry points by detecting when price interacts with Fair Value Gaps (FVGs).
This indicator is built on a core principle: instead of predicting the market's direction, it provides the timing for an entry after you, the trader, have established your market bias. By automatically pinpointing bullish and bearish imbalances on both the current and a higher timeframe, it allows you to wait for the market to pull back to a key level and then provides a clear signal for execution.
The Core Strategy: Bias First, Entry Second
This indicator is most powerful when used as part of a two-step trading process. It is not a standalone signal generator; it is an entry confirmation tool.
Step 1: Determine Your Directional Bias
Before looking for any signals from this indicator, you must first have an opinion on the market's most likely direction. This bias should be derived from your primary analysis method, such as:
The Golden Rule:
If your bias is BULLISH, you will ONLY look for BUY signals generated by bullish (green/blue) FVGs. You will ignore all SELL signals.
If your bias is BEARISH, you will ONLY look for SELL signals generated by bearish (pink/orange) FVGs. You will ignore all BUY signals.
Step 2: Execute with the FVG Tap-In Signal
Once your bias is set, the indicator does the rest of the work. You simply wait for the price to pull back into an FVG zone that aligns with your bias and then wait for the confirmation arrow to appear.
A green up arrow confirms that price has tapped a bullish FVG and closed above it, signaling that support has held and it's a valid moment to enter a long position.
A red down arrow confirms that price has tapped a bearish FVG and closed below it, signaling that resistance has held and it's a valid moment to enter a short position.
How to Take a Trade (Step-by-Step Examples)
Example of a Bullish (Long) Trade Setup:
Establish Bias: Your primary analysis shows the market is in a clear uptrend. Your bias is Bullish. You are now only looking for buying opportunities.
Identify Zone: The indicator draws a bullish FVG (a green or blue box) during an impulsive up-move.
Wait for Pullback: Be patient and let the price retrace down into this FVG zone. Do not chase the price.
Confirmation Signal: A green UP arrow appears below a candle. This is your signal. It confirms that buyers have stepped in at the FVG level and defended it.
Entry: Enter a long (buy) position at the open of the candle immediately following the signal candle.
Stop Loss: Place your stop loss below the low of the signal candle or, for a safer stop, below the bottom of the FVG zone itself.
Take Profit: Target a previous high, a higher-timeframe resistance level, or use a risk-to-reward ratio like 1:2 or 1:3.
Example of a Bearish (Short) Trade Setup:
Establish Bias: Your primary analysis shows the market is breaking down into a downtrend. Your bias is Bearish. You are now only looking for selling opportunities.
Identify Zone: The indicator draws a bearish FVG (a pink or orange box) during an impulsive down-move.
Wait for Pullback: Patiently wait for the price to rally back up into this FVG zone.
Confirmation Signal: A red DOWN arrow appears above a candle. This is your confirmation that sellers have rejected the price at this level.
Entry: Enter a short (sell) position at the open of the next candle.
Stop Loss: Place your stop loss above the high of the signal candle or above the top of the FVG zone.
Take Profit: Target a previous low, a key support level, or the next major FVG below.
Features Explained in Detail
Multi-Timeframe (MTF) Analysis: HTF zones (dotted lines) carry more weight. A signal from a 4-hour FVG while you are on a 15-minute chart is significantly more powerful than a signal from a 15-minute FVG alone. Use HTF zones as major points of interest.
Confirmed Tap-In Logic: The arrow only appears after price has touched the zone and then closed outside of it in the expected direction. This built-in confirmation filters out wicks that simply pass through a zone without a real market reaction.
Dual Alert System:
Entry Alert ("Price has entered..."): This is a heads-up alert. It tells you to pay attention because price is now in your pre-defined zone of interest.
Tap-In Alert ("Confirmed tap-in..."): This is the execution alert. It signals that the conditions for a trade have been met according to the indicator's logic.
Fade on Tapped: When enabled, a zone will become transparent after a confirmed signal. This visually cleans up your chart, showing you which zones have already been tested and "mitigated."
Minimum FVG Size (Ticks): In volatile or ranging markets, many tiny, insignificant FVGs can form. Use this setting to filter out the noise. Increase the value to only display larger, more significant imbalances.
Disclaimer: Trading involves substantial risk. This indicator is a tool for analysis and should not be used as a sole reason to enter a trade. Always practice robust risk management and use this tool in conjunction with your own trading plan. Past performance is not indicative of future results.

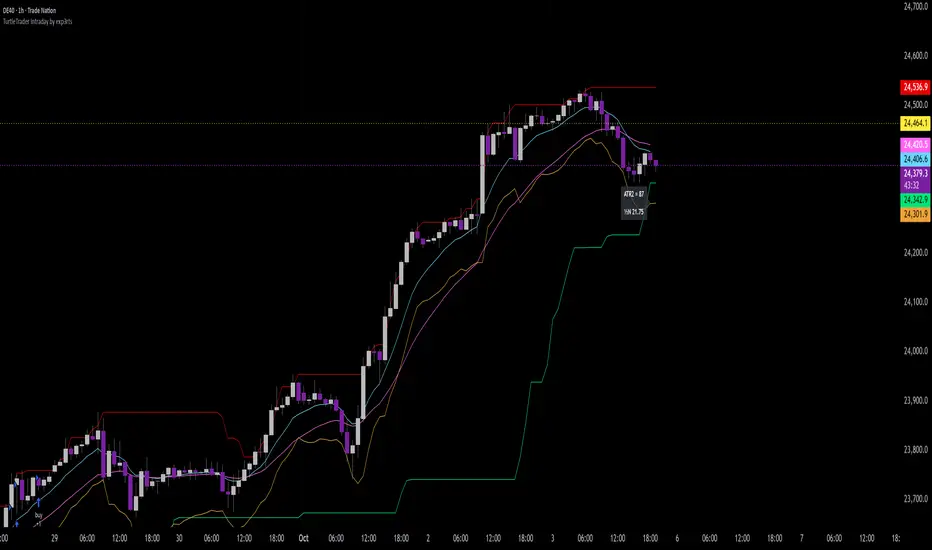
TurtleTrader Intraday Extended by exp3rts🐢 TurtleTrader Intraday Extended by exp3rts
A modern intraday adaptation of the classic Turtle Trading strategy, optimized for short-term breakout trading with built-in risk management, pyramiding, and optional trend filters.
This strategy captures strong directional moves by entering breakouts from price channels, using ATR-based stop losses and controlled position scaling.
🔑 Key Features:
📈 Channel Breakout Entries: Buy/sell on breakout of highest highs or lowest lows
🛑 Dynamic ATR Stop Loss: Automatically calculated from market volatility
🔁 Pyramiding: Adds up to 4 positions as price moves in your favor
🔄 Directional Mode: Choose Long-only or Short-only mode
🧠 Skip After Win Option: Avoid overtrading by skipping the next entry after a profitable trade
📊 Optional EMA Display: Plot up to 3 EMAs for trend filtering or visual confirmation
📉 On-Chart ATR Label: Displays real-time ATR metrics (including ½N size used in classic Turtle rules)
⚙️ Strategy Inputs:
Entry/Exit channel length
ATR multiplier and period
Entry delay (bar offset)
Optional trade filter after profitable trades
Show/hide EMAs and ATR label
🧪 Best For:
Intraday breakout traders (works well on 5m–1h timeframes)
Traders who prefer mechanical rules and structured risk
Anyone testing volatility-based entries and exits
Inspired by the original Turtle Trading system — redesigned for modern markets with more intraday flexibility and visual enhancements.
RSI Momentum ScalperOverview
The "RSI Momentum Scalper" is a Pine Script v5 strategy crafted for trading highly volatile markets, with a special focus on newly listed cryptocurrencies. This strategy harnesses the Relative Strength Index (RSI) alongside volume analysis and momentum thresholds to pinpoint short-term trading opportunities. It supports both long and short trades, managed with customizable take profit, stop loss, and trailing stop levels, which are visually plotted on the chart for easy tracking.
Why I Created This Strategy
I developed the "RSI Momentum Scalper" because I was seeking a reliable trading strategy tailored to newly listed, highly volatile cryptocurrencies. These assets often experience rapid price fluctuations, rendering traditional strategies less effective. I aimed to create a tool that could exploit momentum and volume spikes while managing risk through adaptable exit parameters. This strategy is designed to address that need, offering a flexible approach for traders in dynamic crypto markets.
How It Works
The strategy utilizes RSI to identify momentum shifts, combined with volume confirmation, to trigger long or short entries. Trades are controlled with take profit, stop loss, and trailing stop levels, which adjust dynamically as the price moves in your favor. The trailing stop helps lock in profits, while the plotted exit levels provide clear visual cues for trade management.
Customizable Settings
The script is highly customizable, allowing you to adjust it to various market conditions and trading styles. Here’s a brief overview of the key settings:
Trade Mode: Select "Both," "Long Only," or "Short Only" to determine the trade direction.
(Default: Both)
RSI Length: Sets the lookback period for the RSI calculation (2 to 30).
(Default: 8)
A shorter length increases RSI sensitivity, suitable for volatile assets.
RSI Overbought: Defines the upper RSI threshold (60 to 99) for short entries.
(Default: 90)
Higher values signal stronger overbought conditions.
RSI Oversold: Defines the lower RSI threshold (1 to 40) for long entries.
(Default: 10)
Lower values indicate stronger oversold conditions.
RSI Momentum Threshold: Sets the minimum RSI momentum change (1 to 15) to trigger entries.
(Default: 14)
Adjusts the sensitivity to price momentum.
Volume Multiplier: Multiplies the volume moving average to filter high-volume bars (1.0 to 3.0).
(Default: 1)
Higher values require stronger volume confirmation.
Volume MA Length: Sets the lookback period for the volume moving average (5 to 50).
(Default: 13)
Influences the volume trend sensitivity.
Take Profit %: Sets the profit target as a percentage of the entry price (0.1 to 10.0).
(Default: 4.15)
Determines when to close a winning trade.
Stop Loss %: Sets the loss limit as a percentage of the entry price (0.1 to 6.0).
(Default: 1.85)
Protects against significant losses.
Trailing Stop %: Sets the trailing stop distance as a percentage (0.1 to 4.0).
(Default: 2.55)
Locks in profits as the price moves favorably.
Visual Features
Exit Levels: Take profit (green), fixed stop loss (red), and trailing stop (orange) levels are plotted when in a position.
Performance Table: Displays win rate, total trades, and net profit in the top-right corner.
How to Use
Add the strategy to your chart in TradingView.
Adjust the input settings based on the cryptocurrency and timeframe you’re trading.
Monitor the plotted exit levels for trade management.
Use the performance table to assess the strategy’s performance over time.
Notes
Test the strategy on a demo account or with historical data before live trading.
The strategy is optimized for short-term scalping; adjust settings for longer timeframes if needed.

Opening Range IndicatorComplete Trading Guide: Opening Range Breakout Strategy
What Are Opening Ranges?
Opening ranges capture the high and low prices during the first few minutes of market open. These levels often act as key support and resistance throughout the trading day because:
Heavy volume occurs at market open as overnight orders execute
Institutional activity is concentrated during opening minutes
Price discovery happens as market participants react to overnight news
Psychological levels are established that traders watch all day
Understanding the Three Timeframes
OR5 (5-Minute Range: 9:30-9:35 AM)
Most sensitive - captures immediate market reaction
Quick signals but higher false breakout rate
Best for scalping and momentum trading
Use for early entry when conviction is high
OR15 (15-Minute Range: 9:30-9:45 AM)
Balanced approach - most popular among day traders
Moderate sensitivity with better reliability
Good for swing trades lasting several hours
Primary timeframe for most strategies
OR30 (30-Minute Range: 9:30-10:00 AM)
Most reliable but slower signals
Lower false breakout rate
Best for position trades and trend following
Use when looking for major moves
Core Trading Strategies
Strategy 1: Basic Breakout
Setup:
Wait for price to break above OR15 high or below OR15 low
Enter on the breakout candle close
Stop loss: Opposite side of the range
Target: 2-3x the range size
Example:
OR15 range: $100.00 - $102.00 (Range = $2.00)
Long entry: Break above $102.00
Stop loss: $99.50 (below OR15 low)
Target: $104.00+ (2x range size)
Strategy 2: Multiple Confirmation
Setup:
Wait for OR5 break first (early signal)
Confirm with OR15 break in same direction
Enter on OR15 confirmation
Stop: Below OR30 if available, or OR15 opposite level
Why it works:
Multiple timeframe confirmation reduces false signals and increases probability of sustained moves.
Strategy 3: Failed Breakout Reversal
Setup:
Price breaks OR15 level but fails to hold
Wait for re-entry into the range
Enter reversal trade toward opposite OR level
Stop: Recent breakout high/low
Target: Opposite side of range + extension
Key insight: Failed breakouts often lead to strong moves in the opposite direction.
Advanced Techniques
Range Quality Assessment
High-Quality Ranges (Trade these):
Range size: 0.5% - 2% of stock price
Clean boundaries (not choppy)
Volume spike during range formation
Clear rejection at range levels
Low-Quality Ranges (Avoid these):
Very narrow ranges (<0.3% of stock price)
Extremely wide ranges (>3% of stock price)
Choppy, overlapping candles
Low volume during formation
Volume Confirmation
For Breakouts:
Look for volume spike (2x+ average) on breakout
Declining volume often signals false breakout
Rising volume during range formation shows interest
Market Context Filters
Best Conditions:
Trending market days (SPY/QQQ with clear direction)
Earnings reactions or news-driven moves
High-volume stocks with good liquidity
Volatility above average (VIX considerations)
Avoid Trading When:
Extremely low volume days
Major economic announcements pending
Holidays or half-days
Choppy, sideways market conditions
Risk Management Rules
Position Sizing
Conservative: Risk 0.5% of account per trade
Moderate: Risk 1% of account per trade
Aggressive: Risk 2% maximum per trade
Stop Loss Placement
Inside the range: Quick exit but higher stop-out rate
Outside opposite level: More room but larger risk
ATR-based: 1.5-2x Average True Range below entry
Profit Taking
Target 1: 1x range size (take 50% off)
Target 2: 2x range size (take 25% off)
Runner: Trail remaining 25% with moving stops
Specific Entry Techniques
Breakout Entry Methods
Method 1: Immediate Entry
Enter as soon as price closes above/below range
Fastest entry but highest false signal rate
Best for strong momentum situations
Method 2: Pullback Entry
Wait for breakout, then pullback to range level
Enter when price bounces off former resistance/support
Better risk/reward but may miss some moves
Method 3: Volume Confirmation
Wait for breakout + volume spike
Enter after volume confirmation candle
Reduces false signals significantly
Multiple Timeframe Entries
Aggressive: OR5 break → immediate entry
Conservative: OR5 + OR15 + OR30 all align → enter
Balanced: OR15 break with OR30 support → enter
Common Mistakes to Avoid
1. Trading Poor-Quality Ranges
❌ Don't trade ranges that are too narrow or too wide
✅ Focus on clean, well-defined ranges with good volume
2. Ignoring Volume
❌ Don't chase breakouts without volume confirmation
✅ Always check for volume spike on breakouts
3. Over-Trading
❌ Don't force trades when ranges are unclear
✅ Wait for high-probability setups only
4. Poor Risk Management
❌ Don't risk more than planned or use tight stops in volatile conditions
✅ Stick to predetermined risk levels
5. Fighting the Trend
❌ Don't fade breakouts in strongly trending markets
✅ Align trades with overall market direction
Daily Trading Routine
Pre-Market (8:00-9:30 AM)
Check overnight news and earnings
Review major indices (SPY, QQQ, IWM)
Identify potential opening range candidates
Set alerts for range breakouts
Market Open (9:30-10:00 AM)
Watch opening range formation
Note volume and price action quality
Mark key levels on charts
Prepare for breakout signals
Trading Session (10:00 AM - 4:00 PM)
Execute breakout strategies
Manage existing positions
Trail stops as profits develop
Look for additional setups
Post-Market Review
Analyze winning and losing trades
Review range quality vs. outcomes
Identify improvement areas
Prepare for next session
Best Stocks/ETFs for Opening Range Trading
Large Cap Stocks (Best for beginners):
AAPL, MSFT, GOOGL, AMZN, TSLA
High liquidity, predictable behavior
Good range formation most days
ETFs (Consistent patterns):
SPY, QQQ, IWM, XLF, XLE
Excellent liquidity
Clear range boundaries
Mid-Cap Growth (Advanced traders):
Stocks with good volume (1M+ shares daily)
Recent news catalysts
Clean technical patterns
Performance Optimization
Track These Metrics:
Win rate by range type (OR5 vs OR15 vs OR30)
Average R/R (risk vs reward ratio)
Best performing market conditions
Time of day performance
Continuous Improvement:
Keep detailed trade journal
Review failed breakouts for patterns
Adjust position sizing based on win rate
Refine entry timing based on backtesting
Final Tips for Success
Start small - Paper trade or use tiny positions initially
Focus on quality - Better to miss trades than take bad ones
Stay disciplined - Stick to your rules even during losing streaks
Adapt to conditions - What works in trending markets may fail in choppy conditions
Keep learning - Markets evolve, so should your approach
The opening range strategy is powerful because it captures natural market behavior, but like all strategies, it requires practice, discipline, and proper risk management to be profitable long-term.

Katz Exploding PowerBand FilterUnderstanding the Katz Exploding PowerBand Filter (EPBF) v2.4
1. Indicator Overview
The Katz Exploding PowerBand Filter (EPBF) is an advanced technical indicator designed to identify moments of expanding bullish or bearish momentum, often referred to as "power." It operates as a standalone oscillator in a separate pane below the main price chart.
Its primary goal is to measure underlying market strength by calculating custom "Bull" and "Bear" power components. These components are then filtered through a versatile moving average and a dual signal line system to generate clear entry and exit signals. This indicator is not a simple momentum oscillator; it uses a unique calculation based on exponential envelopes of both price and squared price to derive its values.
2. On-Chart Lines and Components
The indicator pane consists of five main lines:
Bullish Component (Thick Green/Blue/Yellow/Gray Line): This is the core of the indicator. It represents the calculated bullish "power" or momentum in the market.
Bright Green: Indicates a strong, active long signal condition.
Blue: Shows the bull component is above the MA filter, but the filter itself is still pointing down—a potential sign of a reversal or weakening downtrend.
Yellow: A warning sign that bullish power is weakening and has fallen below the primary signal lines.
Gray: Represents neutral or insignificant bullish power.
Bearish Component (Thick Red/Purple/Yellow/Gray Line): This line represents the calculated bearish "power" or downward momentum.
Bright Red: Indicates a strong, active short signal condition.
Purple: Shows the bear component is above the MA filter, but the filter itself is still pointing down—a sign of potential trend continuation.
Yellow: A warning sign that bearish power is weakening.
Gray: Represents neutral or insignificant bearish power.
MA Filter (Purple Line): This is the main filter, calculated using the moving average type and length you select in the settings (e.g., HullMA, EMA). The Bull and Bear components are compared against this line to determine the underlying trend bias.
Signal Line 1 (Orange Line): A fast Exponential Moving Average (EMA) of the stronger power component. It acts as the first level of dynamic support or resistance for the power lines.
Signal Line 2 (Lime/Gray Line): A slower EMA that acts as a confirmation filter.
Lime Green: The line turns lime when it is rising and the faster Signal Line 1 is above it, indicating a confirmed bullish trend in momentum.
Gray: Indicates a neutral or bearish momentum trend.
3. On-Chart Symbols and Their Meanings
Various characters are plotted at the bottom of the indicator pane to provide clear, actionable signals.
L (Pre-Long Signal): The first sign of a potential long entry. It appears when the Bullish Component rises and crosses above both signal lines for the first time.
S (Pre-Short Signal): The first sign of a potential short entry. It appears when the Bearish Component rises and crosses above both signal lines for the first time.
▲ (Post-Long Signal): A stronger confirmation for a long entry. It appears with the 'L' signal only if the momentum trend is also confirmed bullish (i.e., the slower Signal Line 2 is lime green).
▼ (Post-Short Signal): A stronger confirmation for a short entry. It appears with the 'S' signal only if the momentum trend is confirmed bullish.
Exit / Take-Profit Symbols:
These symbols appear when a power component crosses below a line, suggesting that momentum is fading and it may be time to take profit.
⚠️ (Exit Signal 1): The Bull/Bear component has crossed below the main MA Filter. This is the first and most sensitive take-profit signal.
☣️ (Exit Signal 2): The Bull/Bear component has crossed below the faster Signal Line 1. This is a moderate take-profit signal.
🚼 (Exit Signal 3): The Bull/Bear component has crossed below the slower Signal Line 2. This is the slowest take-profit signal, suggesting the trend is more definitively exhausted.
4. Trading Strategy and Rules
Long Entry Rules:
Initial Signal: Wait for an L to appear at the bottom of the indicator. This confirms that bullish power is expanding.
Confirmation (Recommended): For a higher-probability trade, wait for a green ▲ symbol to appear. This confirms the underlying momentum trend aligns with the signal.
Entry: Enter a long (buy) position on the opening of the next candle after the signal appears.
Short Entry Rules:
Initial Signal: Wait for an S to appear at the bottom of the indicator. This confirms that bearish power is expanding.
Confirmation (Recommended): For a higher-probability trade, wait for a maroon ▼ symbol to appear. This confirms the underlying momentum trend aligns with the signal.
Entry: Enter a short (sell) position on the opening of the next candle after the signal appears.
Take Profit (TP) Rules:
The indicator provides three levels of take-profit signals. You can choose to exit your entire position or scale out at each level.
For a long trade, exit when you see ⚠️, ☣️, or 🚼 appear below the Bullish Component.
For a short trade, exit when you see ⚠️, ☣️, or 🚼 appear below the Bearish Component.
Stop Loss (SL) Rules:
The indicator does not provide an explicit stop loss. You must use your own risk management rules. Common methods include:
Swing High/Low: For a long position, place your stop loss below the most recent significant swing low on the price chart. For a short position, place it above the most recent swing high.
ATR-Based: Use an Average True Range (ATR) indicator to set a volatility-based stop loss.
Fixed Percentage: Risk a fixed percentage (e.g., 1-2%) of your account on the trade.
5. Disclaimer
This indicator is a tool for technical analysis and should not be considered financial advice. All trading involves significant risk, and past performance is not indicative of future results. The signals generated by this indicator are probabilistic and can result in losing trades. Always use proper risk management, such as setting a stop loss, and never risk more than you are willing to lose. It is recommended to backtest this indicator and use it in conjunction with other forms of analysis before trading with real capital. The indicator should only be used for educational purposes.

Katz Candle Momentum Reversal Indicator v4.1Katz Candle Momentum Reversal Indicator (CMRI) v4.1
Overview
The Katz CMRI is a comprehensive trading indicator designed to identify trend direction, momentum shifts, and potential market reversals. It combines several different concepts into a single, cohesive visual tool.
At its core, the indicator uses a custom Line Break chart calculation to filter out market noise and a Heikin-Ashi-style formula to smooth price action. This combination helps to more clearly define the underlying trend. The main output is a dynamic, multi-colored trend line accompanied by various signals that appear directly on your chart. It's designed to help traders stay with the trend while also spotting key moments of expansion, contraction, and potential reversal.
How to Interpret the Indicator
The indicator has several key visual components:
Main Trend Line: This is the thick, central line that changes color.
Green: Indicates a bullish (upward) trend.
Red: Indicates a bearish (downward) trend.
Faded/Light Colors: Suggest a potential loss of momentum or a pullback within the trend.
White: Signals a significant break in the trend structure.
Trend Cloud: The shaded area between the main trend line and the white midline (mid). A green cloud shows the trend is above the midpoint, while a red cloud shows it's below.
Upper/Lower Bands: The aqua (Trend Up) and yellow (Trend Down) lines represent the recent highs and lows of the established trend. When price is pushing against these bands, it signals trend strength.
Background Colors:
Gray: A "Contraction Zone." This indicates that the trend is losing momentum and consolidating, warning of potential chop or a reversal.
Blue: An "Expansion Event." This highlights a sudden increase in momentum in the direction of the trend.
Signal Shapes:
Diamonds: These are the primary entry signals. A green diamond below a candle signals a potential long entry, while a red diamond above a candle signals a potential short entry.
⬆️⬇️ Arrows: These are secondary momentum signals. They can be used as confirmation that the trend is continuing.
Trading Strategy & Rules
This strategy uses the primary diamond signals for entries and trend changes for exits.
Long Trade (Buy) Rules
Entry: Wait for a green diamond to appear below the price candles. For confirmation, the main trend line should turn solid green, and the price should ideally be above the white midline.
Exit:
Stop Loss: Place a stop loss below the recent swing low or below the candle where the green diamond appeared.
Take Profit: Consider exiting the trade when a red diamond appears above the candles, signaling a potential trend reversal. Alternatively, a trader might exit if the background turns gray (Contraction Zone), indicating the bullish momentum has faded.
Short Trade (Sell) Rules
Entry: Wait for a red diamond to appear above the price candles. For confirmation, the main trend line should turn solid red, and the price should ideally be below the white midline.
Exit:
Stop Loss: Place a stop loss above the recent swing high or above the candle where the red diamond appeared.
Take Profit: Consider exiting the trade when a green diamond appears below the candles. A gray "Contraction Zone" can also serve as an early warning to exit as bearish momentum wanes.
Indicator Filters Explained
The indicator includes a "Trend Filter Type" setting that allows you to adjust its sensitivity. This can help reduce false signals in choppy markets.
Raw: This is the most sensitive setting. It will generate a trend change signal as soon as the basic conditions are met. Use this for scalping or in strongly trending markets, but be aware that it may produce more false signals.
OutStep: This is the default, balanced setting. It adds an extra layer of confirmation by requiring the main trend line itself to be moving in the direction of the new trend. For example, a new green signal will only be confirmed if the trend line's value is higher than its previous value. This helps filter out weak signals.
FullStep: This is the most conservative and filtered setting. It includes the "OutStep" logic and adds further conditions related to the upper and lower trend bands. This setting will produce the fewest signals, but they are generally the highest quality, making it suitable for swing trading or avoiding choppy market conditions.
Disclaimer
This indicator is a tool for technical analysis and should not be considered financial advice. All trading involves substantial risk, including the possible loss of principal. Past performance is not indicative of future results. The signals generated by this indicator are for educational and informational purposes only. You are solely responsible for any trading decisions you make. Use this indicator at your own risk.

ML Compressor Enhanced Trading Indicator# 🤖 ML Enhanced Trading Indicator - Advanced Market Analysis
## 📊 Overview
This is a comprehensive Machine Learning Enhanced Trading Indicator that combines multiple advanced analytical techniques to provide high-probability trading signals. The indicator uses artificial intelligence, pattern recognition, anomaly detection, and traditional technical analysis to identify optimal entry and exit points in the market.
## 🚀 Key Features
### 🧠 **Machine Learning Core**
- **Advanced Pattern Recognition**: Uses cosine similarity, Pearson correlation, and Spearman rank correlation to identify historical patterns
- **AI-Powered Predictions**: Implements multiple correlation methods to forecast price movements
- **Anomaly Detection**: Z-score based detection system for unusual market activities
- **Signal Confidence Scoring**: Reliability assessment for each trading signal
### 📈 **Technical Analysis Integration**
- **Multi-Timeframe RSI Analysis**: 14 and 21-period RSI with oversold/overbought detection
- **MACD Momentum**: Enhanced MACD histogram analysis for trend confirmation
- **Bollinger Bands Position**: Dynamic position tracking within BB channels
- **Volume Analysis**: Spike and dry volume detection with ratio calculations
- **Trend Strength Measurement**: EMA-based trend power analysis
### 🎯 **Perfect Zone Detection**
- **Ideal Buy Zone**: Identifies perfect buying opportunities when 7 conditions align:
- ML Score ≥ 0.60
- Bottom proximity detection
- RSI in 20-35 range
- Volume spike confirmation
- Positive price anomaly
- Bullish pattern match
- Positive MACD momentum
### 📊 **Comprehensive Display Table**
- **Real-time ML Analysis**: Complete breakdown of all indicators
- **Perfect Buy Conditions Tracker**: Visual checklist with completion percentage
- **Performance Metrics**: Win rate tracking and P&L analysis
- **Signal Strength Indicators**: Confidence levels for each signal
## 🔧 **Customizable Parameters**
### **ML Settings**
- **ML Lookback Period**: 20-500 bars (default: 100)
- **Anomaly Threshold**: 1.0-5.0 sensitivity (default: 2.0)
- **Pattern Similarity**: 0.5-0.99 matching threshold (default: 0.80)
- **AI Lookback Period**: 20-200 bars (default: 50)
### **AI Prediction Models**
- **Correlation Methods**: Spearman, Pearson, Cosine Similarity
- **Forecast Length**: 15-250 bars (default: 50)
- **Similarity Type**: Price or %Change analysis
### **Visual Options**
- **Table Position**: Top/Bottom Left/Right positioning
- **Table Size**: Small, Normal, Large options
- **Signal Display**: Toggle buy/sell signals on/off
- **AI Visualization**: Optional prediction paths and ZigZag
## 📋 **How to Use**
### **For Beginners**
1. Add the indicator to your chart
2. Look for "PERFECT BUY" signals in the table
3. Wait for completion percentage ≥ 85% for highest probability trades
4. Use the background color changes as visual confirmation
### **For Advanced Traders**
1. Analyze individual ML components in the detailed table
2. Monitor anomaly detection for unusual market conditions
3. Use pattern confidence levels for trade timing
4. Combine with your existing strategy for confirmation
### **Signal Interpretation**
- **🟢 PERFECT BUY**: All 7 conditions met - highest probability reversal
- **🟡 NEAR BOTTOM**: Close to ideal conditions - monitor closely
- **🔴 NOT READY**: Wait for better setup
- **Strong Buy/Sell Signals**: ML score-based entries with high confidence
## ⚠️ **Important Notes**
### **Risk Management**
- This indicator provides analysis and signals, not guaranteed outcomes
- Always use proper risk management and position sizing
- Consider market conditions and fundamental factors
- Backtest the strategy on your preferred timeframes and assets
### **Best Practices**
- Use multiple timeframe analysis for confirmation
- Combine with support/resistance levels
- Monitor volume confirmation for all signals
- Set appropriate stop-losses and profit targets
### **Performance Tracking**
- The indicator tracks its own performance with win rate calculations
- Monitor the "AI Prediction" accuracy percentage
- Use the P&L tracking to assess signal quality over time
## 🔄 **Updates and Improvements**
This indicator is continuously evolving with:
- Enhanced machine learning algorithms
- Improved pattern recognition capabilities
- Additional correlation methods for better accuracy
- Performance optimization for faster calculations
- New visualization features based on user feedback
## 📚 **Technical Details**
### **Machine Learning Implementation**
- **Pattern Matching**: 20-bar normalized price patterns with historical comparison
- **Correlation Analysis**: Mathematical similarity scoring between current and historical patterns
- **Anomaly Detection**: Statistical Z-score analysis across price, volume, and RSI
- **Signal Weighting**: Multi-factor scoring system with optimized weights
### **Algorithm Components**
1. **Feature Extraction**: Price, volume, momentum, volatility, and trend features
2. **Pattern Recognition**: Historical pattern database with similarity matching
3. **Anomaly Detection**: Multi-dimensional Z-score threshold analysis
4. **Signal Generation**: Weighted scoring system with confidence intervals
5. **Performance Tracking**: Real-time win rate and accuracy monitoring
### **Calculation Methods**
- **Trend Strength**: (EMA8 - EMA21) / EMA21 * 100
- **Volume Ratio**: Current Volume / 20-period SMA Volume
- **BB Position**: (Close - BB_Lower) / (BB_Upper - BB_Lower)
- **Anomaly Score**: Average of normalized Z-scores for price, volume, and RSI
## 🎨 **Visual Elements**
### **Background Colors**
- **Light Green**: Perfect buy zone detected
- **Light Red**: Perfect sell zone detected
- **Light Blue**: Near bottom proximity
- **Green/Red Transparency**: Price anomaly detection
### **Signal Shapes**
- **Green Triangle Up**: Strong buy signal
- **Red Triangle Down**: Strong sell signal
- **Aqua Diamond**: Perfect buy zone entry
- **Purple Diamond**: Perfect sell zone entry
### **Table Information**
- **ML Complete Analysis**: 16 comprehensive metrics
- **Perfect Buy Conditions**: 7-point checklist with status indicators
- **Real-time Values**: Live updating of all calculations
- **Color-coded Status**: Green (good), Yellow (moderate), Red (caution)
## 🔍 **Troubleshooting**
### **Common Issues**
- **Table Not Showing**: Enable "Show ML Table" in settings
- **No Signals Appearing**: Check "Show Buy/Sell Signals" option
- **Performance Issues**: Reduce ML Lookback Period for faster calculation
- **Too Many/Few Signals**: Adjust Anomaly Threshold sensitivity
### **Optimization Tips**
- **For Day Trading**: Use lower timeframes (1m, 5m, 15m) with reduced lookback periods
- **For Swing Trading**: Use higher timeframes (1h, 4h, 1D) with standard settings
- **For Scalping**: Enable only strong signals and reduce pattern similarity threshold
- **For Long-term**: Increase all lookback periods and use daily/weekly timeframes
## 📖 **Disclaimer**
This indicator is for educational and informational purposes only. It should not be considered as financial advice. Trading involves substantial risk of loss and is not suitable for all investors. Past performance does not guarantee future results.
### **Risk Warning**
- All trading involves risk of substantial losses
- Never risk more than you can afford to lose
- This indicator does not guarantee profitable trades
- Always use proper risk management techniques
- Consider consulting with a financial advisor
### **Liability**
The creator of this indicator is not responsible for any losses incurred from its use. Users should thoroughly test and understand the indicator before using it with real money.
### **Feature Requests**
- Suggest improvements through TradingView comments
- Report bugs with detailed descriptions
- Share successful strategies using the indicator
- Contribute to community discussions
## 🏆 **Credits and Acknowledgments**
This indicator builds upon various open-source libraries and mathematical concepts:
- TradingView ZigZag library for visualization
- Statistical correlation methods from academic research
- Machine learning concepts adapted for financial markets
- Community feedback and testing contributions
## 📈 **Performance Metrics**
The indicator includes built-in performance tracking:
- **Win Rate Calculation**: Percentage of profitable signals
- **Signal Accuracy**: ML prediction vs actual price movement
- **Drawdown Tracking**: Current unrealized P&L from last signal
- **Completion Percentage**: How many perfect conditions are met
## 🔬 **Mathematical Foundation**
### **Correlation Calculations**
- **Pearson**: Measures linear correlation between patterns
- **Spearman**: Rank-based correlation for non-linear relationships
- **Cosine Similarity**: Vector-based similarity for pattern matching
### **Statistical Methods**
- **Z-Score**: (Value - Mean) / Standard Deviation
- **Pattern Normalization**: Price / Price
- **Volatility Percentile**: Historical ranking of current volatility
- **Momentum Calculation**: Price change over multiple periods
## 🎯 **Trading Strategies**
### **Conservative Approach**
- Wait for Perfect Buy Zone (85%+ completion)
- Use higher timeframes for confirmation
- Set stop-loss at recent swing low
- Take profits at resistance levels
### **Aggressive Approach**
- Trade on Strong Buy/Sell signals
- Use lower completion thresholds (70%+)
- Tighter stop-losses with faster exits
- Higher position sizes with confirmed trends
### **Hybrid Strategy**
- Combine with other indicators for confirmation
- Use different settings for different market conditions
- Scale in/out based on signal strength
- Adjust parameters based on market volatility

Brain Premium [ALGO]💡 Brain Premium ALGO
Brainpremium ALGO is a strategy algorithm that analyzes a two-phase regional liquidity structure and only opens positions on price breakouts occurring within these liquidity zones.
This system is developed based on the market experience of manual traders and automatically executes trade decisions using AI-like rules and specific triggers.
💡 Two-Phase Liquidity-Based Entry Strategy
This strategy operates by detecting liquidity sweep zones and confirmed reversal signals:
🔹 Phase 1 – Liquidity Sweep:
Price is expected to sweep areas where equal highs/lows or liquidity clusters exist. These zones are considered potential reversal levels.
🔹 Phase 2 – Confirmed Entry:
After liquidity is swept, entries are triggered only by confirmed reversal signals such as structural breaks, inside bars, or breakouts in the opposite direction.
✅ Entries are triggered only when liquidity and reversal confirmation occur simultaneously.
🎯 This approach targets high-probability, low-risk trades.
⚙️ Key Features
🔍 Dynamic Liquidity Detection — Automatically identifies liquidity zones.
🧩 Modular Entry Options (1–2–3) — Allows opening positions via different strategy paths.
🛡️ Dynamic Stop Loss System — Stop Loss adjusts as price moves favorably.
📈 Advanced Risk Management — Adjustable Take Profit, Stop Loss, leverage, balance, and mode.
🔔 JSON Alert Support — Connects to platforms like BingX via webhook.
🧾 Information Panel — Displays real-time trade data and strategy status.
📊 Backtest & Default Settings
Strategy tests are conducted with realistic and sustainable parameters:
Parameter Value
Trading Balance: $100 (%10 of total wallet)
Leverage: 10x
Stop Loss: 1%
Take Profit Type : High TP (optional: Low and Risky also available)
Entry Option 1 (optional: 2 and 3 also available)
Mode: NORMAL
Commission 0.05%
Dynamic Stop Loss: Enabled
Timeframe: 5 minute
Pair ETH/USDT
Duration: 30 days
🧭 Usage Instructions
Add Brain Premium ALGO to your TradingView chart.
Set position size, leverage, and SL/TP levels from the settings panel.
Select entry option (1, 2, or 3).
Activate backtesting and alert systems to monitor the strategy.
⚠️ Disclaimer
This strategy is not financial advice. Past performance does not guarantee future results. Trade only with capital you can afford to risk and always test thoroughly in a demo environment first.
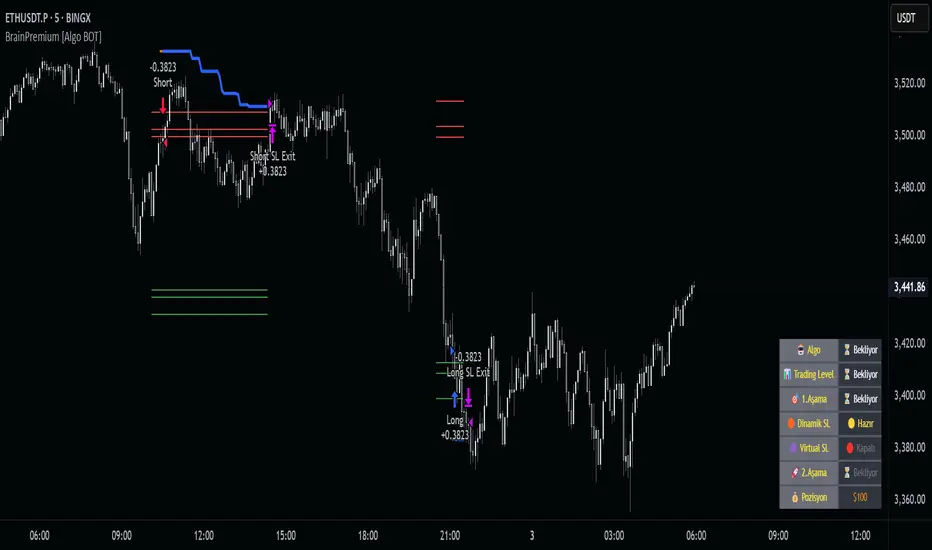
ICT Smart Money Trading Suite [SwissAlgo]ICT/Smart Money Trading Suite - Technical Analysis Indicator
----------------------------------------------------------
OVERVIEW
The ICT/Smart Money Trading Suite is a technical analysis indicator that implements concepts from Inner Circle Trader (ICT) methodology and Smart Money Concepts (SMC).
ICT methodology was developed by Michael J. Huddleston (ICT) and focuses on understanding Institutional market behavior.
Smart Money Concepts builds upon these ideas to analyze how large Financial Institutions and/or Market Makers seem to operate in the markets.
This indicator combines multiple analytical tools into a single package for market structure analysis, imbalance detection, and the observation of institutional order flow.
----------------------------------------------------------
CORE COMPONENTS
Market Structure Analysis:
- External Structure : Major swing highs and lows that define broader price movement (these are the most significant structural points that institutions reference for their positioning and typically require substantial volume and momentum to break)
- Internal Structure : Shorter-term pivots showing micro-trend developments within the External Structure (these internal pivot highs and lows often represent areas where retail traders may be positioned on the wrong side of the market as they frequently form just before major structural breaks or trend continuations, creating liquidity that institutions can utilize)
- Structural Breakout Detection : Identification of structure breaks and potential trend changes ( 'Change of Character' which occurs when the External Structure shifts from bullish to bearish bias or vice-versa indicating a potential major trend reversal, and 'Break of Structure' which happens when price decisively takes out previous significant highs in a bearish trend or previous significant lows in a bullish trend confirming trend continuation or acceleration)
- EMA Cloud : Dynamic support and resistance zones with trend context (additional reference point)
Imbalance Zone Detection:
Fair Value Gaps (FVGs):
Price inefficiencies that occur between candles when sudden price moves create gaps in price delivery
Typically formed when the low of a bullish candle is higher than the high of the candle two periods prior, or when the high of a bearish candle is lower than the low of the candle two periods prior
These gaps represent areas where price moved too quickly without adequate two-way auction process
Institutions may return to fill these inefficiencies at a later time for proper price discovery
The theory suggests that all price ranges should eventually be traded through to complete the auction process
Gaps are automatically removed from the chart when price fully retraces back through the inefficient area
Order Blocks (OBs):
Specific candles that occur immediately before significant market moves and represent institutional decision points
Identified as the last opposing candle before a strong directional move (final bearish candle before major bullish move or final bullish candle before major bearish move)
These candles contain the orders and liquidity that institutions used as a foundation for their market manipulation
Represent areas where large institutional players positioned themselves to move the market significantly
Price may return to these levels to collect additional liquidity or test institutional resolve
The candle's full range (high to low) is considered the active zone where institutional interest may remain
Vector Candle Recovery:
Zones created by high-activity candles that demonstrate unusually large range and volume characteristics
These candles are interpreted as manipulative price pushes designed to hunt liquidity and trigger stop losses
Often used by institutions to induce retail traders into poor positions before reversing direction
Recovery zones represent the full range of these vector candles where price may retrace
The concept assumes that extreme moves often get partially retraced as the market corrects from artificial price displacement
Zones are invalidated when a significant portion of the vector candle range is retraced (typically 50% or more)
Support & Resistance:
Key price zones based on historical price reactions and pivot clustering analysis
Calculated through algorithmic identification of areas where price has repeatedly found buyers (support) or sellers (resistance)
Strength is determined by the number of times price has reacted from these levels and the volume of activity at these zones
Represent psychological and algorithmic reference points where institutional systems are likely to place orders
Create areas of increased probability for price reactions due to concentration of pending orders and decision-making activity
Zones are color-coded based on current price position: green for support (price above), red for resistance (price below), yellow for neutral (price within)
Liquidity Analysis:
- Liquidity Pools : Areas above or below key levels where stop orders may cluster
- Kill Zones : Time-based periods associated with increased market activity
- Daily/Weekly/Monthly Price Levels : Key institutional reference points (price highs/lows)
Vector Candles/Price Manipulation:
Advanced algorithm identifying statistically significant candles using volume delta analysis, range statistics, and persistence scoring.
----------------------------------------------------------
VISUAL INTERPRETATION - DETAILED GUIDE
MARKET STRUCTURE
External Structure (Thick Lines):
- Green thick lines: Major support levels (external lows) that define bullish structure
- Red thick lines: Major resistance levels (external highs) that define bearish structure
- These lines represent significant swing points that institutions may reference
- Lines extend from the swing point and update as the structure evolves
Internal Structure (Thin Lines):
- Green thin lines: Minor support levels showing internal market structure
- Red thin lines: Minor resistance levels showing internal market structure
- More frequent updates than external structure, showing micro-trend changes
Structure Markers:
- Small triangles with "H": External pivot highs (major resistance points)
- Small triangles with "L": External pivot lows (major support points)
- Small dots: Internal pivot points (minor structure without text)
- Markers appear with a 20-bar delay to confirm pivot validity
HIGHS/LOWS LEVELS
Daily Levels (Green Dashed Lines):
- Horizontal dashed lines marking the previous day's high and low
- Updates at the start of each new trading day
- Gradient effect shows historical importance (newer = more opaque)
- Acts as institutional reference points for intraday trading
Weekly Levels (White Dashed Lines):
- Horizontal dashed lines marking the previous week's high and low
- Updates at the start of each new trading week
- Typically more significant than daily levels for swing trading
- Often respected by institutional algorithms
Monthly Levels (Orange Dashed Lines):
- Horizontal dashed lines marking the previous month's high and low
- Updates at the start of each new trading month
- Highest significance levels for long-term institutional positioning
- Major psychological and algorithmic reference points
VECTOR CANDLES
Candle Body Coloring System:
- Lime Green Bodies: Ultra-bullish vector candles (Z-score ≥ 3.0)
- Blue Bodies: Abnormal bullish vector candles (Z-score 2.0-2.99)
- Bright Red Bodies: Ultra-bearish vector candles (Z-score ≥ 3.0)
- Purple Bodies: Abnormal bearish vector candles (Z-score 2.0-2.99)
- Faded Green/Red: Normal market activity candles
Vector Identification Criteria:
- Statistical significance based on range and volume delta
- Persistence scoring (how much directional pressure remained)
- ATR-based absolute detection (candles >2x ATR automatically qualify)
- These candles often precede significant market moves or reversals
EMA CLOUD
Purple Cloud Visualization:
- Central line: 50-period EMA (blue line)
- Upper boundary: EMA + dynamic standard deviation band
- Lower boundary: EMA - dynamic standard deviation band
- Cloud fill: Purple semi-transparent area between boundaries
Interpretation:
- Price above cloud: Bullish bias context
- Price below cloud: Bearish bias context
- Price within cloud: Neutral/transitional zone
- Cloud thickness adapts to market volatility automatically
KILL ZONES
Background Highlighting:
- Yellow background tint during active kill zone periods
- London Session: 08:00-11:00 (UTC+1 time)
- NY Open: 13:00-16:00 (UTC+1 time)
- NY Close: 19:00-21:00 (UTC+1 time)
- Times automatically adjust to the chart timezone
Purpose:
- Highlights periods of typically increased institutional activity
- Times when liquidity hunting and manipulation often occur
- Periods when significant directional moves frequently begin
IMBALANCE ZONES - DETAILED BREAKDOWN
Fair Value Gaps (FVGs):
- Green boxes: Bullish FVGs (gap between bear candle high and bull candle low)
- Red boxes: Bearish FVGs (gap between bull candle high and bear candle low)
- Gray dotted lines: Midpoint of each gap (50% retracement level)
- Text label: "Fair Value Gap" in top-right corner
- Auto-removal: Boxes disappear when the price fills the gap
Order Blocks (OBs):
- Green boxes: Bullish order blocks (demand zones from the last bear candle before bullish vector)
- Red boxes: Bearish order blocks (supply zones from the last bull candle before the bearish vector)
- Gray dotted lines: Midpoint of each order block
- Text label: "OB" in top-right corner
- Invalidation: Boxes removed when price breaks below (bull OB) or above (bear OB)
Vector Candles Recovery Zones:
- Green boxes: Recovery zones after bullish vector candles
- Red boxes: Recovery zones after bearish vector candles
- Gray dotted lines: Midpoint of the vector candle range
- Text label: "Vector Recovery" on the right side
- These mark the full range of significant vector candles where retracements may occur
Support & Resistance Zones:
- Green boxes: Support zones (price currently above the zone)
- Red boxes: Resistance zones (price currently below the zone)
- Yellow boxes: Neutral zones (price within the zone)
- Text labels: "Support", "Resistance", or "Support/Resistance"
- Based on historical pivot clustering and strength analysis
Liquidity Pools:
- Green boxes: Bullish liquidity pools (below recent lows where buy stops cluster)
- Red boxes: Bearish liquidity pools (above recent highs where sell stops cluster)
- Gray dotted lines: Key liquidity level within the pool
- Text label: "Liquidity Pool" on the right side
- Zones where institutional players may hunt stop losses before reversing
----------------------------------------------------------
CALCULATION METHODOLOGY
Vector Candle Algorithm:
- Statistical Analysis using 48-bar lookback period
- Z-score thresholds: 2.0 (abnormal), 3.0 (ultra)
- ATR-based significance filtering
- Volume Delta Integration with lower timeframe analysis
- Persistence scoring based on directional pressure sustainability
- Combined scoring system (delta + range)
- Absolute Vector Detection for candles exceeding 2x ATR
Market Structure Parameters:
- Swing Size: 20-period pivot detection
- Breakout Threshold: 3 consecutive breaks for structure confirmation
- EMA Length: 50-period with dynamic cloud sizing
Fair Value Gap Detection:
- Auto Threshold: Dynamic gap sizing based on asset volatility
- Manual Threshold: User-defined minimum gap percentage
- Mitigation Logic: Automatic removal when price fills gaps
----------------------------------------------------------
TARGET USERS
This indicator is designed for traders who:
- Study Inner Circle Trader concepts
- Apply Smart Money Concepts in their analysis
- Focus on market structure and institutional behavior
- Seek confluence-based trading approaches
- Use higher timeframe bias for decision making
Experience Level: Intermediate to Advanced
Requires understanding of market structure concepts and institutional trading theory.
Recommended Timeframes:
- Analysis: 4H, Daily for market structure context
- Execution: 1H, 15min for entry timing
- Lower timeframes: With higher timeframe alignment
----------------------------------------------------------
CUSTOMIZATION OPTIONS
Display Controls:
- Master toggle for all imbalance zones
- Individual controls for each concept type
- Market structure line visibility
- Kill zone highlighting
- EMA cloud display
Visual Settings:
- Automatic light/dark mode color adaptation
- Adjustable zone transparency levels
- Extension distance controls
- Descriptive text labels
Technical Parameters:
- Vector candle sensitivity thresholds
- Historical analysis lookback periods
- Maximum zone display limits
- Zone invalidation conditions
----------------------------------------------------------
EDUCATIONAL BACKGROUND
Inner Circle Trader (ICT): A trading methodology developed by Michael J. Huddleston that focuses on understanding how institutional traders and market makers operate. The approach emphasizes market structure, liquidity concepts, and timing based on institutional behavior patterns.
Smart Money Concepts (SMC): An evolution of ICT principles that analyzes how large financial institutions move markets. These concepts include order blocks, fair value gaps, liquidity hunting, and market structure shifts.
Both methodologies are based on the premise that understanding institutional trading behavior can provide insights into market direction and timing.
----------------------------------------------------------
IMPORTANT DISCLAIMERS
This indicator is provided for educational and analytical purposes only. It is not financial advice and does not guarantee trading results.
Trading involves substantial risk of loss. Past performance does not indicate future results. Users should thoroughly understand the underlying concepts before applying them to live trading.
The effectiveness of these analytical methods may vary across different market conditions, timeframes, and instruments. Proper risk management and additional analysis are essential.
This indicator is a tool for market analysis, not a complete trading system. Success requires understanding of market principles, risk management, and continuous learning.
Always test analytical approaches thoroughly using historical data and demo accounts before implementing with real capital.

Position Size Calculator with Fees# Position Size Calculator with Portfolio Management - Manual
## Overview
The Position Size Calculator with Portfolio Management is an advanced Pine Script indicator designed to help traders calculate optimal position sizes based on their total portfolio value and risk management strategy. This tool automatically calculates your risk amount based on portfolio allocation percentages and determines the exact position size needed while accounting for trading fees.
## Key Features
- **Portfolio-Based Risk Management**: Calculates risk based on total portfolio value
- **Tiered Risk Allocation**: Separates trading allocation from total portfolio
- **Automatic Trade Direction Detection**: Determines long/short based on entry vs stop loss
- **Fee Integration**: Accounts for trading fees in position size calculations
- **Risk Factor Adjustment**: Allows scaling of position size up or down
- **Visual Display**: Shows all calculations in a clear, color-coded table
- **Automatic Risk Calculation**: No need to manually input risk amount
## Input Parameters
### Total Portfolio ($)
- **Purpose**: The total value of your investment portfolio
- **Default**: 0.0
- **Range**: Any positive value
- **Step**: 0.01
- **Example**: If your total portfolio is worth $100,000, enter 100000
### Trading Portfolio Allocation (%)
- **Purpose**: The percentage of your total portfolio allocated to active trading
- **Default**: 20.0%
- **Range**: 0.0% to 100.0%
- **Step**: 0.01
- **Example**: If you allocate 20% of your portfolio to trading, enter 20
### Risk from Trading (%)
- **Purpose**: The percentage of your trading allocation you're willing to risk per trade
- **Default**: 0.1%
- **Range**: Any positive value
- **Step**: 0.01
- **Example**: If you risk 0.1% of your trading allocation per trade, enter 0.1
### Entry Price ($)
- **Purpose**: The price at which you plan to enter the trade
- **Default**: 0.0
- **Range**: Any positive value
- **Step**: 0.01
### Stop Loss ($)
- **Purpose**: The price at which you will exit if the trade goes against you
- **Default**: 0.0
- **Range**: Any positive value
- **Step**: 0.01
### Risk Factor
- **Purpose**: A multiplier to scale your position size up or down
- **Default**: 1.0 (no scaling)
- **Range**: 0.0 to 10.0
- **Step**: 0.1
- **Examples**:
- 1.0 = Normal position size
- 2.0 = Double the position size
- 0.5 = Half the position size
### Fee (%)
- **Purpose**: The percentage fee charged per transaction
- **Default**: 0.01% (0.01)
- **Range**: 0.0% to 1.0%
- **Step**: 0.001
## How Risk Amount is Calculated
The script automatically calculates your risk amount using this formula:
```
Risk Amount = Total Portfolio × Trading Allocation (%) × Risk % ÷ 10,000
```
### Example Calculation:
- Total Portfolio: $100,000
- Trading Allocation: 20%
- Risk per Trade: 0.1%
**Risk Amount = $100,000 × 20 × 0.1 ÷ 10,000 = $20**
This means you would risk $20 per trade, which is 0.1% of your $20,000 trading allocation.
## Portfolio Structure Example
Let's say you have a $100,000 portfolio:
### Allocation Structure:
- **Total Portfolio**: $100,000
- **Trading Allocation (20%)**: $20,000
- **Long-term Investments (80%)**: $80,000
### Risk Management:
- **Risk per Trade (0.1% of trading)**: $20
- **Maximum trades at risk**: Could theoretically have 1,000 trades before risking entire trading allocation
## How Position Size is Calculated
### Trade Direction Detection
- **Long Trade**: Entry price > Stop loss price
- **Short Trade**: Entry price < Stop loss price
### Position Size Formulas
#### For Long Trades:
```
Position Size = -Risk Factor × Risk Amount / (Stop Loss × (1 - Fee) - Entry Price × (1 + Fee))
```
#### For Short Trades:
```
Position Size = -Risk Factor × Risk Amount / (Entry Price × (1 - Fee) - Stop Loss × (1 + Fee))
```
## Output Display
The indicator displays a comprehensive table with color-coded sections:
### Portfolio Information (Light Blue Background)
- **Portfolio (USD)**: Your total portfolio value
- **Trading Portfolio Allocation (%)**: Percentage allocated to trading
- **Risk as % of Trading**: Risk percentage per trade
### Trade Setup (Gray Background)
- **Entry Price**: Your specified entry price
- **Stop Loss**: Your specified stop loss price
- **Fee (%)**: Trading fee percentage
- **Risk Factor**: Position size multiplier
### Risk Analysis (Red Background)
- **Risk Amount**: Automatically calculated dollar risk
- **Effective Entry**: Actual entry cost including fees
- **Effective Exit**: Actual exit value including fees
- **Expected Loss**: Calculated loss if stop loss is hit
- **Deviation from Risk %**: Accuracy of risk calculation
### Final Result (Blue Background)
- **Position Size**: Number of shares/units to trade
## Usage Examples
### Example 1: Conservative Long Trade
- **Total Portfolio**: $50,000
- **Trading Allocation**: 15%
- **Risk per Trade**: 0.05%
- **Entry Price**: $25.00
- **Stop Loss**: $24.00
- **Risk Factor**: 1.0
- **Fee**: 0.01%
**Calculated Risk Amount**: $50,000 × 15% × 0.05% ÷ 100 = $3.75
### Example 2: Aggressive Short Trade
- **Total Portfolio**: $200,000
- **Trading Allocation**: 30%
- **Risk per Trade**: 0.2%
- **Entry Price**: $150.00
- **Stop Loss**: $155.00
- **Risk Factor**: 2.0
- **Fee**: 0.01%
**Calculated Risk Amount**: $200,000 × 30% × 0.2% ÷ 100 = $120
**Actual Risk**: $120 × 2.0 = $240 (due to risk factor)
## Color Coding System
- **Green/Red Header**: Trade direction (Long/Short)
- **Light Blue**: Portfolio management parameters
- **Gray**: Trade setup parameters
- **Red**: Risk-related calculations and results
- **Blue**: Final position size result
## Best Practices
### Portfolio Management
1. **Keep trading allocation reasonable** (typically 10-30% of total portfolio)
2. **Use conservative risk percentages** (0.05-0.2% per trade)
3. **Don't risk more than you can afford to lose**
### Risk Management
1. **Start with small risk factors** (1.0 or less) until comfortable
2. **Monitor your total exposure** across all open positions
3. **Adjust risk based on market conditions**
### Trade Execution
1. **Always validate calculations** before placing trades
2. **Account for slippage** in volatile markets
3. **Consider position size relative to liquidity**
## Risk Management Guidelines
### Conservative Approach
- Trading Allocation: 10-20%
- Risk per Trade: 0.05-0.1%
- Risk Factor: 0.5-1.0
### Moderate Approach
- Trading Allocation: 20-30%
- Risk per Trade: 0.1-0.15%
- Risk Factor: 1.0-1.5
### Aggressive Approach
- Trading Allocation: 30-40%
- Risk per Trade: 0.15-0.25%
- Risk Factor: 1.5-2.0
## Troubleshooting
### Common Issues
1. **Position Size shows 0**
- Verify all portfolio inputs are greater than 0
- Check that entry price differs from stop loss
- Ensure calculated risk amount is positive
2. **Very small position sizes**
- Increase risk percentage or risk factor
- Check if your risk amount is too small for the price difference
3. **Large risk deviation**
- Normal for very small positions
- Consider adjusting entry/stop loss levels
### Validation Checklist
- Total portfolio value is realistic
- Trading allocation percentage makes sense
- Risk percentage is conservative
- Entry and stop loss prices are valid
- Trade direction matches your intention
## Advanced Features
### Risk Factor Usage
- **Scaling up**: Use risk factors > 1.0 for high-confidence trades
- **Scaling down**: Use risk factors < 1.0 for uncertain trades
- **Never exceed**: Risk factors that would risk more than your comfort level
### Multiple Timeframe Analysis
- Use different risk factors for different timeframes
- Consider correlation between positions
- Adjust trading allocation based on market conditions
## Disclaimer
This tool is for educational and planning purposes only. Always verify calculations manually and consider market conditions, liquidity, and correlation between positions. The automated risk calculation assumes you're comfortable with the mathematical relationship between portfolio allocation and individual trade risk. Past performance doesn't guarantee future results, and all trading involves risk of loss.

Lot Size Calculator (SL Percentage) - Futures ⚠️ IMPORTANT DISCLAIMER
This indicator is provided for educational and informational purposes only. The author assumes no responsibility for any financial losses, code errors, calculation mistakes, or trading decisions based on this tool. Use at your own risk and responsibility. Always manually verify calculations before opening real positions.
Contract size calculations are based on standard full-size futures contracts, not micro contracts (even though micro contracts are supported for identification).
Description
Money management tool for automatic calculation of optimal contract size (lot size) in futures trading. Supports over 50 futures instruments with pre-configured tick sizes and pip values for CME and other exchanges.
Supported Instruments
Currency Futures: 6J, 6E, 6B, 6A, 6C, 6S, 6N
Index Futures: ES, NQ, YM, RTY, MES, MNQ, MYM, M2K, NKD
Energy: CL, NG, HO, RB, QM
Metals: GC, SI, HG, MGC, SIL
Agricultural: ZC, ZS, ZW, HE, LE, ZO, ZR, ZM, ZL
Interest Rates: ZN, ZB, ZT, ZF
Crypto: MBT, MET
Others: VX
Main Parameters
Equity : Total available capital
Risk : Maximum risk percentage per trade
Stop Loss : Percentage distance of stop loss
Risk/Reward Ratio: Ratio to calculate take profit
Entry Price: Entry price (0 = current price)
Stop Loss Modes
Percentage Stop Loss (Use SL in % = ON):
Automatically calculates SL level as percentage from entry price
Example: Entry 100, SL 2% → Long SL at 98, Short SL at 102
Manual Stop Loss (Use SL in % = OFF):
Enter exact stop loss price directly
Greater precision for specific technical levels (support/resistance)
Interactive feature: You can drag the red stop loss line directly on the chart to modify the level in real-time
How to Use
Set equity and risk % according to your trading plan
Choose direction (Long/Short) and stop loss (percentage or price)
Enter entry price (optional)
Read the CONTRACT SIZE in the green table
Verify levels Entry/SL/TP on the graphic lines
Output
Information table with all parameters and highlighted CONTRACT SIZE
Graphic lines: Entry (blue), Stop Loss (red), Take Profit (green)
Configurable alerts with calculated values
Advantages
✅ Automatic calculation of optimal size
✅ Precise tick sizes for each instrument
✅ Systematic risk management
✅ Clear visual interface
✅ Multi-asset support on futures
Warnings
⚠️ Always verify that the instrument is recognized (no orange warning)
⚠️ Manually check calculations before trading
⚠️ Test in demo before using with real money
⚠️ Update regularly for any contract modifications
⚠️ DISCLAIMER IMPORTANTE
Questo indicatore è fornito esclusivamente a scopo educativo e informativo. L'autore non si assume alcuna responsabilità per eventuali perdite finanziarie, errori nel codice, calcoli errati o decisioni di trading basate su questo strumento. L'utilizzo è a proprio rischio e responsabilità. Si raccomanda di verificare sempre manualmente i calcoli prima di aprire posizioni reali.
I calcoli della dimensione del contratto sono basati su contratti futures standard full-size, non micro contratti (anche se i micro contratti sono supportati per l'identificazione).
Descrizione
Strumento di money management per il calcolo automatico della dimensione ottimale del contratto (lot size) nel trading di futures. Supporta oltre 50 strumenti futures con tick size e pip value pre-configurati per mercati CME e altri exchange.
Strumenti Supportati
Currency Futures: 6J, 6E, 6B, 6A, 6C, 6S, 6N
Index Futures: ES, NQ, YM, RTY, MES, MNQ, MYM, M2K, NKD
Energy: CL, NG, HO, RB, QM
Metals: GC, SI, HG, MGC, SIL
Agricultural: ZC, ZS, ZW, HE, LE, ZO, ZR, ZM, ZL
Interest Rates: ZN, ZB, ZT, ZF
Crypto: MBT, MET
Altri: VX
Parametri Principali
Equity : Capitale totale disponibile
Risk : Percentuale massima di rischio per trade
Stop Loss : Distanza percentuale dello stop loss
Risk/Reward Ratio: Rapporto per calcolare il take profit
Entry Price: Prezzo di entrata (0 = prezzo corrente)
Modalità Stop Loss
Stop Loss Percentuale (Use SL in % = ON):
Calcola automaticamente il livello SL come percentuale dal prezzo di entrata
Esempio: Entry 100, SL 2% → SL Long a 98, SL Short a 102
Stop Loss Manuale (Use SL in % = OFF):
Inserisci direttamente il prezzo esatto dello stop loss
Maggiore precisione per livelli tecnici specifici (supporti/resistenze)
Funzione interattiva: Puoi trascinare direttamente la linea rossa dello stop loss sul grafico per modificare il livello in tempo reale
Come Usare
Imposta equity e risk % secondo il tuo piano di trading
Scegli direzione (Long/Short) e stop loss (percentuale o prezzo)
Inserisci entry price (opzionale)
Leggi il CONTRACT SIZE nella tabella verde
Verifica i livelli Entry/SL/TP sulle linee grafiche
Output
Tabella informativa con tutti i parametri e il CONTRACT SIZE evidenziato
Linee grafiche: Entry (blu), Stop Loss (rosso), Take Profit (verde)
Alert configurabile con i valori calcolati
Vantaggi
✅ Calcolo automatico della size ottimale
✅ Tick size precisi per ogni strumento
✅ Risk management sistematico
✅ Interfaccia visiva chiara
✅ Supporto multi-asset su futures
Avvertenze
⚠️ Verifica sempre che lo strumento sia riconosciuto (no warning arancione)
⚠️ Controlla manualmente i calcoli prima di tradare
⚠️ Testa in demo prima dell'uso con denaro reale
⚠️ Aggiorna regolarmente per eventuali modifiche ai contratti
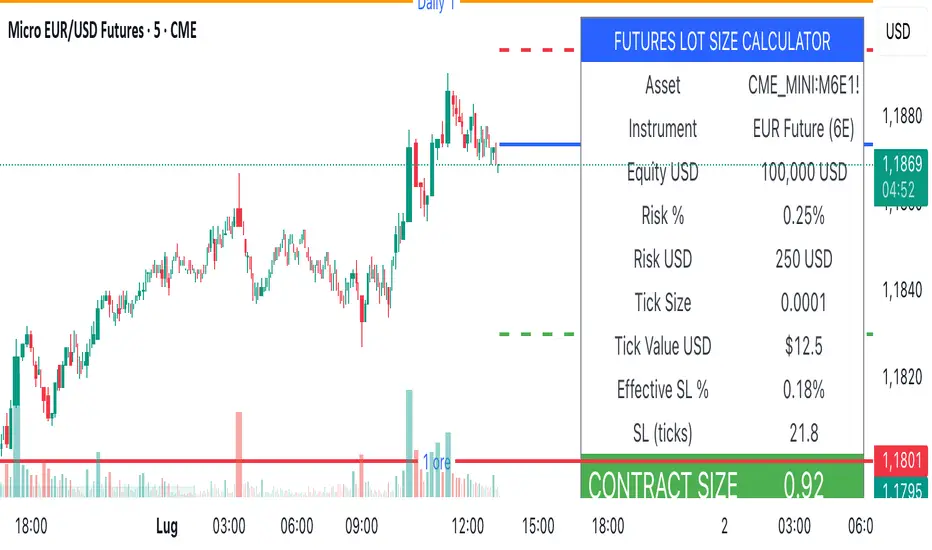
Initial balance - weeklyWeekly Initial Balance (IB) — Indicator Description
The Weekly Initial Balance (IB) is the price range (High–Low) established during the week’s first trading session (most commonly Monday). You can measure it over the entire day or just the first X hours (e.g. 60 or 120 minutes). Once that session ends, the IB High and IB Low define the key levels where the initial weekly range formed.
Why Measure the Weekly IB?
Week-Opening Sentiment:
Monday’s range often sets the tone for the rest of the week. Trading above the IB High signals bullish control; trading below the IB Low signals bearish control.
Key Liquidity Zones:
Large institutions tend to place orders around these extremes, so you’ll frequently see tests, breakouts, or rejections at these levels.
Support & Resistance:
The IB High and IB Low become natural barriers. Price will often return to them, bounce off them, or break through them—ideal spots for entries and exits.
Volatility Forecast:
The width of the IB (High minus Low) indicates whether to expect a volatile week (wide IB) or a quieter one (narrow IB).
Significance of IB Levels
Breakout:
A clear break above the IB High (for longs) or below the IB Low (for shorts) can ignite a strong trending move.
Fade:
A rejection off the IB High/Low during low momentum (e.g. low volume or pin-bar formations) offers a high-probability reversal trade.
Mid-Point:
The 50% level of the IB range often “magnetizes” price back to it, providing entry points for continuation or reversal strategies.
Three Core Monday IB Strategies
A. Breakout (Open-Range Breakout)
Entry: Wait for 1–2 candles (e.g. 5-minute) to close above IB High (long) or below IB Low (short).
Stop-Loss: A few pips below IB High (long) or above IB Low (short).
Profit-Target: 2–3× your risk (Reward:Risk ≥ 2:1).
Best When: You spot a clear impulse—such as a strong pre-open volume spike or news-driven move.
B. Fade (Reversal at Extremes)
Entry: When price tests IB High but shows weakening momentum (shrinking volume, upper-wick candles), enter short; vice versa for IB Low and longs.
Stop-Loss: Just beyond the IB extreme you’re fading.
Profit-Target: Back toward the IB mid-point (50% level) or all the way to the opposite IB extreme.
Best When: Monday’s action is range-bound and lacks a clear directional trend.
C. Mid-Point Trading
Entry: When price returns to the 50% level of the IB range.
In an up-trend: buy if it bounces off mid-point back toward IB High.
In a down-trend: sell if it reverses off mid-point back toward IB Low.
Stop-Loss: Just below the nearest swing-low (for longs) or above the nearest swing-high (for shorts).
Profit-Target: To the corresponding IB extreme (High or Low).
Best When: You see a strong initial move away from the IB, followed by a pullback to the mid-point.
Usage Steps
Configure your session: Measure IB over your chosen Monday timeframe (whole day or first X hours).
Choose your strategy: Align Breakout, Fade, or Mid-Point entries with the current market context (trend vs. range).
Manage risk: Keep risk per trade ≤ 1% of account and maintain at least a 2:1 Reward:Risk ratio.
Backtest & forward-test: Verify performance over multiple Mondays and in a paper-trading environment before going live.

Momentum Flip Pro - Advanced ZigZag Trading SystemMomentum Flip Pro - Advanced ZigZag Trading System
Complete User Guide
📊 What This Indicator Does
The Momentum Flip Pro is an advanced position-flipping trading system that automatically identifies trend reversals using ZigZag patterns combined with momentum analysis. It's designed for traders who want to always be in the market, flipping between long and short positions at optimal reversal points.
Key Features:
Automatically flips positions at each ZigZag reversal point
Dynamic stop loss placement at exact ZigZag levels
Real-time trading dashboard with performance metrics
Capital tracking and ROI calculation
Three momentum engines to choose from
🎯 How It Works
Entry Signal: When a ZigZag point appears (circle on chart), the indicator:
Exits current position (if any)
Immediately enters opposite position
Places stop loss at the exact ZigZag price
Exit Signal: Positions are closed when the next ZigZag appears, then immediately reversed
Position Management:
Long Entry: ZigZag bottom (momentum turns UP)
Short Entry: ZigZag peak (momentum turns DOWN)
Stop Loss: Always at the ZigZag entry price
Take Profit: Next ZigZag point (automatic position flip)
⚙️ Recommended Settings
For Day Trading (5m-15m timeframes):
Momentum Engine: Quantum
- RSI Length: 9-12
- Quantum Factor: 3.5-4.0
- RSI Smoothing: 3-5
- Threshold: 8-10
For Swing Trading (1H-4H timeframes):
Momentum Engine: MACD
- Fast Length: 12
- Slow Length: 26
- Signal Smoothing: 9
- MA Type: EMA
For Position Trading (Daily):
Momentum Engine: Moving Average
- Average Type: EMA or HMA
- Length: 20-50
📈 How to Use for Trading
Add to Chart:
Add indicator to your chart
Set your starting capital
Choose your preferred momentum engine
Understanding Signals:
Green circles: Strong bullish momentum reversal
Red circles: Strong bearish momentum reversal
Purple circles: Normal momentum reversal
Entry labels: Show exact entry points with tooltips
Trading Rules:
Enter LONG when you see an up arrow + green/purple circle
Enter SHORT when you see a down arrow + red/purple circle
Stop loss is automatically at the ZigZag level
Hold until next ZigZag appears (exit + reverse)
Risk Management:
Risk per trade = Entry Price - Stop Loss
Position size = (Capital * Risk %) / Risk per trade
Recommended risk: 1-2% per trade
💡 Best Practices
Market Conditions:
Works best in trending markets
Excellent for volatile pairs (crypto, forex majors)
Avoid during low volume/consolidation
Timeframe Selection:
Lower timeframes (5m-15m): More signals, higher noise
Higher timeframes (1H+): Fewer signals, higher reliability
Sweet spot: 15m-1H for most traders
Momentum Engine Selection:
Quantum: Best for volatile markets (crypto, indices)
MACD: Best for trending markets (forex, stocks)
Moving Average: Best for smooth trends (commodities)
📊 Dashboard Interpretation
The trading dashboard shows:
Current Capital: Your running balance
Position: Current trade direction
Entry/Stop: Your risk levels
Statistics: Win rate and performance
ROI: Overall return on investment
⚠️ Important Notes
Always Active: This system is always in a position (long or short)
No Neutral: You're either long or short, never flat
Automatic Reversal: Positions flip at each signal
Stop Loss: Fixed at entry ZigZag level (doesn't trail)
🎮 Quick Start Guide
Beginners: Start with default settings on 1H timeframe
Test First: Use paper trading to understand the signals
Small Size: Begin with 1% risk per trade
Track Results: Monitor the dashboard statistics
Adjust: Fine-tune momentum settings based on results
🔧 Customization Tips
Color Signals: Enable to see momentum strength
Dashboard Position: Move to preferred screen location
Visual Settings: Adjust colors for your theme
Alerts: Set up for automated notifications
This indicator is ideal for traders who prefer an always-in-market approach with clear entry/exit rules and automated position management. The key to success is choosing the right momentum engine for your market and maintaining disciplined risk management.

RSI MSB | QuantMAC📊 RSI MSB | QuantMAC
🎯 Overview
The RSI MSB (Momentum Shifting Bands) represents a groundbreaking fusion of traditional RSI analysis with advanced momentum dynamics and adaptive volatility bands. This sophisticated indicator combines RSI smoothing , relative momentum calculations , and dynamic standard deviation bands to create a powerful oscillator that automatically adapts to changing market conditions, providing superior signal accuracy across different trading environments.
🔧 Key Features
Hybrid RSI-Momentum Engine : Proprietary combination of smoothed RSI with relative momentum analysis
Dynamic Adaptive Bands : Self-adjusting volatility bands that respond to indicator strength
Dual Trading Modes : Flexible Long/Short or Long/Cash strategies for different risk preferences
Advanced Performance Analytics : Comprehensive metrics including Sharpe, Sortino, and Omega ratios
Smart Visual System : Dynamic color coding with 9 professional color schemes
Precision Backtesting : Date range filtering with detailed historical performance analysis
Real-time Signal Generation : Clear entry/exit signals with customizable threshold sensitivity
Position Sizing Intelligence : Half Kelly criterion for optimal risk management
📈 How The MSB Technology Work
The Momentum Shifting Bands technology is built on a revolutionary approach that combines multiple signal sources into one cohesive system:
RSI Foundation : 💪
Calculate traditional RSI using customizable length and source
Apply exponential smoothing to reduce noise and false signals
Normalize values for consistent performance across different timeframes
Momentum Analysis Engine : ⚡
Compute fast and slow momentum using rate of change calculations
Calculate relative momentum by comparing fast vs slow momentum
Normalize momentum values to 0-100 scale for consistency
Apply smoothing to create stable momentum readings
Dynamic Combination : 🔄
The genius of MSB lies in its weighted combination of RSI and momentum signals. The momentum weight parameter allows traders to adjust the balance between RSI stability and momentum responsiveness, creating a hybrid indicator that captures both trend continuation and reversal signals.
Adaptive Band System : 🎯
Calculate dynamic standard deviation multiplier based on indicator strength
Generate upper and lower bands that expand during high volatility periods
Create normalized oscillator that scales between band boundaries
Provide visual reference for overbought/oversold conditions
⚙️ Comprehensive Parameter Control
RSI Settings : 📊
RSI Length: Controls the period for RSI calculation (default: 21)
Source: Price input selection (close, open, high, low, etc.)
RSI Smoothing: Reduces noise in RSI calculations (default: 20)
Momentum Settings : 🔥
Fast Momentum Length: Short-term momentum period (default: 19)
Slow Momentum Length: Long-term momentum period (default: 21)
Momentum Weight: Balance between RSI and momentum (default: 0.6)
Oscillator Settings : ⚙️
Base Length: Foundation moving average for band calculations (default: 40)
Standard Deviation Length: Period for volatility measurement (default: 53)
SD Multiplier: Base band width adjustment (default: 0.7)
Oscillator Multiplier: Scaling factor for oscillator values (default: 100)
Signal Thresholds : 🎯
Long Threshold: Bullish signal trigger level (default: 93)
Short Threshold: Bearish signal trigger level (default: 53)
🎨 Advanced Visual System
Main Chart Elements : 📈
Dynamic Shifting Bands: Upper and lower bands with intelligent transparency
Adaptive Fill Zone: Color-coded area between bands showing current market state
Basis Line: Moving average foundation displayed as subtle reference points
Smart Bar Coloring: Candles change color based on oscillator state for instant visual feedback
Oscillator Pane : 📊
Normalized MSB Oscillator: Main signal line with dynamic coloring based on market state
Threshold Lines: Horizontal reference lines for entry/exit levels
Zero Line: Central reference for oscillator neutrality
Color State Indication: Line colors change based on bullish/bearish conditions
📊 Professional Performance Metrics
The built-in analytics suite provides institutional-grade performance measurement:
Net Profit % : Total strategy return percentage
Maximum Drawdown % : Worst peak-to-trough decline
Win Rate % : Percentage of profitable trades
Profit Factor : Ratio of gross profits to gross losses
Sharpe Ratio : Risk-adjusted return measurement
Sortino Ratio : Downside-focused risk adjustment
Omega Ratio : Probability-weighted performance ratio
Half Kelly % : Optimal position sizing recommendation
Total Trades : Complete transaction count
🎯 Strategic Trading Applications
Long/Short Mode : ⚡
Maximizes profit potential by capturing both upward and downward price movements. The MSB technology helps identify when momentum is building in either direction, allowing for optimal position switches between long and short positions.
Long/Cash Mode : 🛡️
Conservative approach ideal for retirement accounts or risk-averse traders. The indicator's adaptive nature helps identify the best times to be invested versus sitting in cash, protecting capital during adverse market conditions.
🚀 Unique Advantages
Traditional Indicators vs RSI MSB :
Static vs Dynamic: While most indicators use fixed parameters, MSB bands adapt based on indicator strength
Single Signal vs Multi-Signal: Combines RSI reliability with momentum responsiveness
Lagging vs Balanced: Optimized balance between signal speed and accuracy
Simple vs Intelligent: Advanced momentum analysis provides superior market insight
💡 Professional Setup Guide
For Day Trading (Short-term) : 📱
RSI Length: 14-18
RSI Smoothing: 12-15
Momentum Weight: 0.7-0.8
Thresholds: Long 90, Short 55
For Swing Trading (Medium-term) : 📊
RSI Length: 21-25 (default range)
RSI Smoothing: 18-22
Momentum Weight: 0.5-0.7
Thresholds: Long 93, Short 53 (defaults)
For Position Trading (Long-term) : 📈
RSI Length: 25-30
RSI Smoothing: 25-30
Momentum Weight: 0.4-0.6
Thresholds: Long 95, Short 50
🧠 Advanced Trading Techniques
MSB Divergence Analysis : 🔍
Watch for divergences between price action and MSB readings. When price makes new highs/lows but the oscillator doesn't confirm, it often signals upcoming reversals or momentum shifts.
Band Width Interpretation : 📏
Expanding Bands: Increasing volatility, expect larger price moves
Contracting Bands: Decreasing volatility, prepare for potential breakouts
Band Touches: Price touching outer bands often signals reversal opportunities
Multi-Timeframe Analysis : ⏰
Use MSB on higher timeframes for trend direction and lower timeframes for precise entry timing. The momentum component makes it particularly effective for timing entries within established trends.
⚠️ Important Risk Disclaimers
Critical Risk Factors :
Market Conditions: No indicator performs equally well in all market environments
Backtesting Limitations: Historical performance may not reflect future market behavior
Parameter Sensitivity: Different settings may produce significantly different results
Volatility Risk: Momentum-based indicators can be sensitive to extreme market conditions
Capital Risk: Always use appropriate position sizing and stop-loss protection
📚 Educational Benefits
This indicator provides exceptional learning opportunities for understanding:
Advanced RSI analysis and momentum integration techniques
Adaptive indicator design and dynamic band calculations
The relationship between momentum shifts and price movements
Professional risk management using Kelly Criterion principles
Modern oscillator interpretation and multi-signal analysis
🔍 Market Applications
The RSI MSB works effectively across various markets:
Forex : Excellent for currency pair momentum analysis
Stocks : Individual equity and index trading with momentum confirmation
Commodities : Adaptive to commodity market momentum cycles
Cryptocurrencies : Handles extreme volatility with momentum filtering
Futures : Professional derivatives trading applications
🔧 Technical Innovation
The RSI MSB represents advanced research into multi-signal technical analysis. The proprietary momentum-RSI combination has been optimized for:
Computational Efficiency : Fast calculation even on high-frequency data
Signal Clarity : Clear, actionable trading signals with reduced noise
Market Adaptability : Automatic adjustment to changing momentum conditions
Parameter Flexibility : Wide range of customization options for different trading styles
🔔 Updates and Evolution
The RSI MSB | QuantMAC continues to evolve with regular updates incorporating the latest research in momentum-based technical analysis. The comprehensive parameter set allows for extensive customization and optimization across different market conditions.
Past Performance Disclaimer : Past performance results shown by this indicator are hypothetical and not indicative of future results. Market conditions change continuously, and no trading system or methodology can guarantee profits or prevent losses. Historical backtesting may not reflect actual trading conditions including market liquidity, slippage, and fees that would affect real trading results.
Master The Markets With Multi-Signal Intelligence! 🎯📈
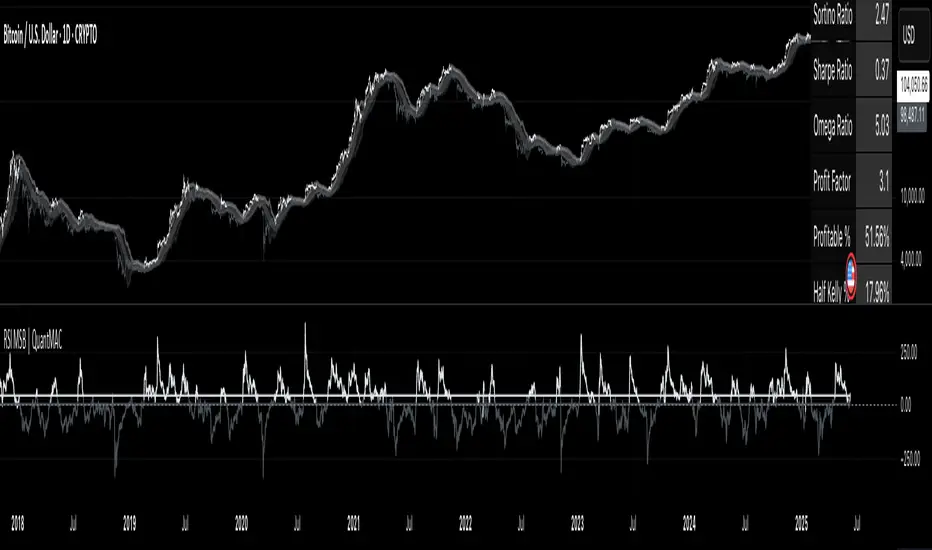
TitanGrid L/S SuperEngineTitanGrid L/S SuperEngine
Experimental Trend-Aligned Grid Signal Engine for Long & Short Execution
🔹 Overview
TitanGrid is an advanced, real-time signal engine built around a tactical grid structure.
It manages Long and Short trades using trend-aligned entries, layered scaling, and partial exits.
Unlike traditional strategy() -based scripts, TitanGrid runs as an indicator() , but includes its own full internal simulation engine.
This allows it to track capital, equity, PnL, risk exposure, and trade performance bar-by-bar — effectively simulating a custom backtest, while remaining compatible with real-time alert-based execution systems.
The concept was born from the fusion of two prior systems:
Assassin’s Grid (grid-based execution and structure) + Super 8 (trend-filtering, smart capital logic), both developed under the AssassinsGrid framework.
🔹 Disclaimer
This is an experimental tool intended for research, testing, and educational use.
It does not provide guaranteed outcomes and should not be interpreted as financial advice.
Use with demo or simulated accounts before considering live deployment.
🔹 Execution Logic
Trend direction is filtered through a custom SuperTrend engine. Once confirmed:
• Long entries trigger on pullbacks, exiting progressively as price moves up
• Short entries trigger on rallies, exiting as price declines
Grid levels are spaced by configurable percentage width, and entries scale dynamically.
🔹 Stop Loss Mechanism
TitanGrid uses a dual-layer stop system:
• A static stop per entry, placed at a fixed percentage distance matching the grid width
• A trend reversal exit that closes the entire position if price crosses the SuperTrend in the opposite direction
Stops are triggered once per cycle, ensuring predictable and capital-aware behavior.
🔹 Key Features
• Dual-side grid logic (Long-only, Short-only, or Both)
• SuperTrend filtering to enforce directional bias
• Adjustable grid spacing, scaling, and sizing
• Static and dynamic stop-loss logic
• Partial exits and reset conditions
• Webhook-ready alerts (browser-based automation compatible)
• Internal simulation of equity, PnL, fees, and liquidation levels
• Real-time dashboard for full transparency
🔹 Best Use Cases
TitanGrid performs best in structured or mean-reverting environments.
It is especially well-suited to assets with the behavioral profile of ETH — reactive, trend-intraday, and prone to clean pullback formations.
While adaptable to multiple timeframes, it shows strongest performance on the 15-minute chart , offering a balance of signal frequency and directional clarity.
🔹 License
Published under the Mozilla Public License 2.0 .
You are free to study, adapt, and extend this script.
🔹 Panel Reference
The real-time dashboard displays performance metrics, capital state, and position behavior:
• Asset Type – Automatically detects the instrument class (e.g., Crypto, Stock, Forex) from symbol metadata
• Equity – Total simulated capital: realized PnL + floating PnL + remaining cash
• Available Cash – Capital not currently allocated to any position
• Used Margin – Capital locked in open trades, based on position size and leverage
• Net Profit – Realized gain/loss after commissions and fees
• Raw Net Profit – Gross result before trading costs
• Floating PnL – Unrealized profit or loss from active positions
• ROI – Return on initial capital, including realized and floating PnL. Leverage directly impacts this metric, amplifying both gains and losses relative to account size.
• Long/Short Size & Avg Price – Open position sizes and volume-weighted average entry prices
• Leverage & Liquidation – Simulated effective leverage and projected liquidation level
• Hold – Best-performing hold side (Long or Short) over the session
• Hold Efficiency – Performance efficiency during holding phases, relative to capital used
• Profit Factor – Ratio of gross profits to gross losses (realized)
• Payoff Ratio – Average profit per win / average loss per loss
• Win Rate – Percent of profitable closes (including partial exits)
• Expectancy – Net average result per closed trade
• Max Drawdown – Largest recorded drop in equity during the session
• Commission Paid – Simulated trading costs: maker, taker, funding
• Long / Short Trades – Count of entry signals per side
• Time Trading – Number of bars spent in active positions
• Volume / Month – Extrapolated 30-day trading volume estimate
• Min Capital – Lowest equity level recorded during the session
🔹 Reference Ranges by Strategy Type
Use the following metrics as reference depending on the trading style:
Grid / Mean Reversion
• Profit Factor: 1.2 – 2.0
• Payoff Ratio: 0.5 – 1.2
• Win Rate: 50% – 70% (based on partial exits)
• Expectancy: 0.05% – 0.25%
• Drawdown: Moderate to high
• Commission Impact: High
Trend-Following
• Profit Factor: 1.5 – 3.0
• Payoff Ratio: 1.5 – 3.5
• Win Rate: 30% – 50%
• Expectancy: 0.3% – 1.0%
• Drawdown: Low to moderate
Scalping / High-Frequency
• Profit Factor: 1.1 – 1.6
• Payoff Ratio: 0.3 – 0.8
• Win Rate: 80% – 95%
• Expectancy: 0.01% – 0.05%
• Volume / Month: Very high
Breakout Strategies
• Profit Factor: 1.4 – 2.2
• Payoff Ratio: 1.2 – 2.0
• Win Rate: 35% – 60%
• Expectancy: 0.2% – 0.6%
• Drawdown: Can be sharp after failed breakouts
🔹 Note on Performance Simulation
TitanGrid includes internal accounting of fees, slippage, and funding costs.
While its logic is designed for precision and capital efficiency, performance is naturally affected by exchange commissions.
In frictionless environments (e.g., zero-fee simulation), its high-frequency logic could — in theory — extract substantial micro-edges from the market.
However, real-world conditions introduce limits, and all results should be interpreted accordingly.

Pucci Trend EMA-SMA Crossover with TolerancePucci Trend EMA-SMA Crossover with Tolerance
This indicator helps identify market trends and generates trading signals based on the crossover between an Exponential Moving Average (EMA) and a Simple Moving Average (SMA) with an adjustable tolerance threshold. The signals work as follows:
Buy Signal (B) -> Triggers when the EMA crosses above the SMA, exceeding a user-defined tolerance (in basis points). Optionally, a price filter can require the high or low to be below the EMA for confirmation.
Sell Signal (S) -> Triggers when the SMA crosses above the EMA, exceeding the tolerance. The optional price filter may require the high or low to be above the EMA.
The tolerance helps reduce false signals by requiring a minimum distance between the moving averages before confirming a crossover. The price filter adds an extra confirmation layer by checking if price action respects the EMA level.
Important Notes:
1º No profitability guarantee: This tool is for analysis only and may generate losses.
2º "As Is" disclaimer: Provided without warranties or responsibility for trading outcomes.
3º Use Stop Loss: Users must determine their own risk management.
4º Parameter adjustment needed: Optimal MA periods and tolerance vary by timeframe.
5º Filter impact varies: Enabling/disabling the price filter may improve or worsen performance.

Position Size Calculator ProPosition Size Calculator Pro is a professional risk management tool that helps traders calculate optimal position sizes based on their account size, risk tolerance, and trade setup. The indicator provides real-time calculations with interactive price lines and a comprehensive horizontal table display for quick decision-making.
✨ Key Features
Multiple Entry Modes: Current price, manual price, or interactive buy line
Flexible Stop Loss Options: LOD (Low of Day), manual price, percentage-based, or interactive stop line
Advanced Risk Calculations: Includes brokerage impact and adjusted risk metrics
Interactive Price Lines: Visual buy and stop loss lines with real-time updates
Horizontal Table Display: Compact 2-row table showing all critical metrics
Smart Color Coding: Visual feedback based on risk and allocation levels
Professional UI: Clean, modern interface with intuitive controls
Indian Market Ready: Optimized for Indian trading with ₹ currency display
🔧 Input Parameters
💰 Risk Management
Account Size (₹): Total trading capital (default: 10,00,000)
Risk per Trade (%): Maximum risk percentage per trade (default: 0.25%, range: 0.01-5%)
Brokerage (%): Combined buy and sell brokerage (default: 0.12%, range: 0-2%)
📊 Entry & Stop Loss
Entry Mode: Choose between Current Price, Manual Price, or Buy Line
Manual Entry Price: Custom entry price (when Manual Price selected)
Stop Loss Mode: LOD SL, Manual SL, Manual SL %, or SL Line
Manual Stop Loss: Custom stop loss price
SL Percentage (%): Percentage below entry for stop loss (default: 2%, range: 0.1-20%)
📈 Interactive Lines
Buy Line Price: Interactive buy line (click on chart to set)
Stop Loss Line: Interactive stop loss line (click on chart to set)
Show Lines: Toggle line visibility
🎨 Display Options
Show Table: Toggle calculation table visibility
Table Size: Adjustable from tiny to huge
Position: Top, middle, or bottom placement
Alignment: Left, center, or right alignment
Update Frequency: Real-time or bar close
📊 Calculation Methodology
Position Size Formula
Position Size = (Account Size × Risk %) ÷ (Adjusted Risk per Share)
Risk Calculations
Base Risk: |(Entry Price - Stop Loss)| ÷ Entry Price × 100
Adjusted Risk: Includes brokerage impact on both entry and exit
Risk Amount: Position Size × Base Risk per Share
Brokerage Impact
Entry with Brokerage: Entry Price × (1 + Brokerage% ÷ 200)
Exit with Brokerage: Stop Loss × (1 - Brokerage% ÷ 200)
🎮 How to Use
Basic Setup
Set your account size and risk percentage
Configure brokerage percentage according to your broker
Choose entry and stop loss modes
The calculator automatically updates position size
Interactive Lines Setup
⚠️ IMPORTANT: After selecting line modes, refresh the chart to ensure lines are visible
For Buy Line:
Select Entry Mode: "Buy Line"
Set "Buy Line Price" or leave 0 for current price
Refresh chart to see the green buy line
Adjust price by clicking on chart or changing input value
For Stop Loss Line:
Select Stop Loss Mode: "SL Line"
Set "Stop Loss Line" or leave 0 for current low
Refresh chart to see the red stop loss line
Adjust price by clicking on chart or changing input value
Table Information
The horizontal calculation table displays:
SL: Stop Loss price
Entry: Entry price level
Risk%: Adjusted risk percentage (with brokerage)
SL%: Base stop loss risk percentage
Cap%: Account risk percentage setting
Qty: Recommended quantity to buy
Investment: Total investment amount required
Alloc%: Portfolio allocation percentage
Risk ₹: Total risk amount in Rupees
Color Coding Guide
Green Values: Positive/profitable metrics
Red Values: Risk/loss related metrics
Orange Values: Warning levels (high risk/allocation)
Blue Headers: Table headers
Bright Green Line: Buy line with target icon
Bright Red Line: Stop loss line with shield icon
🚨 Alert Conditions
Built-in Alerts
High Allocation Warning: Triggers when position exceeds 20% of account
High Risk Warning: Triggers when stop loss risk exceeds 5%
Invalid Position: Triggers when calculation parameters are invalid
Setting Up Alerts
Click "Add Alert" on the chart
Select "Position Size Calculator Pro"
Choose desired alert condition
Configure notification settings
⚠️ Important Notes & Troubleshooting
Interactive Lines
Lines not visible? Refresh the chart after selecting line modes
Lines moving together? Each line operates independently - check you're adjusting the correct price input
Default behavior: Buy line starts at current price, Stop line starts at current low
Price = 0: Uses automatic defaults (current price/low)
Risk Disclaimers
This tool is for educational purposes only
Always verify calculations independently
Consider market conditions, gaps, and liquidity
Past performance doesn't guarantee future results
Technical Limitations
Interactive lines require chart refresh for initial visibility
Calculations update based on selected frequency
Maximum 10 lines and 10 labels on chart simultaneously
Best Practices
Always set realistic account size
Never risk more than you can afford to lose
Consider slippage and market gaps in volatile conditions
Review calculations before placing actual trades
Use appropriate position sizing for your trading strategy
Refresh chart when switching between line modes
🛠️ Technical Requirements
TradingView account (any tier)
Pine Script v6 compatibility
Modern browser for interactive features
Real-time or delayed data feed
📈 Performance Features
The script includes several optimizations:
Efficient calculation updates based on frequency setting
Smart memory management for line drawings
Conditional table updates to reduce resource usage
Optimized number formatting for better readability
🎯 Use Cases
Day Trading
Quick position sizing for intraday setups
Real-time risk assessment
Interactive line placement for entry/exit planning
Swing Trading
Portfolio allocation management
Multi-timeframe risk analysis
Position size optimization for longer holds
Investment Planning
Capital allocation for stock purchases
Risk-based position sizing
Long-term portfolio management
Disclaimer: This tool is for educational and informational purposes only. Trading involves substantial risk of loss and is not suitable for all investors. Always conduct your own research and consider seeking advice from qualified financial professionals.

Opening Range BreakoutOPENING RANGE BREAKOUT (ORB) INDICATOR
DESCRIPTION
The Opening Range Breakout indicator is a powerful technical analysis tool designed specifically for US equity markets. It identifies and visualizes the opening range established during the first configurable minutes of each trading day (starting at 9:30 AM EST), then provides clear signals when price breaks out of or rejects from these key levels.
This indicator combines multiple timeframe analysis capabilities with precise breakout detection to help traders identify high-probability trading opportunities based on opening range dynamics.
KEY FEATURES
Configurable Opening Range:
• Set opening range duration from 5 minutes to 4 hours
• Automatically adjusts calculations based on your chart timeframe
• Works on any timeframe (1m, 5m, 15m, 1h, etc.)
Multi-Day Range Display:
• Shows up to 50 days of historical opening ranges
• Each day's range properly contained within its trading session
• Range lines extend from market open (9:30 AM) to market close (4:00 PM EST)
Clear Signal System:
• Green arrows (⬆): Bullish breakouts and rejections
• Red arrows (⬇): Bearish breakouts and rejections
• Two signal types: Close breakouts (normal size) and wick rejections (small size)
Visual Range Highlighting:
• Opening range period highlighted with colored box
• Customizable colors for range fill, borders, and midline
• Clean, professional appearance with configurable line styles
SIGNAL TYPES
Bullish Signals (Green ⬆):
1. Close Breakout Above Range (Normal Size): 5-minute candle closes above the opening range high
2. Wick Rejection from Below (Small Size): Price wicks below the opening range low but closes back inside the range
Bearish Signals (Red ⬇):
1. Close Breakout Below Range (Normal Size): 5-minute candle closes below the opening range low
2. Wick Rejection from Above (Small Size): Price wicks above the opening range high but closes back inside the range
CONFIGURATION OPTIONS
Range Settings:
• Opening Range Minutes: Duration of opening range (default: 30 minutes)
• Lookback Days: Number of historical days to display (default: 20 days)
Visual Customization:
• Range Color: Fill color for the opening range area
• Border Color: Color for range high/low lines
• Midline Color: Color for the range midpoint line
• Opening Range Highlight Color: Color for the opening period box
• Line Style: Solid, Dashed, or Dotted lines
• Line Width: 1-4 pixel width options
Display Options:
• Show Midline: Toggle midpoint line display
• Show Range Labels: Toggle price level labels
• Arrow Distance: Adjust arrow positioning (0.1-2.0%)
USAGE GUIDE
Basic Setup:
1. Add the indicator to your chart (works best on 5-minute timeframe)
2. Configure your preferred opening range duration (15m, 30m, or 60m are popular choices)
3. Adjust lookback days based on your analysis needs
4. Customize colors and line styles to match your chart theme
Trading Applications:
Breakout Trading:
• Long Entry: Green arrow (close breakout above range) + confirmation
• Short Entry: Red arrow (close breakout below range) + confirmation
• Stop Loss: Opposite side of the opening range
• Target: 1-2x the range size or key support/resistance levels
Range Rejection Trading:
• Reversal Setups: Small arrows indicate failed breakouts
• Mean Reversion: Trade back toward range midline
• Support/Resistance: Use range levels as key price zones
Multi-Day Analysis:
• Identify recurring support/resistance levels
• Analyze range expansion/contraction patterns
• Compare current day's activity to recent history
BEST PRACTICES
1. Timeframe Selection: 5-minute charts provide optimal signal clarity
2. Range Duration: 30-minute opening range is most commonly used, but adjust based on:
- Market volatility
- Stock characteristics
- Trading style preference
3. Confirmation: Use additional indicators or price action for trade confirmation
4. Risk Management: Always use appropriate position sizing and stop losses
MARKET SESSIONS
The indicator is specifically designed for US equity markets:
• Market Open: 9:30 AM EST
• Market Close: 4:00 PM EST
• Opening Range: Calculated from market open
• Range Lines: Extend throughout the trading day only
PERFORMANCE NOTES
• Optimized for real-time trading with minimal lag
• Automatically manages memory by cleaning old ranges
• Efficiently handles multiple timeframes and range calculations
KNOWN ISSUES & WORKAROUNDS
Historical Buffer Error:
Issue: Occasionally, you may encounter an error: "The requested historical offset (XXX) is beyond the historical buffer's limit (770)"
Workaround:
1. Switch to a different timeframe temporarily
2. Switch back to your original timeframe
3. The indicator will reload and function normally
This is a Pine Script limitation related to historical data access and doesn't affect the indicator's core functionality.
COMPATIBILITY
• Pine Script Version: v6
• Chart Types: All chart types supported
• Timeframes: All timeframes (optimized for 1m-1h)
• Markets: Designed for US equity markets during regular trading hours
TIPS FOR MAXIMUM EFFECTIVENESS
1. Combine with Volume: High volume on breakouts increases reliability
2. Market Context: Consider overall market direction and volatility
3. News Awareness: Be cautious around earnings and major announcements
4. Range Quality: Wider ranges often provide better breakout opportunities
5. Time of Day: Early breakouts (first 1-2 hours) often have higher follow-through
This indicator is provided for educational and informational purposes. Always conduct your own analysis and manage risk appropriately.

Bober XM v2.0# ₿ober XM v2.0 Trading Bot Documentation
**Developer's Note**: While our previous Bot 1.3.1 was removed due to guideline violations, this setback only fueled our determination to create something even better. Rising from this challenge, Bober XM 2.0 emerges not just as an update, but as a complete reimagining with multi-timeframe analysis, enhanced filters, and superior adaptability. This adversity pushed us to innovate further and deliver a strategy that's smarter, more agile, and more powerful than ever before. Challenges create opportunity - welcome to Cryptobeat's finest work yet.
## !!!!You need to tune it for your own pair and timeframe and retune it periodicaly!!!!!
## Overview
The ₿ober XM v2.0 is an advanced dual-channel trading bot with multi-timeframe analysis capabilities. It integrates multiple technical indicators, customizable risk management, and advanced order execution via webhook for automated trading. The bot's distinctive feature is its separate channel systems for long and short positions, allowing for asymmetric trade strategies that adapt to different market conditions across multiple timeframes.
### Key Features
- **Multi-Timeframe Analysis**: Analyze price data across multiple timeframes simultaneously
- **Dual Channel System**: Separate parameter sets for long and short positions
- **Advanced Entry Filters**: RSI, Volatility, Volume, Bollinger Bands, and KEMAD filters
- **Machine Learning Moving Average**: Adaptive prediction-based channels
- **Multiple Entry Strategies**: Breakout, Pullback, and Mean Reversion modes
- **Risk Management**: Customizable stop-loss, take-profit, and trailing stop settings
- **Webhook Integration**: Compatible with external trading bots and platforms
### Strategy Components
| Component | Description |
|---------|-------------|
| **Dual Channel Trading** | Uses either Keltner Channels or Machine Learning Moving Average (MLMA) with separate settings for long and short positions |
| **MLMA Implementation** | Machine learning algorithm that predicts future price movements and creates adaptive bands |
| **Pivot Point SuperTrend** | Trend identification and confirmation system based on pivot points |
| **Three Entry Strategies** | Choose between Breakout, Pullback, or Mean Reversion approaches |
| **Advanced Filter System** | Multiple customizable filters with multi-timeframe support to avoid false signals |
| **Custom Exit Logic** | Exits based on OBV crossover of its moving average combined with pivot trend changes |
### Note for Novice Users
This is a fully featured real trading bot and can be tweaked for any ticker — SOL is just an example. It follows this structure:
1. **Indicator** – gives the initial signal
2. **Entry strategy** – decides when to open a trade
3. **Exit strategy** – defines when to close it
4. **Trend confirmation** – ensures the trade follows the market direction
5. **Filters** – cuts out noise and avoids weak setups
6. **Risk management** – controls losses and protects your capital
To tune it for a different pair, you'll need to start from scratch:
1. Select the timeframe (candle size)
2. Turn off all filters and trend entry/exit confirmations
3. Choose a channel type, channel source and entry strategy
4. Adjust risk parameters
5. Tune long and short settings for the channel
6. Fine-tune the Pivot Point Supertrend and Main Exit condition OBV
This will generate a lot of signals and activity on the chart. Your next task is to find the right combination of filters and settings to reduce noise and tune it for profitability.
### Default Strategy values
Default values are tuned for: Symbol BITGET:SOLUSDT.P 5min candle
Filters are off by default: Try to play with it to understand how it works
## Configuration Guide
### General Settings
| Setting | Description | Default Value |
|---------|-------------|---------------|
| **Long Positions** | Enable or disable long trades | Enabled |
| **Short Positions** | Enable or disable short trades | Enabled |
| **Risk/Reward Area** | Visual display of stop-loss and take-profit zones | Enabled |
| **Long Entry Source** | Price data used for long entry signals | hl2 (High+Low/2) |
| **Short Entry Source** | Price data used for short entry signals | hl2 (High+Low/2) |
The bot allows you to trade long positions, short positions, or both simultaneously. Each direction has its own set of parameters, allowing for fine-tuned strategies that recognize the asymmetric nature of market movements.
### Multi-Timeframe Settings
1. **Enable Multi-Timeframe Analysis**: Toggle 'Enable Multi-Timeframe Analysis' in the Multi-Timeframe Settings section
2. **Configure Timeframes**: Set appropriate higher timeframes based on your trading style:
- Timeframe 1: Default is now 15 minutes (intraday confirmation)
- Timeframe 2: Default is 4 hours (trend direction)
3. **Select Sources per Indicator**: For each indicator (RSI, KEMAD, Volume, etc.), choose:
- The desired timeframe (current, mtf1, or mtf2)
- The appropriate price type (open, high, low, close, hl2, hlc3, ohlc4)
### Entry Strategies
- **Breakout**: Enter when price breaks above/below the channel
- **Pullback**: Enter when price pulls back to the channel
- **Mean Reversion**: Enter when price is extended from the channel
You can enable different strategies for long and short positions.
### Core Components
### Risk Management
- **Position Size**: Control risk with percentage-based position sizing
- **Stop Loss Options**:
- Fixed: Set a specific price or percentage from entry
- ATR-based: Dynamic stop-loss based on market volatility
- Swing: Uses recent swing high/low points
- **Take Profit**: Multiple targets with percentage allocation
- **Trailing Stop**: Dynamic stop that follows price movement
## Advanced Usage Strategies
### Moving Average Type Selection Guide
- **SMA**: More stable in choppy markets, good for higher timeframes
- **EMA/WMA**: More responsive to recent price changes, better for entry signals
- **VWMA**: Adds volume weighting for stronger trends, use with Volume filter
- **HMA**: Balance between responsiveness and noise reduction, good for volatile markets
### Multi-Timeframe Strategy Approaches
- **Trend Confirmation**: Use higher timeframe RSI (mtf2) for overall trend, current timeframe for entries
- **Entry Precision**: Use KEMAD on current timeframe with volume filter on mtf1
- **False Signal Reduction**: Apply RSI filter on mtf1 with strict KEMAD settings
### Market Condition Optimization
| Market Condition | Recommended Settings |
|------------------|----------------------|
| **Trending** | Use Breakout strategy with KEMAD filter on higher timeframe |
| **Ranging** | Use Mean Reversion with strict RSI filter (mtf1) |
| **Volatile** | Increase ATR multipliers, use HMA for moving averages |
| **Low Volatility** | Decrease noise parameters, use pullback strategy |
## Webhook Integration
The strategy features a professional webhook system that allows direct connectivity to your exchange or trading platform of choice through third-party services like 3commas, Alertatron, or Autoview.
The webhook payload includes all necessary parameters for automated execution:
- Entry price and direction
- Stop loss and take profit levels
- Position size
- Custom identifier for webhook routing
## Performance Optimization Tips
1. **Start with Defaults**: Begin with the default settings for your timeframe before customizing
2. **Adjust One Component at a Time**: Make incremental changes and test the impact
3. **Match MA Types to Market Conditions**: Use appropriate moving average types based on the Market Condition Optimization table
4. **Timeframe Synergy**: Create logical relationships between timeframes (e.g., 5min chart with 15min and 4h higher timeframes)
5. **Periodic Retuning**: Markets evolve - regularly review and adjust parameters
## Common Setups
### Crypto Trend-Following
- MLMA with EMA or HMA
- Higher RSI thresholds (75/25)
- KEMAD filter on mtf1
- Breakout entry strategy
### Stock Swing Trading
- MLMA with SMA for stability
- Volume filter with higher threshold
- KEMAD with increased filter order
- Pullback entry strategy
### Forex Scalping
- MLMA with WMA and lower noise parameter
- RSI filter on current timeframe
- Use highest timeframe for trend direction only
- Mean Reversion strategy
## Webhook Configuration
- **Benefits**:
- Automated trade execution without manual intervention
- Immediate response to market conditions
- Consistent execution of your strategy
- **Implementation Notes**:
- Requires proper webhook configuration on your exchange or platform
- Test thoroughly with small position sizes before full deployment
- Consider latency between signal generation and execution
### Backtesting Period
Define a specific historical period to evaluate the bot's performance:
| Setting | Description | Default Value |
|---------|-------------|---------------|
| **Start Date** | Beginning of backtest period | January 1, 2025 |
| **End Date** | End of backtest period | December 31, 2026 |
- **Best Practice**: Test across different market conditions (bull markets, bear markets, sideways markets)
- **Limitation**: Past performance doesn't guarantee future results
## Entry and Exit Strategies
### Dual-Channel System
A key innovation of the Bober XM is its dual-channel approach:
- **Independent Parameters**: Each trade direction has its own channel settings
- **Asymmetric Trading**: Recognizes that markets often behave differently in uptrends versus downtrends
- **Optimized Performance**: Fine-tune settings for both bullish and bearish conditions
This approach allows the bot to adapt to the natural asymmetry of markets, where uptrends often develop gradually while downtrends can be sharp and sudden.
### Channel Types
#### 1. Keltner Channels
Traditional volatility-based channels using EMA and ATR:
| Setting | Long Default | Short Default |
|---------|--------------|---------------|
| **EMA Length** | 37 | 20 |
| **ATR Length** | 13 | 17 |
| **Multiplier** | 1.4 | 1.9 |
| **Source** | low | high |
- **Strengths**:
- Reliable in trending markets
- Less prone to whipsaws than Bollinger Bands
- Clear visual representation of volatility
- **Weaknesses**:
- Can lag during rapid market changes
- Less effective in choppy, non-trending markets
#### 2. Machine Learning Moving Average (MLMA)
Advanced predictive model using kernel regression (RBF kernel):
| Setting | Description | Options |
|---------|-------------|--------|
| **Source MA** | Price data used for MA calculations | Any price source (low/high/close/etc.) |
| **Moving Average Type** | Type of MA algorithm for calculations | SMA, EMA, WMA, VWMA, RMA, HMA |
| **Trend Source** | Price data used for trend determination | Any price source (close default) |
| **Window Size** | Historical window for MLMA calculations | 5+ (default: 16) |
| **Forecast Length** | Number of bars to forecast ahead | 1+ (default: 3) |
| **Noise Parameter** | Controls smoothness of prediction | 0.01+ (default: ~0.43) |
| **Band Multiplier** | Multiplier for channel width | 0.1+ (default: 0.5-0.6) |
- **Strengths**:
- Predictive rather than reactive
- Adapts quickly to changing market conditions
- Better at identifying trend reversals early
- **Weaknesses**:
- More computationally intensive
- Requires careful parameter tuning
- Can be sensitive to input data quality
### Entry Strategies
| Strategy | Description | Ideal Market Conditions |
|----------|-------------|-------------------------|
| **Breakout** | Enters when price breaks through channel bands, indicating strong momentum | High volatility, emerging trends |
| **Pullback** | Enters when price retraces to the middle band after testing extremes | Established trends with regular pullbacks |
| **Mean Reversion** | Enters at channel extremes, betting on a return to the mean | Range-bound or oscillating markets |
#### Breakout Strategy (Default)
- **Implementation**: Enters long when price crosses above the upper band, short when price crosses below the lower band
- **Strengths**: Captures strong momentum moves, performs well in trending markets
- **Weaknesses**: Can lead to late entries, higher risk of false breakouts
- **Optimization Tips**:
- Increase channel multiplier for fewer but more reliable signals
- Combine with volume confirmation for better accuracy
#### Pullback Strategy
- **Implementation**: Enters long when price pulls back to middle band during uptrend, short during downtrend pullbacks
- **Strengths**: Better entry prices, lower risk, higher probability setups
- **Weaknesses**: Misses some strong moves, requires clear trend identification
- **Optimization Tips**:
- Use with trend filters to confirm overall direction
- Adjust middle band calculation for market volatility
#### Mean Reversion Strategy
- **Implementation**: Enters long at lower band, short at upper band, expecting price to revert to the mean
- **Strengths**: Excellent entry prices, works well in ranging markets
- **Weaknesses**: Dangerous in strong trends, can lead to fighting the trend
- **Optimization Tips**:
- Implement strong trend filters to avoid counter-trend trades
- Use smaller position sizes due to higher risk nature
### Confirmation Indicators
#### Pivot Point SuperTrend
Combines pivot points with ATR-based SuperTrend for trend confirmation:
| Setting | Default Value |
|---------|---------------|
| **Pivot Period** | 25 |
| **ATR Factor** | 2.2 |
| **ATR Period** | 41 |
- **Function**: Identifies significant market turning points and confirms trend direction
- **Implementation**: Requires price to respect the SuperTrend line for trade confirmation
#### Weighted Moving Average (WMA)
Provides additional confirmation layer for entries:
| Setting | Default Value |
|---------|---------------|
| **Period** | 15 |
| **Source** | ohlc4 (average of Open, High, Low, Close) |
- **Function**: Confirms trend direction and filters out low-quality signals
- **Implementation**: Price must be above WMA for longs, below for shorts
### Exit Strategies
#### On-Balance Volume (OBV) Based Exits
Uses volume flow to identify potential reversals:
| Setting | Default Value |
|---------|---------------|
| **Source** | ohlc4 |
| **MA Type** | HMA (Options: SMA, EMA, WMA, RMA, VWMA, HMA) |
| **Period** | 22 |
- **Function**: Identifies divergences between price and volume to exit before reversals
- **Implementation**: Exits when OBV crosses its moving average in the opposite direction
- **Customizable MA Type**: Different MA types provide varying sensitivity to OBV changes:
- **SMA**: Traditional simple average, equal weight to all periods
- **EMA**: More weight to recent data, responds faster to price changes
- **WMA**: Weighted by recency, smoother than EMA
- **RMA**: Similar to EMA but smoother, reduces noise
- **VWMA**: Factors in volume, helpful for OBV confirmation
- **HMA**: Reduces lag while maintaining smoothness (default)
#### ADX Exit Confirmation
Uses Average Directional Index to confirm trend exhaustion:
| Setting | Default Value |
|---------|---------------|
| **ADX Threshold** | 35 |
| **ADX Smoothing** | 60 |
| **DI Length** | 60 |
- **Function**: Confirms trend weakness before exiting positions
- **Implementation**: Requires ADX to drop below threshold or DI lines to cross
## Filter System
### RSI Filter
- **Function**: Controls entries based on momentum conditions
- **Parameters**:
- Period: 15 (default)
- Overbought level: 71
- Oversold level: 23
- Multi-timeframe support: Current, MTF1 (15min), or MTF2 (4h)
- Customizable price source (open, high, low, close, hl2, hlc3, ohlc4)
- **Implementation**: Blocks long entries when RSI > overbought, short entries when RSI < oversold
### Volatility Filter
- **Function**: Prevents trading during excessive market volatility
- **Parameters**:
- Measure: ATR (Average True Range)
- Period: Customizable (default varies by timeframe)
- Threshold: Adjustable multiplier
- Multi-timeframe support
- Customizable price source
- **Implementation**: Blocks trades when current volatility exceeds threshold × average volatility
### Volume Filter
- **Function**: Ensures adequate market liquidity for trades
- **Parameters**:
- Threshold: 0.4× average (default)
- Measurement period: 5 (default)
- Moving average type: Customizable (HMA default)
- Multi-timeframe support
- Customizable price source
- **Implementation**: Requires current volume to exceed threshold × average volume
### Bollinger Bands Filter
- **Function**: Controls entries based on price relative to statistical boundaries
- **Parameters**:
- Period: Customizable
- Standard deviation multiplier: Adjustable
- Moving average type: Customizable
- Multi-timeframe support
- Customizable price source
- **Implementation**: Can require price to be within bands or breaking out of bands depending on strategy
### KEMAD Filter (Kalman EMA Distance)
- **Function**: Advanced trend confirmation using Kalman filter algorithm
- **Parameters**:
- Process Noise: 0.35 (controls smoothness)
- Measurement Noise: 24 (controls reactivity)
- Filter Order: 6 (higher = more smoothing)
- ATR Length: 8 (for bandwidth calculation)
- Upper Multiplier: 2.0 (for long signals)
- Lower Multiplier: 2.7 (for short signals)
- Multi-timeframe support
- Customizable visual indicators
- **Implementation**: Generates signals based on price position relative to Kalman-filtered EMA bands
## Risk Management System
### Position Sizing
Automatically calculates position size based on account equity and risk parameters:
| Setting | Default Value |
|---------|---------------|
| **Risk % of Equity** | 50% |
- **Implementation**:
- Position size = (Account equity × Risk %) ÷ (Entry price × Stop loss distance)
- Adjusts automatically based on volatility and stop placement
- **Best Practices**:
- Start with lower risk percentages (1-2%) until strategy is proven
- Consider reducing risk during high volatility periods
### Stop-Loss Methods
Multiple stop-loss calculation methods with separate configurations for long and short positions:
| Method | Description | Configuration |
|--------|-------------|---------------|
| **ATR-Based** | Dynamic stops based on volatility | ATR Period: 14, Multiplier: 2.0 |
| **Percentage** | Fixed percentage from entry | Long: 1.5%, Short: 1.5% |
| **PIP-Based** | Fixed currency unit distance | 10.0 pips |
- **Implementation Notes**:
- ATR-based stops adapt to changing market volatility
- Percentage stops maintain consistent risk exposure
- PIP-based stops provide precise control in stable markets
### Trailing Stops
Locks in profits by adjusting stop-loss levels as price moves favorably:
| Setting | Default Value |
|---------|---------------|
| **Stop-Loss %** | 1.5% |
| **Activation Threshold** | 2.1% |
| **Trailing Distance** | 1.4% |
- **Implementation**:
- Initial stop remains fixed until profit reaches activation threshold
- Once activated, stop follows price at specified distance
- Locks in profit while allowing room for normal price fluctuations
### Risk-Reward Parameters
Defines the relationship between risk and potential reward:
| Setting | Default Value |
|---------|---------------|
| **Risk-Reward Ratio** | 1.4 |
| **Take Profit %** | 2.4% |
| **Stop-Loss %** | 1.5% |
- **Implementation**:
- Take profit distance = Stop loss distance × Risk-reward ratio
- Higher ratios require fewer winning trades for profitability
- Lower ratios increase win rate but reduce average profit
### Filter Combinations
The strategy allows for simultaneous application of multiple filters:
- **Recommended Combinations**:
- Trending markets: RSI + KEMAD filters
- Ranging markets: Bollinger Bands + Volatility filters
- All markets: Volume filter as minimum requirement
- **Performance Impact**:
- Each additional filter reduces the number of trades
- Quality of remaining trades typically improves
- Optimal combination depends on market conditions and timeframe
### Multi-Timeframe Filter Applications
| Filter Type | Current Timeframe | MTF1 (15min) | MTF2 (4h) |
|-------------|-------------------|-------------|------------|
| RSI | Quick entries/exits | Intraday trend | Overall trend |
| Volume | Immediate liquidity | Sustained support | Market participation |
| Volatility | Entry timing | Short-term risk | Regime changes |
| KEMAD | Precise signals | Trend confirmation | Major reversals |
## Visual Indicators and Chart Analysis
The bot provides comprehensive visual feedback on the chart:
- **Channel Bands**: Keltner or MLMA bands showing potential support/resistance
- **Pivot SuperTrend**: Colored line showing trend direction and potential reversal points
- **Entry/Exit Markers**: Annotations showing actual trade entries and exits
- **Risk/Reward Zones**: Visual representation of stop-loss and take-profit levels
These visual elements allow for:
- Real-time strategy assessment
- Post-trade analysis and optimization
- Educational understanding of the strategy logic
## Implementation Guide
### TradingView Setup
1. Load the script in TradingView Pine Editor
2. Apply to your preferred chart and timeframe
3. Adjust parameters based on your trading preferences
4. Enable alerts for webhook integration
### Webhook Integration
1. Configure webhook URL in TradingView alerts
2. Set up receiving endpoint on your trading platform
3. Define message format matching the bot's output
4. Test with small position sizes before full deployment
### Optimization Process
1. Backtest across different market conditions
2. Identify parameter sensitivity through multiple tests
3. Focus on risk management parameters first
4. Fine-tune entry/exit conditions based on performance metrics
5. Validate with out-of-sample testing
## Performance Considerations
### Strengths
- Adaptability to different market conditions through dual channels
- Multiple layers of confirmation reducing false signals
- Comprehensive risk management protecting capital
- Machine learning integration for predictive edge
### Limitations
- Complex parameter set requiring careful optimization
- Potential over-optimization risk with so many variables
- Computational intensity of MLMA calculations
- Dependency on proper webhook configuration for execution
### Best Practices
- Start with conservative risk settings (1-2% of equity)
- Test thoroughly in demo environment before live trading
- Monitor performance regularly and adjust parameters
- Consider market regime changes when evaluating results
## Conclusion
The ₿ober XM v2.0 represents a significant evolution in trading strategy design, combining traditional technical analysis with machine learning elements and multi-timeframe analysis. The core strength of this system lies in its adaptability and recognition of market asymmetry.
### Market Asymmetry and Adaptive Approach
The strategy acknowledges a fundamental truth about markets: bullish and bearish phases behave differently and should be treated as distinct environments. The dual-channel system with separate parameters for long and short positions directly addresses this asymmetry, allowing for optimized performance regardless of market direction.
### Targeted Backtesting Philosophy
It's counterproductive to run backtests over excessively long periods. Markets evolve continuously, and strategies that worked in previous market regimes may be ineffective in current conditions. Instead:
- Test specific market phases separately (bull markets, bear markets, range-bound periods)
- Regularly re-optimize parameters as market conditions change
- Focus on recent performance with higher weight than historical results
- Test across multiple timeframes to ensure robustness
### Multi-Timeframe Analysis as a Game-Changer
The integration of multi-timeframe analysis fundamentally transforms the strategy's effectiveness:
- **Increased Safety**: Higher timeframe confirmations reduce false signals and improve trade quality
- **Context Awareness**: Decisions made with awareness of larger trends reduce adverse entries
- **Adaptable Precision**: Apply strict filters on lower timeframes while maintaining awareness of broader conditions
- **Reduced Noise**: Higher timeframe data naturally filters market noise that can trigger poor entries
The ₿ober XM v2.0 provides traders with a framework that acknowledges market complexity while offering practical tools to navigate it. With proper setup, realistic expectations, and attention to changing market conditions, it delivers a sophisticated approach to systematic trading that can be continuously refined and optimized.
