Reversal Trading Bot Strategy[BullByte]Overview :
The indicator Reversal Trading Bot Strategy is crafted to capture potential market reversal points by combining momentum, volatility, and trend alignment filters. It uses a blend of technical indicators to identify both bullish and bearish reversal setups, ensuring that multiple market conditions are met before entering a trade.
Core Components :
Technical Indicators Used :
RSI (Relative Strength Index) :
Purpose : Detects divergence conditions by comparing recent lows/highs in price with the RSI.
Parameter : Length of 8.
Bollinger Bands (BB) :
Purpose : Measures volatility and identifies price levels that are statistically extreme.
Parameter : Length of 20 and a 2-standard deviation multiplier.
ADX (Average Directional Index) & DMI (Directional Movement Index) :
Purpose : Quantifies the strength of the trend. The ADX threshold is set at 20, and additional filters check for the alignment of the directional indicators (DI+ and DI–).
ATR (Average True Range) :
Purpose : Provides a volatility measure used to set stop levels and determine risk through trailing stops.
Volume SMA (Simple Moving Average of Volume ):
Purpose : Helps confirm strength by comparing the current volume against a 20-period average, with an optional filter to ensure volume is at least twice the SMA.
User-Defined Toggle Filters :
Volume Filter : Confirms that the volume is above average (or twice the SMA) before taking trades.
ADX Trend Alignment Filter : Checks that the ADX’s directional indicators support the trade direction.
BB Close Confirmation : Optionally refines the entry by requiring price to be beyond the upper or lower Bollinger Band rather than just above or below.
RSI Divergence Exit : Allows the script to close positions if RSI divergence is detected.
BB Mean Reversion Exit : Closes positions if the price reverts to the Bollinger Bands’ middle line.
Risk/Reward Filter : Ensures that the potential reward is at least twice the risk by comparing the distance to the Bollinger Band with the ATR.
Candle Movement Filter : Optional filter to require a minimum percentage move in the candle to confirm momentum.
ADX Trend Exit : Closes positions if the ADX falls below the threshold and the directional indicators reverse.
Entry Conditions :
Bullish Entry :
RSI Divergence : Checks if the current close is lower than a previous low while the RSI is above the previous low, suggesting bullish divergence.
Bollinger Confirmation : Requires that the price is above the lower (or upper if confirmation is toggled) Bollinger Band.
Volume & Trend Filters : Combines volume condition, ADX strength, and an optional candle momentum condition.
Risk/Reward Check : Validates that the trade meets a favorable risk-to-reward ratio.
Bearish Entry :
Uses a mirror logic of the bullish entry by checking for bearish divergence, ensuring the price is below the appropriate Bollinger level, and confirming volume, trend strength, candle pattern, and risk/reward criteria.
Trade Execution and Exit Strateg y:
Trade Execution :
Upon meeting the entry conditions, the strategy initiates a long or short position.
Stop Loss & Trailing Stops :
A stop-loss is dynamically set using the ATR value, and trailing stops are implemented as a percentage of the close price.
Exit Conditions :
Additional exit filters can trigger early closures based on RSI divergence, mean reversion (via the middle Bollinger Band), or a weakening trend as signaled by ADX falling below its threshold.
This multi-layered exit strategy is designed to lock in gains or minimize losses if the market begins to reverse unexpectedly.
How the Strategy Works in Different Market Conditions :
Trending Markets :
The ADX filter ensures that trades are only taken when the trend is strong. When the market is trending, the directional movement indicators help confirm the momentum, making the reversal signal more reliable.
Ranging Markets :
In choppy markets, the Bollinger Bands expand and contract, while the RSI divergence can highlight potential turning points. The optional filters can be adjusted to avoid false signals in low-volume or low-volatility conditions.
Volatility Management :
With ATR-based stop-losses and a risk/reward filter, the strategy adapts to current market volatility, ensuring that risk is managed consistently.
Recommendation on using this Strategy with a Trading Bot :
This strategy is well-suited for high-frequency trading (HFT) due to its ability to quickly identify reversal setups and execute trades dynamically with automated stop-loss and trailing exits. By integrating this script with a TradingView webhook-based bot or an API-driven execution system, traders can automate trade entries and exits in real-time, reducing manual execution delays and capitalizing on fast market movements.
Disclaimer :
This script is provided for educational and informational purposes only. It is not intended as investment advice. Trading involves significant risk, and you should always conduct your own research and analysis before making any trading decisions. The author is not responsible for any losses incurred while using this script.
"stop loss" için komut dosyalarını ara

Profit Trailing BBandsProfit Trailing Trend BBands v4.7.5 with Double Trailing SL
A TradingView Pine Script Strategy
Created by Kevin Bourn and refined with the help of Grok 3 (xAI)
Overview
Welcome to Profit Trailing Trend BBands v4.7.5, a dynamic trading strategy designed to ride trends and lock in profits with a unique double trailing stop-loss mechanism. Built for TradingView’s Pine Script v6, this strategy combines Bollinger Bands for trend detection with a smart trailing system that doubles down on profit protection. Whether you’re trading XRP or any other asset, this tool aims to maximize gains while keeping risk in check—all with a clean, visual interface.
What It Does
Identifies Trends: Uses Bollinger Bands to spot uptrends (price crossing above the upper band) and downtrends (price crossing below the lower band).
Enters Positions: Opens long or short trades based on trend signals, with customizable position sizing and leverage.
Trails Profits: Employs a two-stage trailing stop-loss:
Initial Trailing SL: Acts as a take-profit level, set as a percentage (%) or dollar ($) distance from the entry price.
Tightened Trailing SL: Once the initial profit target is hit, the stop-loss tightens to half the initial distance, locking in gains as the trend continues.
Manages Risk: Includes a margin call feature to exit losing positions before they blow up your account.
Visualizes Everything: Plots Bollinger Bands (blue upper, orange lower) and a red stepped trailing stop-loss line for easy tracking.
Why Built It?
Captures Trends: Bollinger Bands are a proven way to catch momentum, and we tuned them for responsiveness (short length, moderate multiplier).
Secures Profits: Traditional trailing stops often leave money on the table or exit too early. The double trailing SL first takes a chunk of profit, then tightens up to ride the rest of the move.
Stays Flexible: Traders can tweak price sources, stop-loss types (% or $), and position sizing to fit their style.
Looks Good: Clear visuals help you see the strategy in action without cluttering your chart.
Originally refined for XRP, it’s versatile enough for most markets — crypto, forex, stocks, you name it.
How It Works
Core Components
Bollinger Bands:
Calculated using a simple moving average (SMA) and standard deviation.
Default settings: 6-period length, 1.66 multiplier.
Upper Band (blue): SMA + (1.66 × StdDev).
Lower Band (orange): SMA - (1.66 × StdDev).
Trend signals: Price crossing above the upper band triggers a long, below the lower band triggers a short.
Double Trailing Stop-Loss:
Initial SL: Set via "Trailing Stop-Loss Value" (default 6% or $6). Trails the price at this distance and doubles as the first profit target.
Tightened SL: Once price hits the initial SL distance in profit (e.g., +6%), the SL tightens to half (e.g., 3%) and continues trailing, locking in gains.
Visualized as a red stepped line, only visible during active positions.
Position Sizing:
Choose "% of Equity" (default 30%) or "Amount in $" to set trade size.
Leverage (default 10x) amplifies positions, capped by available equity to avoid overexposure.
Margin Call:
Exits positions if drawdown exceeds the "Margin %" (default 10%) to protect your account.
Backtesting Filter:
Starts trading after a user-defined date (default: Jan 1, 2020) for focused historical analysis.
Trade Logic
Long Entry: Price crosses above the upper Bollinger Band → Closes any short position, opens a long.
Short Entry: Price crosses below the lower Bollinger Band → Closes any long position, opens a short.
Exit: Position closes when price hits the trailing stop-loss or triggers a margin call.
How to Use It
Setup
Add to TradingView:
Open TradingView, go to the Pine Editor, paste the script, and click "Add to Chart."
Ensure you’re using Pine Script v6 (the script includes @version=6).
Configure Inputs:
Start Date for Backtesting: Set the date to begin historical testing (default: Jan 1, 2020).
BB Length & Mult: Adjust Bollinger Band sensitivity (default: 6, 1.66).
BB Price Source: Choose the price for BBands (default: Close).
Trend Price Source: Choose the price for trend detection (default: Close).
Trailing Stop-Loss Type: Pick "%" or "$" (default: Trailing SL %).
Trailing Stop-Loss Value: Set the initial SL distance (default: 6).
Margin %: Define the max drawdown before exit (default: 10%).
Order Size Type & Value: Set position size as % of equity (default: 30%) or $ amount.
Leverage: Adjust leverage (default: 10x).
Run It:
Use the Strategy Tester tab to backtest on your chosen asset and timeframe.
Watch the chart for blue/orange Bollinger Bands and the red trailing SL line.
Tips for Traders
Timeframes: Works on any timeframe, but test 1H or 4H for XRP—great balance of signals and noise.
Assets: Optimized for XRP, but tweak slValue and mult for other markets (e.g., tighter SL for low-volatility pairs).
Risk Management: Keep marginPercent low (5-10%) for volatile assets; adjust leverage based on your risk tolerance.
Visuals: The red stepped SL line shows only during trades—zoom in to see its tightening in action.
Visuals on the Chart
Blue Line: Upper Bollinger Band (trend entry for longs).
Orange Line: Lower Bollinger Band (trend entry for shorts).
Red Stepped Line: Trailing Stop-Loss (shifts tighter after the first profit target).
Order Labels: Short tags like "OL" (Open Long), "CS" (Close Short), "LSL" (Long Stop-Loss), etc., mark trades.
Disclaimer
Trading involves risk. This strategy is for educational and experimental use—backtest thoroughly and use at your own risk. Past performance doesn’t guarantee future results. Not financial advice—just a tool from traders, for traders.

Sniper Trade Pro (ES 15-Min) - Topstep Optimized🔹 Overview
Sniper Trade Pro is an advanced algorithmic trading strategy designed specifically for E-mini S&P 500 (ES) Futures on the 15-minute timeframe. This strategy is optimized for Topstep 50K evaluations, incorporating strict risk management to comply with their max $1,000 daily loss limit while maintaining a high probability of success.
It uses a multi-confirmation approach, integrating:
✅ Money Flow Divergence (MFD) → To track liquidity imbalances and institutional accumulation/distribution.
✅ Trend Confirmation (EMA + VWAP) → To identify strong trend direction and avoid choppy markets.
✅ ADX Strength Filter → To ensure entries only occur in trending conditions, avoiding weak setups.
✅ Break-Even & Dynamic Stop-Losses → To reduce drawdowns and protect profits dynamically.
This script automatically generates Buy and Sell signals and provides built-in risk management for automated trading execution through TradingView Webhooks.
🔹 How Does This Strategy Work?
📌 1. Trend Confirmation (EMA + VWAP)
The strategy uses:
✔ 9-EMA & 21-EMA: Fast-moving averages to detect short-term momentum.
✔ VWAP (Volume-Weighted Average Price): Ensures trades align with institutional volume flow.
How it works:
Bullish Condition: 9-EMA above 21-EMA AND price above VWAP → Confirms buy trend.
Bearish Condition: 9-EMA below 21-EMA AND price below VWAP → Confirms sell trend.
📌 2. Liquidity & Money Flow Divergence (MFD)
This indicator measures liquidity shifts by tracking momentum changes in price and volume.
✔ MFD Calculation:
Uses Exponential Moving Average (EMA) of Momentum (MOM) to detect changes in buying/selling pressure.
If MFD is above its moving average, it signals liquidity inflows → bullish strength.
If MFD is below its moving average, it signals liquidity outflows → bearish weakness.
Why is this important?
Detects when Smart Money is accumulating or distributing before major moves.
Filters out false breakouts by confirming momentum strength before entry.
📌 3. Trade Entry Triggers (Candlestick Patterns & ADX Filter)
To avoid random entries, the strategy waits for specific candlestick confirmations with ADX trend strength:
✔ Bullish Entry (Buy Signal) → Requires:
Bullish Engulfing Candle (Reversal confirmation)
ADX > 20 (Ensures strong trending conditions)
MFD above its moving average (Liquidity inflows)
9-EMA > 21-EMA & price above VWAP (Trend confirmation)
✔ Bearish Entry (Sell Signal) → Requires:
Bearish Engulfing Candle (Reversal confirmation)
ADX > 20 (Ensures strong trending conditions)
MFD below its moving average (Liquidity outflows)
9-EMA < 21-EMA & price below VWAP (Trend confirmation)
📌 4. Risk Management & Profit Protection
This strategy is built with strict risk management to maintain low drawdowns and maximize profits:
✔ Dynamic Position Sizing → Automatically adjusts trade size to risk a fixed $400 per trade.
✔ Adaptive Stop-Losses → Uses ATR-based stop-loss (0.8x ATR) to adapt to market volatility.
✔ Take-Profit Targets → Fixed at 2x ATR for a Risk:Reward ratio of 2:1.
✔ Break-Even Protection → Moves stop-loss to entry once price moves 1x ATR in profit, locking in gains.
✔ Max Daily Loss Limit (-$1,000) → Stops trading if total losses exceed $1,000, complying with Topstep rules.

[TehThomas] - ICT Liquidity sweepsThe ICT Liquidity Sweeps Indicator is designed to track liquidity zones in the market areas where stop-losses and pending orders are typically clustered. This indicator marks buyside liquidity (resistance) and sellside liquidity (support), helping traders identify areas where price is likely to manipulate liquidity before making a significant move.
This tool is based on Inner Circle Trader (ICT) Smart Money Concepts, which emphasize how institutional traders, or “Smart Money,” manipulate liquidity to fuel price movements. By identifying these zones, traders can anticipate liquidity sweeps and position themselves accordingly.
⚙️ How It Works
1️⃣ Detects Key Liquidity Zones
The script automatically identifies significant swing highs and swing lows in price action using a pivot-based method.
A swing high (buyside liquidity) is a peak where price struggles to break higher, forming a resistance level.
A swing low (sellside liquidity) is a valley where price struggles to go lower, creating a support level.
These liquidity points are prime targets for liquidity sweeps before a true trend direction is confirmed.
2️⃣ Draws Liquidity Lines
Once a swing high or low is identified, a horizontal line is drawn at that level.
The lines extend to the right, serving as future liquidity targets until they are broken.
The indicator allows customization in terms of color, line width, and maximum number of liquidity lines displayed at once.
3️⃣ Handles Liquidity Sweeps
When price breaks a liquidity level, the indicator reacts based on the chosen action setting:
Dotted/Dashed: The line remains visible but changes style to indicate a sweep.
Delete: The line is completely removed once price has interacted with it.
This feature ensures that traders can easily spot where liquidity has been taken and determine whether a reversal or continuation is likely.
4️⃣ Prevents Chart Clutter
To maintain a clean chart, the script limits the number of liquidity lines displayed at any given time.
When new liquidity zones are formed, the oldest lines are automatically removed, keeping the focus on the most relevant liquidity zones.
🎯 How to Use the ICT Liquidity Sweeps Indicator
🔍 Identifying Liquidity Grabs
This indicator helps you identify areas where Smart Money is targeting liquidity before making a move.
Buyside Liquidity (BSL) Sweeps:
Occur when price spikes above a resistance level before reversing downward.
Indicate that Smart Money has hunted stop-losses and buy stops before driving price lower.
Sellside Liquidity (SSL) Sweeps:
Occur when price drops below a support level before reversing upward.
Indicate that Smart Money has collected liquidity from stop-losses and sell stops before pushing price higher.
📈 Combining with Market Structure Shifts (MSS)
One of the best ways to use this indicator is in conjunction with our Market Structure Shifts Indicator.
Liquidity sweeps + MSS Confirmation give strong high-probability trade setups:
Wait for a liquidity sweep (price takes out a liquidity level).
Look for an MSS in the opposite direction (e.g., price sweeps a high, then breaks a recent low).
Enter the trade in the new direction with stop-loss above/below the liquidity sweep.
📊 Entry & Exit Strategies
Long Trade Example:
Price sweeps a key sellside liquidity level (SSL) → creates a false breakdown.
MSS confirms a reversal (price breaks structure upwards).
Enter long position after confirmation.
Stop-loss below the liquidity grab to minimize risk.
Short Trade Example:
Price sweeps a key buyside liquidity level (BSL) → takes liquidity above resistance.
MSS confirms a bearish move (price breaks a key support level).
Enter short position after confirmation.
Stop-loss above the liquidity grab.
🚀 Why This Indicator is a Game-Changer
✅ Helps Identify Smart Money Manipulation – Understand where institutions are likely to grab liquidity before the real move happens.
✅ Enhances Market Structure Analysis – When paired with MSS, liquidity sweeps become powerful signals for trend reversals.
✅ Filters Out False Breakouts – Many traders get caught in liquidity grabs. This indicator helps avoid bad entries.
✅ Keeps Your Chart Clean – The auto-limiting feature ensures that only the most relevant liquidity levels remain visible.
✅ Works on Any Timeframe – Whether you’re a scalper, day trader, or swing trader, liquidity concepts apply universally.
📌 Final Thoughts
The ICT Liquidity Sweeps Indicator is a must-have tool for traders who follow Smart Money Concepts. By tracking liquidity levels and highlighting sweeps, it allows traders to enter trades with precision while avoiding false breakouts.
When combined with Market Structure Shifts (MSS), this strategy becomes even more powerful, offering traders an edge in spotting reversals and timing entries effectively.
__________________________________________
Thanks for your support!
If you found this idea helpful or learned something new, drop a like 👍 and leave a comment—I’d love to hear your thoughts! 🚀
Make sure to follow me for more price action insights, free indicators, and trading strategies. Let’s grow and trade smarter together! 📈✨

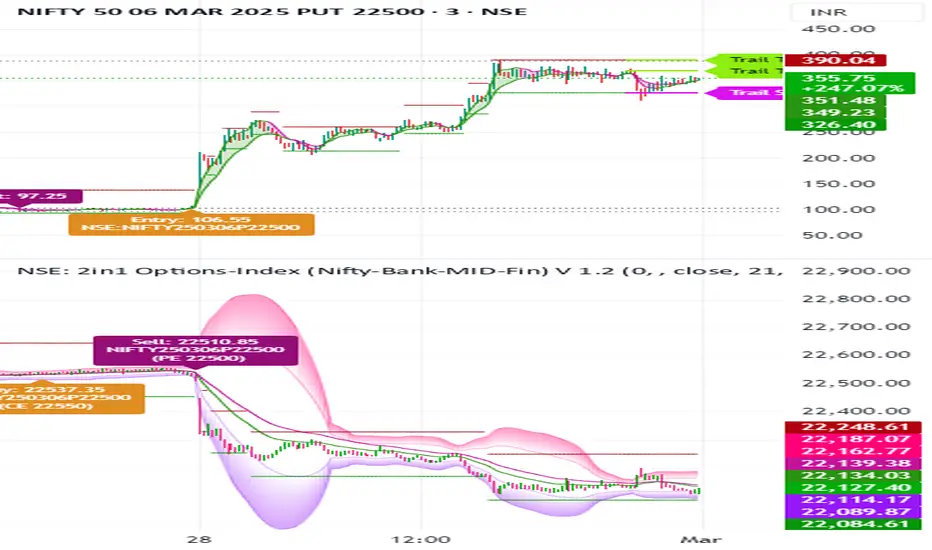
NSE: 2in1 Options-Index (Nifty-Bank-MID-Fin)
1. Using Two Charts in One Indicator with Buy and Sell Signals on Both Charts
Dual-Chart Functionality: This indicator allows you to monitor two charts simultaneously – the main chart (Options) and the underlying index chart (NIFTY, BANKNIFTY, etc.).
The index chart (below the main chart) shows the underlying index movement.
The main chart displays the Options data (e.g., NIFTY options, BANKNIFTY options).
Buy/Sell Signals on Both Charts:
Buy and sell signals are generated on both the options chart and the index chart, ensuring you don’t miss any trading opportunities.
This dual-chart setup helps you correlate the movement of the index with the options data for better decision-making.
2. Works Across Major Indices (NIFTY, BANKNIFTY, FINNIFTY, etc.)
Automatic Index Detection: The script automatically detects the underlying index based on the chart symbol. It supports:
NIFTY, BANKNIFTY, FINNIFTY, MIDCPNIFTY, SENSEX
Flexibility: Whether you’re trading NIFTY options or BANKNIFTY options, the indicator adapts to the selected index and provides accurate signals.
3. Helps You Select ATM, ITM, and OTM Strikes (Ideal for Beginners and Advanced Traders)
ATM (At-The-Money) Strike Calculation:
The script calculates the ATM strike price based on the current spot price of the underlying index.
ITM (In-The-Money) and OTM (Out-Of-The-Money) Strikes:
Users can adjust the strike price using a slider to select ITM or OTM strikes.
This feature is especially helpful for beginners who are learning about options trading and want to understand the difference between ITM, ATM, and OTM strikes.
Strike Price Display:
The selected strike price is displayed on the chart, making it easy to identify the right strike for your trades.
4. Double EMA Selection for Trading
Customizable EMAs:
The script uses two Exponential Moving Averages (EMAs) to generate signals:
Short EMA (Default: 21 periods)
Long EMA (Default: 34 periods)
Users can customize the EMA lengths based on their trading strategy.
5. Option Chart in the Main Chart with Index Chart Below for Easy Monitoring
Integrated Chart Setup:
The main chart displays the options data (e.g., NIFTY options, BANKNIFTY options).
The index chart (below the main chart) shows the underlying index movement.
Benefits:
This setup allows you to monitor both the options and the index in a single view, making it easier to:
Correlate the movement of the index with the options data.
Identify trading opportunities directly on the chart.
No need to switch between multiple charts – everything is in one place.
6. Targets and Stop-Loss When the Signal is Generated
Dynamic Targets and Stop-Loss:
The script calculates targets and stop-loss levels based on the Predicted Range (PR) bands.
Trailing Stop-Loss:
The stop-loss level adjusts dynamically as the price moves in your favor.
Target Levels:
Two target levels are provided (Target 1 and Target 2) based on the PR bands.
Visual Indicators:
Targets and stop-loss levels are plotted on the chart with labels and lines for easy reference.
Colors:
Trailing Stop: Light Pink
Target 1: Light Green
Target 2: Light Green
7. Various Other Options in One Indicator
Advanced Statistical Bands (KRO Settings):
The script includes Kernel Regression Oscillator (KRO) settings for advanced traders.
Plots upper and lower bands based on standard deviation and kernel regression.
Helps identify overbought and oversold conditions.
Customizable Alerts:
Users can enable/disable alerts for:
Buy/Sell signals.
Trailing stop-loss hits.
Target achievements.
Summary of Benefits
All-in-One Tool: Combines candlestick analysis, EMAs, options strike selection, targets, stop-loss, and advanced statistical bands in a single indicator.
Beginner-Friendly: Helps new traders understand ATM, ITM, and OTM strikes while providing clear buy/sell signals.
Advanced Features: Includes KRO settings, dynamic targets, and trailing stop-loss for experienced traders.
Dual-Chart Setup: Monitor options and the underlying index simultaneously for better decision-making.
Customizable: Adjust EMA lengths, strike prices, colors, and alerts to suit your trading style.
Pivot & Source Cross StrategyPivot & ZoneCross Strategy V2
A powerful trading script combining Pivot Points, Retracement Zones, and Dynamic Stop-Loss Management. Suitable for beginners and advanced traders.
Introduction
This script enables traders to leverage Pivot Points and retracement zones for precise entry and exit points. Using price crossover detection and customizable stop-loss management, it offers a structured approach to trading various market conditions.
Features
Pivot Point Calculations: Select between Classic or Fibonacci methods for precise support and resistance levels.
Zone-Based Entry Signals: Identify price crossovers with retracement levels for optimal trade timing.
Customizable Stop-Loss Management: Automatically adjusts stop-loss levels to secure profits or limit losses.
Support for Market or Limit Orders: Choose instant market execution or specific limit entry points.
Flexible Inputs for Sources: Use Source First and Source Second to integrate external indicators like RSI and RSI MA, providing advanced customization options.
Visualization of Key Levels: Easily track retracement zones, Pivot Points, and stop-loss levels directly on the chart.
Configurable Conditions: Tailor entry/exit logic for your trading style.
How to Set Up
Choose Your Higher Timeframe (TIMEFRAME):
This determines the Pivot Points and retracement levels.
Example: Use “D” for daily pivots while trading on lower timeframes.
Select Entry Zone Patterns:
Define the pattern for detecting retracement levels:
xxx: Minor levels (steps of 10).
xx0: Intermediate levels (steps of 50).
x00: Major levels (steps of 100).
Set Entry Conditions for Long and Short Trades:
Activate or deactivate up/down conditions for xxx, xx0, or x00 patterns. Specify the count and range of crosses required for valid signals.
Configure Source Inputs (Source First and Source Second):
Assign external indicators such as RSI and RSI MA to refine entry conditions.
Tip: Adjust RSI settings in its separate indicator to suit your needs.
Select Your Order Type:
Choose between Market orders for instant execution or Limit orders for precision entries. Adjust offset zones for limit orders.
Set Up Stop-Loss Management:
Use dynamic stop-loss patterns with adjustable offsets:
HL: Stop-loss uses high/low levels of the zone.
Close: Stop-loss uses the closing price.
Customize Visualization Options:
Enable or disable xxx, xx0, x00, or 0 levels for cleaner charts. Adjust the display of retracement levels and stop-loss lines.
Apply and Monitor:
Attach the script to your chart, monitor entry/exit signals, and adjust parameters as needed.
How It Works
Calculates Pivot Points based on the chosen method ( Classic or Fibonacci ).
Detects price crossovers with retracement zones to identify potential entry points.
Dynamically adjusts stop-loss levels based on retracement zones and stop-loss patterns.
Supports both market and limit orders with customizable offsets for precise entries.
Allows integration of external sources like RSI for enhanced signal precision.
Important Notes
Use Source First and Source Second to input external indicators like RSI. You can configure RSI settings in its separate indicator to refine signals further.
Always test and optimize parameters before live trading.
Combine this script with your own analysis and proper risk management strategies.
This script is a tool to assist trading decisions but does not guarantee profits. Always trade responsibly.

ROBO STB GainCraft strategyPure Price Action Candlestick Strategy by ROBO STB
Overview
This strategy is built entirely on the principles of price action and candlestick analysis, designed for traders who prefer raw market data over traditional indicators. By focusing solely on candlestick patterns and their context within recent price movements, the strategy identifies high-probability entry and exit points in liquid markets.
Entry signals are generated based on these patterns appearing at significant market locations, such as after consolidations, pullbacks, or at key support/resistance levels.
Price Action Integration:
Instead of relying on oscillators or moving averages, the script leverages the inherent market structure provided by candlesticks to interpret potential trend reversals or continuations.
This approach provides a clearer view of market sentiment.
No External Indicators:
This script avoids the use of traditional indicators like RSI, MACD, or Bollinger Bands, offering a clean, uncluttered chart.
Risk Management (Optional):
Fixed-percentage risk management options can also be enabled, ensuring trades remain within acceptable risk parameters.
How the Strategy Works
Entry Conditions:
Buy Entry: A bullish candlestick pattern (e.g., bullish engulfing) forms after a period of consolidation or pullback, indicating potential upward momentum.
Sell Entry: A bearish candlestick pattern (e.g., bearish engulfing) suggests a downturn is likely.
Exit Conditions:
Exits are triggered by the appearance of reversal candlestick patterns or through predefined SL/TP levels.
The strategy adapts to varying market conditions by analyzing candlestick structures dynamically.
Ideal Use Cases
Short-Term Trading: Designed for day traders and scalpers targeting quick moves on shorter timeframes.
Highly Liquid Markets: Performs best in markets with high liquidity, such as Nifty, Bank Nifty, or major forex pairs, where candlestick patterns provide reliable signals.
30-Minute Timeframe: For optimal results, the strategy is recommended for use on a 30-minute timeframe.
Transparency and Realism
Backtesting Parameters:
The default backtesting settings simulate realistic trading conditions, including commissions and slippage, ensuring that results are not misleading.
Trade sizes are calibrated to risk sustainable amounts (.05% maximum equity per trade).
Dataset Selection:
This strategy has been tested on diverse datasets to produce a statistically significant number of trades, ensuring robust performance evaluation.
Why This Strategy is Unique
This script stands apart by offering a refined approach to price action trading. Unlike generic indicator mashups, it provides traders with an actionable, candlestick-focused methodology tailored for volatile, high-liquidity markets.
The strategy is both simple to understand and powerful in execution, making it an excellent tool for traders who want to develop their skills in raw price action analysis while maintaining strict risk management.
Key Features
Candlestick-Based Entry and Exit Signals:
1. Risk Management:
- Risk-to-Reward Ratio (RTR):
Set a customizable risk-to-reward ratio to calculate target prices based on stop-loss levels.
Default: 3:1
order size added -100
2. Opening Range Identification
- Opening Range High and Low:
The script detects the high and low of the first trading session using Pine Script's session functions.
These levels are plotted as visual guides on the chart:
- High: Lime-colored circles.
- Low: Red-colored circles.
3. Trade Entry Logic
- Long Entry:
A long trade is triggered when the price closes above the opening range high.
- Entry condition: Crossover of the price above the opening range high.
-Short Entry:
A short trade is triggered when the price closes below the opening range low.
- Entry condition: Crossunder of the price below the opening range low.
Both entries are conditional on the absence of an existing position.
4. Stop Loss and Take Profit
- Long Position:
- Stop Loss: Previous candle's low.
- Take Profit: Calculated based on the RTR.
- **Short Position:**
- **Stop Loss:** Previous candle's high.
- **Take Profit:** Calculated based on the RTR.
The strategy plots these levels for visual reference:
- Stop Loss: Red dashed lines.
- Take Profit: Green dashed lines.
5. Visual Enhancements
-Trade Level Highlighting:
The script dynamically shades the areas between the entry price and SL/TP levels:
- Red shading for the stop-loss region.
- Green shading for the take-profit region.
How to Use:
1.Input Configuration:
Adjust the Risk-to-Reward ratio, max trades per day, and session end time to suit your trading preferences.
2.Visual Cues:
Use the opening range high/low lines and shading to identify potential breakout opportunities.
3.Execution:
The strategy will automatically enter and exit trades based on the conditions. Review the plotted SL and TP levels to monitor the risk-reward setup.
Important Notes:
- This strategy is designed for intraday trading and works best in markets with high volatility during the opening session.
- Backtest the strategy on your preferred market and timeframe to ensure compatibility.
- Proper risk management and position sizing are essential when using this strategy in live markets.
Please let me know if you have any doubts.
IU Opening range Breakout StrategyIU Opening Range Breakout Strategy
This Pine Script strategy is designed to capitalize on the breakout of the opening range, which is a popular trading approach. The strategy identifies the high and low prices of the opening session and takes trades based on price crossing these levels, with built-in risk management and trade limits for intraday trading.
Key Features:
1. Risk Management:
- Risk-to-Reward Ratio (RTR):
Set a customizable risk-to-reward ratio to calculate target prices based on stop-loss levels.
Default: 2:1
- Max Trades in a Day:
Specify the maximum number of trades allowed per day to avoid overtrading.
Default: 2 trades in a day.
- End-of-Day Close:
Automatically closes all open positions at a user-defined session end time to ensure no overnight exposure.
Default: 3:15 PM
2. Opening Range Identification
- Opening Range High and Low:
The script detects the high and low of the first trading session using Pine Script's session functions.
These levels are plotted as visual guides on the chart:
- High: Lime-colored circles.
- Low: Red-colored circles.
3. Trade Entry Logic
- Long Entry:
A long trade is triggered when the price closes above the opening range high.
- Entry condition: Crossover of the price above the opening range high.
-Short Entry:
A short trade is triggered when the price closes below the opening range low.
- Entry condition: Crossunder of the price below the opening range low.
Both entries are conditional on the absence of an existing position.
4. Stop Loss and Take Profit
- Long Position:
- Stop Loss: Previous candle's low.
- Take Profit: Calculated based on the RTR.
- **Short Position:**
- **Stop Loss:** Previous candle's high.
- **Take Profit:** Calculated based on the RTR.
The strategy plots these levels for visual reference:
- Stop Loss: Red dashed lines.
- Take Profit: Green dashed lines.
5. Visual Enhancements
-Trade Level Highlighting:
The script dynamically shades the areas between the entry price and SL/TP levels:
- Red shading for the stop-loss region.
- Green shading for the take-profit region.
- Entry Price Line:
A silver-colored line marks the average entry price for active trades.
How to Use:
1.Input Configuration:
Adjust the Risk-to-Reward ratio, max trades per day, and session end time to suit your trading preferences.
2.Visual Cues:
Use the opening range high/low lines and shading to identify potential breakout opportunities.
3.Execution:
The strategy will automatically enter and exit trades based on the conditions. Review the plotted SL and TP levels to monitor the risk-reward setup.
Important Notes:
- This strategy is designed for intraday trading and works best in markets with high volatility during the opening session.
- Backtest the strategy on your preferred market and timeframe to ensure compatibility.
- Proper risk management and position sizing are essential when using this strategy in live markets.

Triple CCI Strategy MFI Confirmed [Skyrexio]Overview
Triple CCI Strategy MFI Confirmed leverages 3 different periods Commodity Channel Index (CCI) indicator in conjunction Money Flow Index (MFI) and Exponential Moving Average (EMA) to obtain the high probability setups. Fast period CCI is used for having the high probability to enter in the direction of short term trend, middle and slow period CCI are used for confirmation, if market now likely in the mid and long-term uptrend. MFI is used to confirm trade with the money inflow/outflow with the high probability. EMA is used as an additional trend filter. Moreover, strategy uses exponential moving average (EMA) to trail the price when it reaches the specific level. More information in "Methodology" and "Justification of Methodology" paragraphs. The strategy opens only long trades.
Unique Features
Dynamic stop-loss system: Instead of fixed stop-loss level strategy utilizes average true range (ATR) multiplied by user given number subtracted from the position entry price as a dynamic stop loss level.
Configurable Trading Periods: Users can tailor the strategy to specific market windows, adapting to different market conditions.
Four layers trade filtering system: Strategy utilizes two different period CCI indicators, MFI and EMA indicators to confirm the signals produced by fast period CCI.
Trailing take profit level: After reaching the trailing profit activation level scrip activate the trailing of long trade using EMA. More information in methodology.
Methodology
The strategy opens long trade when the following price met the conditions:
Fast period CCI shall crossover the zero-line.
Slow and Middle period CCI shall be above zero-lines.
Price shall close above the EMA. Crossover is not obligatory
MFI shall be above 50
When long trade is executed, strategy set the stop-loss level at the price ATR multiplied by user-given value below the entry price. This level is recalculated on every next candle close, adjusting to the current market volatility.
At the same time strategy set up the trailing stop validation level. When the price crosses the level equals entry price plus ATR multiplied by user-given value script starts to trail the price with EMA. If price closes below EMA long trade is closed. When the trailing starts, script prints the label “Trailing Activated”.
Strategy settings
In the inputs window user can setup the following strategy settings:
ATR Stop Loss (by default = 1.75)
ATR Trailing Profit Activation Level (by default = 2.25)
CCI Fast Length (by default = 14, used for calculation short term period CCI)
CCI Middle Length (by default = 25, used for calculation short term period CCI)
CCI Slow Length (by default = 50, used for calculation long term period CCI)
MFI Length (by default = 14, used for calculation MFI
EMA Length (by default = 50, period of EMA, used for trend filtering EMA calculation)
Trailing EMA Length (by default = 20)
User can choose the optimal parameters during backtesting on certain price chart.
Justification of Methodology
Before understanding why this particular combination of indicator has been chosen let's briefly explain what is CCI, MFI and EMA.
The Commodity Channel Index (CCI) is a momentum-based technical indicator that measures the deviation of a security's price from its average price over a specific period. It helps traders identify overbought or oversold conditions and potential trend reversals.
The CCI formula is:
CCI = (Typical Price − SMA) / (0.015 × Mean Deviation)
Typical Price (TP): This is calculated as the average of the high, low, and closing prices for the period.
Simple Moving Average (SMA): This is the average of the Typical Prices over a specific number of periods.
Mean Deviation: This is the average of the absolute differences between the Typical Price and the SMA.
The result is a value that typically fluctuates between +100 and -100, though it is not bounded and can go higher or lower depending on the price movement.
The Money Flow Index (MFI) is a technical indicator that measures the strength of money flowing into and out of a security. It combines price and volume data to assess buying and selling pressure and is often used to identify overbought or oversold conditions. The formula for MFI involves several steps:
1. Calculate the Typical Price (TP):
TP = (high + low + close) / 3
2. Calculate the Raw Money Flow (RMF):
Raw Money Flow = TP × Volume
3. Determine Positive and Negative Money Flow:
If the current TP is greater than the previous TP, it's Positive Money Flow.
If the current TP is less than the previous TP, it's Negative Money Flow.
4. Calculate the Money Flow Ratio (MFR):
Money Flow Ratio = Sum of Positive Money Flow (over n periods) / Sum of Negative Money Flow (over n periods)
5. Calculate the Money Flow Index (MFI):
MFI = 100 − (100 / (1 + Money Flow Ratio))
MFI above 80 can be considered as overbought, below 20 - oversold.
The Exponential Moving Average (EMA) is a type of moving average that places greater weight and significance on the most recent data points. It is widely used in technical analysis to smooth price data and identify trends more quickly than the Simple Moving Average (SMA).
Formula:
1. Calculate the multiplier
Multiplier = 2 / (n + 1) , Where n is the number of periods.
2. EMA Calculation
EMA = (Current Price) × Multiplier + (Previous EMA) × (1 − Multiplier)
This strategy leverages Fast period CCI, which shall break the zero line to the upside to say that probability of short term trend change to the upside increased. This zero line crossover shall be confirmed by the Middle and Slow periods CCI Indicators. At the moment of breakout these two CCIs shall be above 0, indicating that there is a high probability that price is in middle and long term uptrend. This approach increases chances to have a long trade setup in the direction of mid-term and long-term trends when the short-term trend starts to reverse to the upside.
Additionally strategy uses MFI to have a greater probability that fast CCI breakout is confirmed by this indicator. We consider the values of MFI above 50 as a higher probability that trend change from downtrend to the uptrend is real. Script opens long trades only if MFI is above 50. As you already know from the MFI description, it incorporates volume in its calculation, therefore we have another one confirmation factor.
Finally, strategy uses EMA an additional trend filter. It allows to open long trades only if price close above EMA (by default 50 period). It increases the probability of taking long trades only in the direction of the trend.
ATR is used to adjust the strategy risk management to the current market volatility. If volatility is low, we don’t need the large stop loss to understand the there is a high probability that we made a mistake opening the trade. User can setup the settings ATR Stop Loss and ATR Trailing Profit Activation Level to realize his own risk to reward preferences, but the unique feature of a strategy is that after reaching trailing profit activation level strategy is trying to follow the trend until it is likely to be finished instead of using fixed risk management settings. It allows sometimes to be involved in the large movements. It’s also important to make a note, that script uses another one EMA (by default = 20 period) as a trailing profit level.
Backtest Results
Operating window: Date range of backtests is 2022.04.01 - 2024.11.25. It is chosen to let the strategy to close all opened positions.
Commission and Slippage: Includes a standard Binance commission of 0.1% and accounts for possible slippage over 5 ticks.
Initial capital: 10000 USDT
Percent of capital used in every trade: 50%
Maximum Single Position Loss: -4.13%
Maximum Single Profit: +19.66%
Net Profit: +5421.21 USDT (+54.21%)
Total Trades: 108 (44.44% win rate)
Profit Factor: 2.006
Maximum Accumulated Loss: 777.40 USDT (-7.77%)
Average Profit per Trade: 50.20 USDT (+0.85%)
Average Trade Duration: 44 hours
These results are obtained with realistic parameters representing trading conditions observed at major exchanges such as Binance and with realistic trading portfolio usage parameters.
How to Use
Add the script to favorites for easy access.
Apply to the desired timeframe and chart (optimal performance observed on 2h BTC/USDT).
Configure settings using the dropdown choice list in the built-in menu.
Set up alerts to automate strategy positions through web hook with the text: {{strategy.order.alert_message}}
Disclaimer:
Educational and informational tool reflecting Skyrex commitment to informed trading. Past performance does not guarantee future results. Test strategies in a simulated environment before live implementation

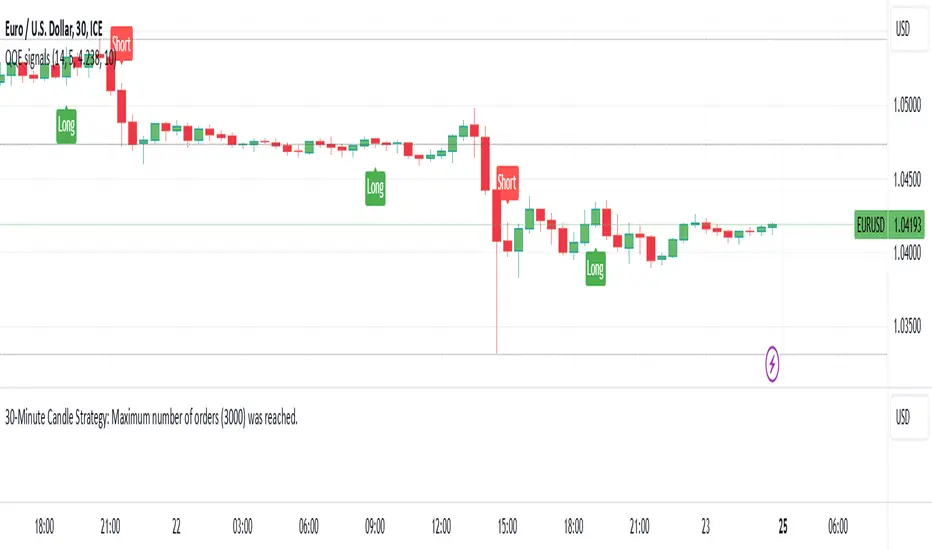
30-Minute Candle Strategy30-Minute Candle Trading Strategy
This strategy works on a 30-minute candle timeframe. When a new 30-minute candle opens, the following actions will take place based on the previous 30-minute candle's closing price:
Buy Trade Setup:
If the market opens above the previous 30-minute candle's closing price, a buy trade will be executed immediately at the market price.
The stop-loss will be set at the previous 30-minute candle's closing price.
There will be no fixed target.
The trade will be closed 1 minute before the current 30-minute candle closes, regardless of profit or loss.
Sell Trade Setup:
If a buy trade hits the stop-loss and the market moves below the previous 30-minute candle's closing price, a sell trade will be executed immediately at the market price.
The stop-loss for the sell trade will also be set at the previous 30-minute candle's closing price.
There will be no fixed target.
The trade will be closed 1 minute before the current 30-minute candle closes, regardless of profit or loss.
Procedure:
This process will repeat for every 30-minute candle.
If the market crosses the previous 30-minute candle's closing price to the upside, a buy trade will be executed, and the stop-loss will be set at the previous candle's closing price.
If the market crosses the previous 30-minute candle's closing price to the downside, a sell trade will be executed, and the stop-loss will also be set at the previous candle's closing price.
Each trade will be closed 1 minute before the current candle closes.
Key Points:
This strategy applies to every new 30-minute candle.
The stop-loss will always be based on the previous 30-minute candle's closing price.
If a stop-loss is hit, the strategy will automatically switch to the opposite trade (buy to sell or sell to buy) based on market movement crossing the previous candle's closing price.
This is a repetitive and systematic approach to trading, ensuring the rules are followed for every 30-minute candle.
MFI Strategy with Oversold Zone Exit and AveragingThis strategy is based on the Money Flow Index (MFI) and aims to enter a long position when the MFI exits an oversold zone, with specific rules for limit orders, stop-loss, and take-profit settings. Here's a detailed breakdown:
Key Components
1. **Money Flow Index (MFI)**: The strategy uses the MFI, a volume-weighted indicator, to gauge whether the market is in an oversold condition (default threshold of MFI < 20). Once the MFI rises above the oversold threshold, it signals a potential buying opportunity.
2. **Limit Order for Long Entry**: Instead of entering immediately after the oversold condition is cleared, the strategy places a limit order at a price slightly below the current price (by a user-defined percentage). This helps achieve a better entry price.
3. **Stop-Loss and Take-Profit**:
- **Stop-Loss**: A stop-loss is set to protect against significant losses, calculated as a percentage below the entry price.
- **Take-Profit**: A take-profit target is set as a percentage above the entry price to lock in gains.
4. **Order Cancellation**: If the limit order isn’t filled within a specific number of bars (default is 5 bars), it’s automatically canceled to avoid being filled at a potentially suboptimal price as market conditions change.
Strategy Workflow
1. **Identify Oversold Zone**: The strategy checks if the MFI falls below a defined oversold level (default is 20). Once this condition is met, the flag `inOversoldZone` is set to `true`.
2. **Wait for Exit from Oversold Zone**: When the MFI rises back above the oversold level, it’s considered a signal that the market is potentially recovering, and the strategy prepares to enter a position.
3. **Place Limit Order**: Upon exiting the oversold zone, the strategy places a limit order for a long position at a price below the current price, defined by the `Long Entry Percentage` parameter.
4. **Monitor Limit Order**: A counter (`barsSinceEntryOrder`) starts counting the bars since the limit order was placed. If the order isn’t filled within the specified number of bars, it’s canceled automatically.
5. **Set Stop-Loss and Take-Profit**: Once the order is filled, a stop-loss and take-profit are set based on user-defined percentages relative to the entry price.
6. **Exit Strategy**: The trade will close automatically when either the stop-loss or take-profit level is hit.
Advantages
- **Risk Management**: With configurable stop-loss and take-profit, the strategy ensures losses are limited while capturing profits at pre-defined levels.
- **Controlled Entry**: The use of a limit order below the current price helps secure a better entry point, enhancing risk-reward.
- **Oversold Exit Trigger**: Using the exit from an oversold zone as an entry condition can help catch reversals.
Disadvantages
- **Missed Entries**: If the limit order isn’t filled due to insufficient downward movement after the oversold signal, potential opportunities may be missed.
- **Dependency on MFI Sensitivity**: As the MFI is sensitive to both price and volume, its fluctuations might not always accurately represent oversold conditions.
Overall Purpose
The strategy is suited for traders who want to capture potential reversals after oversold conditions in the market, with a focus on precise entries, risk management, and an automated exit plan.

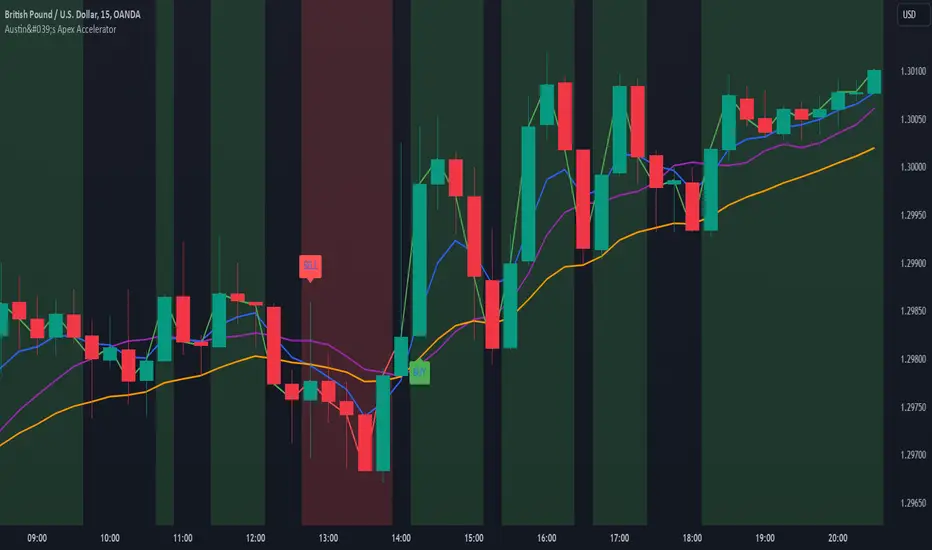
Austin's Apex AcceleratorIndicator Name: Austin’s Apex Accelerator
Overview
The Austin’s Apex Accelerator is a highly aggressive trading indicator designed specifically for high-frequency Forex trading. It combines several technical analysis tools to identify rapid entry and exit points, making it well-suited for intraday or even lower timeframe trades. The indicator leverages a combination of exponential moving averages (EMAs), Bollinger Bands, volume filters, and volatility-adjusted ranges to detect breakout opportunities and manage risk with precision.
Core Components
Fast and Slow EMAs: The two EMAs act as trend and momentum indicators. When the shorter EMA crosses the longer EMA, it signals a change in momentum. The crossover of these EMAs often indicates a potential entry point, especially when combined with volume and volatility filters.
ATR-Based Range Filter: Using the Average True Range (ATR) for dynamic range calculation, the indicator adapts to market volatility. Higher ATR values widen the range, helping the indicator adjust for volatile conditions.
Volume Filter: A volume condition ensures that buy and sell signals only trigger when there’s significant market interest, reducing the likelihood of false signals in low-liquidity environments.
Bollinger Bands: The Bollinger Bands provide additional context for potential overbought or oversold conditions, highlighting opportunities for price reversals or trend continuations.
Key Features
Aggressive Buy and Sell Signals:
Buy Signal: A buy signal is generated when the fast EMA crosses above the slow EMA, confirming bullish momentum, and the volume condition is met. If the price is also near the lower Bollinger Band, it adds further confirmation of an oversold condition.
Sell Signal: A sell signal is generated when the fast EMA crosses below the slow EMA, confirming bearish momentum, with sufficient trading volume. If the price is near the upper Bollinger Band, it signals a potential overbought condition, which supports the sell signal.
Dynamic Range with ATR:
The indicator uses a volatility-based range, derived from the ATR, to adjust the signal sensitivity based on recent price fluctuations. This dynamic range ensures that signals are responsive in both high and low volatility conditions.
The range’s upper and lower bands act as thresholds, with trades often occurring when the price breaches these levels, signaling momentum shifts or trend reversals.
Trend Background Color:
A green background highlights bullish trends when the fast EMA is above the slow EMA.
A red background signifies bearish trends when the fast EMA is below the slow EMA, providing a visual indication of the overall market trend direction.
Trend Line:
The indicator plots a dynamic trend line that changes color based on the price's relationship to the EMAs, helping traders quickly assess the current trend’s strength and direction.
Alerts:
The indicator includes configurable alerts for buy and sell signals, allowing traders to be notified of entry opportunities without needing to monitor the chart continuously.
How to Use Austin’s Apex Accelerator
Identify Entry Points:
Buy Entry: When the fast EMA crosses above the slow EMA, a buy signal is triggered. Confirm this signal by checking if the price is near or below the lower Bollinger Band (indicating an oversold condition) and if trading volume meets the set threshold.
Sell Entry: When the fast EMA crosses below the slow EMA, a sell signal is triggered. Confirm the signal by ensuring the price is near or above the upper Bollinger Band (suggesting an overbought condition) and that volume is sufficient.
Exit Strategy:
Take Profit: The take profit level is calculated as 1.5 times the ATR from the entry point. This ensures that each trade aims to achieve a positive risk/reward ratio.
Stop Loss: The stop loss is set at 1 ATR from the entry, providing a tight risk control mechanism that limits potential losses on each trade.
Trend Identification and Background Colors:
Use the background colors to assess the trend direction. A green background indicates a bullish trend, while a red background suggests a bearish trend. These colors can help you filter signals that go against the trend, increasing the chances of a successful trade.
Volume Confirmation:
This indicator has an inbuilt volume filter to prevent trading in low-volume conditions. Look for signals only when volume exceeds the average volume threshold, which is set by the multiplier. This helps avoid trading during quieter times when false signals are more likely.
Alerts:
Set up alerts for buy and sell signals to be notified in real-time whenever a new trading opportunity arises, so you can act on high-quality signals promptly.
Practical Tips for Using Austin’s Apex Accelerator
Timeframe: Best suited for short timeframes such as 5-minute or 15-minute charts for high-frequency trading.
Profit & Risk CalculatorThe "Profit & Risk Calculator" script in Pine Script (TradingView) is designed to help users calculate potential profit and risk when trading, and to provide alerts when specific price levels are reached (such as entry price, take profit, or stop loss). It includes several components as described below:
1. Input Fields:
The user can manually input various prices: entry price, stop loss price, and take profit price, with steps of 0.25.
There is also an option to input a custom value (e.g., for personal lot sizing) and a total investment amount.
2. Dynamic Lines:
The script draws dynamic horizontal lines for the input prices: entry line (white), stop loss line (red), and take profit line (green).
These lines are automatically updated based on the entered price levels.
3. Labels for the Lines:
Labels are added to the lines to visually indicate the entry, stop loss, and take profit levels on the chart.
4. Long and Short Position Calculations:
The script calculates potential profit and loss for both long (profit if the price goes up) and short (profit if the price goes down) positions.
It also calculates the distance between entry and take profit, and distance between entry and stop loss, along with the risk/reward ratio (RR).
5. Alerts:
The script generates alerts when one of the following conditions is met:
Entry Condition: The price touches or exceeds the entry price (high >= entryPrice).
Stop Loss Condition: The price touches or drops below the stop loss price (low <= stopLossPrice).
Take Profit Condition: The price touches or exceeds the take profit price (high >= takeProfitPrice).
6. Lot Calculations:
The script calculates both micro and mini lot sizes based on a preset table and the custom value.
The results are displayed in a table on the chart.
7. Profit/Risk Table:
The script shows two tables:
One table calculates the profit, loss, and risk/reward ratio based on the input entry price.
A second table shows the same calculations based on the current price.
8. Chart Display:
The script places tables and other visual data on the chart, such as preset values, profit and loss calculations, and the distance from take profit and stop loss to the entry price.
English Explanation of Each Part of the Script
1. Input Fields
The script starts with several input fields where the user can specify the entry price, stop loss price, take profit price, custom value, and investment amount. These values help define the parameters for risk/reward calculations.
2. Dynamic Horizontal Lines
Three horizontal lines are drawn on the chart, representing the entry price, stop loss price, and take profit price. These lines update dynamically based on user input.
3. Dynamic Line Updates
As the user adjusts their inputs, the position of the lines is updated in real-time to match the new price levels. This keeps the chart visually accurate.
4. Labels for Lines
Labels are placed on the chart next to each price line, allowing the user to clearly see which line represents which price level.
5. Long and Short Position Calculations
The script calculates the potential profit or loss for both long (prices go up) and short (prices go down) positions, providing users with an idea of their potential gains or losses.
6. **6. Risk/Reward Ratio Calculation
This calculates the Risk/Reward Ratio (RR) by dividing the distance between the take profit and entry price by the distance between the entry and stop loss price. This gives the trader an idea of how much risk they're taking relative to the potential reward.
7. Alert Conditions
The alert conditions are defined based on the price hitting the set levels:
Entry Condition: If the price goes up and touches the entry level, the alert is triggered.
Stop Loss Condition: If the price drops and hits the stop loss level, the alert is triggered.
Take Profit Condition: If the price rises and reaches the take profit level, the alert is triggered.
8. Alert Configuration
Each condition is linked to an alert that sends a message when the specific price level is touched. The alerts notify the user when the entry, stop loss, or take profit levels are hit.
9. Lot Calculations
The script includes a function that calculates micro and mini lot sizes based on a preset table and a custom value input by the user. This is useful for adjusting lot sizes to the desired amount and determining position sizes for trades.
10. Entry Price-Based Profit & Loss Table
A table is generated on the chart that displays detailed information about the profit, loss, and risk/reward ratio based on the entry price. It helps traders see the potential outcomes for different lot sizes.
11. Current Price-Based Profit & Loss Table
This second table provides similar information as the first but calculates profit, loss, and risk/reward based on the current price. This allows the trader to see how their position performs as the market price changes in real time.
G.O.A.T. Scalper Diagnostics v1OVERVIEW:
The G.O.A.T. Scalper Diagnostics indicator system enables users to discover unorthodox indicator patterns, reading price charts in unusual ways, thus gaining an edge over the majority of market participants they trade against.
CONCEPTS:
Th G.O.A.T. Scalper Diagnostics is a system that aims to satisfy the fundamental condition for successful online trading - providing an edge.
It's a battle between advantages. To take other people's money, successful traders must have an advantage over everybody else. To hope for consistent success in trading, you need to do things differently and see what almost nobody else sees. Of course then you must act on it, and that's where the G.O.A.T. Scalper Diagnostic's mandate ends.
I believe the vast majority of indicators out there show you what everybody else sees. I've always been an indicator guy, I respect and cherish most indicators and I know a good indicator when I see it.
However, although most indicators are great works of art, their practicality is in most cases doubtful. Presenting great information is one thing, but providing an edge over the people you trade against is something different.
What Everybody Else Sees
The G.O.A.T. Scalper Diagnostics is based on indicators most of you have probably heard of and used:
Moving Averages (particularly the Kaufman Moving Average, among others)
ADX and DI
Bollinger Bands
Stochastic (particularly the Stochastic RSI)
Most traders should be well familiar with these classic indicators, they've provided the basis for online indicator trading for decades. But it's also true that due to how popular online trading has become all over the world, one is more and more unable to use these indicators successfully on lower timeframes.
Usually, more noteworthy success is achieved by going up in scale and discovering the timeframe where a particular indicator produces no false signals. Often times these timeframes range from bi-weekly to multi-month scale. In other words, consistently successful low timeframe trading and scalp trading in particular are now almost impossible using indicators.
Traders that dominate the scalping arena are big professional/institutional groups of traders, who have systematic access to the order books of most exchanges. This can be achieved one way or another, but not by individuals, small groups without significant capital or simply traders who lack political/social power and influence in the trading field.
In other words - giant order book traders have an edge over everybody else, who use indicators to trade on lower timeframes.
Through a series of interventions into these classical indicators, the G.O.A.T. System brings them back into the lower timeframe competitive game. Most original formulas are preserved, but these immortal classics are applied in ways popular TA would consider unorthodox.
Ingenious Indicators Built by Creators
The G.O.A.T. Scalper Diagnostics relies on the fundamental work of others. The System is developed on the basis of:
Quadratic Kernel Regression - it uses the publicly published library of Justin Dehorty: www.tradingview.com
PMARP - Price Moving Average Ratio & Percentile, publicly published by "The_Caretaker": www.tradingview.com
These Creators deserve full credit for their fundamental work and are endorsed by the G.O.A.T. Scalper Diagnostics project.
And yet... ingenious and inspired as these tools are, in my humble opinion the general public is presented with a rather unproductive way to apply them. In my own view, these wonderful tools built by JDehorty and The_Caretaker have a massive potential should they be applied and wielded in a different direction. So I tried to bring my vision about them into flesh with the G.O.A.T. Diagnostics.
What the G.O.A.T. Scalper Diagnostics Is and How to Use It
It's a System for new pattern discovery, bringing the disciplines of pattern and indicator trading together.
By using it as a stand-alone, or mixing it with other great indicators, one is able to discover new indicator patterns. Patterns can be compared, matched together and categorized. By applying statistics to differentiated historical pattern groups, we're able to derive their meaning.
Thus, the trader is able to research their own "alphabet" to read the price charts. After categorizing and differentiating pattern groups with statistically predominant meaning, the trader is then able to read into longer scenarios - price set-ups that are harder to detect due to them being stretched in time or misshapen according to the particular situation.
The G.O.A.T. Scalper leverages and encourages group trading, as different traders will probably discover different price "alphabets" for themselves, potentially giving rise to a social economy of sharing and combining "trading languages" based on indicator patterns people have discovered via the G.O.A.T. Diagnostics.
Support/Resistance Trading
The G.O.A.T. Scalper has its own way of deriving Support/Resistance.
Unlike most existing S/R indicators, The Scalper derives Support/Resistance not by measuring price highs, lows and closes, but solely by using momentum and trend strength.
This seems like a much more versatile way to plot S/R during scalping on low timeframes where time is of essence and the trader's view is too narrow to have macro S/R levels in constant consideration.
The Scalper's way to derive S/R in real time and on the go, while staying very relative to important higher timeframe S/R zones, makes it much more desirable than any other S/R indicator I've thus far encountered.
All S/R functionality is derived from the classical ADX and DI indicator. To do this, I use the ADX and DI in an unpopular way. To generate the actual plot of S/R levels I also modify the indicator's code, not by removing functional parts from it, but adding more to it in order to filter the signals it produces.
I can metaphorically describe its action in the following way:
Imagine you're Price action itself;
You're walking through a labyrinth or corridors. You're walking through one straight corridor, and it has a crossing with another corridor ahead;
Very strong wind is blowing along that other corridor. You can't see the wind, but when you reach it and try to move past it, the force of the wind resists your moving ahead and instead pushes you sideways.
At this point, the G.O.A.T. Diagnostics already knows this can only be one thing - resistance.
Orthodox TA and trading demand retests. In my opinion, this deeply rooted tradition wastes time proving the obvious, then wastes time again double-proving the validity of recent past, while scalping opportunities go to waste. Modern successful traders are way ahead of the popular strategy of testing and retesting S/R that almost every trader uses. So-called "Stops hunting" is just one expression of this situation, where wide adoption of the S/R retesting strategy actually lures unsuccessful traders into the schemes of the successful few.
In my own way of trading, I use the G.O.A.T. Diagnostics to take action on Support/Resistance as it's plotted in real time.
But probably my biggest heresy into the DI is my opinion, that the crossings of the +DI and -DI are useless and should actually be discarded.
My research shows that the DIs often show indications of being "oversold", but don't seem to exhibit an "overbought" state. Statistically, I've had much more success basing my TA on that, rather than cross-ups and cross-downs of the DI plot lines.
Therefore I discarded these crossings by presenting the DI part of the ADX and DI as a Heatmap channel rather than crossing lines.
To further enhance the ability of the System to provide S/R analysis, I plot this Heatmap onto an adjustable price offset plots (a percentage above and below current price).
In modern times, the vast majority of trading is done by automatic machines and algorithms. To give a specific example, one can easily notice, that a 5% offset of the BTC 1h price plot leads to remarkably accurate S/R charting. Following the rule to chart a S/R line connecting highs and lows on the 5% price offset often successfully "foresees" valid S/R zones before price ever visits them. Or, the levels were visited so far back in the timeframe's history that orthodox understanding considers them "invalidated" or washed away in the noise of the relevant volume profile.
My explanation for this is simple - I think Grid bots now dominate automatic trading across the majority of exchanges.
In my understanding, by adjusting the percentage offset of current price action I can often discover relevant conglomerations of dominating Grid bot cell parameters and anticipate price reaction. By plotting the DI heatmap on these price action offsets I can use the indicator for my trading decisions.
Heatmaps
Every heatmap produces different series of data. They're not the same.
Bollinger Band heatmap depicts the percentile distance between the Band's extremes.
The price candles heatmap, and the KAMA moving average heatmap, depict the percentile distance between price and the KAMA. So, it's the same thing. However, the percentile of that distance is calculated in two different ways, hence the difference in color in every particular moment. This color discrepancy aims to visualize the "strain" between price action and KAMA, like a soft and hard "springs" that go in unison with each other in sustainable moves, and in dissonance with each other during unsustainable moves.
Price offset heatmap depicts the percentile average of the +DI (above price) and the -DI (below price). A Hot temperature above price and a Cold temperature below price would mean a strong bullish sentiment, and vise versa, while Green would mean neutrality in sentiment.
There are important interplays between different heatmaps. For example, although representing totally different things, a Teal price bar would almost always (according to historical statistics) foreshadow a change in DI's heatmap sentiment. That's just one avenue of correlation between S/R analysis and sentiment analysis using the G.O.A.T. Diagnostics.
Oscillator Chart
In terms of applying Quadratic Kernel Regression, I endorse the natural principle that no center can exist without a periphery, and no periphery can exist without a center. Therefore I try to pay attention not only to the average of the regression's values, but also to the cloud of data points itself.
Following this understanding, I attempt to depict the natural cycles of price converging/diverging towards/from its regression average. To do this, I apply the classic Stochastic formula.
Thus, the Oscillator part of the System depicts the following:
Thin heatmap line displays the cycles of price converging with its quadratic kernel regression average (moving down), and diverging with its regression average (moving up). Its heatmap depicts the percentile of this oscillation.
The wider heatmap line displays the KAMA's cycles of convergence/divergence with its own quadratic kernel regression average. The reason for this is again creating discrepancy - while KAMA is based on price action, its regression data values differ from those of price action's regression. This discrepancy produces useful historic patterns that can be studied statistically.
The thin and wide purple oscillator lines depict the change of slope of price action regression average and KAMA regression average, respectively. Very often change of slope is not detectable with the naked eye, but clearly indicated by the oscillators.
By combining all these elements into a single analysis, a trader can detect hidden trends that are yet to become visible for the rest of market participants.
For example, convergence of price with its quadratic kernel regression average while the slope of the average deteriorates down in most cases (according to statistics) means a sideways consolidation in a downtrend before downtrend continuation. Conversely, deviation of price action from its regression average while the regression average slope deteriorates down usually marks the very beginning of a downtrend.
Bollinger Bands
Bollinger Bands are not modified, but are based on quadratic kernel regression values. Thus, if Bollinger Bands themselves are indicative of volatility, then based on kernel regression values, they should indicate the volatility of change of values in the regression's window.
Again, applying it to both the price and KAMA regression data series, a discrepancy is highlighted that leads to useful historical patterns subject to analysis and categorization.
SOME EXAMPLES
Support / Resistance
Support/Resistance levels are market by White Triangles with dotted lines plotted from them, in real time. The indicator plots Ghost Triangles in anticipation of Support/Resistance, preparing the trader for the eventual confirmation of a zone of interest and signaling price is feeling Support or Resistance pressure.
Dialing the length of the S/R lines to 25 makes the indicator more useful.
Dialing the setting to 500 clearly shows macro S/R zones by conglomerating and bundling individual lines. The thicker the bundling and the confluence of lines, the more significant the zone.
Thus lower timeframe scalping and trading is made more easy, without the need to do nearly as much manual S/R charting. Support/Resistance analysis and plotting is entirely based on a modified ADX.
Heatmap
Sustainable moves are generally marked by Green price color and calm KAMA colors.
Unsustainable moves are usually marked by more extreme colors of price bars and KAMA. Red usually means price is unsustainably distanced from the KAMA, while deep Blue usually means price is undesirably close to the KAMA, foreshadowing a directional distancing.
Usually Teal color of price bars and KAMA foreshadow a change of sentiment of the outside Heatmap sentiment channel.
Red color of the outside channel always signals the direction of the desired sentimental movement, while Blue signals the extent at which the counter-element suffers. Thus, one side being Green, while the other is Blue, often means the Blue will soon evolve into a warmer color, attracting price in that direction. Outside Heatmap channel is entirely based on a modified DI.
Oscillator Chart
An example of Chart Diagnosis using the Oscillator and other elements of the G.O.A.T. Scalper:
First (far left), a Resistance is plotted. This coincides with price bars being Red (distressed state). The thin colorful Oscillator line takes an Up-turn, signifying a period of price moving away from its Quadratic Kernel Regression (pink moving average).
After Price cools down to Green sustainable colors, a Support is plotted. During this time, the thin colorful line is falling down, signifying a period when the distance between price action and its quadratic kernel regression average is decreasing.
During this phase, the thin purple Oscillator line goes up. This signifies the slope of the price regression is restoring to the upside.
Next, the thin colorful line starts going up again, signifying another period of price getting further away from its regression average. This time to the upside.
Resistance is being broken and new support is established. At this point, the thin colorful line starts falling again, signifying distance between price and its regression MA is shortening. This is clearly visible as a sideways consolidation (with a slight tilt up of slope).
A moment comes when all lines - the price and KAMA lines, and price and KAMA regression slopes, all point down. A new down period is clearly starting. This is further indicated by Teal price bars and new Resistance forming. Notice how the external heatmap channel goes into more balanced Green colors with trend enthusiasm calming down.
This analysis may appear to be overwhelming and confusing at first, as these metrics are unorthodox and unpopular. But different aspects of the indicator can be toggled ON/OFF to single them out, which makes observations much simpler for new users. After some time spent discovering personal patterns, or reviewing other users' catalogues with already published pattern libraries, it soon becomes easy to read charts in this new way.
Bollinger Bands
Bollinger Bands provide another way to produce patterns that give users specific chart information.
One noteworthy indication is when the price and KAMA Bollinger Bands separate their value zones. Since the zones of these Bands are based on the kernel regression values of the respective sources, their separation is significant and too often means violent reversals or violent continuations (which usually can be judged using the other metrics the System provides, or additional indicators of choice).
Another noteworthy Bollinger Band pattern is when price action leaves a prolonged trending move.
First phase of the end of a prolonged trending move is the BB zones expanding and doing a significant overlap.
Second stage is price getting reaccepted in the Price BB. This however doesn't mean reacceptance in the KAMA BB and if the moment isn't right, usually leads to bounces and continuations.
The KAMA needs to "make space" for price to get reaccepted into the KAMA BB. While the KAMA is outside its BB or very near to its wall, price reacceptance into it is not very probable. When KAMA withdraws from its BB wall, opening an "entrance on its membrane", that's when price is eligible to get reaccepted into the KAMA BB. That's usually the moment the long awaited consolidation starts and a long trending move is over.
Users of the G.O.A.T. Scalper Diagnostics can discover many more patterns and correlations between patterns within the System. But the System itself can multiply all possible patterns when inspected in the context of additional indicators, leading to vast possibilities of signal and pattern discovery with huge potential.
A very good idea would probably be to use the G.O.A.T. Diagnostics together with the Ichimoku.
Ichimoku has always been famous for its genius simplicity and elegant profoundness, but notorious for its total lack of accuracy, as well as general uselessness on lower timeframes. The G.O.A.T. System has the potential to enhance all of Ichimoku's strengths and cure its weaknesses.
Yet another good idea may be to pair it with kindred indicators, like the Gaussian Channel, which has a stunning performance, but suffers from too high level of generalization. The Diagnostics can provide the intricate texture of price manoeuvres the Gaussian Channel fails to register, while the GC can give the Scalper even more solid context for its patterns.
The worthwhile possibilities seem endless...
Entry Table
I've added a little Entry Table at the bottom right corner. It's designed to potentially help scalpers trade faster, and to visualize a potential trade they're thinking about before they execute it. A Stop Loss is visually plotted in real time to better visualize it's placement in the chart context.
It encourages responsible risk management in its settings:
The user enters the amount of their trading portfolio;
Then specify the percentage of their portfolio they're willing to risk at every trade;
After that the user can chose to specify a flat percentage Stop Loss.
The table will calculate the size of the entry of a market order, so the user only risks the specified percentage of their portfolio should the specified Stop Loss level is hit.
There's also the option to use automatically suggested Stop Loss, based on recent volatility. The actual Stop Loss is calculated 20% away from the actual volatility level, to better protect from unforeseen wicks.
In the current example, the user with a $1000 trading portfolio has to do a $1000 entry to lose 1% of their portfolio ($10) at a 1% Stop Loss.
But the user has to do a $2,525 entry in order to lose 1% of their portfolio (%10) at a much closer Stop Loss which is less than 1%, based on recent volatility.
The Entry Table should be considered as a cosmetic convenience and not a dedicated risk management tool.
CONCLUSION:
The G.O.A.T. Scalper Diagnostics is an indicator System, based on popular, but modified and tweaked versions of indicators like the ADX and DI, Stochastic, Bollinger Bands and MAs. It also leverages the remarkable work of inspired creators: JDehorty's Quadratic Kernel Regression library, and The_Caretaker's PMARP .
The G.O.A.T. Scalper Diagnostics indicator system enables users to discover so-called new "indicator-pattern alphabets", reading price charts in new and unorthodox ways, thus gaining an edge over the majority of market participants they trade against.
The high degree of freedom when discovering new patterns, either within the System itself or correlating its output to external auxiliary indicators, highlights the System's potential for original discoveries leading to highly personalized trading strategies. Exchanging information about personal pattern libraries can potentially also give birth to new private trading communities.

MACD with 1D Stochastic Confirmation Reversal StrategyOverview
The MACD with 1D Stochastic Confirmation Reversal Strategy utilizes MACD indicator in conjunction with 1 day timeframe Stochastic indicators to obtain the high probability short-term trend reversal signals. The main idea is to wait until MACD line crosses up it’s signal line, at the same time Stochastic indicator on 1D time frame shall show the uptrend (will be discussed in methodology) and not to be in the oversold territory. Strategy works on time frames from 30 min to 4 hours and opens only long trades.
Unique Features
Dynamic stop-loss system: Instead of fixed stop-loss level strategy utilizes average true range (ATR) multiplied by user given number subtracted from the position entry price as a dynamic stop loss level.
Configurable Trading Periods: Users can tailor the strategy to specific market windows, adapting to different market conditions.
Higher time frame confirmation: Strategy utilizes 1D Stochastic to establish the major trend and confirm the local reversals with the higher probability.
Trailing take profit level: After reaching the trailing profit activation level scrip activate the trailing of long trade using EMA. More information in methodology.
Methodology
The strategy opens long trade when the following price met the conditions:
MACD line of MACD indicator shall cross over the signal line of MACD indicator.
1D time frame Stochastic’s K line shall be above the D line.
1D time frame Stochastic’s K line value shall be below 80 (not overbought)
When long trade is executed, strategy set the stop-loss level at the price ATR multiplied by user-given value below the entry price. This level is recalculated on every next candle close, adjusting to the current market volatility.
At the same time strategy set up the trailing stop validation level. When the price crosses the level equals entry price plus ATR multiplied by user-given value script starts to trail the price with EMA. If price closes below EMA long trade is closed. When the trailing starts, script prints the label “Trailing Activated”.
Strategy settings
In the inputs window user can setup the following strategy settings:
ATR Stop Loss (by default = 3.25, value multiplied by ATR to be subtracted from position entry price to setup stop loss)
ATR Trailing Profit Activation Level (by default = 4.25, value multiplied by ATR to be added to position entry price to setup trailing profit activation level)
Trailing EMA Length (by default = 20, period for EMA, when price reached trailing profit activation level EMA will stop out of position if price closes below it)
User can choose the optimal parameters during backtesting on certain price chart, in our example we use default settings.
Justification of Methodology
This strategy leverages 2 time frames analysis to have the high probability reversal setups on lower time frame in the direction of the 1D time frame trend. That’s why it’s recommended to use this strategy on 30 min – 4 hours time frames.
To have an approximation of 1D time frame trend strategy utilizes classical Stochastic indicator. The Stochastic Indicator is a momentum oscillator that compares a security's closing price to its price range over a specific period. It's used to identify overbought and oversold conditions. The indicator ranges from 0 to 100, with readings above 80 indicating overbought conditions and readings below 20 indicating oversold conditions.
It consists of two lines:
%K: The main line, calculated using the formula (CurrentClose−LowestLow)/(HighestHigh−LowestLow)×100 . Highest and lowest price taken for 14 periods.
%D: A smoothed moving average of %K, often used as a signal line.
Strategy logic assumes that on 1D time frame it’s uptrend in %K line is above the %D line. Moreover, we can consider long trade only in %K line is below 80. It means that in overbought state the long trade will not be opened due to higher probability of pullback or even major trend reversal. If these conditions are met we are going to our working (lower) time frame.
On the chosen time frame, we remind you that for correct work of this strategy you shall use 30min – 4h time frames, MACD line shall cross over it’s signal line. The MACD (Moving Average Convergence Divergence) is a popular momentum and trend-following indicator used in technical analysis. It helps traders identify changes in the strength, direction, momentum, and duration of a trend in a stock's price.
The MACD consists of three components:
MACD Line: This is the difference between a short-term Exponential Moving Average (EMA) and a long-term EMA, typically calculated as: MACD Line=12-period EMA−26-period
Signal Line: This is a 9-period EMA of the MACD Line, which helps to identify buy or sell signals. When the MACD Line crosses above the Signal Line, it can be a bullish signal (suggesting a buy); when it crosses below, it can be a bearish signal (suggesting a sell).
Histogram: The histogram shows the difference between the MACD Line and the Signal Line, visually representing the momentum of the trend. Positive histogram values indicate increasing bullish momentum, while negative values indicate increasing bearish momentum.
In our script we are interested in only MACD and signal lines. When MACD line crosses signal line there is a high chance that short-term trend reversed to the upside. We use this strategy on 45 min time frame.
ATR is used to adjust the strategy risk management to the current market volatility. If volatility is low, we don’t need the large stop loss to understand the there is a high probability that we made a mistake opening the trade. User can setup the settings ATR Stop Loss and ATR Trailing Profit Activation Level to realize his own risk to reward preferences, but the unique feature of a strategy is that after reaching trailing profit activation level strategy is trying to follow the trend until it is likely to be finished instead of using fixed risk management settings. It allows sometimes to be involved in the large movements.
Backtest Results
Operating window: Date range of backtests is 2023.01.01 - 2024.08.01. It is chosen to let the strategy to close all opened positions.
Commission and Slippage: Includes a standard Binance commission of 0.1% and accounts for possible slippage over 5 ticks.
Initial capital: 10000 USDT
Percent of capital used in every trade: 30%
Maximum Single Position Loss: -4.79%
Maximum Single Profit: +20.14%
Net Profit: +2361.33 USDT (+44.72%)
Total Trades: 123 (44.72% win rate)
Profit Factor: 1.623
Maximum Accumulated Loss: 695.80 USDT (-5.48%)
Average Profit per Trade: 19.20 USDT (+0.59%)
Average Trade Duration: 30 hours
These results are obtained with realistic parameters representing trading conditions observed at major exchanges such as Binance and with realistic trading portfolio usage parameters.
How to Use
Add the script to favorites for easy access.
Apply to the desired timeframe between 30 min and 4 hours and chart (optimal performance observed on 45 min BTC/USDT).
Configure settings using the dropdown choice list in the built-in menu.
Set up alerts to automate strategy positions through web hook with the text: {{strategy.order.alert_message}}
Disclaimer:
Educational and informational tool reflecting Skyrex commitment to informed trading. Past performance does not guarantee future results. Test strategies in a simulated environment before live implementation

Double CCI Confirmed Hull Moving Average Reversal StrategyOverview
The Double CCI Confirmed Hull Moving Average Strategy utilizes hull moving average (HMA) in conjunction with two commodity channel index (CCI) indicators: the slow and fast to increase the probability of entering when the short and mid-term uptrend confirmed. The main idea is to wait until the price breaks the HMA while both CCI are showing that the uptrend has likely been already started. Moreover, strategy uses exponential moving average (EMA) to trail the price when it reaches the specific level. The strategy opens only long trades.
Unique Features
Dynamic stop-loss system: Instead of fixed stop-loss level strategy utilizes average true range (ATR) multiplied by user given number subtracted from the position entry price as a dynamic stop loss level.
Configurable Trading Periods: Users can tailor the strategy to specific market windows, adapting to different market conditions.
Double trade setup confirmation: Strategy utilizes two different period CCI indicators to confirm the breakouts of HMA.
Trailing take profit level: After reaching the trailing profit activation level scrip activate the trailing of long trade using EMA. More information in methodology.
Methodology
The strategy opens long trade when the following price met the conditions:
Short-term period CCI indicator shall be above 0.
Long-term period CCI indicator shall be above 0.
Price shall cross the HMA and candle close above it with the same candle
When long trade is executed, strategy set the stop-loss level at the price ATR multiplied by user-given value below the entry price. This level is recalculated on every next candle close, adjusting to the current market volatility.
At the same time strategy set up the trailing stop validation level. When the price crosses the level equals entry price plus ATR multiplied by user-given value script starts to trail the price with EMA. If price closes below EMA long trade is closed. When the trailing starts, script prints the label “Trailing Activated”.
Strategy settings
In the inputs window user can setup the following strategy settings:
ATR Stop Loss (by default = 1.75)
ATR Trailing Profit Activation Level (by default = 2.25)
CCI Fast Length (by default = 25, used for calculation short term period CCI
CCI Slow Length (by default = 50, used for calculation long term period CCI)
Hull MA Length (by default = 34, period of HMA, which shall be broken to open trade)
Trailing EMA Length (by default = 20)
User can choose the optimal parameters during backtesting on certain price chart.
Justification of Methodology
Before understanding why this particular combination of indicator has been chosen let's briefly explain what is CCI and HMA.
The Commodity Channel Index (CCI) is a momentum-based technical indicator used in trading to measure a security's price relative to its average price over a given period. Developed by Donald Lambert in 1980, the CCI is primarily used to identify cyclical trends in a security, helping traders to spot potential buying or selling opportunities.
The CCI formula is:
CCI = (Typical Price − SMA) / (0.015 × Mean Deviation)
Typical Price (TP): This is calculated as the average of the high, low, and closing prices for the period.
Simple Moving Average (SMA): This is the average of the Typical Prices over a specific number of periods.
Mean Deviation: This is the average of the absolute differences between the Typical Price and the SMA.
The result is a value that typically fluctuates between +100 and -100, though it is not bounded and can go higher or lower depending on the price movement.
The Hull Moving Average (HMA) is a type of moving average that was developed by Alan Hull to improve upon the traditional moving averages by reducing lag while maintaining smoothness. The goal of the HMA is to create an indicator that is both quick to respond to price changes and less prone to whipsaws (false signals).
How the Hull Moving Average is Calculated?
The Hull Moving Average is calculated using the following steps:
Weighted Moving Average (WMA): The HMA starts by calculating the Weighted Moving Average (WMA) of the price data over a period square root of n (sqrt(n))
Speed Adjustment: A WMA is then calculated for half of the period n/2, and this is multiplied by 2 to give more weight to recent prices.
Lag Reduction: The WMA of the full period n is subtracted from the doubled n/2 WMA.
Final Smoothing: To smooth the result and reduce noise, a WMA is calculated for the square root of the period n.
The formula can be represented as:
HMA(n) = WMA(WMA(n/2) × 2 − WMA(n), sqrt(n))
The Weighted Moving Average (WMA) is a type of moving average that gives more weight to recent data points, making it more responsive to recent price changes than a Simple Moving Average (SMA). In a WMA, each data point within the selected period is multiplied by a weight, with the most recent data receiving the highest weight. The sum of these weighted values is then divided by the sum of the weights to produce the WMA.
This strategy leverages HMA of user given period as a critical level which shall be broken to say that probability of trend change to the upside increased. HMA reacts faster than EMA or SMA to the price change, that’s why it increases chances to enter new trade earlier. Long-term period CCI helps to have an approximation of mid-term trend. If it’s above 0 the probability of uptrend increases. Short-period CCI allows to have an approximation of short-term trend reversal from down to uptrend. This approach increases chances to have a long trade setup in the direction of mid-term trend when the short-term trend starts to reverse.
ATR is used to adjust the strategy risk management to the current market volatility. If volatility is low, we don’t need the large stop loss to understand the there is a high probability that we made a mistake opening the trade. User can setup the settings ATR Stop Loss and ATR Trailing Profit Activation Level to realize his own risk to reward preferences, but the unique feature of a strategy is that after reaching trailing profit activation level strategy is trying to follow the trend until it is likely to be finished instead of using fixed risk management settings. It allows sometimes to be involved in the large movements. It’s also important to make a note, that script uses HMA to enter the trade, but for trailing it leverages EMA. It’s used because EMA has no such fast reaction to price move which increases probability not to be stopped out from any significant uptrend move.
Backtest Results
Operating window: Date range of backtests is 2022.07.01 - 2024.08.01. It is chosen to let the strategy to close all opened positions.
Commission and Slippage: Includes a standard Binance commission of 0.1% and accounts for possible slippage over 5 ticks.
Initial capital: 10000 USDT
Percent of capital used in every trade: 100%
Maximum Single Position Loss: -4.67%
Maximum Single Profit: +19.66%
Net Profit: +14897.94 USDT (+148.98%)
Total Trades: 104 (36.54% win rate)
Profit Factor: 2.312
Maximum Accumulated Loss: 1302.66 USDT (-9.58%)
Average Profit per Trade: 143.25 USDT (+0.96%)
Average Trade Duration: 34 hours
These results are obtained with realistic parameters representing trading conditions observed at major exchanges such as Binance and with realistic trading portfolio usage parameters.
How to Use
Add the script to favorites for easy access.
Apply to the desired timeframe and chart (optimal performance observed on 2h BTC/USDT).
Configure settings using the dropdown choice list in the built-in menu.
Set up alerts to automate strategy positions through web hook with the text: {{strategy.order.alert_message}}
Disclaimer:
Educational and informational tool reflecting Skyrex commitment to informed trading. Past performance does not guarantee future results. Test strategies in a simulated environment before live implementation

Simple Fibonacci Retracement Strategy This strategy uses Fibonacci retracement to identify key levels in the market and helps traders find good entry and exit points. By understanding and using this strategy, traders can improve their trading decisions and increase their chances of success in the market.
This strategy, called the "Simple Fibonacci Retracement Strategy," is designed to help traders identify potential entry and exit points in the market based on Fibonacci retracement levels. The code is written in Pine Script and runs on the TradingView platform.
Overall Function
The strategy uses Fibonacci retracement levels to identify potential support and resistance levels in the market. This helps traders find good entry and exit points for trades, as well as set stop-loss and take-profit levels to minimize risk and maximize gains.
Main Components of the Code
1. Input Parameters
Lookback Period: The number of bars used to identify the highest high and lowest low.
Fibonacci Direction: The choice of whether Fibonacci levels are calculated from top to bottom or bottom to top.
Fibonacci Levels: Specific Fibonacci levels (23.6%, 38.2%, 50%, 61.8%) used to identify important price levels.
Take Profit and Stop Loss: The number of pips used to set take profit and stop loss levels.
2. Identification of Highest and Lowest Points
The code uses the lookback period to find the highest high (highestHigh) and the lowest low (lowestLow). These levels form the basis for calculating the Fibonacci levels.
3. Calculation of Fibonacci Levels
Based on the direction chosen by the user, the code calculates the various Fibonacci levels (0%, 23.6%, 38.2%, 50%, 61.8%, 100%).
4. Trading Logic
Long Signal: Generated when the price crosses above the 61.8% Fibonacci level from bottom to top.
Short Signal: Generated when the price crosses below the 38.2% Fibonacci level from top to bottom.
When a long or short signal is generated, the strategy opens a position and sets take profit and stop loss levels based on the input parameters.
5. Visualization
The strategy plots the Fibonacci levels on the chart to provide a visual representation of the calculated levels. This helps traders see where the levels are in relation to the current price.
6. Alerts
The code also has functionality to create alerts (commented out), which can notify traders of buy or sell signals.
How to Use the Strategy
Configure Parameters: Adjust the lookback period, Fibonacci direction, and levels for take profit and stop loss to your preferences.
View the Chart: The Fibonacci levels will be plotted on the chart, providing a visual overview of potential support and resistance levels.
Trade Signals: Follow the generated buy and sell signals. Set your parameters in settings and adjust according to the generated buy and sell signals in the strategy tester. The strategy will automatically set your take profit and stop loss levels.
Evaluation and Adjustment: Monitor the performance of the strategy and make adjustments as needed to optimize the results.
Norwegian
Denne strategien, kalt "Simple Fibonacci Retracement Strategy", er designet for å hjelpe tradere med å identifisere mulige inngangs- og utgangspunkter i markedet basert på Fibonacci-retracementnivåer. Koden er skrevet i Pine Script og kjøres på TradingView-plattformen.
Overordnet Funksjon
Strategien bruker Fibonacci-retracementnivåer for å identifisere potensielle støtte- og motstandsnivåer i markedet. Dette hjelper tradere med å finne gode inngangs- og utgangspunkter for handler, samt å sette stop-loss og take-profit nivåer for å minimere risiko og maksimere gevinster.
Hovedkomponenter i Koden
1. Input Parametere
Lookback Period: Antall barer som brukes til å identifisere høyeste høydepunkt og laveste lavpunkt.
Fibonacci Direction: Valg om Fibonacci-nivåene skal beregnes fra topp til bunn eller bunn til topp.
Fibonacci Levels: Spesifikke Fibonacci-nivåer (23.6%, 38.2%, 50%, 61.8%) som brukes til å identifisere viktige prisnivåer.
Take Profit og Stop Loss: Antall pips som brukes til å sette take profit og stop loss nivåer.
2. Identifikasjon av Høyeste og Laveste Punkt
Koden bruker lookback perioden for å finne det høyeste høydepunktet (highestHigh) og det laveste lavpunktet (lowestLow). Disse nivåene er grunnlaget for å beregne Fibonacci-nivåene.
3. Beregning av Fibonacci-nivåer
Basert på retningen valgt av brukeren, beregner koden de forskjellige Fibonacci-nivåene (0%, 23.6%, 38.2%, 50%, 61.8%, 100%).
4. Handelslogikk
Long Signal: Genereres når prisen krysser over 61.8% Fibonacci-nivået fra bunn til topp.
Short Signal: Genereres når prisen krysser under 38.2% Fibonacci-nivået fra topp til bunn.
Når et long eller short signal genereres, åpner strategien en posisjon og setter take profit og stop loss nivåer basert på inputparametrene.
5. Visualisering
Strategien plottet Fibonacci-nivåene på chartet for å gi en visuell representasjon av de beregnede nivåene. Dette hjelper tradere med å se hvor nivåene er i forhold til den nåværende prisen.
6. Varsler
Koden har også funksjonalitet for å lage varsler (kommentert ut), som kan varsle tradere om kjøps- eller salgssignaler.
Slik Bruker Du Strategien
Konfigurer Parametere: Juster lookback perioden, Fibonacci-retningen, og nivåene for take profit og stop loss til dine preferanser.
Se på Chartet: Fibonacci-nivåene vil bli plottet på chartet, noe som gir deg en visuell oversikt over potensielle støtte- og motstandsnivåer.
Handle Signaler: Sett dine parametere i innstillinger og juster etter genererte kjøps- og salgssignalene i strategy testeren. Strategien vil automatisk sette dine take profit og stop loss nivåer.
Evaluering og Justering: Overvåk ytelsen til strategien og gjør justeringer etter behov for å optimalisere resultatene.

Bollinger Bands Enhanced StrategyOverview
The common practice of using Bollinger bands is to use it for building mean reversion or squeeze momentum strategies. In the current script Bollinger Bands Enhanced Strategy we are trying to combine the strengths of both strategies types. It utilizes Bollinger Bands indicator to buy the local dip and activates trailing profit system after reaching the user given number of Average True Ranges (ATR). Also it uses 200 period EMA to filter trades only in the direction of a trend. Strategy can execute only long trades.
Unique Features
Trailing Profit System: Strategy uses user given number of ATR to activate trailing take profit. If price has already reached the trailing profit activation level, scrip will close long trade if price closes below Bollinger Bands middle line.
Configurable Trading Periods: Users can tailor the strategy to specific market windows, adapting to different market conditions.
Major Trend Filter: Strategy utilizes 100 period EMA to take trades only in the direction of a trend.
Flexible Risk Management: Users can choose number of ATR as a stop loss (by default = 1.75) for trades. This is flexible approach because ATR is recalculated on every candle, therefore stop-loss readjusted to the current volatility.
Methodology
First of all, script checks if currently price is above the 200-period exponential moving average EMA. EMA is used to establish the current trend. Script will take long trades on if this filtering system showing us the uptrend. Then the strategy executes the long trade if candle’s low below the lower Bollinger band. To calculate the middle Bollinger line, we use the standard 20-period simple moving average (SMA), lower band is calculated by the substruction from middle line the standard deviation multiplied by user given value (by default = 2).
When long trade executed, script places stop-loss at the price level below the entry price by user defined number of ATR (by default = 1.75). This stop-loss level recalculates at every candle while trade is open according to the current candle ATR value. Also strategy set the trailing profit activation level at the price above the position average price by user given number of ATR (by default = 2.25). It is also recalculated every candle according to ATR value. When price hit this level script plotted the triangle with the label “Strong Uptrend” and start trail the price at the middle Bollinger line. It also started to be plotted as a green line.
When price close below this trailing level script closes the long trade and search for the next trade opportunity.
Risk Management
The strategy employs a combined and flexible approach to risk management:
It allows positions to ride the trend as long as the price continues to move favorably, aiming to capture significant price movements. It features a user-defined ATR stop loss parameter to mitigate risks based on individual risk tolerance. By default, this stop-loss is set to a 1.75*ATR drop from the entry point, but it can be adjusted according to the trader's preferences.
There is no fixed take profit, but strategy allows user to define user the ATR trailing profit activation parameter. By default, this stop-loss is set to a 2.25*ATR growth from the entry point, but it can be adjusted according to the trader's preferences.
Justification of Methodology
This strategy leverages Bollinger bangs indicator to open long trades in the local dips. If price reached the lower band there is a high probability of bounce. Here is an issue: during the strong downtrend price can constantly goes down without any significant correction. That’s why we decided to use 200-period EMA as a trend filter to increase the probability of opening long trades during major uptrend only.
Usually, Bollinger Bands indicator is using for mean reversion or breakout strategies. Both of them have the disadvantages. The mean reversion buys the dip, but closes on the return to some mean value. Therefore, it usually misses the major trend moves. The breakout strategies usually have the issue with too high buy price because to have the breakout confirmation price shall break some price level. Therefore, in such strategies traders need to set the large stop-loss, which decreases potential reward to risk ratio.
In this strategy we are trying to combine the best features of both types of strategies. Script utilizes ate ATR to setup the stop-loss and trailing profit activation levels. ATR takes into account the current volatility. Therefore, when we setup stop-loss with the user-given number of ATR we increase the probability to decrease the number of false stop outs. The trailing profit concept is trying to add the beat feature from breakout strategies and increase probability to stay in trade while uptrend is developing. When price hit the trailing profit activation level, script started to trail the price with middle line if Bollinger bands indicator. Only when candle closes below the middle line script closes the long trade.
Backtest Results
Operating window: Date range of backtests is 2020.10.01 - 2024.07.01. It is chosen to let the strategy to close all opened positions.
Commission and Slippage: Includes a standard Binance commission of 0.1% and accounts for possible slippage over 5 ticks.
Initial capital: 10000 USDT
Percent of capital used in every trade: 30%
Maximum Single Position Loss: -9.78%
Maximum Single Profit: +25.62%
Net Profit: +6778.11 USDT (+67.78%)
Total Trades: 111 (48.65% win rate)
Profit Factor: 2.065
Maximum Accumulated Loss: 853.56 USDT (-6.60%)
Average Profit per Trade: 61.06 USDT (+1.62%)
Average Trade Duration: 76 hours
These results are obtained with realistic parameters representing trading conditions observed at major exchanges such as Binance and with realistic trading portfolio usage parameters.
How to Use
Add the script to favorites for easy access.
Apply to the desired timeframe and chart (optimal performance observed on 4h BTC/USDT).
Configure settings using the dropdown choice list in the built-in menu.
Set up alerts to automate strategy positions through web hook with the text: {{strategy.order.alert_message}}
Disclaimer:
Educational and informational tool reflecting Skyrex commitment to informed trading. Past performance does not guarantee future results. Test strategies in a simulated environment before live implementation

CCI and MACD Auto Trading Strategy with Risk/RewardOverview:
This strategy combines the Commodity Channel Index (CCI) and the Moving Average Convergence Divergence (MACD) indicators to automate trading decisions. It dynamically sets stop-loss and take-profit levels based on recent lows and highs, ensuring a risk/reward ratio of 1:1.5. This script aims to leverage trend and momentum signals while maintaining effective risk management.
Originality and Usefulness:
This script is not just a simple mashup of CCI and MACD indicators; it incorporates dynamic risk management by setting stop-loss and take-profit levels based on recent price action. This approach helps traders to:
・Identify potential trend reversals using the combination of CCI and MACD signals.
・Manage trades effectively by setting realistic stop-loss and take-profit levels based on recent market data.
・Maintain a balanced risk/reward ratio, which is essential for sustainable trading.
Indicators Used:
・CCI (Commodity Channel Index):
・Measures the deviation of the price from its average over a specified period, typically ranging from -100 to +100.
・Helps identify overbought and oversold conditions.
・MACD (Moving Average Convergence Divergence):
・Utilizes the difference between short-term and long-term moving averages to indicate trend strength and direction.
・Provides momentum signals that can be used for timing entries and exits.
How It Works:
Entry Conditions:
Long Entry:
・The MACD histogram is above zero.
・The CCI crosses above the -100 line.
Short Entry:
・The MACD histogram is below zero.
・The CCI crosses below the +100 line.
Exit Conditions:
Long Positions:
・The stop-loss is set at the recent low.
・The take-profit is set at 1.5 times the distance between the entry price and the stop-loss.
Short Positions:
・The stop-loss is set at the recent high.
・The take-profit is set at 1.5 times the distance between the entry price and the stop-loss.
Risk Management:
・The script dynamically adjusts stop-loss and take-profit levels based on recent market data, ensuring that the risk/reward ratio is maintained at 1:1.5.
・This approach helps in managing the risk effectively while aiming for consistent profits.
Strategy Properties:
・Account Size: Configured for a realistic account size suitable for the average trader.
・Commission and Slippage: Includes settings for realistic commission and slippage to reflect real market conditions.
・Risk per Trade: Designed to risk no more than 5-10% of equity per trade, aligning with sustainable trading practices.
・Backtesting Results: Configured to generate a sufficient sample size (ideally more than 100 trades) for reliable backtesting results.
Revised Backtesting Settings
Ensure that your backtesting settings are realistic:
・Account Size: Set a realistic initial capital suitable for the average trader.
・Commission and Slippage: Include realistic commission fees and slippage.
・Risk Management: Ensure that each trade risks no more than 5-10% of the account equity.
・Sufficient Sample Size: Choose a dataset that will generate more than 100 trades to provide a robust sample size.

[XSO-Premium-X1]The indicator is a comprehensive, premium trading indicator designed to optimize your trading strategy through advanced price action analysis. By examining raw price data and market structure, it identifies key areas where price movements are likely to occur. This indicator serves as an essential trading companion, significantly reducing the time required for analysing price action and enabling you to place trades manually or via automated alerts.
Summary:
The indicator is a sophisticated tool crafted for analysing and predicting market trends using a variety of technical analysis techniques. It integrates multiple calculations, filters, and conditions to pinpoint optimal buy and sell signals, thereby assisting you in making well-informed decisions. The indicator emphasizes trend detection, sideways market identification, and signal generation, all while providing visual cues and alerts for trading actions.
The indicator leverages price action calculations to evaluate the market's bullish or bearish tendencies, ensuring that signals are only triggered when price action is strong enough.
This indicator performs extensive calculations, consolidating our top tools into a master signal generator that includes new, extensively tested methods previously unavailable to the public. Signals are confirmed when multiple factors, including price action, align. The indicator swiftly reacts to market changes, providing early signals at the first signs of a reversal.
HOW TO USE THE INDICATOR
Buy Signal
An orange “Buy Signal” will be plotted on the chart to indicate when the most opportunistic time is to place a trade. The indicator includes alert functionality so that you can be notified using the standard Trading View alert management options.
You will see indicated by the blue arrows on the above graph the entry or ‘buy’ signals. The signal is represented by an orange box and clearly states ‘Buy Signal’ inside it. You are also provided with the close price of the bar for which the entry/buy value should be.
Sell Signal
The sell signal will look at the market and detect changes within the trend. There are multiple tools that are used to determine the best time to exit/sell the trade. Our advanced algorithm continually monitors the current action and will determine the most desirable time to display a sell signal box which is blue in colour. This signal will be shown directly on the chart.
Indicated in blue arrows you will see the sell signals. Each signal has four values:
Type of Signal
The current close price of the current bar
The percentage change from the original corresponding buy signal
The previous buy signal’s close price
The indicator will look at many factors when determining if you should exit a trade. Look at the image below and you can see a typical buy and sell signal combination:
The bottom blue arrow indicates your entry or “buy” trade and the top blue arrow indicates your exit or “sell” trade. As you can see you would have entered/bought at 185.76 and exited/sold at 186.895 with a 0.61% margin.
Here is another example:
Hold Asset / Stop Loss
If the market moves to the downside after you have entered a trade then the indicator will track this. Our analysis may determine that the market may continue to fall or that simply the conditions are no longer favourable. Under these circumstances the indicator will flag for you to Hold Asset / Stop Loss. You can then make a decision if you want to hold onto your asset or sell it at a loss.
If you look on the chart below you can see an example of these signals plotted on the chart indicated by the blue arrow.
Alert Management
There are 3 alerts that are fixed. They are:
Buy Signal
Sell Signal
Hold Asset / Stop Loss
You can select which alert you would like to trigger from the standard trading view alert management page. For all buying you would select “Buy Signal” for all selling/take profit you would select “Sell Signal” and for holding the asset (maybe to set a limit order) or to sell the asset at a loss (stop loss), you would choose “Hold Asset / Stop Loss”.
Best Utilization of Our Indicator with Lower Time Frames
Our indicator is specifically designed to excel in short-term trading environments, making it the perfect tool for scalping strategies. For optimal performance, it is best utilized with time frames under 5 minutes . Here’s why our indicator is tailored for lower time frames and not suitable for long-term signalling:
1. Scalping Focus:
o Scalping involves making numerous trades throughout the trading session to capture small price movements. Our indicator is engineered to identify these quick, short-term opportunities, making it ideal for time frames of 3 minutes and under.
2. Rapid Signal Generation:
o Lower time frames generate more data points in a shorter period, allowing our indicator to provide rapid buy and sell signals. This frequency is crucial for scalpers who need to react quickly to market changes.
3. Minimized Market Noise:
o While lower time frames can be more volatile, our indicator includes filters to minimize market noise and focus on significant trading signals. This feature ensures that you receive reliable signals even in fast-paced trading environments.
Suitable Markets
This indicator is versatile and suitable for all markets, offering comprehensive analysis and reliable signals for various trading environments. Its advanced features and customizable settings ensure optimal performance across different market conditions, making it an essential tool for traders in any market.
Strategies
This indicator is ideal for both scalping whilst taking long positions, providing precise, timely signals for short-term trades while also identifying strong trends. Its versatility and advanced features make it a valuable tool for traders with diverse strategies.
What makes our indicator different?
Our indicator incorporates predefined parameters tailored to identify opportunities within a long strategy, rendering this indicator particularly advantageous for traders focused on long positions. Upon identifying a buy position, the indicator issues a buy signal and subsequently initiates asset tracking. A sell signal is generated only when the indicator identifies substantial uncertainty regarding the continuation of the upward trend. Its simple to use.

Support and Resistance Breakouts By RICHIESupport and resistance are fundamental concepts in technical analysis used to identify price levels on charts that act as barriers, preventing the price of an asset from getting pushed in a certain direction. Here’s a detailed description of each and how breakout strategies are typically used:
Support
Support is a price level where a downtrend can be expected to pause due to a concentration of demand. As the price of an asset drops, it hits a level where buyers tend to step in, causing the price to rebound.
Support Level Identification: Support levels are identified by looking at historical data where prices have repeatedly fallen to a certain level but have then rebounded.
Strength of Support: The more times an asset price hits a support level without breaking below it, the stronger that support level is considered to be.
Resistance
Resistance is a price level where an uptrend can be expected to pause due to a concentration of selling interest. As the price of an asset increases, it hits a level where sellers tend to step in, causing the price to drop.
Resistance Level Identification: Resistance levels are identified by looking at historical data where prices have repeatedly risen to a certain level but have then fallen back.
Strength of Resistance: The more times an asset price hits a resistance level without breaking above it, the stronger that resistance level is considered to be.
Breakouts
A breakout occurs when the price moves above a resistance level or below a support level with increased volume. Breakouts can be significant because they suggest a change in supply and demand dynamics, often leading to strong price movements.
Breakout Above Resistance: Indicates a bullish market sentiment. Traders often interpret this as a sign to enter a long position (buy).
Breakout Below Support: Indicates a bearish market sentiment. Traders often interpret this as a sign to enter a short position (sell).
Breakout Trading Strategies
Confirmation: Wait for a candle to close beyond the support or resistance level to confirm the breakout.
Volume: Increased volume on a breakout adds credibility, suggesting that the price move is supported by strong buying or selling interest.
Retest: Sometimes, after a breakout, the price will return to the breakout level to test it as a new support or resistance. This retest offers another entry point.
Stop-Loss: Place stop-loss orders just below the resistance (for long positions) or above the support (for short positions) to limit potential losses in case of a false breakout.
Take-Profit: Identify target levels for taking profits. These can be set based on previous support/resistance levels or using tools like Fibonacci retracements.

Enhanced Forex IndicatorDescription of the "Enhanced Forex Indicator"
The "Enhanced Forex Indicator" is designed for traders who want a comprehensive technical analysis tool on the TradingView platform. This script integrates Exponential Moving Averages (EMAs), support and resistance zones, and candlestick pattern recognition to provide actionable trading signals, particularly useful for Forex and other financial markets. The script is suitable for intraday trading and swing trading.
Components of the Indicator
Exponential Moving Averages (EMAs):
Short EMA (Blue Line): Faster responding average, good for identifying recent trend changes.
Long EMA (Red Line): Slower moving average, helps in confirming longer-term trends.
Support and Resistance Zones:
Resistance Zone (Red): Area where potential selling pressure could overcome buying pressure, halting price increases temporarily or reversing them.
Support Zone (Green): Area where potential buying pressure could overcome selling pressure, supporting prices and preventing them from falling further.
Candlestick Patterns:
Bullish Engulfing Pattern (Green Triangle Up 'BE'): Suggests a potential upward reversal or start of a bullish trend.
Bearish Engulfing Pattern (Red Triangle Down 'BE'): Indicates a potential downward reversal or start of a bearish trend.
Buy/Sell Signals:
Buy Signal (Green Label 'BUY'): Triggered when the price is above both EMAs and a bullish engulfing pattern is detected.
Sell Signal (Red Label 'SELL'): Triggered when the price is below both EMAs and a bearish engulfing pattern is detected.
Trading Setup:
Entry: Consider entering a buy position when the 'BUY' signal appears, indicating bullish conditions. Enter a sell position when the 'SELL' signal appears, indicating bearish conditions.
Exit: Look for closing signals opposite your entry or use predefined take profit and stop loss levels. For instance, exit a buy position on a 'SELL' signal or when the price drops below the support zone.
Risk Management:
Set stop losses just below the support zone for buy orders and above the resistance zone for sell orders to protect against significant losses.
Adjust position sizes according to your risk tolerance and account balance.
Considerations:
Use this indicator in conjunction with other analysis tools and fundamental data to confirm signals and strengthen your trading strategy.
Periodically backtest the strategy based on this indicator to ensure its effectiveness in current market conditions.
Optimization:
Adjust the lengths of the EMAs and the buffer size of the support and resistance zones to better fit the asset's volatility and your trading timeframe.

Position Size CalculatorThe provided Pine Script is a custom indicator titled "Position Size Calculator" designed to assist traders in calculating the appropriate size of a trading position based on predefined risk parameters. This script is intended to be overlaid on a trading chart, as indicated by `overlay=true`, allowing traders to visualize and adjust their risk and position size directly within the context of their trading strategy.
What It Does:
The core functionality of this script revolves around calculating the position size a trader should take based on three input parameters:
**Risk in USD (`Risk`)**: This represents the amount of money the trader is willing to risk on a single trade.
**Entry Price (`EntryPrice`)**: The price at which the trader plans to enter the market.
**Stop Loss (`StopLoss`)**: The price at which the trader plans to exit the market should the trade move against them, effectively limiting their loss.
The script calculates the position size using a function named `calculatePositionSize`, which performs the following steps:
It first calculates the `expectedLoss` by taking 90% (`0.9`) of the input risk. This implies that the script factors in a safety margin, assuming traders are willing to risk up to 90% of their stated risk amount per trade.
It then calculates the position size based on the distance between the Entry Price and the Stop Loss. This calculation adjusts based on whether the Entry Price is higher or lower than the Stop Loss, ensuring that the position size fits the risk profile regardless of trade direction.
The function returns several values: `risk`, `entryPrice`, `stopLoss`, `expectedLoss`, and `size`, which are then plotted on the chart.
How It Does It:
**Expected Loss Calculation**: By reducing the risk by 10% before calculating position size, the script provides a buffer to account for slippage or to ensure the trader does not fully utilize their risk budget on a single trade.
**Position Size Calculation**: The script calculates position size by dividing the adjusted risk (`expectedLoss`) by the price difference between the Entry Price and Stop Loss. This gives a quantitative measure of how many units of the asset can be bought or sold while staying within the risk parameters.
What Traders Can Use It For:
Traders can use this Position Size Calculator for several purposes:
- **Risk Management**: By determining the appropriate position size, traders can ensure that they do not overexpose themselves to market risk on a single trade.
- **Trade Planning**: Before entering a trade, the script allows traders to visualize their risk, entry, and exit points, helping them to make more informed decisions.
- **Consistency**: Using a standardized method for calculating position size helps traders maintain consistency in their trading approach, a key aspect of successful trading strategies.
- **Efficiency**: Automating the calculation of position size saves time and reduces the likelihood of manual calculation errors.
Overall, this Pine Script indicator is a practical tool for traders looking to implement strict risk management rules within their trading strategies, ensuring that each trade is sized appropriately according to their risk tolerance and market conditions.
