Quarterly Theory ICT 04 [TradingFinder] SSMT 4Quarter Divergence🔵 Introduction
Sequential SMT Divergence is an advanced price-action-based analytical technique rooted in the ICT (Inner Circle Trader) methodology. Its primary objective is to identify early-stage divergences between correlated assets within precise time structures. This tool not only breaks down market structure but also enables traders to detect engineered liquidity traps before the market reacts.
In simple terms, SMT (Smart Money Technique) occurs when two correlated assets—such as indices (ES and NQ), currency pairs (EURUSD and GBPUSD), or commodities (Gold and Silver)—exhibit different reactions at key price levels (swing highs or lows). This lack of alignment is often a sign of smart money manipulation and signals a lack of confirmation in the ongoing trend—hinting at an imminent reversal or at least a pause in momentum.
In its Sequential form, SMT divergences are examined through a more granular temporal lens—between intraday quarters (Q1 through Q4). When SMT appears at the transition from one quarter to another (e.g., Q1 to Q2 or Q3 to Q4), the signal becomes significantly more powerful, often aligning with a critical phase in the Quarterly Theory—a framework that segments market behavior into four distinct phases: Accumulation, Manipulation, Distribution, and Reversal/Continuation.
For instance, a Bullish SMT forms when one asset prints a new low while its correlated counterpart fails to break the corresponding low from the previous quarter. This usually indicates absorption of selling pressure and the beginning of accumulation by smart money. Conversely, a Bearish SMT arises when one asset makes a higher high, but the second asset fails to confirm, signaling distribution or a fake-out before a decline.
However, SMT alone is not enough. To confirm a true Market Structure Break (MSB), the appearance of a Precision Swing Point (PSP) is essential—a specific candlestick formation on a lower timeframe (typically 5 to 15 minutes) that reveals the entry of institutional participants. The combination of SMT and PSP provides a more accurate entry point and better understanding of premium and discount zones.
The Sequential SMT Indicator, introduced in this article, dynamically scans charts for such divergence patterns across multiple sessions. It is applicable to various markets including Forex, crypto, commodities, and indices, and shows particularly strong performance during mid-week sessions (Wednesdays and Thursdays)—when most weekly highs and lows tend to form.
Bullish Sequential SMT :
Bearish Sequential SMT :
🔵 How to Use
The Sequential SMT (SSMT) indicator is designed to detect time and structure-based divergences between two correlated assets. This divergence occurs when both assets print a similar swing (high or low) in the previous quarter (e.g., Q3), but in the current quarter (e.g., Q4), only one asset manages to break that swing level—while the other fails to reach it.
This temporal mismatch is precisely identified by the SSMT indicator and often signals smart money activity, a market phase transition, or even the presence of an engineered liquidity trap. The signal becomes especially powerful when paired with a Precision Swing Point (PSP)—a confirming candle on lower timeframes (5m–15m) that typically indicates a market structure break (MSB) and the entry of smart liquidity.
🟣 Bullish Sequential SMT
In the previous quarter, both assets form a similar swing low.
In the current quarter, one asset (e.g., EURUSD) breaks that low and trades below it.
The other asset (e.g., GBPUSD) fails to reach the same low, preserving the structure.
This time-based divergence reflects declining selling pressure, potential absorption, and often marks the end of a manipulation phase and the start of accumulation. If confirmed by a bullish PSP candle, it offers a strong long opportunity, with stop-losses defined just below the swing low.
🟣 Bearish Sequential SMT
In the previous quarter, both assets form a similar swing high.
In the current quarter, one asset (e.g., NQ) breaks above that high.
The other asset (e.g., ES) fails to reach that high, remaining below it.
This type of divergence signals weakening bullish momentum and the likelihood of distribution or a fake-out before a price drop. When followed by a bearish PSP candle, it sets up a strong shorting opportunity with targets in the discount zone and protective stops placed above the swing high.
🔵 Settings
⚙️ Logical Settings
Quarterly Cycles Type : Select the time segmentation method for SMT analysis.
Available modes include: Yearly, Monthly, Weekly, Daily, 90 Minute, and Micro.
These define how the indicator divides market time into Q1–Q4 cycles.
Symbol : Choose the secondary asset to compare with the main chart asset (e.g., XAUUSD, US100, GBPUSD).
Pivot Period : Sets the sensitivity of the pivot detection algorithm. A smaller value increases responsiveness to price swings.
Activate Max Pivot Back : When enabled, limits the maximum number of past pivots to be considered for divergence detection.
Max Pivot Back Length : Defines how many past pivots can be used (if the above toggle is active).
Pivot Sync Threshold : The maximum allowed difference (in bars) between pivots of the two assets for them to be compared.
Validity Pivot Length : Defines the time window (in bars) during which a divergence remains valid before it's considered outdated.
🎨 Display Settings
Show Cycle :Toggles the visual display of the current Quarter (Q1 to Q4) based on the selected time segmentation
Show Cycle Label : Shows the name (e.g., "Q2") of each detected Quarter on the chart.
Show Bullish SMT Line : Draws a line connecting the bullish divergence points.
Show Bullish SMT Label : Displays a label on the chart when a bullish divergence is detected.
Bullish Color : Sets the color for bullish SMT markers (label, shape, and line).
Show Bearish SMT Line : Draws a line for bearish divergence.
Show Bearish SMT Label : Displays a label when a bearish SMT divergence is found.
Bearish Color : Sets the color for bearish SMT visual elements.
🔔 Alert Settings
Alert Name : Custom name for the alert messages (used in TradingView’s alert system).
Message Frequency :
All: Every signal triggers an alert.
Once Per Bar: Alerts once per bar regardless of how many signals occur.
Per Bar Close: Only triggers when the bar closes and the signal still exists.
Time Zone Display : Choose the time zone in which alert timestamps are displayed (e.g., UTC).
Bullish SMT Divergence Alert : Enable/disable alerts specifically for bullish signals.
Bearish SMT Divergence Alert : Enable/disable alerts specifically for bearish signals
🔵 Conclusion
The Sequential SMT (SSMT) indicator is a powerful and precise tool for identifying structural divergences between correlated assets within a time-based framework. Unlike traditional divergence models that rely solely on sequential pivot comparisons, SSMT leverages Quarterly Theory, in combination with concepts like liquidity sweeps, market structure breaks (MSB) and precision swing points (PSP), to provide a deeper and more actionable view of market dynamics.
By using SSMT, traders gain not only the ability to identify where divergence occurs, but also when it matters most within the market cycle. This empowers them to anticipate major moves or traps before they fully materialize, and position themselves accordingly in high-probability trade zones.
Whether you're trading Forex, crypto, indices, or commodities, the true strength of this indicator is revealed when used in sync with the Accumulation, Manipulation, Distribution, and Reversal phases of the market. Integrated with other confluence tools and market models, SSMT can serve as a core component in a professional, rule-based, and highly personalized trading strategy.
Komut dosyalarını "stop loss" için ara

ICT Judas + Silver Bullet🔰 ICT Judas + Silver Bullet Indicator (SMC-based)
Built for Prop Firm and High Win Rate Intraday Traders
This indicator identifies key institutional setups from Inner Circle Trader (ICT) and Smart Money Concepts (SMC) strategies, optimized for XAUUSD, EURUSD, and other high-volume pairs on the 5-minute chart.
📌 Core Features:
✅ Asian Range Box (02:00–08:00 SGT) – used as manipulation anchor
✅ London Killzone (14:00–16:00 SGT) – Judas Swing detection
✅ New York Killzone (22:30–23:30 SGT) – Silver Bullet setups
✅ Automatic Fair Value Gap (FVG) detection
✅ Liquidity sweep detection based on 20-bar EQH/EQL
✅ Entry + Stop Loss + Take Profit visualization with adjustable RR
✅ Alerts for Judas and Silver setups
✅ Perfect for prop firm scalping and intraday swing logic
🛠️ How It Works:
- Judas Swing: triggers when liquidity above the Asian high is swept during London Killzone
- Silver Bullet: triggers when liquidity below recent lows is swept during NY Killzone
- Entry shown via circle, SL and TP lines based on user-defined RR and stop-loss pip distance
- Designed to be paired with SMC/ICT OB/FVG confirmation entries
⚙️ Settings:
- Adjustable session times
- Toggle FVG display
- Set RR and SL pips to match prop firm rules
- Compatible with alert webhooks for Telegram
🕰️ Note:
All times are fixed to **SGT (GMT+8)**. If you're in another timezone, adjust your TradingView timezone accordingly or update the session inputs manually during Daylight Saving Time changes.
🔔 Alert-Ready:
Use alerts for live signals and pair with webhooks for automation.
🔍 Recommended Pairings:
XAUUSD, EURUSD, GBPUSD, NAS100 on M5 chart
📈 Win Rate Potential:
Backtested with high-probability setups aligned with prop firm daily goals. Best used with strict discipline and 1-2 setups per day.
—
Built with ❤️ by a trader, for traders looking for precision-based executions using ICT logic.

Lot Size TableLot Size Table Indicator – Pine Script (v5)
This TradingView script, “Lot Size Table,” creates a dynamic on-chart table that helps forex traders quickly calculate position sizes (lot sizes) for different capital and risk settings across various stop-loss (SL) pip scenarios.
🔧 Key Features:
📊 Real-time Forex Price Integration
Retrieves daily forex prices from OANDA for accurate lot size adjustments.
Instruments supported: USDJPY, USDCHF, AUDUSD, GBPUSD, NZDUSD, USDCAD, EURUSD.
🧠 Smart Lot Size Adjustments
Custom function adjustLotSize() adjusts lot sizes based on:
The currency of the instrument (e.g., JPY, GBP, AUD, etc.).
Special multiplier for symbols like US30 (e.g., ×8.5).
🧾 Flexible Capital & Risk Inputs
Supports 3 customizable capital groups, each with its own:
Capital amount
Risk percentage
📉 Multiple Stop-Loss (SL) Scenarios
Users input a comma-separated list of SL pip values (e.g., "20,25,30,...").
For each SL value, lot sizes are calculated for all 3 capital/risk combinations.
📋 Formatted On-Chart Table
Displays in a user-selected corner of the chart.
Customizable size, background color, and border.
Header row includes capital values and risk % (formatted to "k" if over 1,000).
Remaining rows show calculated lot sizes for each SL pip value.
📐 How It Works:
User Inputs: Capital, risk %, SL pip list, and table styling.
Calculation:
Lot size = (capital × risk%) / (SL pips × 10)
Adjusted based on instrument’s currency.
Display:
Table shows all SL pip scenarios and the corresponding adjusted lot sizes for each capital group.

Trend Targets [AlgoAlpha]OVERVIEW
This script combines a smoothed trend-following model with dynamic price rejection logic and ATR-based target projection to give traders a complete visual framework for trading trend continuations. It overlays on price and automatically detects potential trend shifts, confirms rejections near dynamic support/resistance, and displays calculated stop-loss and take-profit levels to support structured risk-reward management. Unlike traditional indicators that only show trend direction or signal entries, this tool brings together a unique mix of signal validation, volatility-aware positioning, and layered profit-taking to guide decision-making with more context.
CONCEPTS
The core trend logic is built on a custom Supertrend that uses an ATR-based band structure with long smoothing chains—first through a WMA, then an EMA—allowing the trend line to respond to major shifts while ignoring noise. A key addition is the use of rejection logic: the script looks for consolidation candles that "hug" the smoothed trend line and counts how many consecutive bars reject from it. This behavior often precedes significant moves. A user-defined threshold filters out weak tests and highlights only meaningful rejections.
FEATURES
Trend Detection : Automatically identifies trend direction using a smoothed Supertrend (WMA + EMA), with shape markers on trend shifts and color-coded bars for clarity.
Rejection Signals : Detects price rejections at the trend line after a user-defined number of consolidation bars; plots ▲/▼ icons to highlight strong continuation setups.
Target Projection : On trend confirmation, plots entry, stop-loss (ATR-based), and three dynamic take-profit levels based on customizable multiples.
Dynamic Updates : All levels (entry, SL, TP1–TP3) auto-adjust based on volatility and are labeled in real time on the chart.
Customization : Users can tweak trend parameters, rejection confirmation count, SL/TP ratios, smoothing lengths, and appearance settings.
Alerts : Built-in alerts for trend changes, rejection events, and when TP1, TP2, or TP3 are reached.
Chart Overlay : Plots directly on price chart with minimal clutter and clearly labeled levels for easy trading.
USAGE
Start by tuning the Supertrend factor and ATR period to fit your asset and timeframe—higher values will catch bigger swings, lower values catch faster moves. The confirmation count should match how tightly you want to filter rejection behavior—higher values make signals rarer but stronger. When the trend shifts, the indicator colors the bars and line accordingly, and if enabled, plots the full entry-TP-SL structure. Rejection markers appear only after enough qualifying bars confirm price pressure at the trend line. This is especially useful for continuation plays where price retests the trend but fails to break it. All calculations are based on volatility (ATR), so targets naturally adjust with market conditions. Add alerts to get notified of important signals even when away from the chart.

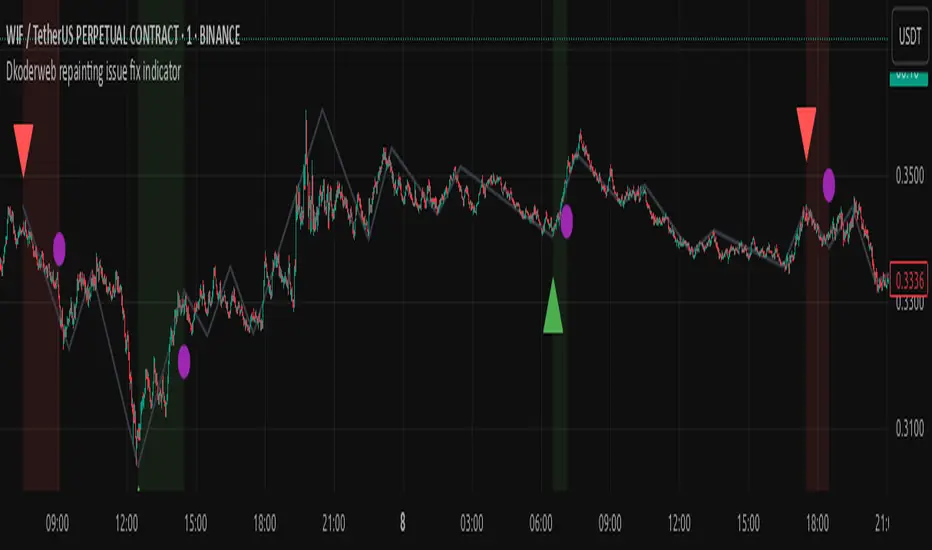
Dkoderweb repainting issue fix indicator# Harmonic Pattern Trading Indicator for TradingView
This indicator, called "Dkoderweb repainting issue fix indicator," is designed to identify and trade harmonic chart patterns in financial markets. It uses Fibonacci relationships between price points to detect various patterns like Bat, Butterfly, Gartley, Crab, Shark, and others.
## Key Features:
- **Pattern Recognition**: Automatically identifies over a dozen harmonic patterns including standard and anti-patterns
- **Customizable Settings**: Options to use Heikin Ashi candles and alternate timeframes
- **Fibonacci Levels**: Configurable display of key Fibonacci retracement levels
- **Entry and Exit Signals**: Clear buy/sell signals with visual triangles above/below bars
- **Trade Management**: Automatic take-profit and stop-loss levels based on Fibonacci relationships
- **Visual Aids**: Color-coded backgrounds to highlight active trade zones
- **Alert System**: Customizable alert messages for trade entries and exits
## How It Works:
The indicator uses a zigzag function to identify significant price pivots, then analyzes the relationships between these pivots to detect specific harmonic patterns. When a valid pattern forms and price reaches the entry zone (defined by a Fibonacci level), the indicator generates a trade signal.
Each pattern has specific Fibonacci ratio requirements between its points, and the indicator continuously scans for these relationships. Trade management is handled automatically with predefined take-profit and stop-loss levels.
This version specifically addresses repainting issues that are common in pattern-detection indicators, making it more reliable for both backtesting and live trading.
Buy/Sell EMA Trend Filter v6Buy/Sell EMA Trend Filter v6
This indicator provides a comprehensive trading system based on EMA crossovers with trend filtering for TradingView. It's designed to identify high-probability buy and sell signals by combining short-term crossovers with longer-term trend direction confirmation.
Key Features:
EMA Crossover System: Uses fast and slow EMAs (9 and 21 by default) to generate initial signals
Trend Filtering: Confirms signals with longer-term trend direction (50 and 200 EMAs)
Automatic TP/SL Calculation: Displays clear take profit and stop loss levels based on fixed risk points
Visual Alerts: Clear buy/sell markers at the point of signal with detailed labels
Risk Management: Pre-calculated risk-to-reward setup (default 1:2 ratio)
How It Works:
Buy Signal: When the fast EMA crosses above the slow EMA while the 50 EMA is above the 200 EMA (bullish trend)
Sell Signal: When the fast EMA crosses below the slow EMA while the 50 EMA is below the 200 EMA (bearish trend)
Customizable Parameters:
Fast EMA period (default: 9)
Slow EMA period (default: 21)
Trend EMA periods (default: 50 and 200)
Fixed risk in points (default: 20)
Reward ratio (default: 2.0)
The indicator displays clear entry points with predefined stop loss and take profit levels, making it ideal for traders looking for a systematic approach to the markets. Perfect for both day trading and swing trading timeframes.
This tool combines both trend following and momentum principles to filter out low-probability trades and focus on high-quality setups where the trend and momentum align.

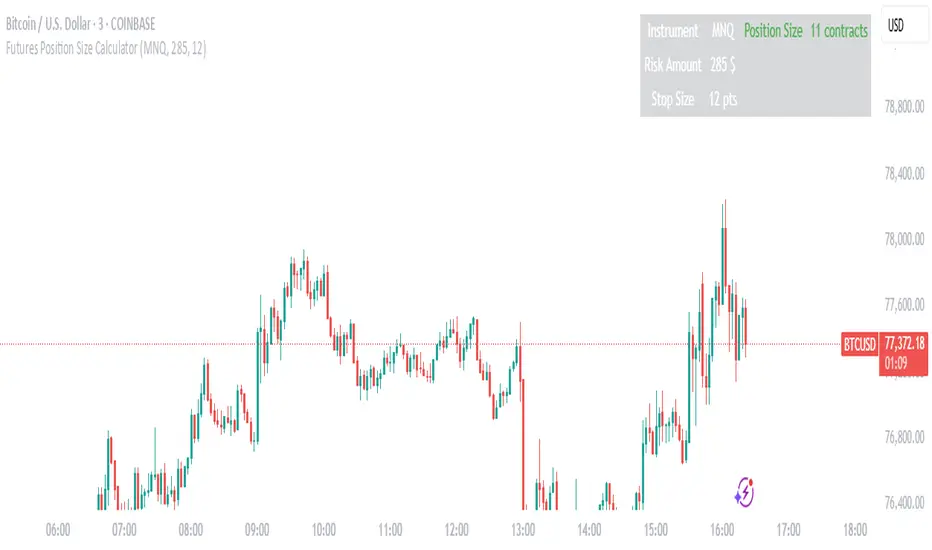
Futures Position Size CalculatorFutures Position Size Calculator by vmkhats
Streamline your futures trading risk management with this intuitive Pine Script utility designed for TradingView. Created by vmkhats, this tool automates position sizing calculations for popular futures contracts, ensuring precise risk control while eliminating manual errors.
Key Features:
Supports 15+ Instruments: Trade confidently with preconfigured settings for indices (ES, NQ, RTY), commodities (CL, GC), currencies (6E), and micro contracts (MES, MNQ, MCL).
Customizable Inputs: Set your risk amount (e.g., $1,000) and stop-loss size in points, tailored to your strategy.
Automatic Calculations: The script computes stop-loss size in ticks, risk per contract, and optimal position size using floor rounding to prevent over-leveraging.
Clear Visual Output: A table displays results (instrument, risk, stop size, contracts) with color-coded alerts for invalid configurations (e.g., zero position size).
Ideal for both novice and seasoned traders, this utility enforces disciplined risk management while saving time. Enhance your TradingView workspace with this essential tool and trade futures with confidence.
Created by vmkhats — ensuring traders stay precise, proactive, and risk-aware.
TP/SL Percentage & RR Visual ToolThis tool is designed to help traders visually and statistically assess their trade setup by calculating Stop Loss (SL), Take Profit (TP), and Risk-to-Reward (RR) based on percentage inputs from the current price.
🔧 How It Works:
Uses the current candle’s close price as your entry.
Calculates TP and SL as percentage-based levels (e.g., 1% SL, 1.5% TP).
Displays horizontal lines and labels on the chart for TP and SL (only on the latest candle to reduce clutter).
Shows a compact table in the top-right corner with all key values:
Entry Price
Current Price
TP Price (+%)
SL Price (-%)
TP Distance from current price
RR Ratio (e.g., 1:1.5)
💡 Use Cases:
Quickly validate if a trade setup meets your desired RR profile (e.g., 1:2).
Perfect for scalpers, swing traders, and position traders who rely on structured risk management.
Combine with your entry signal strategy to visualize targets and stops without manual calculations.
⚙️ Inputs:
Stop Loss % – Sets how far your SL is from the entry.
Take Profit % – Sets how far your TP is from the entry.

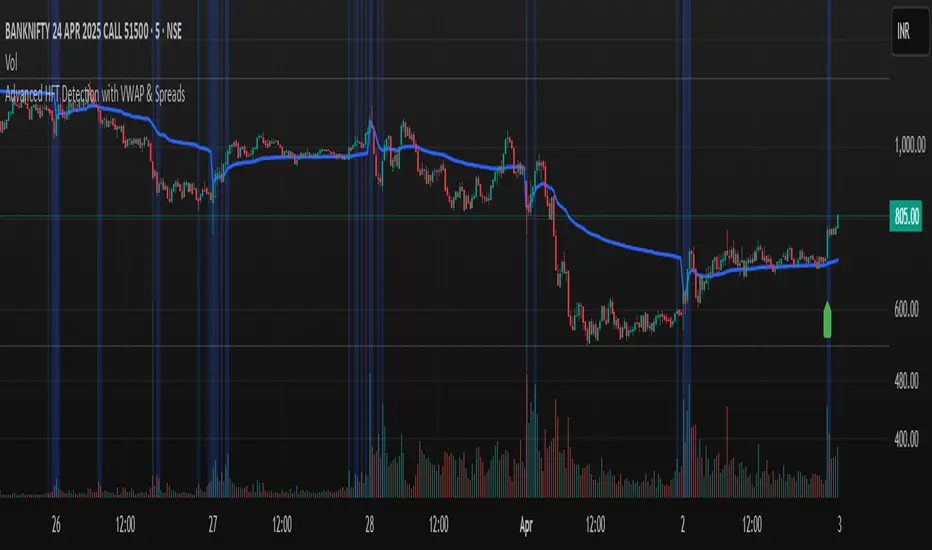
Advanced HFT Detection with VWAP & SpreadsExplanation of the HFT Detection Strategy
🔹 1. Key Indicators Used in the Strategy
It's works by combining VWAP, moving averages (SMA), volume spikes, and price jumps to detect potential HFT activity.
✅ (A) VWAP (Volume Weighted Average Price)
VWAP acts as a benchmark price that professional traders and institutions use to execute large orders.
If price is above VWAP, buyers are in control → Bullish trend
If price is below VWAP, sellers are in control → Bearish trend
HFT algorithms often place buy orders above VWAP and sell orders below VWAP to follow momentum.
➡️ Why VWAP? It ensures that signals follow the institutional trading trend.
✅ (B) Moving Averages (SMA)
Moving averages smooth out price data and help in detecting short-term momentum changes.
Fast Moving Average (5-period SMA): Reacts quickly to price changes
Slow Moving Average (20-period SMA): Identifies trend direction
➡️ Why SMA? It filters noise and confirms short-term trend shifts.
✅ (C) Volume Spike Detection
High-frequency trading is often accompanied by large volume surges. We define a volume spike as:
📌 Current Volume > 2× Average Volume of last 20 bars
➡️ Why Volume? HFTs execute rapid buy/sell orders when they detect liquidity, leading to sudden volume bursts.
✅ (D) Price Jump Detection (Sudden Volatility)
HFT algorithms often exploit quick price movements. We check if the price has moved more than twice the ATR (Average True Range) in the last 5 bars.
➡️ Why ATR? It helps to detect abnormal price movements compared to normal volatility.
🔹 2. Trading Signal Logic
Now that we have VWAP, moving averages, volume, and price movement filters, we generate buy and sell signals based on conditions.
✅ (A) Buy Signal Condition
A BUY signal is triggered when:
✔ Fast SMA crosses above Slow SMA → Short-term trend is turning bullish
✔ Volume spike occurs → HFTs are active
✔ Sudden price jump detected → High volatility
✔ Price is above VWAP → Confirms bullish trend
➡️ Why this works? It confirms that institutional traders & HFTs are buying aggressively.
✅ (B) Sell Signal Condition
A SELL signal is triggered when:
✔ Fast SMA crosses below Slow SMA → Short-term trend is turning bearish
✔ Volume spike occurs → HFTs are selling aggressively
✔ Sudden price drop detected → High volatility
✔ Price is below VWAP → Confirms bearish trend
➡️ Why this works? It confirms that institutional traders & HFTs are selling aggressively.
🔹 3. Visual Representation (Plotting Signals & VWAP)
Once we detect buy and sell signals, we mark them on the chart.
✅ (A) Buy/Sell Markers
🟢 Buy → Green upward arrow below the candle
🔴 Sell → Red downward arrow above the candle
✅ (B) VWAP Line on Chart
We also plot VWAP as a blue line to visualize trend direction.
✅ (C) Highlighting Volume Spikes
To easily spot HFT activity, we highlight volume spike bars with a blue background.
🔹 4. How to Use This Strategy?
1️⃣ Apply this script on a 1-minute or 5-minute intraday chart.
2️⃣ Look for BUY signals above VWAP and SELL signals below VWAP.
3️⃣ Verify that the volume spikes before taking action.
4️⃣ Use stop-loss & risk management (e.g., stop-loss at recent low/high).
🚀 Summary: Why This Strategy Works?
✅ VWAP ensures we follow institutional traders
✅ Volume spikes confirm sudden liquidity inflows
✅ Price jumps detect fast market moves caused by HFT bots
✅ Moving averages smooth out short-term trend shifts
CFD Lot Calculator [MT5 Optimized]CFD Position Size Calculator for MT5 (ES/NQ)
A clean, professional Pine Script tool that calculates optimal position sizes in lots for ES/NQ CFDs based on:
Account balance
Risk percentage per trade
Stop loss in pips
Contract size (default = 1 for MT5)
Features:
✅ Bottom-right compact table
✅ Displays risk amount, stop loss, and lot size
✅ Works with any CFD broker (adjust pip/contract values if needed)
✅ Detailed tooltips explain all inputs
Perfect for traders who want precise position sizing without chart clutter.

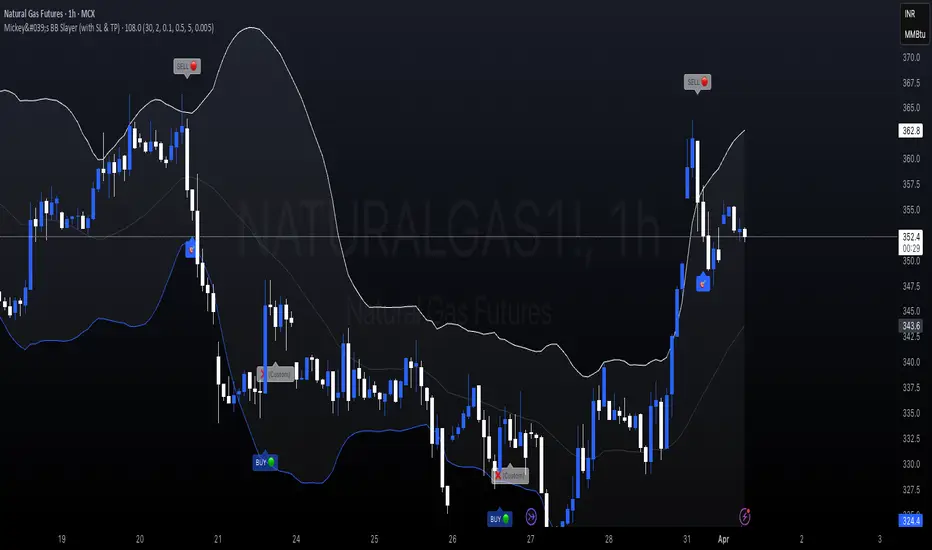
Mickey's BBMickey's BB – Smart Reversal Detector with SL Tracking 🔁
This indicator combines the power of Bollinger Bands with engulfing candle patterns to identify high-probability reversal points.
✅ Buy Signal: Triggered when a red candle touches the lower Bollinger Band and is engulfed by a green candle within the next few candles.
✅ Sell Signal: Triggered when a green candle touches the upper Bollinger Band and is engulfed by a red candle within the next few candles.
✅ Smart Lookahead: Scans up to X candles ahead (user-defined) to confirm engulfing reversals — reducing noise in sideways markets.
✅ Dynamic Stop-Loss & Target: Automatically plots SL/TP levels based on user-defined % thresholds.
✅ SL HIT Labels: Highlights exactly when a stop-loss is breached, giving clear visual feedback on trade failures.
✅ Adaptive Market Filter: Signals are only shown when Bollinger Band width exceeds a minimum threshold — filtering out weak/noise signals in low volatility.
🔍 Ideal for reversal traders, scalpers, and those who love combining price action with volatility-based setups.
🛠️ Customizable Parameters:
SMA Period & Std Dev Multiplier (for BB)
SL/Target % levels
Engulf Lookahead range
Minimum BB width to filter signals
🎯 Build it into your strategy, set alerts, or just use it visually to time your entries and exits with clarity.
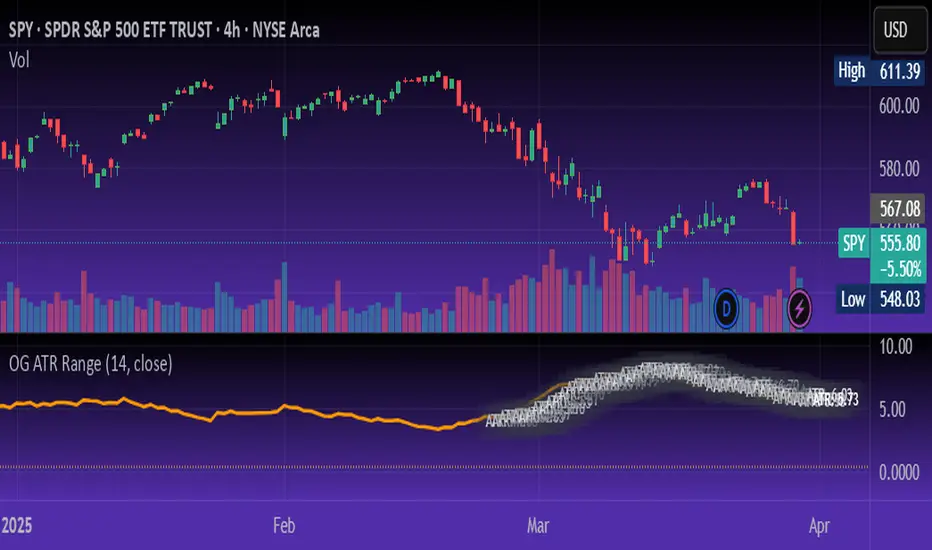
OG ATR RangeDescription:
The OG ATR Tool is a clean, visualized version of the Average True Range indicator for identifying volatility, stop-loss levels, and realistic price movement expectations.
How it works:
Calculates the average range (in points/pips) of recent candles.
Overlays ATR bands to help define breakout potential or squeeze zones.
Can be used to size trades or set dynamic stop-loss and target levels.
Best for:
Intraday traders who want to avoid unrealistic targets.
Volatility-based setups and breakout strategies.
Creating position sizing rules based on instrument volatility.
Pro Tip: Combine with your trend indicators to set sniper entries and exits that respect volatility.
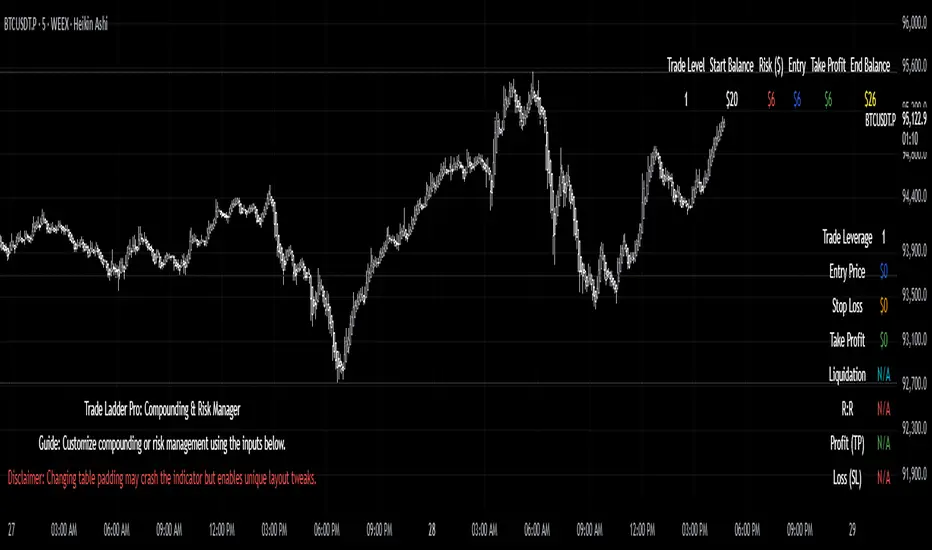
Trade Ladder Pro: Compounding & Risk ManagerTrade Ladder Pro: Compounding & Risk Manager
Inspired by the popular $20 to $52,000 trading challenge, this tool is designed to help you scale your trading account using systematic compounding and enhanced risk management techniques. Whether you’re aiming for disciplined growth or fine-tuning your risk/reward, Trade Ladder Pro offers a flexible approach to visualizing your trade levels.
How to Use:
Inputs:
Compounding Mode:
Set your starting balance, final balance goal, number of trades, and current trade level. You can move to the next trade after a successful trade in settings. The entries are not signals. They are there to help manage risk.
The script calculates the necessary compounding factor to grow your balance across the defined trades.
Risk Management Mode:
In addition to the above, specify a risk percentage and risk/reward ratio.
Input an entry price (or leave it at 0 to use the current price) to automatically compute the stop loss and take profit levels.
Display Options:
Choose the table’s position on the chart (e.g., Top Right, Top Left, Bottom Right, Bottom Left).
Pick between a vertical or horizontal layout for a display that suits your workflow.
Results:
The table will display the trade level, starting balance, risk amount, entry price, take profit, and (if in Risk Management mode) stop loss along with the projected ending balance.
Community & Feedback:
Your feedback is invaluable! Please share any tips or report any errors you encounter so we can continue to improve this tool. Happy trading!
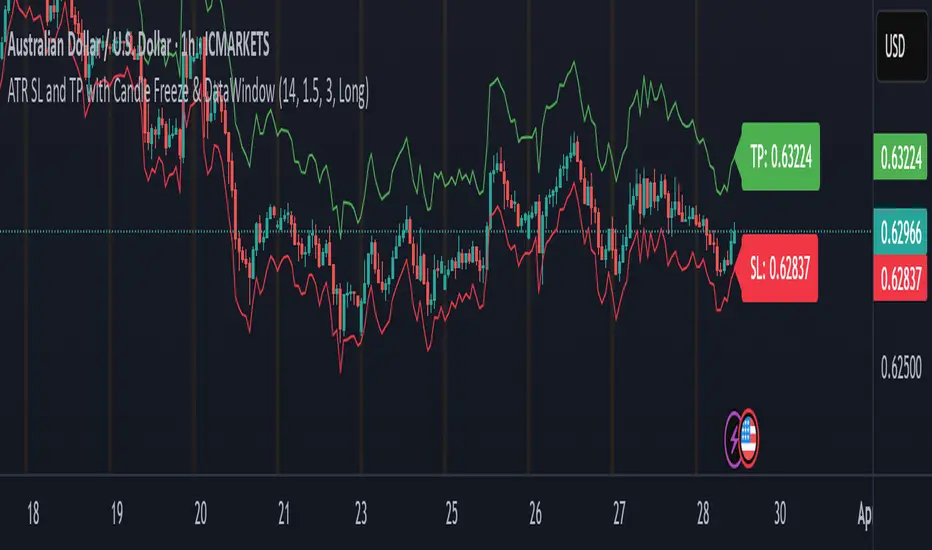
ATR SL and TP with Candle Freeze & DataWindowThis indicator uses the Average True Range (ATR) to automatically calculate your stop loss (SL) and take profit (TP) levels based on the current market volatility and your chosen multipliers. Here's how it works:
ATR Calculation:
The indicator computes the ATR, which measures the average market volatility over a set period. This value helps gauge how much the price typically moves.
SL and TP Determination:
Depending on whether you're in a long or short trade, the SL and TP are calculated relative to the current price:
For a long trade, the stop loss is set below the current price (by subtracting a multiple of the ATR) and the take profit is set above it (by adding a multiple of the ATR).
For a short trade, the calculations are reversed.
Candle Freeze Feature:
Once a new candle starts, the calculated SL and TP values are "frozen" for that candle. This means they remain constant during the candle's formation, preventing them from updating continuously as the price fluctuates. This can make it easier to plan your trades without the levels shifting mid-candle.
Data Window & Labels:
The SL and TP values are plotted on the chart as lines and displayed in labels for quick reference. Additionally, they appear in TradingView's Data Window, so you can easily copy the price numbers if needed.
Overall, the indicator is designed to help you manage your trades by setting dynamic, volatility-adjusted SL and TP levels that only update at the start of each new candle, aligning with your chosen timeframe. Let me know if you have any more questions or need further adjustments!
Trapped Traders Order BlocksHow It Works
The Trapped Traders Order Blocks indicator identifies specific price action patterns that suggest large market participants ("big money") have been trapped in losing positions after significant price sweeps, creating potential opportunities for reversals. The indicator detects both "bullish trap blocks" (where bearish traders are trapped) and "bearish trap blocks" (where bullish traders are trapped). Here’s the step-by-step process for each:
Bullish Trap Block (Bears Trapped):
A bearish candle (Candle A) must sweep the high of the previous candle (Candle B), meaning its high exceeds the high of the prior candle.
This bearish candle must have a longer upper wick than its lower wick, indicating rejection of higher prices.
The candle must not be a doji (i.e., it must have a significant body, defined as the body being at least 10% of the candle's range).
The next candle (Candle C) must close above the body of the bearish candle (Candle A), suggesting that price has immediately moved against the bearish sweep, potentially trapping bearish traders who entered short positions expecting a downward move.
The body of the bearish candle (Candle A) is marked as a "bullish trap block." A box is drawn around this candle's body, and a label ("Bullish Trap") is placed below it.
Bearish Trap Block (Bulls Trapped):
A bullish candle (Candle A) must sweep the low of the previous candle (Candle B), meaning its low is below the low of the prior candle.
This bullish candle must have a longer lower wick than its upper wick, indicating rejection of lower prices.
The candle must not be a doji.
The next candle (Candle C) must close below the body of the bullish candle (Candle A), suggesting that price has immediately moved against the bullish sweep, potentially trapping bullish traders who entered long positions expecting an upward move.
The body of the bullish candle (Candle A) is marked as a "bearish trap block." A box is drawn around this candle's body, and a label ("Bearish Trap") is placed above it.
Dynamic Box Extension:
For both bullish and bearish trap blocks, the box extends dynamically to the current bar unless it exceeds a user-defined age (default is 52 bars), at which point it stops at the maximum age.
Sweep Detection:
Bullish Sweep (of any trap block, bullish or bearish):
The current candle's open is above the top of the box.
The low is below the top of the box.
The close is above the top of the box.
The lower wick is longer than the upper wick (indicating rejection of lower prices).
The close is above 50% of the candle's range (ensuring a strong bullish bias).
When a bullish sweep occurs, a label ("Bullish Sweep") is placed at the low of the candle, pointing upward, and an alert is triggered.
Bearish Sweep (of any trap block, bullish or bearish):
The current candle's open is below the bottom of the box.
The high is above the bottom of the box.
The close is below the bottom of the box.
The upper wick is longer than the lower wick (indicating rejection of higher prices).
The close is below 50% of the candle's range (ensuring a strong bearish bias).
When a bearish sweep occurs, a label ("Bearish Sweep") is placed at the high of the candle, pointing downward, and an alert is triggered.
When to Be Used
The Trapped Traders Order Blocks indicator is best used in the following scenarios:
Reversal Trading:
Use this indicator to identify potential reversal points in the market. Bullish trap blocks suggest that trapped bears may unwind their short positions, leading to a potential bullish move. Bearish trap blocks suggest that trapped bulls may unwind their long positions, leading to a potential bearish move.
Look for sweeps of these blocks as confirmation of a directional move. A bullish sweep indicates a potential upward move, while a bearish sweep indicates a potential downward move.
Range-Bound Markets:
In sideways or ranging markets, trapped blocks can highlight key levels where large players have been caught off-guard. These levels often act as support or resistance, and a sweep of the block can signal a breakout or continuation in the direction of the sweep.
Confluence with Other Indicators:
Combine the trapped blocks with other technical analysis tools, such as support/resistance levels, Fibonacci retracements, or volume analysis, to increase the probability of a successful trade. For example, a bullish trap block near a strong support level with a bullish sweep can provide a high-probability setup for a long position, while a bearish trap block near a strong resistance level with a bearish sweep can signal a short opportunity.
Timeframes:
The indicator is most effective on higher timeframes such as 1-day (1D), 1-week (1W), and 1-month (1M) charts. These timeframes are more likely to capture significant moves involving large market participants, reducing noise and false signals compared to lower timeframes. While it can be used on lower timeframes (e.g., 1-hour or 4-hour), the signals may be less reliable due to increased market noise.
Logic Behind It
The logic behind the Trapped Traders Order Blocks indicator is rooted in market psychology and the behavior of large market participants ("big money"). When a large sweep candle occurs where price spikes in one direction but then quickly reverses it often indicates that traders have entered positions in the direction of the sweep, expecting a continuation. However, if the price immediately moves against them, these traders are now trapped in losing positions.
Bullish Trap Block (Bears Trapped):
A large bearish sweep candle (spiking upward but closing lower) suggests that bearish traders (bears) have entered short positions at the top of the move, expecting a downward continuation. If the next candle closes above the bearish candle's body, these bears are trapped in losing positions.
The body of the bearish candle becomes a "bullish trap block" because the trapped bears are likely to have placed their stop-loss orders or break-even exit orders just above the high of the sweep candle or within the body of the candle. As price revisits this level in the future, these trapped traders may attempt to unwind their positions by buying back their shorts, which can drive the price higher. This unwinding process often attracts new buyers, leading to a potential bullish reversal or continuation.
The bullish sweep conditions (e.g., close > box top, longer lower wick, and close above 50% of the range) ensure that the price action at the block level shows strong bullish momentum and rejection of lower prices, confirming the potential for a move higher.
Bearish Trap Block (Bulls Trapped):
A large bullish sweep candle (spiking downward but closing higher) suggests that bullish traders (bulls) have entered long positions at the bottom of the move, expecting an upward continuation. If the next candle closes below the bullish candle's body, these bulls are trapped in losing positions.
The body of the bullish candle becomes a "bearish trap block" because the trapped bulls are likely to have placed their stop-loss orders or break-even exit orders just below the low of the sweep candle or within the body of the candle. As price revisits this level in the future, these trapped traders may attempt to unwind their positions by selling their longs, which can drive the price lower. This unwinding process often attracts new sellers, leading to a potential bearish reversal or continuation.
The bearish sweep conditions (e.g., close < box bottom, longer upper wick, and close below 50% of the range) ensure that the price action at the block level shows strong bearish momentum and rejection of higher prices, confirming the potential for a move lower.
Summary
Bullish Trap Block: Occurs when bears get trapped after a bearish sweep candle is immediately followed by a bullish candle, indicating a potential reversal as trapped bears may unwind their positions.
Bearish Trap Block: Occurs when bulls get trapped after a bullish sweep candle is immediately followed by a bearish candle, indicating a potential bearish reversal.
Use Case: Ideal for identifying reversal opportunities, especially in range-bound markets or at key support/resistance levels on higher timeframes like 1D, 1W, and 1M, and can be combined with other indicators for confluence.
Logic: Large sweep candles followed by an immediate reversal suggest that big money has been trapped, and these traders may unwind their positions at break-even in the near future, driving price in the opposite direction of their initial trade.
This indicator provides a visual and actionable way to identify these trapped trader scenarios, with customizable settings for box display, sweep visuals, and alerts to help traders capitalize on these opportunities, particularly on higher timeframes where the signals are most reliable.

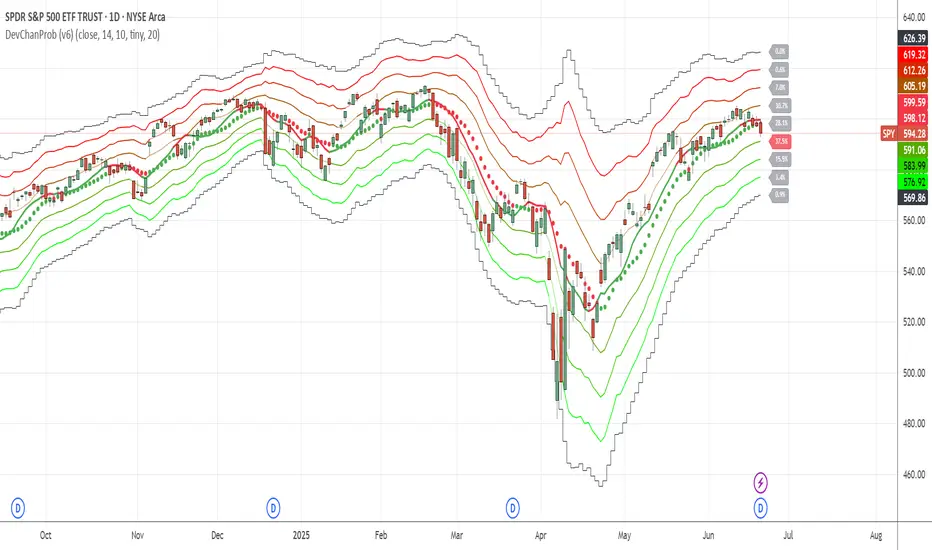
Deviation ChannelsIndicator Name: Deviation Channels (Dev Chan)
Why Use This Indicator?
Visualize Volatility Ranges:
The indicator plots Keltner Channels at four levels above and below an average line, letting you easily see how far price has deviated from a typical range. Each “dev” line highlights potential support or resistance during pullbacks or surges.
Color-Coded Clarity:
Each band shifts color intensity depending on whether the current price is trading above or below it, letting you spot breakouts and rejections at a glance. Meanwhile, the Fast SMA (default 10) also changes color – green if price is above, red if below – adding a quick momentum read.
Adjustable Source & Length:
Choose your input source (open, close, ohlc4, or hlc3) and set your Keltner length to suit different asset classes or timeframes. Whether you want a tighter, more reactive channel or a smoother, longer-term reading, the script adapts with minimal effort.
A Simple Trading Approach
Identify Trend with Fast SMA:
If the Fast SMA (default length 10) is green (price above it), treat that as a bullish environment. If it’s red (price below), favor bearish or neutral stances.
Wait for Price to Reach Lower/Upper Deviations:
In a bullish setup (Fast SMA green), watch for price to dip into one of the lower channels (e.g., -1 Dev or -2 Dev). Such pullbacks can become potential “buy the dip” zones if price stabilizes and resumes upward momentum.
Conversely, if the Fast SMA is red, watch for price to test the upper channels (1 Dev or 2 Dev). That might be a short opportunity or a place to close out any remaining longs before a deeper correction.
Manage Risk with Channel Levels:
Place stop-losses just beyond the next “dev” band to protect against volatility. For example, if you enter on a bounce at -1 Dev, consider placing a stop near -2 Dev or -3 Dev, depending on your risk tolerance.
Take Profits Gradually:
In an uptrend, you might scale out of positions as price moves toward higher lines (e.g., 1 Dev or 2 Dev). Conversely, if price fails to hold above the Fast SMA or repeatedly closes below a key band, it might be time to exit.
Disclaimer: No single indicator is foolproof. Always combine with sound risk management, observe multiple timeframes, and consider fundamental factors before making trading decisions. Experiment with the Keltner length and Fast SMA fastLength to find the sweet spot for your market and time horizon.
MACD with TrendIndicator Name: MACD with Trend & Multi-Timeframe Dashboard
Why Use This Indicator?
Two MACDs for Double Confirmation:
It integrates both a standard MACD (fast/slow lengths of your choice) and a Trend MACD (longer lengths). The standard MACD identifies short-term momentum shifts, while the Trend MACD helps confirm the higher-level market trend.
Multi-Timeframe 50/200 SMA Overview:
A built-in dashboard quickly shows whether the 50-period moving average is above or below the 200-period moving average across multiple timeframes (Monthly, Weekly, Daily, etc.). At a glance, you can see if higher timeframes agree with your immediate trading setup.
Clear Buy/Sell Signals:
The script plots buy arrows when the MACD histogram crosses from negative to positive, plus an additional label for the Trend MACD crossing. The same goes for sell signals if momentum flips from positive to negative. This clarity can reduce guesswork.
Customizable & Intuitive:
Easily adjust moving average types (SMA or EMA), lengths, and source inputs to suit different asset classes or personal preferences. Visual color coding helps you quickly interpret bullish vs. bearish conditions.
Recommended Trading Approach
Identify Overall Trend
Check the Trend MACD histogram and the multi-timeframe dashboard (50/200 SMAs). If you see bullish alignment on higher timeframes (e.g., Daily, Weekly) and the Trend MACD is above zero, you know the market environment is supportive for long trades.
Pinpoint Entry Using Standard MACD
Wait for the standard MACD histogram to cross above zero or for a labeled “Buy Signal.” This indicates short-term momentum turning bullish in sync with the broader trend. If the market is already trending up (confirmed by the dashboard), the probability of a successful long entry often improves.
Set a Stop-Loss & Take-Profit
While not included in the code, adding an ATR- or price-based stop-loss can protect against sudden reversals. A simple approach is risking 1–2% per trade and aiming for a 1.5–2× reward relative to that risk.
Monitor Sell Signals
If the short-term MACD crosses below zero—triggering a “Sell Signal”—and the Trend MACD also turns down (or the dashboard flips bearish), consider exiting the position or tightening stops. This alignment of short- and long-term indicators often signals a shift in momentum that could threaten your open profits.
Summary
The MACD with Trend & Multi-Timeframe Dashboard is a versatile, all-in-one toolkit. It combines the immediacy of short-term MACD signals, the validation of a longer-term trend oscillator, and the broader insight of multi-timeframe moving averages. Whether you are a swing trader looking for alignment across bigger trends or a shorter-term trader wanting clear momentum triggers, this indicator helps streamline decision-making and reduce noise.
Disclaimer: As with all technical analysis tools, there is no guarantee of success. Always combine indicator signals with sound risk management and a thorough understanding of market conditions

Dynamic Support and Resistance ### Indicator: Dynamic Support and Resistance
#### Overview:
The *Dynamic Support and Resistance* indicator is a powerful tool designed to help traders identify key price levels on a chart. It dynamically calculates support and resistance levels based on pivot points and the Average True Range (ATR). The indicator also highlights broken support and resistance zones, providing visual cues for potential trend reversals or continuations.
---
### Key Features:
1. *Dynamic Support and Resistance Levels*:
- The indicator identifies support and resistance levels using pivot highs and lows within a user-defined range.
- These levels are adjusted using the ATR to account for market volatility, making them more responsive to changing market conditions.
2. *Support and Resistance Zones*:
- The indicator draws boxes around the support and resistance levels, with customizable colors and widths.
- The width of the zones is determined by the ATR and a user-defined multiplier, allowing traders to adjust the sensitivity of the zones.
3. *Broken Zones*:
- When price breaks through a support or resistance zone, the zone is highlighted with a distinct color to indicate a potential shift in market sentiment.
- Traders can limit the number of broken zones displayed on the chart to avoid clutter.
4. *Customizable Inputs*:
- *Range Candle Count*: Defines the number of candles analyzed to determine pivot points. Increasing this value will result in fewer but more significant levels, while decreasing it will produce more levels that are sensitive to shorter-term price movements.
- *ATR Period*: Controls the sensitivity of the ATR calculation. A shorter period makes the ATR more responsive to recent price changes, while a longer period smooths it out.
- *Box Width Multiplier*: Adjusts the width of the support and resistance zones. A higher multiplier creates wider zones, which may be useful in more volatile markets.
- *Max Broken Zones*: Limits the number of broken zones displayed on the chart. This helps keep the chart clean and focused on the most recent breaks.
---
### How It Works:
1. *Pivot Points*:
- The indicator identifies pivot highs and lows within the specified range. These pivots serve as the basis for calculating support and resistance levels.
2. *ATR Adjustment*:
- The ATR is used to adjust the support and resistance levels, making them more dynamic and responsive to market volatility.
3. *Zone Creation*:
- Support and resistance zones are drawn as boxes around the pivot levels. The width of these zones is determined by the ATR and the box width multiplier.
4. *Zone Breaks*:
- When price breaks through a zone, the zone is highlighted with a distinct color, and the broken zone is added to an array. If the number of broken zones exceeds the user-defined limit, the oldest broken zone is removed from the chart.
---
### How to Use:
1. *Trend Identification*:
- Use the support and resistance levels to identify key price levels where the market may reverse or consolidate.
- Broken zones can signal potential trend reversals or continuations.
2. *Entry and Exit Points*:
- Traders can use the support and resistance zones as potential entry or exit points. For example, buying near support or selling near resistance.
- Broken zones can be used as confirmation for breakout strategies.
3. *Risk Management*:
- The width of the zones can help traders set stop-loss levels. For example, placing a stop-loss just outside a support or resistance zone.
4. *Customization*:
- Adjust the input parameters to suit your trading style and the specific market conditions. For example, increase the range candle count for longer-term analysis or decrease it for shorter-term trading.
---
### Who Should Use This Indicator?
- *Swing Traders*: Can use the indicator to identify key levels for potential reversals or breakouts.
- *Day Traders*: Can benefit from the dynamic levels and zones, especially in volatile markets.
- *Position Traders*: Can use the indicator to identify long-term support and resistance levels.
- *Breakout Traders*: Can use the broken zones to confirm breakouts and plan their trades accordingly.
---
### Input Parameters and Their Effects:
1. *Range Candle Count*:
- *Increase*: Produces fewer but more significant levels, suitable for longer-term analysis.
- *Decrease*: Produces more levels, sensitive to shorter-term price movements.
2. *ATR Period*:
- *Increase*: Smoothens the ATR, making the levels less sensitive to recent price changes.
- *Decrease*: Makes the ATR more responsive to recent price changes, resulting in more dynamic levels.
3. *Box Width Multiplier*:
- *Increase*: Creates wider zones, suitable for more volatile markets.
- *Decrease*: Creates narrower zones, suitable for less volatile markets.
4. *Max Broken Zones*:
- *Increase*: Displays more broken zones on the chart, providing more historical context.
- *Decrease*: Keeps the chart clean by displaying only the most recent broken zones.
---
### Conclusion:
The *Dynamic Support and Resistance* indicator is a versatile tool that can be adapted to various trading styles and market conditions. By dynamically adjusting to market volatility and highlighting key price levels, it provides traders with valuable insights into potential support and resistance areas. Whether you're a swing trader, day trader, or position trader, this indicator can help you make more informed trading decisions.
---
### Publishing on TradingView:
- *Title*: Dynamic Support and Resistance
- *Description*: A dynamic support and resistance indicator that uses pivot points and ATR to identify key price levels. Includes customizable support/resistance zones and highlights broken zones for breakout trading.
- *Tags*: support, resistance, ATR, pivot points, breakout, trading, indicator
- *Access*: Public or Invite-only, depending on your preference.
This indicator is ready to be published on TradingView, and the detailed description above will help users understand its functionality and how to use it effectively.

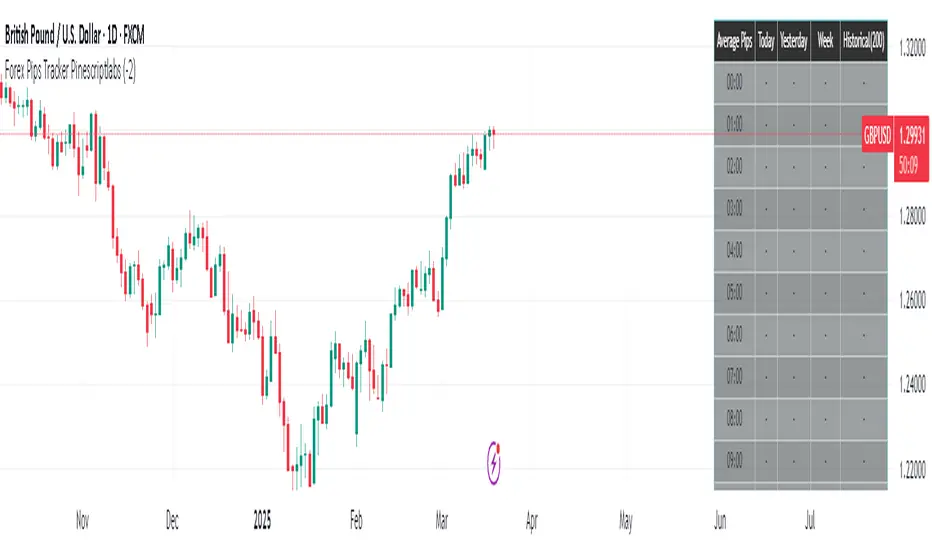
Forex Pips Tracker PinescriptlabsThis algorithm is exclusively designed for the Forex market 🌐 and serves as a tool to measure volatility, helping to determine on average how many pips positions move per hour. With this information, a trader can place take profit and stop loss orders with greater certainty, since they know the average pip movement range during each hour of the day.
What does it do and how does it work?
• Volatility measurement in pips 📊:
The algorithm calculates the size of the movement (or range) of each candle expressed in pips. To do this, it takes the difference between the highest and lowest price of each candle and converts it into pips.
👉
• Time zone adjustment ⏰:
It allows you to configure the time zone so that the data aligns with your desired schedule. This is especially useful for comparing movements at different times based on the trader's location.
• Analysis by time intervals 🕒:
The algorithm’s logic organizes the information for each hour of the day. It stores data for the current day, the previous day, weekly, and historically (200 candles). This allows you to see how volatility varies across different periods, providing a dynamic view of market behavior.
👉
• Directionality of movement 🔄:
In addition to averaging the pip range, the algorithm determines the predominant direction of each candle (bullish or bearish). This translates into visual indicators (like arrows) that help identify whether, on average, the movement during that hour tends to go up or down.
• Table visualization 📈:
Finally, the information is presented in an integrated table on the chart. Each row corresponds to an hour of the day and shows the average number of pips and the direction (bullish, bearish, or neutral) for each analyzed period. This table makes it easy to quickly and practically interpret the volatility data.
By combining these features, the algorithm becomes an essential tool for traders looking to better understand market dynamics and optimize their trading strategies! 💼✨
Español:
Este algoritmo está diseñado exclusivamente para el mercado Forex 🌐 y sirve como una herramienta para medir la volatilidad, ayudando a determinar en promedio cuántos pips se mueven las posiciones por hora. Con esta información, un trader puede colocar el take profit y el stop loss con mayor certeza, ya que conoce el rango promedio de movimiento en pips durante cada hora del día.
¿Qué hace y cómo funciona?
• Medición de volatilidad en pips 📊:
El algoritmo calcula el tamaño del movimiento (o rango) de cada vela expresado en pips. Para ello, toma la diferencia entre el precio máximo y el mínimo de cada vela y la convierte a pips.
👉
• Ajuste de zona horaria ⏰:
Permite configurar la zona horaria para que los datos se ajusten al horario deseado. Esto es especialmente útil para comparar movimientos durante distintas horas en función de la localización del trader.
• Análisis por intervalos de tiempo 🕒:
La lógica del algoritmo organiza la información por cada hora del día. Guarda datos para el día actual, el día anterior, a nivel semanal e histórico (200 velas). Esto permite ver cómo varía la volatilidad en diferentes periodos, proporcionando una visión dinámica del comportamiento del mercado.
👉
• Direccionalidad del movimiento 🔄:
Además de promediar el rango en pips, el algoritmo determina la dirección predominante de cada vela (alcista o bajista). Esto se traduce en indicadores visuales (como flechas) que permiten identificar si, en promedio, el movimiento en esa hora tiende a subir o bajar.
• Visualización en tabla 📈:
Finalmente, la información se presenta en una tabla integrada en el gráfico. Cada fila corresponde a una hora del día y muestra el promedio de pips y la dirección (alcista, bajista o neutral) para cada uno de los periodos analizados. Esta tabla facilita la interpretación rápida y práctica de los datos de volatilidad.
Al combinar estas funciones, el algoritmo se convierte en una herramienta esencial para traders que buscan entender mejor la dinámica del mercado y optimizar sus estrategias de trading! 💼✨
Scalping Entry/Exit Indicator by DiGetImagine having a tool that not only spots high-probability entry signals but also visually marks them on your chart with color-coded cues and automated alerts. The Scalping Entry/Exit Indicator by DiGet does exactly that—by fusing a range of classic candlestick patterns (such as Bullish Hammers, Engulfing patterns, and Morning/Evening Stars) with dynamic risk management levels, this script empowers you to make swift and informed trading decisions. Whether you're an active trader or an algorithm enthusiast, this indicator offers both precision and clarity in identifying scalp opportunities, making your chart analysis more efficient and visually engaging.
Indicator Breakdown
Input Parameters:
The indicator accepts a customizable risk-reward ratio, an ATR period for volatility measurement, and a lookback period to scan for valid candlestick patterns.
ATR & Candle Calculations:
It computes the Average True Range (ATR) to dynamically set stop-loss and take-profit levels. Additionally, it determines the body and wick sizes of each candlestick to help identify key reversal patterns.
Pattern Detection:
Multiple bullish patterns (Hammer, Engulfing, Morning Star) and bearish patterns (Shooting Star, Engulfing, Evening Star) are detected. There’s also a simplified version of the Head & Shoulders pattern, offering further validation for reversal signals.
Signal Generation & Trade Levels:
The script consolidates the pattern signals into combined “buy” and “sell” triggers. It then calculates the respective stop-loss (SL) and take-profit (TP) levels based on the current price and ATR, providing a robust risk management framework.
Visual Aids & Alerts:
To enhance usability, the indicator changes the chart’s background color to green for buy signals and red for sell signals. It also draws labels, lines (representing SL and TP), and markers directly on the chart, along with alert conditions to notify traders of actionable signals.
This indicator is an excellent addition to your TradingView toolkit—ideal for scalpers and short-term traders seeking clarity, precision, and automated signal generation on their charts.
Enjoy trading with confidence and precision!

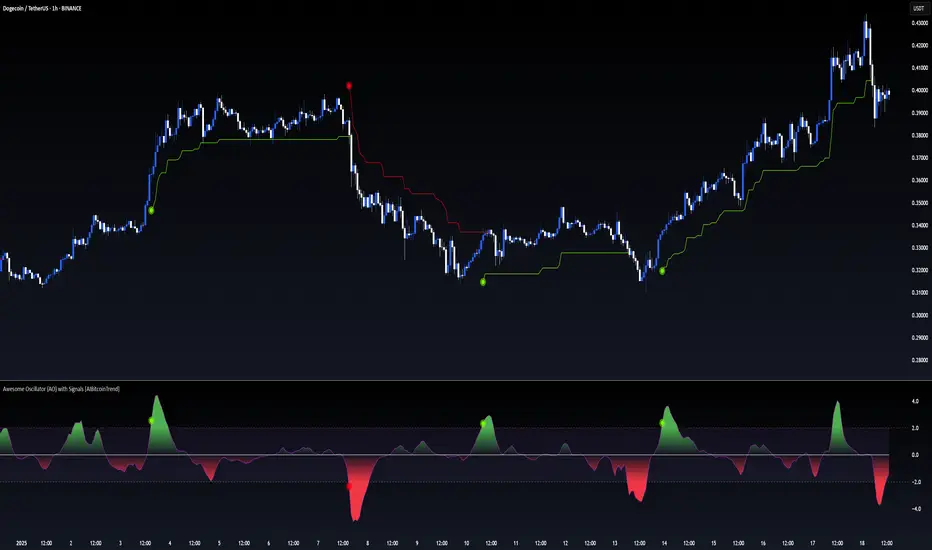
Awesome Oscillator (AO) with Signals [AIBitcoinTrend]👽 Multi-Scale Awesome Oscillator (AO) with Signals (AIBitcoinTrend)
The Multi-Scale Awesome Oscillator transforms the traditional Awesome Oscillator (AO) by integrating multi-scale wavelet filtering, enhancing its ability to detect momentum shifts while maintaining responsiveness across different market conditions.
Unlike conventional AO calculations, this advanced version refines trend structures using high-frequency, medium-frequency, and low-frequency wavelet components, providing traders with superior clarity and adaptability.
Additionally, it features real-time divergence detection and an ATR-based dynamic trailing stop, making it a powerful tool for momentum analysis, reversals, and breakout strategies.
👽 What Makes the Multi-Scale AO – Wavelet-Enhanced Momentum Unique?
Unlike traditional AO indicators, this enhanced version leverages wavelet-based decomposition and volatility-adjusted normalization, ensuring improved signal consistency across various timeframes and assets.
✅ Wavelet Smoothing – Multi-Scale Extraction – Captures short-term fluctuations while preserving broader trend structures.
✅ Frequency-Based Detail Weights – Separates high, medium, and low-frequency components to reduce noise and improve trend clarity.
✅ Real-Time Divergence Detection – Identifies bullish and bearish divergences for early trend reversals.
✅ Crossovers & ATR-Based Trailing Stops – Implements intelligent trade management with adaptive stop-loss levels.
👽 The Math Behind the Indicator
👾 Wavelet-Based AO Smoothing
The indicator applies multi-scale wavelet decomposition to extract high-frequency, medium-frequency, and low-frequency trend components, ensuring an optimal balance between reactivity and smoothness.
sma1 = ta.sma(signal, waveletPeriod1)
sma2 = ta.sma(signal, waveletPeriod2)
sma3 = ta.sma(signal, waveletPeriod3)
detail1 = signal - sma1 // High-frequency detail
detail2 = sma1 - sma2 // Intermediate detail
detail3 = sma2 - sma3 // Low-frequency detail
advancedAO = weightDetail1 * detail1 + weightDetail2 * detail2 + weightDetail3 * detail3
Why It Works:
Short-Term Smoothing: Captures rapid fluctuations while minimizing noise.
Medium-Term Smoothing: Balances short-term and long-term trends.
Long-Term Smoothing: Enhances trend stability and reduces false signals.
👾 Z-Score Normalization
To ensure consistency across different markets, the Awesome Oscillator is normalized using a Z-score transformation, making overbought and oversold levels stable across all assets.
normFactor = ta.stdev(advancedAO, normPeriod)
normalizedAO = advancedAO / nz(normFactor, 1)
Why It Works:
Standardizes AO values for comparison across assets.
Enhances signal reliability, preventing misleading spikes.
👽 How Traders Can Use This Indicator
👾 Divergence Trading Strategy
Bullish Divergence
Price makes a lower low, while AO forms a higher low.
A buy signal is confirmed when AO starts rising.
Bearish Divergence
Price makes a higher high, while AO forms a lower high.
A sell signal is confirmed when AO starts declining.
👾 Buy & Sell Signals with Trailing Stop
Bullish Setup:
✅AO crosses above the bullish trigger level → Buy Signal.
✅Trailing stop placed at Low - (ATR × Multiplier).
✅Exit if price crosses below the stop.
Bearish Setup:
✅AO crosses below the bearish trigger level → Sell Signal.
✅Trailing stop placed at High + (ATR × Multiplier).
✅Exit if price crosses above the stop.
👽 Why It’s Useful for Traders
Wavelet-Enhanced Filtering – Retains essential trend details while eliminating excessive noise.
Multi-Scale Momentum Analysis – Separates different trend frequencies for enhanced clarity.
Real-Time Divergence Alerts – Identifies early reversal signals for better entries and exits.
ATR-Based Risk Management – Ensures stops dynamically adapt to market conditions.
Works Across Markets & Timeframes – Suitable for stocks, forex, crypto, and futures trading.
👽 Indicator Settings
AO Short Period – Defines the short-term moving average for AO calculation.
AO Long Period – Defines the long-term moving average for AO smoothing.
Wavelet Smoothing – Adjusts multi-scale decomposition for different market conditions.
Divergence Detection – Enables or disables real-time divergence analysis. Normalization Period – Sets the lookback period for standard deviation-based AO normalization.
Cross Signals Sensitivity – Controls crossover signal strength for buy/sell signals.
ATR Trailing Stop Multiplier – Adjusts the sensitivity of the trailing stop.
Disclaimer: This indicator is designed for educational purposes and does not constitute financial advice. Please consult a qualified financial advisor before making investment decisions.
EMA Sniper – Precision Trading with EMA 21/50Title: EMA Sniper – Precision Trading with EMA 21/50
Description:
🚀 EMA Sniper is a powerful trading tool designed to identify trend shifts with precision using the EMA 21/50 crossover, while also displaying Stop Loss (SL) and Take Profit (TP) levels directly on the chart.
🔹 Features:
✅ EMA 21/50 Crossover Signals – Buy signals appear when EMA 21 crosses above EMA 50, and sell signals appear when EMA 21 crosses below EMA 50.
✅ Smart Stop Loss & Take Profit – SL is dynamically placed below/above EMA 50 for optimized risk management, while TP follows a 2:1 risk/reward ratio.
✅ Clear Visual Alerts – The indicator plots SL and TP levels as lines on the chart, along with buy and sell markers for quick decision-making.
✅ Multi-Market & Multi-Timeframe – Works across forex, crypto, stocks, and indices on any timeframe.
🚀 Perfect for traders looking for a structured approach to trend-based trading!
Let me know if you’d like any modifications! 🔥

BBVOL SwiftEdgeBBVOL SwiftEdge – Precision Scalping with Volume and Trend Filtering
Optimized for scalping and short-term trading on fast-moving markets (e.g., 1-minute charts), BBVOL SwiftEdge combines Bollinger Bands, Heikin Ashi smoothing, volume momentum, and EMA trend alignment to deliver actionable buy/sell signals with visual trend cues. Ideal for forex, crypto, and stocks.
What Makes BBVOL SwiftEdge Unique?
Unlike traditional Bollinger Bands scripts that focus solely on price volatility, BBVOL SwiftEdge enhances signal precision by:
Using Heikin Ashi to filter out noise and confirm trend direction, reducing false signals in choppy markets.
Incorporating volume analysis to ensure signals align with significant buying or selling pressure (customizable thresholds).
Adding an EMA overlay to keep trades in sync with the short-term trend.
Coloring candlesticks (green for bullish, red for bearish, purple for consolidation) to visually highlight market conditions at a glance.
How Does It Work?
Buy Signal: Triggers when price crosses above the lower Bollinger Band, Heikin Ashi shows bullish momentum (close > open), buy volume exceeds your set threshold (default 30%), and price is above the EMA. A green triangle appears below the candle.
Sell Signal: Triggers when price crosses below the upper Bollinger Band, Heikin Ashi turns bearish (close < open), sell volume exceeds the threshold (default 30%), and price is below the EMA. A red triangle appears above the candle.
Trend Visualization: Candles turn green when price is significantly above the Bollinger Bands’ basis (indicating a bullish trend), red when below (bearish trend), or purple when near the basis (consolidation), based on a customizable threshold (default 10% of BB width).
Risk Management: Each signal calculates a stop-loss (10% beyond the opposite band) and take-profit (opposite band), plotted for reference.
How to Use It
Timeframe: Best on 1-minute to 5-minute charts for scalping; test higher timeframes for swing trading.
Markets: Works well in volatile markets like forex pairs (e.g., EUR/USD), crypto (e.g., BTC/USD), or liquid stocks.
Customization: Adjust Bollinger Bands length (default 10), multiplier (default 1.2), volume thresholds (default 30%), EMA length (default 3), and consolidation threshold (default 0.1%) to match your strategy.
Interpretation: Look for green/red triangles as entry signals, confirmed by candle colors. Purple candles suggest caution—wait for a breakout. Use stop-loss/take-profit levels for trade management.
Underlying Concepts
Bollinger Bands: Measures volatility and identifies overbought/oversold zones.
Heikin Ashi: Smooths price action to emphasize trend direction.
Volume Momentum: Calculates cumulative buy/sell volume percentages to confirm market strength (e.g., buyVolPercent = buyVolume / totalVolume * 100).
EMA: A fast-moving average (default length 3) ensures signals align with the immediate trend.
Chart Setup
The chart displays Bollinger Bands (orange), Heikin Ashi close (green circles), EMA (purple), and volume-scaled lines (lime/red). Signals are marked with triangles, and candle colors reflect trend state. Keep the chart clean by focusing on these outputs for clarity.
