Scalping System by Machine# Custom Trading System Indicator
This Pine Script indicator is designed to identify potential trading setups based on a specific set of rules. It's intended for use on lower timeframes (M1-M5) in the forex market, particularly during the New York-London overlap period.
## Key Features
1. **EMA Condition**: Uses a 20-period Exponential Moving Average (EMA) to determine trend direction.
2. **Candle Analysis**: Identifies strong bars and candle color changes.
3. **Volume Confirmation**: Checks for increasing volume.
4. **Volatility Filter**: Utilizes the Average True Range (ATR) to gauge market volatility.
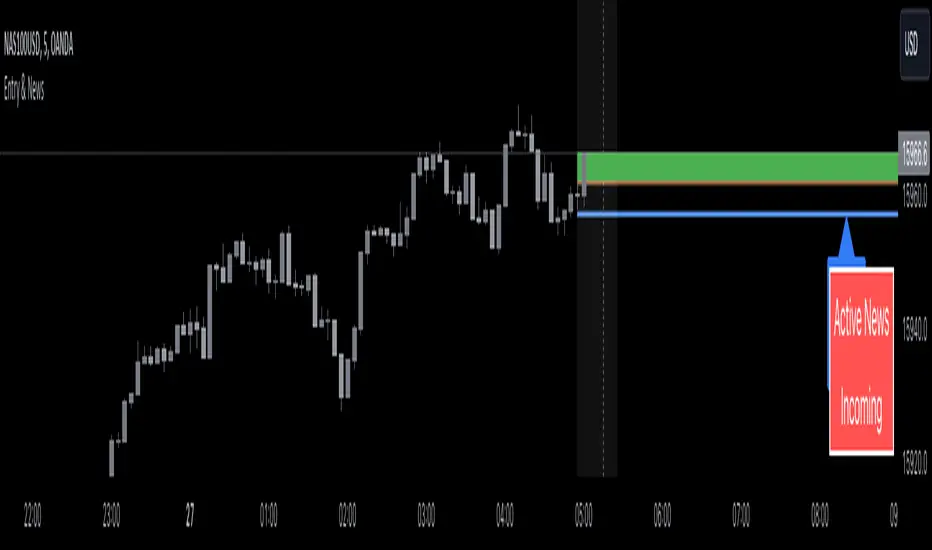
5. **Time-based Filter**: Highlights the New York-London overlap period.
6. **Visual Aids**: Plots potential entry points, stop losses, and take profit levels.
## Trading Rules
1. **Buy Signal**:
- Price is above the 20 EMA
- Candle color changes from red to green
- Current candle is a strong bar (closing within 75% of its range)
- Volume is higher than the previous bar
- ATR(14) is above 4 pips OR it's during the NY-London overlap
2. **Sell Signal**:
- Price is below the 20 EMA
- Candle color changes from green to red
- Current candle is a strong bar (closing within 75% of its range)
- Volume is higher than the previous bar
- ATR(14) is above 4 pips OR it's during the NY-London overlap
3. **Stop Loss**: Placed near the low of the setup candle for buys, or near the high for sells.
4. **Take Profit**: Aimed at 1R (one times the range of the setup candle).
## Visual Elements
- **20 EMA**: Plotted as a blue line on the chart.
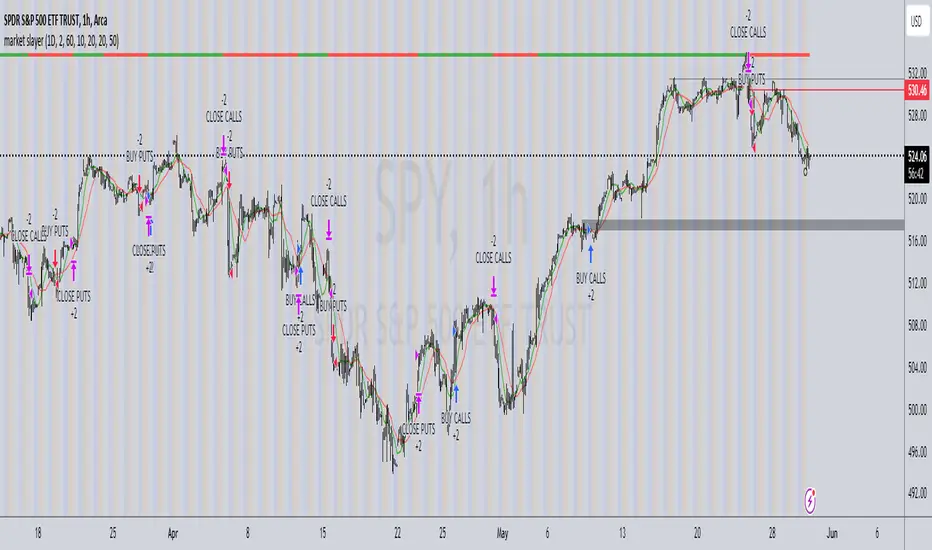
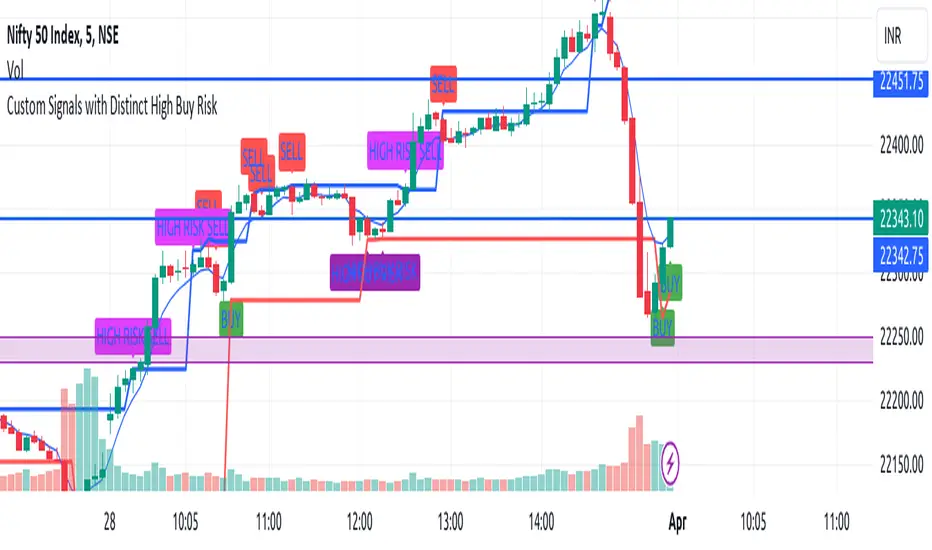
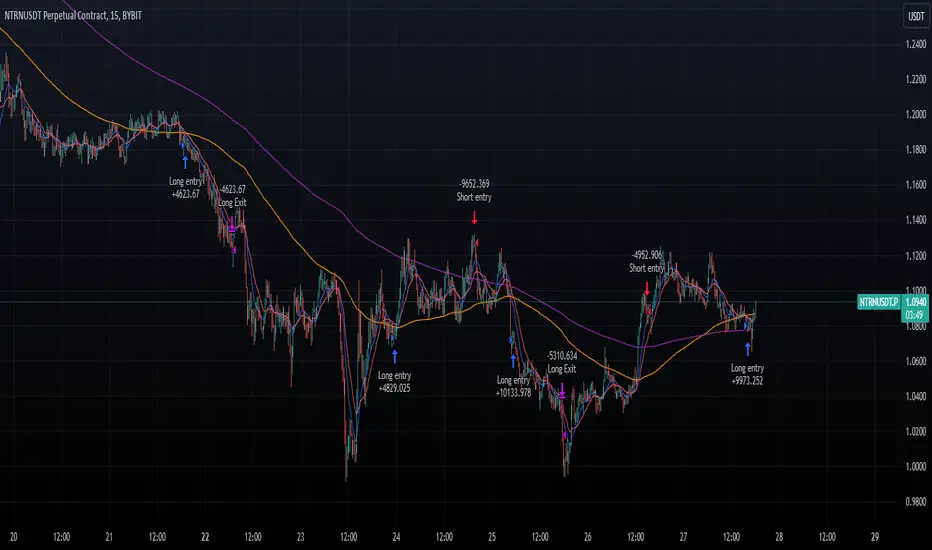
- **Buy Signals**: Green triangles below the candles.
- **Sell Signals**: Red triangles above the candles.
- **Stop Loss Levels**: Small red dots at the calculated stop loss prices.
- **Take Profit Levels**: Small green dots at the calculated take profit prices.
- **Information Table**: Displays current values for ATR, strong bar condition and volume condition.
## Usage Notes
1. This indicator is designed for manual trading, not automated execution.
2. It works best when combined with analysis of major trend lines, support, and resistance levels.
3. Exercise caution with very large setup candles.
4. Consider additional filters or money management rules for enhanced performance.
5. For higher timeframe bias validation, consider incorporating a 100-period break of structure (BOS) analysis.
## Customization
The indicator includes several input parameters that can be adjusted:
- EMA Length
- ATR Length and Threshold
- Volume Multiplier
- Strong Bar Percentage
Users can also toggle the visibility of stop loss and take profit markers.
Remember, while this indicator can identify potential setups, it should be used in conjunction with other forms of analysis and risk management strategies. Always consider the overall market context and your personal risk tolerance when making trading decisions.
Pine Script® göstergesi