MACD Strategy - Backtest [AlgoRider]█ OVERVIEW
Hello dear Tradingviewers !
We are excited to share with you this new indicator which simulates a trading strategy based solely on the well-known technical indicator MACD . We designed it for the sole educational and analytical purposes of showing novice traders and new investors that basing a trading strategy only on one such technical indicator is not necessarily a good thing to do. We do not recommend to apply this strategy for real.
Thanks to this indicator redesigned in our own way by incorporating our simple and easy-to-use Backtest functionality, you will be able to see and report on the performance and results that such a strategy has produced in the past.
The configuration window has also been designed to be easily readable and simple to use. Our goal is to make parameter customization as easy as possible.
█ HOW THE STRATEGY WORKS
• The script will simply trigger Long entries when bullish MACD crossings appear (the Macd line crosses the Signal line upwards) and Short entries when bearish MACD crossings appear (the Macd line crosses below the signal line).
• A Short signal ends a Long trade, a Long signal ends a Short trade.
• The script also allows setting up custom TP and SL.
• An option allows you to trigger early crossings, which will influence entries and exits.
• There is no repaint, once an entry/exit symbol or drawing is displayed it doesn't change anymore. The Short and Long signals appear at the open of the candles, just after the signal was confirmed at the close of the previous candle. The custom TP and custom SL signals can appear when a candle is not yet finished, but once displayed they don't change.
█ HOW TO PROCEED
1 — Once the script is applied to your chart, it already works with its default settings. You can already see the performance of the strategy in the data table directly on the chart (in the top right corner by default).
2 — You can customize the strategy and influence the results/performance by modifying its parameters. 3 types of parameters are present and can be modified.
3 — You can use this indicator in all types of markets.
4 — You can apply the script in every timeframe.
█ PARAMETERS
• Settings For Backtesting
- Strategy : Choose from a drop-down list if the strategy should execute only Long trades or only Short trades or both. Default Both.
- Invest. : Choose the amount you want to invest in the simulation. Default 10000.
- Position : Choose the amount of the position (Size order) that will be used during the simulation. This will be the $ amount staked/involved for each trade entry.
Ex: If you put 20000 in position and 10000 in Invest. We consider that you use at least a leverage x2. Default 10000.
- Slipp. TP : Choose the amount in percentage of average slippage for Take Profits. This parameter makes it possible to predict a potential gap between the theoretical exit price for each TP (On the graph) and the real exit price on an exchange when implementing the strategy for real (slippage may be due to a time lag of a few seconds from execution time of the order on the exchange and/or due to the execution of a market order).
Ex: If a TP exit order of a Long trade, with entry $19000 (on BTCUSDT ), is carried out in theory on the chart at $20000, in practice on the exchange the script have indeed sent an exit order at 20000 , but if the true exit price is 20050, the TP slippage is then +0.25%. Default 0.
- Slipp. SL : Choose the amount in percentage of average slippage for Stop Losses. This parameter makes it possible to predict a potential gap between the theoretical exit price for each SL (On the graph) and the real exit price on an exchange when implementing the strategy for real.
Ex: If an SL exit order of a Long trade, entry $19000 (on BTCUSDT ), is carried out in theory on the chart at $18000, in practice on the exchange the script have indeed sent an exit order at 18000 $, but if the true exit price is 17950, the slippage SL is then +0.278%. Default 0.
- Fees % : Choose the percentage amount of fees applied to each trade to simulate the application of the strategy on the exchange of your choice. Applies to the entry and exit of each trade. Ex: For Binance Futures: 0.04; For Bybit futures: 0.06; For Ftx Futures: 0.075. Default 0.
- Cumulate Trades : If you check this, the Backtest will use 100% of the balance as Order Size (Position) for All or in the next X consecutive trades. Default not checked.
⚠️ Be Careful please, this option is available to show the full extent and possibilities of the algorithm when pushed to its limits thanks to the accumulation of profits (cumulative earnings ), but it is a strategy that involves great risk. If a bad trade suffers a -50% loss, 50% of the account balance is lost, if the position is liquidated, the entire account balance is lost.
- All : If you check this All trades will be accumulated. Default not checked.
- Consecutive Trades : Choose the number of trades to accumulate. After X consecutive trades, the algorithm reassigns the initial order size to the current one and starts again for X consecutive trades. Minimum Value 2, Default 2.
• Settings To Optimize Performances and Risk Management
- Fast_MA : Choose the length of the Fast Moving Average. Default 12.
- Slow_MA : Choose the length of the Slow Moving Average. Default 26.
- Enable Early Crossings : If you check this, when the algorithm will detect an early crossing wethere bullish or bearish , it will trigger the Long or Short entries. Default not checked.
- Oscillator MA Type : Choose if the Macd line should be an Exponential Moving Average or a Simple Moving Average . Default Expo.
- Signal Line MA Type : Choose if the Signal line should be an Exponential Moving Average or a Simple Moving Average . Default Expo.
- Use TP / Use SL : If you check these, the algorithm will trigger personalized trade exit signals when the price evolution has reached the amounts indicated since the trade entry. Default not Checked.
- % TP - SL : Indicate here the personalized amount in percentage that you want for your Take Profit and Stop Loss of each trade. Default 15-5.
• Settings For Appearances
- Small-size Data Table : If you check this, the data table will become smaller to free up more space on the chart to make it visually more pleasing. Default not checked.
Hide Table /
- Hide Labels / : You can check these to get a cleaner chart and focus only on what interests you in the indicator. Default not checked.
Hide Risk-Reward Areas
█ LIMITATIONS
• ⚠️ We repeat it once again, this strategy is not intended to be reproduced in real conditions, we have designed it for educational and analytical purposes only.
• Even if you see good performances when you backtest the strategy, you must take into account that these results are performed in the past and that in no case does this guarantee that these same performances will be repeated again in the future.
• When you run for real a trading strategy you must be aware of the fact that you are solely responsible for the results that you will be able to obtain and you must be aware of the possibility at all times of partial or even total losses of your invested capital.
• Keep in mind that generating profits in trading is difficult. A strategy can perform very well at one time in the past during a period that is favorable to it, then from one day to the next it can give really bad results for several months or years.
• When backtesting a trading strategy, there are many factors to consider, not just trade entries to which you add a Take Profit and sometimes a Stop Loss. You must at least take into account the size of the position in relation to the capital you want to invest, the trading fees, the slippages (which can be really important depending on the exchange on which you are trading and depending on the asset you are trading), trading frequency, risk management, momentum, volumes and even more.
The information published here on TradingView is not prohibited, doesn't constitute investment advice, and isn't created solely for qualified investors.
═════════════════════════════════════════════════════════════════════════
Important to note : our indicators with the same backtesting system are published in separate publications, because putting them together in a single script would considerably slow down the execution of the script. In addition each indicator, even when it is based on a simple technical indicator, has several options, parameters and entry/exit conditions specific to the underlying technical indicator. Finally, we want to keep the simplicity of use, configuration and understanding of our indicator by not mixing strategies that have nothing to do with each other.
"stop loss" için komut dosyalarını ara
Webhook Starter Kit [HullBuster]
Introduction
This is an open source strategy which provides a framework for webhook enabled projects. It is designed to work out-of-the-box on any instrument triggering on an intraday bar interval. This is a full featured script with an emphasis on actual trading at a brokerage through the TradingView alert mechanism and without requiring browser plugins.
The source code is written in a self documenting style with clearly defined sections. The sections “communicate” with each other through state variables making it easy for the strategy to evolve and improve. This is an excellent place for Pine Language beginners to start their strategy building journey. The script exhibits many Pine Language features which will certainly ad power to your script building abilities.
This script employs a basic trend follow strategy utilizing a forward pyramiding technique. Trend detection is implemented through the use of two higher time frame series. The market entry setup is a Simple Moving Average crossover. Positions exit by passing through conditional take profit logic. The script creates ten indicators including a Zscore oscillator to measure support and resistance levels. The indicator parameters are exposed through 47 strategy inputs segregated into seven sections. All of the inputs are equipped with detailed tool tips to help you get started.
To improve the transition from simulation to execution, strategy.entry and strategy.exit calls show enhanced message text with embedded keywords that are combined with the TradingView placeholders at alert time. Thereby, enabling a single JSON message to generate multiple execution events. This is genius stuff from the Pine Language development team. Really excellent work!
This document provides a sample alert message that can be applied to this script with relatively little modification. Without altering the code, the strategy inputs can alter the behavior to generate thousands of orders or simply a few dozen. It can be applied to crypto, stocks or forex instruments. A good way to look at this script is as a webhook lab that can aid in the development of your own endpoint processor, impress your co-workers and have hours of fun.
By no means is a webhook required or even necessary to benefit from this script. The setups, exits, trend detection, pyramids and DCA algorithms can be easily replaced with more sophisticated versions. The modular design of the script logic allows you to incrementally learn and advance this script into a functional trading system that you can be proud of.
Design
This is a trend following strategy that enters long above the trend line and short below. There are five trend lines that are visible by default but can be turned off in Section 7. Identified, in frequency order, as follows:
1. - EMA in the chart time frame. Intended to track price pressure. Configured in Section 3.
2. - ALMA in the higher time frame specified in Section 2 Signal Line Period.
3. - Linear Regression in the higher time frame specified in Section 2 Signal Line Period.
4. - Linear Regression in the higher time frame specified in Section 2 Signal Line Period.
5. - DEMA in the higher time frame specified in Section 2 Trend Line Period.
The Blue, Green and Orange lines are signal lines are on the same time frame. The time frame selected should be at least five times greater than the chart time frame. The Purple line represents the trend line for which prices above the line suggest a rising market and prices below a falling market. The time frame selected for the trend should be at least five times greater than the signal lines.
Three oscillators are created as follows:
1. Stochastic - In the chart time frame. Used to enter forward pyramids.
2. Stochastic - In the Trend period. Used to detect exit conditions.
3. Zscore - In the Signal period. Used to detect exit conditions.
The Stochastics are configured identically other than the time frame. The period is set in Section 2.
Two Simple Moving Averages provide the trade entry conditions in the form of a crossover. Crossing up is a long entry and down is a short. This is in fact the same setup you get when you select a basic strategy from the Pine editor. The crossovers are configured in Section 3. You can see where the crosses are occurring by enabling Show Entry Regions in Section 7.
The script has the capacity for pyramids and DCA. Forward pyramids are enabled by setting the Pyramid properties tab with a non zero value. In this case add on trades will enter the market on dips above the position open price. This process will continue until the trade exits. Downward pyramids are available in Crypto and Range mode only. In this case add on trades are placed below the entry price in the drawdown space until the stop is hit. To enable downward pyramids set the Pyramid Minimum Span In Section 1 to a non zero value.
This implementation of Dollar Cost Averaging (DCA) triggers off consecutive losses. Each loss in a run increments a sequence number. The position size is increased as a multiple of this sequence. When the position eventually closes at a profit the sequence is reset. DCA is enabled by setting the Maximum DCA Increments In Section 1 to a non zero value.
It should be noted that the pyramid and DCA features are implemented using a rudimentary design and as such do not perform with the precision of my invite only scripts. They are intended as a feature to stress test your webhook endpoint. As is, you will need to buttress the logic for it to be part of an automated trading system. It is for this reason that I did not apply a Martingale algorithm to this pyramid implementation. But, hey, it’s an open source script so there is plenty of room for learning and your own experimentation.
How does it work
The overall behavior of the script is governed by the Trading Mode selection in Section 1. It is the very first input so you should think about what behavior you intend for this strategy at the onset of the configuration. As previously discussed, this script is designed to be a trend follower. The trend being defined as where the purple line is predominately heading. In BiDir mode, SMA crossovers above the purple line will open long positions and crosses below the line will open short. If pyramiding is enabled add on trades will accumulate on dips above the entry price. The value applied to the Minimum Profit input in Section 1 establishes the threshold for a profitable exit. This is not a hard number exit. The conditional exit logic must be satisfied in order to permit the trade to close. This is where the effort put into the indicator calibration is realized. There are four ways the trade can exit at a profit:
1. Natural exit. When the blue line crosses the green line the trade will close. For a long position the blue line must cross under the green line (downward). For a short the blue must cross over the green (upward).
2. Alma / Linear Regression event. The distance the blue line is from the green and the relative speed the cross is experiencing determines this event. The activation thresholds are set in Section 6 and relies on the period and length set in Section 2. A long position will exit on an upward thrust which exceeds the activation threshold. A short will exit on a downward thrust.
3. Exponential event. The distance the yellow line is from the blue and the relative speed the cross is experiencing determines this event. The activation thresholds are set in Section 3 and relies on the period and length set in the same section.
4. Stochastic event. The purple line stochastic is used to measure overbought and over sold levels with regard to position exits. Signal line positions combined with a reading over 80 signals a long profit exit. Similarly, readings below 20 signal a short profit exit.
Another, optional, way to exit a position is by Bale Out. You can enable this feature in Section 1. This is a handy way to reduce the risk when carrying a large pyramid stack. Instead of waiting for the entire position to recover we exit early (bale out) as soon as the profit value has doubled.
There are lots of ways to implement a bale out but the method I used here provides a succinct example. Feel free to improve on it if you like. To see where the Bale Outs occur, enable Show Bale Outs in Section 7. Red labels are rendered below each exit point on the chart.
There are seven selectable Trading Modes available from the drop down in Section 1:
1. Long - Uses the strategy.risk.allow_entry_in to execute long only trades. You will still see shorts on the chart.
2. Short - Uses the strategy.risk.allow_entry_in to execute short only trades. You will still see long trades on the chart.
3. BiDir - This mode is for margin trading with a stop. If a long position was initiated above the trend line and the price has now fallen below the trend, the position will be reversed after the stop is hit. Forward pyramiding is available in this mode if you set the Pyramiding value in the Properties tab. DCA can also be activated.
4. Flip Flop - This is a bidirectional trading mode that automatically reverses on a trend line crossover. This is distinctively different from BiDir since you will get a reversal even without a stop which is advantageous in non-margin trading.
5. Crypto - This mode is for crypto trading where you are buying the coins outright. In this case you likely want to accumulate coins on a crash. Especially, when all the news outlets are talking about the end of Bitcoin and you see nice deep valleys on the chart. Certainly, under these conditions, the market will be well below the purple line. No margin so you can’t go short. Downward pyramids are enabled for Crypto mode when two conditions are met. First the Pyramiding value in the Properties tab must be non zero. Second the Pyramid Minimum Span in Section 1 must be non zero.
6. Range - This is a counter trend trading mode. Longs are entered below the purple trend line and shorts above. Useful when you want to test your webhook in a market where the trend line is bisecting the signal line series. Remember that this strategy is a trend follower. It’s going to get chopped out in a range bound market. By turning on the Range mode you will at least see profitable trades while stuck in the range. However, when the market eventually picks a direction, this mode will sustain losses. This range trading mode is a rudimentary implementation that will need a lot of improvement if you want to create a reliable switch hitter (trend/range combo).
7. No Trade. Useful when setting up the trend lines and the entry and exit is not important.
Once in the trade, long or short, the script tests the exit condition on every bar. If not a profitable exit then it checks if a pyramid is required. As mentioned earlier, the entry setups are quite primitive. Although they can easily be replaced by more sophisticated algorithms, what I really wanted to show is the diminished role of the position entry in the overall life of the trade. Professional traders spend much more time on the management of the trade beyond the market entry. While your trade entry is important, you can get in almost anywhere and still land a profitable exit.
If DCA is enabled, the size of the position will increase in response to consecutive losses. The number of times the position can increase is limited by the number set in Maximum DCA Increments of Section 1. Once the position breaks the losing streak the trade size will return the default quantity set in the Properties tab. It should be noted that the Initial Capital amount set in the Properties tab does not affect the simulation in the same way as a real account. In reality, running out of money will certainly halt trading. In fact, your account would be frozen long before the last penny was committed to a trade. On the other hand, TradingView will keep running the simulation until the current bar even if your funds have been technically depleted.
Entry and exit use the strategy.entry and strategy.exit calls respectfully. The alert_message parameter has special keywords that the endpoint expects to properly calculate position size and message sequence. The alert message will embed these keywords in the JSON object through the {{strategy.order.alert_message}} placeholder. You should use whatever keywords are expected from the endpoint you intend to webhook in to.
Webhook Integration
The TradingView alerts dialog provides a way to connect your script to an external system which could actually execute your trade. This is a fantastic feature that enables you to separate the data feed and technical analysis from the execution and reporting systems. Using this feature it is possible to create a fully automated trading system entirely on the cloud. Of course, there is some work to get it all going in a reliable fashion. Being a strategy type script place holders such as {{strategy.position_size}} can be embedded in the alert message text. There are more than 10 variables which can write internal script values into the message for delivery to the specified endpoint.
Entry and exit use the strategy.entry and strategy.exit calls respectfully. The alert_message parameter has special keywords that my endpoint expects to properly calculate position size and message sequence. The alert message will embed these keywords in the JSON object through the {{strategy.order.alert_message}} placeholder. You should use whatever keywords are expected from the endpoint you intend to webhook in to.
Here is an excerpt of the fields I use in my webhook signal:
"broker_id": "kraken",
"account_id": "XXX XXXX XXXX XXXX",
"symbol_id": "XMRUSD",
"action": "{{strategy.order.action}}",
"strategy": "{{strategy.order.id}}",
"lots": "{{strategy.order.contracts}}",
"price": "{{strategy.order.price}}",
"comment": "{{strategy.order.alert_message}}",
"timestamp": "{{time}}"
Though TradingView does a great job in dispatching your alert this feature does come with a few idiosyncrasies. Namely, a single transaction call in your script may cause multiple transmissions to the endpoint. If you are using placeholders each message describes part of the transaction sequence. A good example is closing a pyramid stack. Although the script makes a single strategy.close() call, the endpoint actually receives a close message for each pyramid trade. The broker, on the other hand, only requires a single close. The incongruity of this situation is exacerbated by the possibility of messages being received out of sequence. Depending on the type of order designated in the message, a close or a reversal. This could have a disastrous effect on your live account. This broker simulator has no idea what is actually going on at your real account. Its just doing the job of running the simulation and sending out the computed results. If your TradingView simulation falls out of alignment with the actual trading account lots of really bad things could happen. Like your script thinks your are currently long but the account is actually short. Reversals from this point forward will always be wrong with no one the wiser. Human intervention will be required to restore congruence. But how does anyone find out this is occurring? In closed systems engineering this is known as entropy. In practice your webhook logic should be robust enough to detect these conditions. Be generous with the placeholder usage and give the webhook code plenty of information to compare states. Both issuer and receiver. Don’t blindly commit incoming signals without verifying system integrity.
Setup
The following steps provide a very brief set of instructions that will get you started on your first configuration. After you’ve gone through the process a couple of times, you won’t need these anymore. It’s really a simple script after all. I have several example configurations that I used to create the performance charts shown. I can share them with you if you like. Of course, if you’ve modified the code then these steps are probably obsolete.
There are 47 inputs divided into seven sections. For the most part, the configuration process is designed to flow from top to bottom. Handy, tool tips are available on every field to help get you through the initial setup.
Step 1. Input the Base Currency and Order Size in the Properties tab. Set the Pyramiding value to zero.
Step 2. Select the Trading Mode you intend to test with from the drop down in Section 1. I usually select No Trade until I’ve setup all of the trend lines, profit and stop levels.
Step 3. Put in your Minimum Profit and Stop Loss in the first section. This is in pips or currency basis points (chart right side scale). Remember that the profit is taken as a conditional exit not a fixed limit. The actual profit taken will almost always be greater than the amount specified. The stop loss, on the other hand, is indeed a hard number which is executed by the TradingView broker simulator when the threshold is breached.
Step 4. Apply the appropriate value to the Tick Scalar field in Section 1. This value is used to remove the pipette from the price. You can enable the Summary Report in Section 7 to see the TradingView minimum tick size of the current chart.
Step 5. Apply the appropriate Price Normalizer value in Section 1. This value is used to normalize the instrument price for differential calculations. Basically, we want to increase the magnitude to significant digits to make the numbers more meaningful in comparisons. Though I have used many normalization techniques, I have always found this method to provide a simple and lightweight solution for less demanding applications. Most of the time the default value will be sufficient. The Tick Scalar and Price Normalizer value work together within a single calculation so changing either will affect all delta result values.
Step 6. Turn on the trend line plots in Section 7. Then configure Section 2. Try to get the plots to show you what’s really happening not what you want to happen. The most important is the purple trend line. Select an interval and length that seem to identify where prices tend to go during non-consolidation periods. Remember that a natural exit is when the blue crosses the green line.
Step 7. Enable Show Event Regions in Section 7. Then adjust Section 6. Blue background fills are spikes and red fills are plunging prices. These measurements should be hard to come by so you should see relatively few fills on the chart if you’ve set this up as intended. Section 6 includes the Zscore oscillator the state of which combines with the signal lines to detect statistically significant price movement. The Zscore is a zero based calculation with positive and negative magnitude readings. You want to input a reasonably large number slightly below the maximum amplitude seen on the chart. Both rise and fall inputs are entered as a positive real number. You can easily use my code to create a separate indicator if you want to see it in action. The default value is sufficient for most configurations.
Step 8. Turn off Show Event Regions and enable Show Entry Regions in Section 7. Then adjust Section 3. This section contains two parts. The entry setup crossovers and EMA events. Adjust the crossovers first. That is the Fast Cross Length and Slow Cross Length. The frequency of your trades will be shown as blue and red fills. There should be a lot. Then turn off Show Event Regions and enable Display EMA Peaks. Adjust all the fields that have the word EMA. This is actually the yellow line on the chart. The blue and red fills should show much less than the crossovers but more than event fills shown in Step 7.
Step 9. Change the Trading Mode to BiDir if you selected No Trades previously. Look on the chart and see where the trades are occurring. Make adjustments to the Minimum Profit and Stop Offset in Section 1 if necessary. Wider profits and stops reduce the trade frequency.
Step 10. Go to Section 4 and 5 and make fine tuning adjustments to the long and short side.
Example Settings
To reproduce the performance shown on the chart please use the following configuration: (Bitcoin on the Kraken exchange)
1. Select XBTUSD Kraken as the chart symbol.
2. On the properties tab set the Order Size to: 0.01 Bitcoin
3. On the properties tab set the Pyramiding to: 12
4. In Section 1: Select “Crypto” for the Trading Model
5. In Section 1: Input 2000 for the Minimum Profit
6. In Section 1: Input 0 for the Stop Offset (No Stop)
7. In Section 1: Input 10 for the Tick Scalar
8. In Section 1: Input 1000 for the Price Normalizer
9. In Section 1: Input 2000 for the Pyramid Minimum Span
10. In Section 1: Check mark the Position Bale Out
11. In Section 2: Input 60 for the Signal Line Period
12. In Section 2: Input 1440 for the Trend Line Period
13. In Section 2: Input 5 for the Fast Alma Length
14. In Section 2: Input 22 for the Fast LinReg Length
15. In Section 2: Input 100 for the Slow LinReg Length
16. In Section 2: Input 90 for the Trend Line Length
17. In Section 2: Input 14 Stochastic Length
18. In Section 3: Input 9 Fast Cross Length
19. In Section 3: Input 24 Slow Cross Length
20. In Section 3: Input 8 Fast EMA Length
21. In Section 3: Input 10 Fast EMA Rise NetChg
22. In Section 3: Input 1 Fast EMA Rise ROC
23. In Section 3: Input 10 Fast EMA Fall NetChg
24. In Section 3: Input 1 Fast EMA Fall ROC
25. In Section 4: Check mark the Long Natural Exit
26. In Section 4: Check mark the Long Signal Exit
27. In Section 4: Check mark the Long Price Event Exit
28. In Section 4: Check mark the Long Stochastic Exit
29. In Section 5: Check mark the Short Natural Exit
30. In Section 5: Check mark the Short Signal Exit
31. In Section 5: Check mark the Short Price Event Exit
32. In Section 5: Check mark the Short Stochastic Exit
33. In Section 6: Input 120 Rise Event NetChg
34. In Section 6: Input 1 Rise Event ROC
35. In Section 6: Input 5 Min Above Zero ZScore
36. In Section 6: Input 120 Fall Event NetChg
37. In Section 6: Input 1 Fall Event ROC
38. In Section 6: Input 5 Min Below Zero ZScore
In this configuration we are trading in long only mode and have enabled downward pyramiding. The purple trend line is based on the day (1440) period. The length is set at 90 days so it’s going to take a while for the trend line to alter course should this symbol decide to node dive for a prolonged amount of time. Your trades will still go long under those circumstances. Since downward accumulation is enabled, your position size will grow on the way down.
The performance example is Bitcoin so we assume the trader is buying coins outright. That being the case we don’t need a stop since we will never receive a margin call. New buy signals will be generated when the price exceeds the magnitude and speed defined by the Event Net Change and Rate of Change.
Feel free to PM me with any questions related to this script. Thank you and happy trading!
CFTC RULE 4.41
These results are based on simulated or hypothetical performance results that have certain inherent limitations. Unlike the results shown in an actual performance record, these results do not represent actual trading. Also, because these trades have not actually been executed, these results may have under-or over-compensated for the impact, if any, of certain market factors, such as lack of liquidity. Simulated or hypothetical trading programs in general are also subject to the fact that they are designed with the benefit of hindsight. No representation is being made that any account will or is likely to achieve profits or losses similar to these being shown.

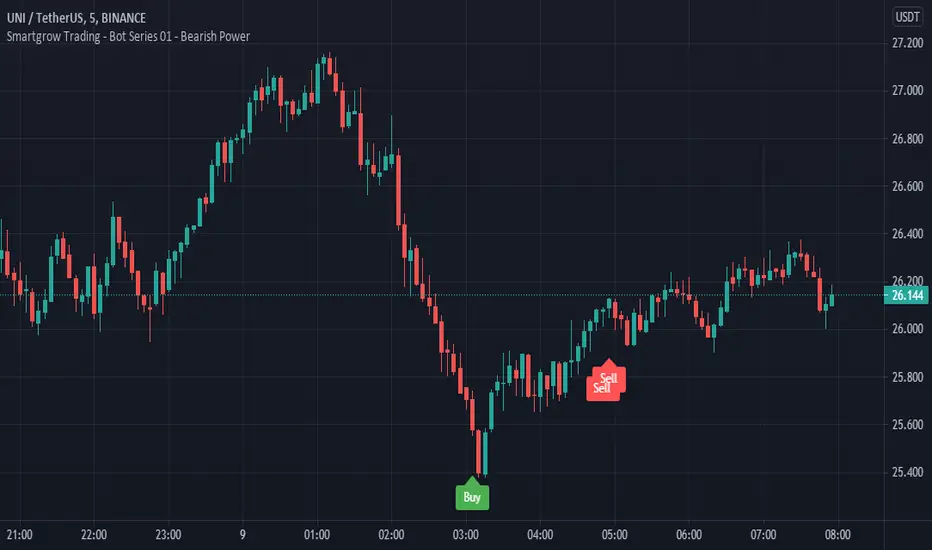
Smartgrow Trading - Bot Series 01 - Bearish PowerWelcome to our first Tradingview trading bot.
We develop signals which have been specially developed for crypto trading bots. We publish new indicators at regular intervals.
The main idea behind the bot is to use custom created indicators in a short and longer term timeframe to signal potential trendreversals in downtrends or ranging markets. The bot is not waiting for a trend confirmation signal before entering a trade, on the contrary, the bot waits for statistical extreme values to open a trade. When potential signals are detected we are trailing price to find the best spot to enter a trade. With this approach we buy in strong oversold areas as these have great potential to move in the other direction again. The sell signals are also generated by this custom indicator only selling off, if a stronger recovery in the market has occured. The potential profit margin is therefore between the best possible entry into a heavily oversold market and a recovery of the market.
So this tradingbot isnt designed to work with take profit, stop loss or trailing stop loss. This would result in a long term loss and is therefore not recommented. Also the bot is not tested in any other market like futures or stocks. So we recommend to use it in crypto spot market only.
Depending on market situations, potential losses can occur when a market is strongly bearish and does not want to recover over a long range, or when the bot has entered a trade to early. We have built in a safety mechanism for detecting further downtrends to avoid major losses. This mechanism is part of the needed risk management Therefore we are suggesting to use a proper risk management so only use 2-5% of your funds per trade. We use this bot with 2,5% funds per trade for our personal use. The study needs to be set up in the 5 min chart to work and you need to set up one buy alarm and one sell alarm per pair. The Signals are very picky therefore it is suitable to apply it on all possible pairs on your exchange excluding stable and shitcoins. You could test it in other financial markets but the bot was developed especially for crypto markets. If you have questions regarding pairs or want to see real life performance, feel free to contact us.
This indicator using different timeframes so it is sending a repainting warning. Cause it calculates values in a different timeframe. But thats normal and it wont recalculate results.
We sell this indicator so it is invite only. But of cause you can test it before buying.
If there are questions, write them into the comments or contact us directly over the direct message. Happy Trading!
Skript nur auf Einladung
Zignaly TutorialThis strategy serves as a beginner's guide to connect TradingView signals to Zignaly Crypto Trading Platform.
It was originally tested at BTCUSDT pair and 1D timeframe.
Before using this documentation it's recommended that you:
Use default TradingView strategy script or another script and setup its associated alert manually. Just make the alert pop-up in the screen.
Create a 'Copy-Trader provider' (or Signal Provider) in Zignaly and send signals to it either thanks to your browser or with some basic programming.
SETTINGS
__ SETTINGS - Capital
(CAPITAL) Capital quote invested per order in USDT units {100.0}. This setting is only used when '(ZIG) Provider type' is set to 'Signal Provider'.
(CAPITAL) Capital percentage invested per order (%) {25.0}. This setting is only used when '(ZIG) Provider type' is set to 'Copy Trader Provider'.
__ SETTINGS - Misc
(ZIG) Enable Alert message {True}: Whether to enable alert message or not.
(DEBUG) Enable debug on order comments {True}: Whether to show alerts on order comments or not.
Number of decimal digits for Prices {2}.
(DECIMAL) Maximum number of decimal for contracts {3}.
__ SETTINGS - Zignaly
(ZIG) Integration type {TradingView only}: Hybrid : Both TradingView and Zignaly handle take profit, trailing stops and stop losses. Useful if you are scared about TradingView not firing an alert. It might arise problems if TradingView and Zignaly get out of sync. TradingView only : TradingView sends entry and exit orders to Zignaly so that Zignaly only buys or sells. Zignaly won't handle stop loss or other settings on its own.
(ZIG) Zignaly Alert Type {WebHook}: 'Email' or 'WebHook'.
(ZIG) Provider type {Copy Trader Provider}: 'Copy Trader Provider' or 'Signal Provider'. 'Copy Trader Provider' sends a percentage to manage. 'Signal Provider' sends a quote to manage.
(ZIG) Exchange: 'Binance' or 'Kucoin'.
(ZIG) Exchange Type {Spot}: 'Spot' or 'Futures'.
(ZIG) Leverage {1}. Set it to '1' when '(ZIG) Exchange Type' is set to 'Spot'.
__ SETTINGS - Strategy
(STRAT) Strategy Type: 'Long and Short', 'Long Only' or 'Short Only'.
(STOPTAKE) Take Profit? {false}: Whether to enable Take Profit.
(STOPTAKE) Stop Loss? {True}: Whether to enable Stop Loss.
(TRAILING) Enable Trailing Take Profit (%) {True}: Whether to enable Trailing Take Profit.
(STOPTAKE) Take Profit % {3.0}: Take profit percentage. This setting is only used when '(STOPTAKE) Take Profit?' setting is set to true.
(STOPTAKE) Stop Loss % {2.0}: Stop loss percentage. This setting is only used when '(STOPTAKE) Stop Loss?' setting is set to true.
(TRAILING) Trailing Take Profit Trigger (%) {2.5}: Trailing Stop Trigger Percentage. This setting is only used when '(TRAILING) Enable Trailing Take Profit (%)' setting is set to true.
(TRAILING) Trailing Take Profit as a percentage of Trailing Take Profit Trigger (%) {25.0}: Trailing Stop Distance Percentage. This setting is only used when '(TRAILING) Enable Trailing Take Profit (%)' setting is set to true.
(RECENT) Number of minutes to wait to open a new order after the previous one has been opened {6}.
DEFAULT SETTINGS
By default this strategy has been setup with these beginner settings:
'(ZIG) Integration type' : TradingView only
'(ZIG) Provider type' : 'Copy Trader Provider'
'(ZIG) Exchange' : 'Binance'
'(ZIG) Exchange Type' : 'Spot'
'(STRAT) Strategy Type' : 'Long Only'
'(ZIG) Leverage' : '1' (Or no leverage)
but you can change those settings if needed.
FIRST STEP
For both future of spot markets you should make sure to change '(ZIG) Zignaly Alert Type' to match either WebHook or Email. If you have a non paid account in TradingView as in October 2020 you would have to use Email which it's free to use.
RECOMMENDED SETTINGS
__ RECOMMENDED SETTINGS - Spot markets
'(ZIG) Exchange Type' setting should be set to 'Spot'
'(STRAT) Strategy Type' setting should be set to 'Long Only'
'(ZIG) Leverage' setting should be set to '1'
__ RECOMMENDED SETTINGS - Future markets
'(ZIG) Exchange Type' setting should be set to 'Futures'
'(STRAT) Strategy Type' setting should be set to 'Long and Short'
'(ZIG) Leverage' setting might be changed if desired.
__ RECOMMENDED SETTINGS - Signal Providers
'(ZIG) Provider type' setting should be set to 'Signal Provider'
'(CAPITAL) Capital quote invested per order in USDT units' setting might be changed if desired.
__ RECOMMENDED SETTINGS - Copy Trader Providers
'(ZIG) Provider type' setting should be set to 'Copy Trader Provider'
'(CAPITAL) Capital percentage invested per order (%)' setting might be changed if desired.
Strategy Properties setting: 'Initial Capital' might be changed if desired.
INTEGRATION TYPE EXPLANATION
'Hybrid': Both TradingView and Zignaly handle take profit, trailing stops and stop losses. Useful if you are scared about TradingView not firing an alert. It might arise problems if TradingView and Zignaly get out of sync.
'TradingView only': TradingView sends entry and exit orders to Zignaly so that Zignaly only buys or sells. Zignaly won't handle stop loss or other settings on its own.
HOW TO USE THIS STRATEGY
Beginner: Copy and paste the strategy and change it to your needs. Turn off '(DEBUG) Enable debug on order comments' setting.
Medium: Reuse functions and inputs from this strategy into your own as if it was a library.
Advanced: Check Strategy Tester. List of trades. Copy and paste the different suggested 'alert_message' variable contents to your script.
Expert: I needed a way to pass data from TradingView script to the alert. Now I know it's the 'alert_message' variable. I can do this own my own.
ALERTS SETUP
This is the important piece of information that allows you to connect TradingView to Zignaly in a semi-automatic manner.
__ ALERTS SETUP - WebHook
Webhook URL: https : // zignaly . com / api / signals.php?key=MYSECRETKEY
Message: { {{strategy.order.alert_message}} , "key" : "MYSECRETKEY" }
__ ALERTS SETUP - Email
Setup a new Hotmail account
Add it as an 'SMS email' in TradingView Profile settings page.
Confirm your own the email address
Create a rule in your Hotmail account that 'Redirects' (not forwards) emails to 'signals @ zignaly . email' when (1): 'Subject' includes 'Alert', (2): 'Email body' contains string 'MYZIGNALYREDIRECTTRIGGER' and (3): 'From' contains 'noreply @ tradingview . com'.
In 'More Actions' check: Send Email-to-SMS
Message: ||{{strategy.order.alert_message}}||key=MYSECRETKEY||
MYZIGNALYREDIRECTTRIGGER
'(DEBUG) Enable debug on order comments' is turned on by default so that you can see in the Strategy Tester. List of Trades. The different orders alert_message that would have been sent to your alert. You might want to turn it off it some many letters in the screen is problem.
STRATEGY ADVICE
If you turn on 'Take Profit' then turn off 'Trailing Take Profit'.
ZIGNALY SIDE ADVICE
If you are a 'Signal Provider' make sure that 'Allow reusing the same signalId if there isn't any open position using it?' setting in the profile tab is set to true.
You can find your 'MYSECRETKEY' in your 'Copy Trader/Signal' provider Edit tab at 'Signal URL'.
ADDITIONAL ZIGNALY DOCUMENTATION
docs . zignaly . com / signals / how-to -- How to send signals to Zignaly
3 Ways to send signals to Zignaly
SIGNALS
FINAL REMARKS
This strategy tries to match the Pine Script Coding Conventions as best as possible.

All Instrument Swing Trader with Pyramids, DCA and Leverage
Introduction
This is my most advanced Pine 4 script so far. It combines my range trader algorithms with my trend following pyramids all on a single interval. This script includes my beta tested DCA feature along with simulated leverage and buying power calculations. It has a twin study with several alerts. The features in this script allow you to experiment with different risk strategies and evaluate the approximate impact on your account capital. The script is flexible enough to run on instruments from different markets and at various bar intervals. This strategy can be run in three different modes: long, short and bidirectional. The bidirectional mode has two split modes (Ping Pong and BiDir). It also generates a summary report label with information not available in the TradingView Performance report such as Rate Of Return Standard Deviation and other Sharpe Ratio input values. Notable features include the following:
- Swing Trading Paradigm
- Uni or Bidirectional trading modes
- Calculation presets for Crypto, Stocks and Forex
- Conditional Minimum Profit
- Hard stop loss field
- Two types of DCA (Positive and Negative)
- Discretionary Pyramid levels with threshold adjustment and limiter
- Consecutive loss counter with preset and label
- Reentry loss limiter and trade entry caution fields
- Simulated Leverage and margin call warning label (approximation only)
- Buying power report labels (approximation only)
- Rate Of Return report with input values for Sharpe Ratio, Sortino and others
- Summary report label with real-time status indicators
- Trend follow bias modes (Its still range trading)
- Six anti-chop settings
- Single interval strategy to reduce repaint occurrence
This is a swing trading strategy so the behavior of this script is to buy on weakness and sell on strength. As such trade orders are placed in a counter direction to price pressure. What you will see on the chart is a short position on peaks and a long position on valleys. Just to be clear, the range as well as trends are merely illusions as the chart only receives prices. However, this script attempts to calculate pivot points from the price stream. Rising pivots are shorts and falling pivots are longs. I refer to pivots as a vertex in this script which adds structural components to the chart formation (point, sides and a base). When trading in “Ping Pong” mode long and short positions are intermingled continuously as long as there exists a detectable vertex. Unfortunately, this can work against your backtest profitability on long duration trends where prices continue in a single direction without pullback. I have designed various features in the script to compensate for this event. A well configured script should perform in a range bound market and minimize losses in a trend. For a range trader the trend is most certainly not your friend. I also have a trend following version of this script for those not interested in trading the range.
This script makes use of the TradingView pyramid feature accessible from the properties tab. Additional trades can be placed in the draw-down space increasing the position size and thereby increasing the profit or loss when the position finally closes. Each individual add on trade increases its order size as a multiple of its pyramid level. This makes it easy to comply with NFA FIFO Rule 2-43(b) if the trades are executed here in America. The inputs dialog box contains various settings to adjust where the add on trades show up, under what circumstances and how frequent if at all. Please be advised that pyramiding is an advanced feature and can wipe out your account capital if your not careful. You can use the “Performance Bond Leverage” feature to stress test your account capital with varying pyramid levels during the backtest. Use modest settings with realistic capital until you discover what you think you can handle. See the“Performance Bond Leverage” description for more information.
In addition to pyramiding this script employs DCA which enables users to experiment with loss recovery techniques. This is another advanced feature which can increase the order size on new trades in response to stopped out or winning streak trades. The script keeps track of debt incurred from losing trades. When the debt is recovered the order size returns to the base amount specified in the TV properties tab. The inputs for this feature include a limiter to prevent your account from depleting capital during runaway markets. The main difference between DCA and pyramids is that this implementation of DCA applies to new trades while pyramids affect open positions. DCA is a popular feature in crypto trading but can leave you with large “bags” if your not careful. In other markets, especially margin trading, you’ll need a well funded account and much experience.
To be sure pyramiding and dollar cost averaging is as close to gambling as you can get in respectable trading exchanges. However, if you are looking to compete in a Forex contest or want to add excitement to your trading life style those features could find a place in your strategies. Although your backtest may show spectacular gains don’t expect your live trading account to do the same. Every backtest has some measure to data mining bias. Please remember that.
This script is equipped with a consecutive loss counter. A limit field is provided in the report section of the input dialog box. This is a whole number value that, when specified, will generate a label on the chart when consecutive losses exceed the threshold. Every stop hit beyond this limit will be reported on a version 4 label above the bar where the stop is hit. Use the location of the labels along with the summary report tally to improve the adaptability of system. Don’t simply fit the chart. A good trading system should adapt to ever changing market conditions. On the study version the consecutive loss limit can be used to halt live trading on the broker side (managed manually).
This script can simulate leverage applied to your account capital. Basically, you want to know if the account capital you specified in the properties tab is sufficient to trade this script with the order size, pyramid and DCA parameters needed. TradingView does not halt trading when the account capital is depleted nor do you receive notification of such an event. Input the leverage you intend to trade with and simulate the stress on your account capital. When the check box labeled “Report Margin Call” is enabled a marker will plot on the chart at the location where the threshold was breached. Additionally, the Summary Report will indicated such a breach has occurred during the backtest. Please note that the margin calculation uses a performance bond contract model which is the same type of leverage applied to Forex accounts. This is not the same leverage as stock margin accounts since shares are not actually borrowed. It is also not applicable to futures contracts since we do not calculate maintenance margin. Also note that the account margin and buying power are calculated using the U.S. Dollar as a funding currency. Margin rules across the globe vary considerably so use this feature as an approximation. The “Report Margin Call” plot only appears on negative buying power which is well beyond the NFA enforced margin closeout price. Vary the order size and account capital and activate the buying power plot to get as close as you can to the desired margin call threshold. Also keep in mind that rollover fees, commissions, spreads, etc affect the margin call in actual live trading. This feature does not include any of those costs.
Inputs
The script input dialog box is divided into five sections. The last section, Section 5, contains all of the script reporting options. Notable reporting options are the inputs which provide support for calculating actual Sharpe Ratios and other risk / performance metrics. The TradingView performance report does not produce a scalable Sharpe Ratio which is unfortunate considering the limited data supplied to the backtest. Three report fields made available in this section are intended to enable users to measure the performance of this script using various industry standard risk metrics. In particular, The Sharpe Ratio, Sortino Ratio, Alpha Calculation, Beta Calculation, R-Squared and Monthly Standard Deviation. The following fields are dedicated to this effort:
– ROR Sample Period - Integer number which specifies the rate of return period. This number is a component of the Sharpe Ratio and determines the number of sample periods divisible in the chart data. The number specified here is the length of the period measured in bar intervals. Since the quantity of TradingView historical data is limited this number should reflect the scalar value applied to your Sharpe calculation. When the checkbox “Report Period ROR” is enabled red boxes plot on the dates corresponding to the ROR sample period. The red boxes display information useful in calculating various risk and performance models. Ongoing buying power is included in the period report which is especially useful in assessing the DCA stress on account capital. Important: When the “ROR Sample Period” is specified the script computes the ROR mean value and displays the result in the summary report label on the live end of the chart. Use this number to calculate the historical standard deviation of period returns.
– Return Mean Value - This is the ROR mean value which is displayed in the summary report field “ROR Mean”. Enter the value shown in the summary report here in order to calculate the standard deviation of returns. Once calculated the result is displayed in the summary report field “Standard Dev”. Please note that ROR and standard deviation are calculated on the quote currency of the chart and not the account currency. If you intend to calculate risk metrics based on other denominated returns use the period calculations in a spreadsheet. Important: Do not change the account denomination on the properties tab simply to force a dollar calculation. It will alter the backtest itself since the minimum profit, stop-loss and other variables are always measured in the quote currency of the chart.
– Report Period ROR - This checkbox is used to display the ROR period report which plots a red label above the bars corresponding to the ROR sample period. The sample period is defined by the value entered into the “ROR Sample Period” field. This checkbox only determines if the period labels plot on the chart. It does not enable or disable the ROR calculation itself. Please see input description“ROR Sample Period” for a detailed description of this feature.
Design
This script uses twelve indicators on a single time frame. The original trading algorithms are a port from a much larger program on another trading platform. I’ve converted some of the statistical functions to use standard indicators available on TradingView. The setups make heavy use of the Hull Moving Average in conjunction with EMAs that form the Bill Williams Alligator as described in his book “New Trading Dimensions” Chapter 3. Lag between the Hull and the EMAs form the basis of the entry and exit points. The vertices are calculated using one of five featured indicators. Each indicator is actually a composite of calculations which produce a distinct mean. This mathematical distinction enables the script to be useful on various instruments which belong to entirely different markets. In other words, at least one of these indicators should be able generate pivots on an arbitrarily selected instrument. Try each one to find the best fit.
The entire script is around 2200 lines of Pine code which pushes the limits of what can be created on this platform given the TradingView maximums for: local scopes, run-time duration and compile time. This script incorporates code from both my range trader and trend following published programs. Both have been in development for nearly two years and have been in beta test for the last several months. During the beta test of the range trading script it was discovered that by widening the stop and delaying the entry, add on trading opportunities appeared on the chart. I determined that by sacrificing a few minor features code space could be made available for pyramiding capability in the range trader. The module has been through several refactoring passes and makes extensive use of ternary statements. As such, It takes a full three minutes to compile after adding it to a chart. Please wait for the hovering dots to disappear before attempting to bring up the input dialog box. For the most part the same configuration settings for the range script can be applied to this script.
Inputs to the script use cone centric measurements in effort to avoid exposing adjustments to the various internal indicators. The goal was to keep the inputs relevant to the actual trade entry and exit locations as opposed to a series of MA input values and the like. As a result the strategy exposes over 70 inputs grouped into long or short sections. Inputs are available for the usual minimum profit and stop-loss as well as safeguards, trade frequency, pyramids, DCA, modes, presets, reports and lots of calibrations. The inputs are numerous, I know. Unfortunately, at this time, TradingView does not offer any other method to get data in the script. The usual initialization files such as cnf, cfg, ini, json and xml files are currently unsupported.
I have several example configuration settings that I use for my own trading. They include cryptocurrencies and forex instruments on various time frames.
Indicator Repainting and Anomalies
Indicator repainting is an industry wide problem which mainly occurs when you mix backtest data with real-time data. It doesn't matter which platform you use some form of this condition will manifest itself on your chart over time. The critical aspect being whether live trades on your broker’s account continue to match your TradingView study.
Based on my experience with Pine, most of the problems stem from TradingView’s implementation of multiple interval access. Whereas most platforms provide a separate bar series for each interval requested, the Pine language interleaves higher time frames with the primary chart interval. The problem is exacerbated by allowing a look-ahead parameter to the Security function. The goal of my repaint prevention is simply to ensure that my signal trading bias remains consistent between the strategy, study and broker. That being said this is what I’ve done address this issue in this script:
1. This script uses only 1 time frame. The chart interval.
2. Every entry and exit condition is evaluated on closed bars only.
3. No security functions are called to avoid a look-ahead possibility.
4. Every contributing factor specified in the TradingView wiki regarding this issue has been addressed.
5. Entry and exit setups are not reliant on crossover conditions.
6. I’ve run a 10 minute chart live for a week and compared it to the same chart periodically reloaded. The two charts were highly correlated with no instances of completely opposite real-time signals. I do have to say that there were differences in the location of some trades between the backtest and the study. But, I think mostly those differences are attributable to trading off closed bars in the study and the use of strategy functions in the backtest.
The study does indeed bring up the TV warning dialog. The only reason for this is because the script uses an EMA indicator which according to TradingView is due to “peculiarities of the algorithm”. I use the EMA for the Bill Williams Alligator so there is no way to remove it.
One issue that comes up when comparing the strategy with the study is that the strategy trades show on the chart one bar later than the study. This problem is due to the fact that “strategy.entry()” and “strategy_exit()” do not execute on the same bar called. The study, on the other hand, has no such limitation since there are no position routines.
Please be aware that the data source matters. Cryptocurrency has no central tick repository so each exchange supplies TradingView its feed. Even though it is the same symbol the quality of the data and subsequently the bars that are supplied to the chart varies with the exchange. This script will absolutely produce different results on different data feeds of the same symbol. Be sure to backtest this script on the same data you intend to receive alerts for. Any example settings I share with you will always have the exchange name used to generate the test results.
Usage
The following steps provide a very brief set of instructions that will get you started but will most certainly not produce the best backtest. A trading system that you are willing to risk your hard earned capital will require a well crafted configuration that involves time, expertise and clearly defined goals. As previously mentioned, I have several example configs that I use for my own trading that I can share with you. To get hands on experience in setting up your own symbol from scratch please follow the steps below.
The input dialog box contains over 70 inputs separated into five sections. Each section is identified as such with a makeshift separator input. There are three main areas that must to be configured: long side, short side and settings that apply to both. The rest of the inputs apply to pyramids, DCA, reporting and calibrations. The following steps address these three main areas only. You will need to get your backtest in the black before moving on to the more advanced features.
Step 1. Setup the Base currency and order size in the properties tab.
Step 2. Select the calculation presets in the Instrument Type field.
Step 3. Select “No Trade” in the Trading Mode field.
Step 4. Select the Histogram indicator from Section 2. You will be experimenting with different ones so it doesn’t matter which one you try first.
Step 5. Turn on Show Markers in Section 2.
Step 6. Go to the chart and checkout where the markers show up. Blue is up and red is down. Long trades show up along the red markers and short trades on the blue.
Step 7. Make adjustments to “Base To Vertex” and “Vertex To Base” net change and roc in Section 3. Use these fields to move the markers to where you want trades to be.
Step 8. Try a different indicator from Section 2 and repeat Step 7 until you find the best match for this instrument on this interval. This step is complete when the Vertex settings and indicator combination produce the most favorable results.
Step 9. Go to Section 3 and enable “Apply Red Base To Base Margin”.
Step 10. Go to Section 4 and enable “Apply Blue Base To Base Margin”.
Step 11. Go to Section 2 and adjust “Minimum Base To Base Blue” and “Minimum Base To Base Red”. Observe the chart and note where the markers move relative to each other. Markers further apart will produce less trades but will reduce cutoffs in “Ping Pong” mode.
Step 12. Return to Section 3 and 4 and turn off “Base To Base Margin” which was enabled in steps 9 and 10.
Step 13. Turn off Show Markers in Section 2.
Step 14. Put in your Minimum Profit and Stop Loss in the first section. This is in pips or currency basis points (chart right side scale). Percentage is not currently supported. This is a fixed value minimum profit and stop loss. Also note that the profit is taken as a conditional exit on a market order not a fixed limit. The actual profit taken will almost always be greater than the amount specified (due to the exit condition). The stop loss, on the other hand, is indeed a hard number which is executed by the TradingView broker simulator when the threshold is breached. On the study version, the stop is executed at the close of the bar.
Step 15. Return to step 3 and select a Trading Mode (Long, Short, BiDir, Ping Pong). If you are planning to trade bidirectionally its best to configure long first then short. Combine them with “BiDir” or “Ping Pong” after setting up both sides of the trade individually. The difference between “BiDir” and “Ping Pong” is that “Ping Pong” uses position reversal and can cut off opposing trades less than the specified minimum profit. As a result “Ping Pong” mode produces the greatest number of trades.
Step 16. Take a look at the chart. Trades should be showing along the markers plotted earlier.
Step 17. Make adjustments to the Vertex fields in Section 2 until the TradingView performance report is showing a profit. This includes the “Minimum Base To Base” fields. If a profit cannot be achieved move on to Step 18. Other adjustments may make a crucial difference.
Step 18. Improve the backtest profitability by adjusting the “Entry Net Change” and “Entry ROC” in Section 3 and 4.
Step 19. Enable the “Mandatory Snap” checkbox in Section 3 and 4 and adjust the “Snap Candle Delta” and “Snap Fractal Delta” in Section 2. This should reduce some chop producing unprofitable reversals.
Step 20. Increase the distance between opposing trades by adding an “Interleave Delta” in Sections 3 and 4. This is a floating point value which starts at 0.01 and typically does not exceed 2.0.
Step 21. Increase the distance between opposing trades even further by adding a “Decay Minimum Span” in Sections 3 and 4. This is an absolute value specified in the symbol’s quote currency (right side scale of the chart). This value is similar to the minimum profit and stop loss fields in Section 1.
Step 22. Improve the backtest profitability by adjusting the “Sparse Delta” in Section 3 and 4.
Step 23. Improve the backtest profitability by adjusting the “Chase Delta” in Section 3 and 4.
Step 24. Improve the backtest profitability by adjusting the “Adherence Delta” in Section 3 and 4. This field requires the “Adhere to Rising Trend” checkbox to be enabled.
Step 25. Try each checkbox in Section 3 and 4. See if it improves the backtest profitability. The “Caution Lackluster” checkbox only works when “Caution Mode” is enabled.
Step 26. Enable the reporting conditions in Section 5. Look for long runs of consecutive losses or high debt sequences. These are indications that your trading system cannot withstand sudden changes in market sentiment.
Step 27. Examine the chart and see that trades are being placed in accordance with your desired trading goals. This is an important step. If your desired model requires multiple trades per day then you should be seeing hundreds of trades on the chart. Alternatively, you may be looking to trade fewer steep peaks and deep valleys in which case you should see trades at major turning points. Don’t simply settle for what the backtest serves you. Work your configuration until the system aligns with your desired model. Try changing indicators and even intervals if you cannot reach your simulation goals. Generally speaking, the histogram and Candle indicators produce the most trades. The Macro indicator captures the tallest peaks and valleys.
Step 28. Apply the backtest settings to the study version and perform forward testing.
This script is open for beta testing. After successful beta test it will become a commercial application available by subscription only. I’ve invested quite a lot of time and effort into making this the best possible signal generator for all of the instruments I intend to trade. I certainly welcome any suggestions for improvements. Thank you all in advance.
One final note. I'm not a fan of having the Performance Overview (blue wedge) automatically show up at the end of the publish page since it could be misleading. On the EUR/USD backtest showing here I used a minimum profit of 65 pips, a stop of 120 pips, the candle indicator and a 5 pyramid max value. Also Mark Pyramid Levels (blue triangles) are enabled along with a 720 ROR Sample Period (red labels).

Aladin Pair Trading System v1Aladin Pair Trading System v1
What is This Indicator?
The Aladin Pair Trading System is a sophisticated tool designed to help traders identify profitable opportunities by comparing two related stocks that historically move together. Think of it as finding when one twin is running ahead or lagging behind the other - these moments often present trading opportunities as they tend to return to moving together.
Who Should Use This?
Beginners: Learn about statistical arbitrage and pair trading
Intermediate Traders: Execute mean-reversion strategies with confidence
Advanced Traders: Fine-tune parameters for optimal pair relationships
Portfolio Managers: Implement market-neutral strategies
💡 What is Pair Trading?
Imagine two ice cream shops next to each other. They usually have similar customer traffic because they're in the same area. If one day Shop A is packed while Shop B is empty, you might expect this imbalance to correct itself soon.
Pair trading works the same way:
You find two stocks that normally move together (like TCS and Infosys)
When one stock moves too far from the other, you trade expecting them to realign
You buy the lagging stock and sell the leading stock
When they come back together, you profit from both sides
Key Features
1. Z-Score Analysis
What it is: A statistical measure showing how far the price relationship has deviated from normal
What it means:
Z-Score near 0 = Normal relationship
Z-Score at +2 = Stock A is expensive relative to Stock B (Sell A, Buy B)
Z-Score at -2 = Stock A is cheap relative to Stock B (Buy A, Sell B)
2. Multiple Timeframe Analysis
Long-term Z-Score (300 bars): Shows the big picture trend
Short-term Z-Score (100 bars): Shows recent movements
Signal Z-Score (20 bars): Generates quick trading signals
3. Statistical Validation
The indicator checks if the pair is suitable for trading:
Correlation (must be > 0.7): Confirms the stocks move together
1.0 = Perfect positive correlation
0.7 = Strong correlation
Below 0.7 = Warning: pair may not be reliable
ADF P-Value (should be < 0.05): Tests if the relationship is stable
Low value = Good for pair trading
High value = Relationship may be random
Cointegration: Confirms long-term equilibrium relationship
YES = Pair tends to revert to mean
NO = Pair may drift apart permanently
Visual Elements Explained
Chart Zones (Color-Coded Areas)
Yellow Zone (-1.5 to +1.5)
Normal Zone: Relationship is stable
Action: Wait for better opportunities
Blue Zone (±1.5 to ±2.0)
Entry Zone: Deviation is significant
Action: Prepare for potential trades
Green/Red Zone (±2.0 to ±3.0)
Opportunity Zone: Strong deviation
Action: High-probability trade setups
Beyond ±3.0
Risk Limit: Extreme deviation
Action: Either maximum opportunity or structural break
Signal Arrows
Green Arrow Up (Buy A + Sell B):
Stock A is undervalued relative to B
Buy Stock A, Short Stock B
Red Arrow Down (Sell A + Buy B):
Stock A is overvalued relative to B
Sell Stock A, Buy Stock B
Settings Guide
Symbol Inputs
Pair Symbol (Symbol B): Choose the second stock to compare
Default: NSE:INFY (Infosys)
Example pairs: TCS/INFY, HDFCBANK/ICICIBANK, RELIANCE/ONGC
Z-Score Parameters
Long Z-Score Period (300): Historical context
Short Z-Score Period (100): Recent trend
Signal Period (20): Trading signals
Z-Score Threshold (2.0): Entry trigger level
Higher = Fewer but stronger signals
Lower = More frequent signals
Statistical Parameters
Correlation Period (240): How many bars to check correlation
Hurst Exponent Period (50): Measures mean-reversion tendency
Probability Lookback (100): Historical probability calculations
Trading Parameters
Entry Threshold (0.0): Minimum Z-score for entry
Risk Threshold (1.5): Warning level
Risk Limit (3.0): Maximum deviation to trade
How to Use (Step-by-Step)
Step 1: Choose Your Pair
Add the indicator to your chart (this becomes Stock A)
In settings, select Stock B (the comparison stock)
Choose stocks from the same sector for best results
Step 2: Verify Pair Quality
Check the Statistics Table (top-right corner):
✅ Correlation > 0.70 (Green = Good)
✅ ADF P-value < 0.05 (Green = Good)
✅ Cointegrated = YES (Green = Good)
If all three are green, the pair is suitable for trading!
Step 3: Wait for Signals
BUY SIGNAL (Green Arrow Up)
Z-Score crosses above -2.0
Action: Buy Stock A, Sell Stock B
Exit: When Z-Score returns to 0
SELL SIGNAL (Red Arrow Down)
Z-Score crosses below +2.0
Action: Sell Stock A, Buy Stock B
Exit: When Z-Score returns to 0
Step 4: Risk Management
Yellow Zone: Monitor only
Blue Zone: Prepare for entry
Green/Red Zone: Active trading zone
Beyond ±3.0: Maximum risk - use caution
⚠️ Important Warnings
Not All Pairs Work: Always check the statistics table first
Market Conditions Matter: Correlation can break during market stress
Use Stop Losses: Set stops at Z-Score ±3.5 or beyond
Position Sizing: Trade both legs with appropriate hedge ratios
Transaction Costs: Factor in brokerage and slippage for both stocks
Example Trade
Scenario: TCS vs INFOSYS
Correlation: 0.85 ✅
Z-Score: -2.3 (TCS is cheap vs INFY)
Action to be taken:
Buy 1lot of TCS Future
Sell 1lot of INFOSYS Future
Expected Outcome:
As Z-Score moves toward 0, TCS outperforms INFOSYS
Close both positions when Z-Score crosses 0
Profit from the convergence
Best Practices
Test Before Trading: Use paper trading first
Sector Focus: Choose pairs from the same industry
Monitor Statistics: Check correlation daily
Avoid News Events: Don't trade pairs during earnings/major news
Size Appropriately: Start small, scale with experience
Be Patient: Wait for high-quality setups (±2.0 or beyond)
What Makes This Indicator Unique?
Multi-timeframe Z-Score analysis: Three different perspectives
Statistical validation: Built-in correlation and cointegration tests
Visual risk zones: Easy-to-understand color-coded areas
Real-time statistics: Live pair quality monitoring
Beginner-friendly: Clear signals with educational zones
Technical Background
The indicator uses:
Engle-Granger Cointegration Test: Validates pair relationship
ADF (Augmented Dickey-Fuller) Test: Tests stationarity
Pearson Correlation: Measures linear relationship
Z-Score Normalization: Standardizes deviations
Log Returns: Handles price differences properly
Support & Community
For questions, suggestions, or to share your pair trading experiences:
Comment below the indicator
Share your successful pair combinations
Report any issues for quick fixes
Disclaimer
This indicator is for educational and informational purposes only. It does not constitute financial advice. Pair trading involves risk, including the risk of loss.
Always:
Do your own research
Understand the risks
Trade with money you can afford to lose
Consider consulting a financial advisor
📌 Quick Reference Card
Z-ScoreInterpretationAction-3.0 to -2.0A very cheap vs BStrong Buy A, Sell B-2.0 to -1.5A cheap vs BBuy A, Sell B-1.5 to +1.5Normal rangeHold/Wait+1.5 to +2.0A expensive vs BSell A, Buy B+2.0 to +3.0A very expensive vs BStrong Sell A, Buy B
Good Pair Statistics:
Correlation: > 0.70
ADF P-value: < 0.05
Cointegration: YES
Version: 1.0
Last Updated: 10th October 2025
Compatible: TradingView Pine Script v6
Happy Trading!

MNQ TopStep 50K | Ultra Quality v3.0MNQ TopStep 50K | Ultra Quality v3.0 - Publish Summary
📊 Overview
A professional-grade trading indicator designed specifically for MNQ futures traders using TopStep funded accounts. Combines 7 technical confirmations with 5 advanced safety filters to deliver high-quality trade signals while managing drawdown risk.
🎯 Key Features
Core Signal System
7-Point Confirmation: VWAP, EMA crossovers, 15-min HTF trend, MACD, RSI, ADX, and Volume
Signal Grading: Each signal is rated A+ through D based on 7 quality factors
Quality Threshold: Adjustable minimum grade requirement (A+, A, B, C, D)
Advanced Safety Filters (Customizable)
Mean Reversion Filter - Prevents chasing extended moves beyond VWAP bands
ATR Spike Filter - Avoids trading during extreme volatility events
EMA Spacing Filter - Ensures proper trend separation (optional)
Momentum Filter - Requires consecutive directional bars (optional)
Multi-Timeframe Confirmation - Aligns with 15-min trend (optional)
TopStep Risk Management
Real-time drawdown tracking
Position sizing calculator based on remaining cushion
Daily loss limit monitoring
Consecutive loss protection
Max trades per day limiter
Visual Components
VWAP with 1σ, 2σ, 3σ bands
EMA 9/21 with cloud fill
15-min EMA 50 for HTF trend
Comprehensive metrics dashboard
Risk management panel
Filter status panel
Detailed trade labels with entry, stops, and targets
⚙️ Default Settings (Balanced for Regular Signals)
Technical Indicators
Fast EMA: 9 | Slow EMA: 21 | HTF EMA: 50 (15-min)
MACD: 10/22/9
RSI: 14 period | Thresholds: 52 (buy) / 48 (sell)
ADX: 14 period | Minimum: 20
ATR: 14 period | Stop: 2x | TP1: 2x | TP2: 3x
Volume: 1.2x average required
Session Settings
Default: 9:30 AM - 11:30 AM ET (adjustable)
Avoids first 15 minutes after market open
Customizable trading hours
Safety Filters (Default Configuration)
✅ Mean Reversion: Enabled (2.5σ max from VWAP)
✅ ATR Spike: Enabled (2.0x threshold)
❌ EMA Spacing: Disabled (can enable for quality)
❌ Momentum: Disabled (can enable for quality)
❌ MTF Confirmation: Disabled (can enable for quality)
Risk Controls
Minimum Signal Quality: C (adjustable to A+ for fewer/better signals)
Min Bars Between Signals: 10
Max Trades Per Day: 5
Stop After Consecutive Losses: 2
📈 Expected Performance
With Default Settings:
Signals per week: 10-15 trades
Estimated win rate: 55-60%
Risk-Reward: 1:2 (TP1) and 1:3 (TP2)
With Aggressive Settings (Min Quality = D, All Filters Off):
Signals per week: 20-25 trades
Estimated win rate: 50-55%
With Conservative Settings (Min Quality = A, All Filters On):
Signals per week: 3-5 trades
Estimated win rate: 65-70%
🚀 How to Use
Basic Setup:
Add indicator to MNQ 5-minute chart
Adjust TopStep account settings in inputs
Set your risk per trade percentage (default: 0.5%)
Configure trading session hours
Set minimum signal quality (Start with C for balanced results)
Signal Interpretation:
Green Triangle (BUY): Long signal - all confirmations aligned
Red Triangle (SELL): Short signal - all confirmations aligned
Label Details: Shows entry, stop loss, take profit levels, position size, and signal grade
Signal Grade: A+ = Elite (6-7 points) | A = Strong (5) | B = Good (4) | C = Fair (3)
Dashboard Monitoring:
Top Right: Technical metrics and market conditions
Top Left: Filter status (which filters are passing/blocking)
Bottom Right: TopStep risk metrics and position sizing
⚡ Customization Tips
For More Signals:
Lower "Minimum Signal Quality" to D
Decrease ADX threshold to 18-20
Lower RSI thresholds to 50/50
Reduce Volume multiplier to 1.1x
Disable additional filters
For Higher Quality (Fewer Signals):
Raise "Minimum Signal Quality" to A or A+
Increase ADX threshold to 25-30
Enable all 5 advanced filters
Tighten VWAP distance to 2.0σ
Increase momentum requirement to 3-4 bars
For TopStep Compliance:
Adjust "Max Total Drawdown" and "Daily Loss Limit" to match your account
Update "Already Used Drawdown" daily
Monitor the Risk Panel for cushion remaining
Use recommended contract sizing
🛡️ Risk Disclaimer
IMPORTANT: This indicator is for educational and informational purposes only.
Past performance does not guarantee future results
All trading involves substantial risk of loss
Use proper risk management and position sizing
Test thoroughly in paper trading before live use
The indicator does not guarantee profitable trades
Adjust settings based on your risk tolerance and trading style
Always comply with your broker's and TopStep's rules

MNQ TopStep 50K | Ultra Quality v3.0MNQ TopStep 50K | Ultra Quality v3.0 - Publish Summary📊 OverviewA professional-grade trading indicator designed specifically for MNQ futures traders using TopStep funded accounts. Combines 7 technical confirmations with 5 advanced safety filters to deliver high-quality trade signals while managing drawdown risk.🎯 Key FeaturesCore Signal System
7-Point Confirmation: VWAP, EMA crossovers, 15-min HTF trend, MACD, RSI, ADX, and Volume
Signal Grading: Each signal is rated A+ through D based on 7 quality factors
Quality Threshold: Adjustable minimum grade requirement (A+, A, B, C, D)
Advanced Safety Filters (Customizable)
Mean Reversion Filter - Prevents chasing extended moves beyond VWAP bands
ATR Spike Filter - Avoids trading during extreme volatility events
EMA Spacing Filter - Ensures proper trend separation (optional)
Momentum Filter - Requires consecutive directional bars (optional)
Multi-Timeframe Confirmation - Aligns with 15-min trend (optional)
TopStep Risk Management
Real-time drawdown tracking
Position sizing calculator based on remaining cushion
Daily loss limit monitoring
Consecutive loss protection
Max trades per day limiter
Visual Components
VWAP with 1σ, 2σ, 3σ bands
EMA 9/21 with cloud fill
15-min EMA 50 for HTF trend
Comprehensive metrics dashboard
Risk management panel
Filter status panel
Detailed trade labels with entry, stops, and targets
⚙️ Default Settings (Balanced for Regular Signals)Technical Indicators
Fast EMA: 9 | Slow EMA: 21 | HTF EMA: 50 (15-min)
MACD: 10/22/9
RSI: 14 period | Thresholds: 52 (buy) / 48 (sell)
ADX: 14 period | Minimum: 20
ATR: 14 period | Stop: 2x | TP1: 2x | TP2: 3x
Volume: 1.2x average required
Session Settings
Default: 9:30 AM - 11:30 AM ET (adjustable)
Avoids first 15 minutes after market open
Customizable trading hours
Safety Filters (Default Configuration)
✅ Mean Reversion: Enabled (2.5σ max from VWAP)
✅ ATR Spike: Enabled (2.0x threshold)
❌ EMA Spacing: Disabled (can enable for quality)
❌ Momentum: Disabled (can enable for quality)
❌ MTF Confirmation: Disabled (can enable for quality)
Risk Controls
Minimum Signal Quality: C (adjustable to A+ for fewer/better signals)
Min Bars Between Signals: 10
Max Trades Per Day: 5
Stop After Consecutive Losses: 2
📈 Expected PerformanceWith Default Settings:
Signals per week: 10-15 trades
Estimated win rate: 55-60%
Risk-Reward: 1:2 (TP1) and 1:3 (TP2)
With Aggressive Settings (Min Quality = D, All Filters Off):
Signals per week: 20-25 trades
Estimated win rate: 50-55%
With Conservative Settings (Min Quality = A, All Filters On):
Signals per week: 3-5 trades
Estimated win rate: 65-70%
🚀 How to UseBasic Setup:
Add indicator to MNQ 5-minute chart
Adjust TopStep account settings in inputs
Set your risk per trade percentage (default: 0.5%)
Configure trading session hours
Set minimum signal quality (Start with C for balanced results)
Signal Interpretation:
Green Triangle (BUY): Long signal - all confirmations aligned
Red Triangle (SELL): Short signal - all confirmations aligned
Label Details: Shows entry, stop loss, take profit levels, position size, and signal grade
Signal Grade: A+ = Elite (6-7 points) | A = Strong (5) | B = Good (4) | C = Fair (3)
Dashboard Monitoring:
Top Right: Technical metrics and market conditions
Top Left: Filter status (which filters are passing/blocking)
Bottom Right: TopStep risk metrics and position sizing
⚡ Customization TipsFor More Signals:
Lower "Minimum Signal Quality" to D
Decrease ADX threshold to 18-20
Lower RSI thresholds to 50/50
Reduce Volume multiplier to 1.1x
Disable additional filters
For Higher Quality (Fewer Signals):
Raise "Minimum Signal Quality" to A or A+
Increase ADX threshold to 25-30
Enable all 5 advanced filters
Tighten VWAP distance to 2.0σ
Increase momentum requirement to 3-4 bars
For TopStep Compliance:
Adjust "Max Total Drawdown" and "Daily Loss Limit" to match your account
Update "Already Used Drawdown" daily
Monitor the Risk Panel for cushion remaining
Use recommended contract sizing
🛡️ Risk DisclaimerIMPORTANT: This indicator is for educational and informational purposes only.
Past performance does not guarantee future results
All trading involves substantial risk of loss
Use proper risk management and position sizing
Test thoroughly in paper trading before live use
The indicator does not guarantee profitable trades
Adjust settings based on your risk tolerance and trading style
Always comply with your broker's and TopStep's rules

Optimized ADX DI CCI Strategy### Key Features:
- Combines ADX, DI+/-, CCI, and RSI for signal generation.
- Supports customizable timeframes for indicators.
- Offers multiple exit conditions (Moving Average cross, ADX change, performance-based stop-loss).
- Tracks and displays trade statistics (e.g., win rate, capital growth, profit factor).
- Visualizes trades with labels and optional background coloring.
- Allows countertrading (opening an opposite trade after closing one).
1. **Indicator Calculation**:
- **ADX and DI+/-**: Calculated using the `ta.dmi` function with user-defined lengths for DI and ADX smoothing.
- **CCI**: Computed using the `ta.cci` function with a configurable source (default: `hlc3`) and length.
- **RSI (optional)**: Calculated using the `ta.rsi` function to filter overbought/oversold conditions.
- **Moving Averages**: Used for CCI signal smoothing and trade exits, with support for SMA, EMA, SMMA (RMA), WMA, and VWMA.
2. **Signal Generation**:
- **Buy Signal**: Triggered when DI+ > DI- (or DI+ crosses over DI-), CCI > MA (or CCI crosses over MA), and optional ADX/RSI filters are satisfied.
- **Sell Signal**: Triggered when DI+ < DI- (or DI- crosses over DI+), CCI < MA (or CCI crosses under MA), and optional ADX/RSI filters are satisfied.
3. **Trade Execution**:
- **Entry**: Long or short trades are opened using `strategy.entry` when signals are detected, provided trading is allowed (`allow_long`/`allow_short`) and equity is positive.
- **Exit**: Trades can be closed based on:
- Opposite signal (if no other exit conditions are used).
- MA cross (price crossing below/above the exit MA for long/short trades).
- ADX percentage change exceeding a threshold.
- Performance-based stop-loss (trade loss exceeding a percentage).
- **Countertrading**: If enabled, closing a trade triggers an opposite trade (e.g., closing a long opens a short).
4. **Visualization**:
- Labels are plotted at trade entries/exits (e.g., "BUY," "SELL," arrows).
- Optional background coloring highlights open trades (green for long, red for short).
- A statistics table displays real-time metrics (e.g., capital, win rates).
5. **Trade Tracking**:
- Tracks the number of long/short trades, wins, and overall performance.
- Monitors equity to prevent trading if it falls to zero.
### 2.3 Key Components
- **Indicator Calculations**: Uses `request.security` to fetch indicator data for the specified timeframe.
- **MA Function**: A custom `ma_func` handles different MA types for CCI and exit conditions.
- **Signal Logic**: Combines crossover/under checks with recent bar windows for flexibility.
- **Exit Conditions**: Multiple configurable exit strategies for risk management.
- **Statistics Table**: Updates dynamically with trade and capital metrics.
## 3. Configuration Options
The script provides extensive customization through input parameters, grouped for clarity in the TradingView settings panel. Below is a detailed breakdown of each setting and its impact.
### 3.1 Strategy Settings (Global)
- **Initial Capital**: Default `10000`. Sets the starting capital for backtesting.
- **Effect**: Determines the base equity for calculating position sizes and performance metrics.
- **Default Quantity Type**: `strategy.percent_of_equity` (50% of equity).
- **Effect**: Controls the size of each trade as a percentage of available equity.
- **Pyramiding**: Default `2`. Allows up to 2 simultaneous trades in the same direction.
- **Effect**: Enables multiple entries if conditions are met, increasing exposure.
- **Commission**: 0.2% per trade.
- **Effect**: Simulates trading fees, reducing net profit in backtesting.
- **Margin**: 100% for long and short trades.
- **Effect**: Assumes no leverage; adjust for margin trading simulations.
- **Calc on Every Tick**: `true`.
- **Effect**: Ensures real-time signal updates for precise execution.
### 3.2 Indicator Settings
- **Indicator Timeframe** (`indicator_timeframe`):
- **Options**: `""` (chart timeframe), `1`, `5`, `15`, `30`, `60`, `240`, `D`, `W`.
- **Default**: `""` (uses chart timeframe).
- **Effect**: Determines the timeframe for ADX, DI, CCI, and RSI calculations. A higher timeframe reduces noise but may delay signals.
### 3.3 ADX & DI Settings
- **DI Length** (`adx_di_len`):
- **Default**: `30`.
- **Range**: Minimum `1`.
- **Effect**: Sets the period for calculating DI+ and DI-. Longer periods smooth trends but reduce sensitivity.
- **ADX Smoothing Length** (`adx_smooth_len`):
- **Default**: `14`.
- **Range**: Minimum `1`.
- **Effect**: Smooths the ADX calculation. Longer periods produce smoother ADX values.
- **Use ADX Filter** (`use_adx_filter`):
- **Default**: `false`.
- **Effect**: If `true`, requires ADX to exceed the threshold for signals to be valid, filtering out weak trends.
- **ADX Threshold** (`adx_threshold`):
- **Default**: `25`.
- **Range**: Minimum `0`.
- **Effect**: Sets the minimum ADX value for valid signals when the filter is enabled. Higher values restrict trades to stronger trends.
### 3.4 CCI Settings
- **CCI Length** (`cci_length`):
- **Default**: `20`.
- **Range**: Minimum `1`.
- **Effect**: Sets the period for CCI calculation. Longer periods reduce noise but may lag.
- **CCI Source** (`cci_src`):
- **Default**: `hlc3` (average of high, low, close).
- **Effect**: Defines the price data for CCI. `hlc3` is standard, but users can choose other sources (e.g., `close`).
- **CCI MA Type** (`ma_type`):
- **Options**: `SMA`, `EMA`, `SMMA (RMA)`, `WMA`, `VWMA`.
- **Default**: `SMA`.
- **Effect**: Determines the moving average type for CCI signal smoothing. EMA is more responsive; VWMA weights by volume.
- **CCI MA Length** (`ma_length`):
- **Default**: `14`.
- **Range**: Minimum `1`.
- **Effect**: Sets the period for the CCI MA. Longer periods smooth the MA but may delay signals.
### 3.5 RSI Filter Settings
- **Use RSI Filter** (`use_rsi_filter`):
- **Default**: `false`.
- **Effect**: If `true`, applies RSI-based overbought/oversold filters to signals.
- **RSI Length** (`rsi_length`):
- **Default**: `14`.
- **Range**: Minimum `1`.
- **Effect**: Sets the period for RSI calculation. Longer periods reduce sensitivity.
- **RSI Lower Limit** (`rsi_lower_limit`):
- **Default**: `30`.
- **Range**: `0` to `100`.
- **Effect**: Defines the oversold threshold for buy signals. Lower values allow trades in more extreme conditions.
- **RSI Upper Limit** (`rsi_upper_limit`):
- **Default**: `70`.
- **Range**: `0` to `100`.
- **Effect**: Defines the overbought threshold for sell signals. Higher values allow trades in more extreme conditions.
### 3.6 Signal Settings
- **Cross Window** (`cross_window`):
- **Default**: `0`.
- **Range**: `0` to `5` bars.
- **Effect**: Specifies the lookback period for detecting DI+/- or CCI crosses. `0` requires crosses on the current bar; higher values allow recent crosses, increasing signal frequency.
- **Allow Long Trades** (`allow_long`):
- **Default**: `true`.
- **Effect**: Enables/disables new long trades. If `false`, only closing existing longs is allowed.
- **Allow Short Trades** (`allow_short`):
- **Default**: `true`.
- **Effect**: Enables/disables new short trades. If `false`, only closing existing shorts is allowed.
- **Require DI+/DI- Cross for Buy** (`buy_di_cross`):
- **Default**: `true`.
- **Effect**: If `true`, requires a DI+ crossover DI- for buy signals; if `false`, DI+ > DI- is sufficient.
- **Require CCI Cross for Buy** (`buy_cci_cross`):
- **Default**: `true`.
- **Effect**: If `true`, requires a CCI crossover MA for buy signals; if `false`, CCI > MA is sufficient.
- **Require DI+/DI- Cross for Sell** (`sell_di_cross`):
- **Default**: `true`.
- **Effect**: If `true`, requires a DI- crossover DI+ for sell signals; if `false`, DI+ < DI- is sufficient.
- **Require CCI Cross for Sell** (`sell_cci_cross`):
- **Default**: `true`.
- **Effect**: If `true`, requires a CCI crossunder MA for sell signals; if `false`, CCI < MA is sufficient.
- **Countertrade** (`countertrade`):
- **Default**: `true`.
- **Effect**: If `true`, closing a trade triggers an opposite trade (e.g., close long, open short) if allowed.
- **Color Background for Open Trades** (`color_background`):
- **Default**: `true`.
- **Effect**: If `true`, colors the chart background green for long trades and red for short trades.
### 3.7 Exit Settings
- **Use MA Cross for Exit** (`use_ma_exit`):
- **Default**: `true`.
- **Effect**: If `true`, closes trades when the price crosses the exit MA (below for long, above for short).
- **MA Length for Exit** (`ma_exit_length`):
- **Default**: `20`.
- **Range**: Minimum `1`.
- **Effect**: Sets the period for the exit MA. Longer periods delay exits.
- **MA Type for Exit** (`ma_exit_type`):
- **Options**: `SMA`, `EMA`, `SMMA (RMA)`, `WMA`, `VWMA`.
- **Default**: `SMA`.
- **Effect**: Determines the MA type for exit signals. EMA is more responsive; VWMA weights by volume.
- **Use ADX Change Stop-Loss** (`use_adx_stop`):
- **Default**: `false`.
- **Effect**: If `true`, closes trades when the ADX changes by a specified percentage.
- **ADX % Change for Stop-Loss** (`adx_change_percent`):
- **Default**: `5.0`.
- **Range**: Minimum `0.0`, step `0.1`.
- **Effect**: Specifies the percentage change in ADX (vs. previous bar) that triggers a stop-loss. Higher values reduce premature exits.
- **Use Performance Stop-Loss** (`use_perf_stop`):
- **Default**: `false`.
- **Effect**: If `true`, closes trades when the loss exceeds a percentage threshold.
- **Performance Stop-Loss (%)** (`perf_stop_percent`):
- **Default**: `-10.0`.
- **Range**: `-100.0` to `0.0`, step `0.1`.
- **Effect**: Specifies the loss percentage that triggers a stop-loss. More negative values allow larger losses before exiting.
## 4. Visual and Statistical Output
- **Labels**: Displayed at trade entries/exits with arrows (↑ for buy, ↓ for sell) and text ("BUY," "SELL"). A "No Equity" label appears if equity is zero.
- **Background Coloring**: Optionally colors the chart background (green for long, red for short) to indicate open trades.
- **Statistics Table**: Displayed at the top center of the chart, updated on timeframe changes or trade events. Includes:
- **Capital Metrics**: Initial capital, current capital, capital growth (%).
- **Trade Metrics**: Total trades, long/short trades, win rate, long/short win rates, profit factor.
- **Open Trade Status**: Indicates if a long, short, or no trade is open.
## 5. Alerts
- **Buy Signal Alert**: Triggered when `buy_signal` is true ("Cross Buy Signal").
- **Sell Signal Alert**: Triggered when `sell_signal` is true ("Cross Sell Signal").
- **Usage**: Users can set up TradingView alerts to receive notifications for trade signals.

BRT T3 for BTC 1h [STRATEGY]## 📊 BRT T3 Adaptive Strategy for BTC 1H
STRATEGY DESCRIPTION
Professional trading strategy based on the adaptive T3 (Tillson T3) indicator with dynamic length controlled by the Relative Strength Index (RSI) . The strategy is specifically designed for Bitcoin trading on the hourly timeframe and includes a comprehensive filter system to minimize false signals.
═════════════════════════════════════════
🔥 UNIQUE CODE FEATURES
1. RSI-Adaptive Architecture:
• Innovative Approach: Unlike standard MA strategies with fixed periods, our code dynamically adjusts the moving average length based on RSI
• Smart Formula: len = minLen + (maxLen - minLen) * (1 - RSI/100) - automatically accelerates response in extreme zones
• Result: Strategy adapts to market conditions without manual reconfiguration
2. Modified Ichimoku Cloud:
• Unique Calculation: Instead of classic high/low, uses ATR-based method
• Dynamic Levels: Cloud is built based on volatility, not fixed periods
• Advantage: More accurate trend determination in highly volatile cryptocurrency markets
3. Hybrid Signal System:
• Dual-mode Generation: Switch between classic MA crossovers and volatility band breakouts
• Multi-stage Confirmation: Optional signal verification across N forward bars
• Effect: 40-60% reduction in false signals compared to simple MA strategies
4. All-in-One Solution:
• 8 MA Types in One Code: The only strategy on TradingView with complete implementation of T3, EMA, SMA, WMA, VWMA, HMA, RMA, DEMA
• Custom Functions: All MAs calculated through custom functions supporting series int
• Versatility: One code replaces 8 different strategies
5. Intelligent Filtering:
Combination of 4 independent filters:
├── Volume Filter (dynamic multiplier)
├── Trend Filter (adaptive period)
├── ATR Filter (volatility)
└── Ichimoku Filter (cloud trend)
• Unique Logic: Each filter can work independently or in combination
• Master Switch: Single control for all filters
6. Advanced Risk Management:
• Smart Stops: SL/TP levels are stored in variables and not recalculated on every bar
• Slippage Protection: Checks both close and high/low for stop triggers
• Visualization: Dynamic display of levels only for active positions
7. Performance Optimization:
• Efficient Loops: Minimized calculations through intermediate result storage
• Conditional Visualization: Element rendering only when necessary
• Clean Code: Structured organization with clear logical block separation
═════════════════════════════════════════
💎 TECHNICAL INNOVATIONS
Adaptation Algorithm (exclusive development):
// Dynamic length based on RSI
rsi_scale = 1.0 - rsi / 100.0
len_adaptive = minLen + (maxLen - minLen) * rsi_scale
ATR-based Ichimoku (unique modification):
// Instead of classic (highest + lowest) / 2
// Using ATR for dynamic levels
upper := close < upper ? min(hl2 + atr*mult, upper ) : hl2 + atr*mult
lower := close > lower ? max(hl2 - atr*mult, lower ) : hl2 - atr*mult
Multi-MA Architecture (complete implementation):
• Each MA type has its own optimized function
• Support for series int for dynamic length
• Unified selection interface via switch statement
═════════════════════════════════════════
🎯 KEY FEATURES
• Adaptive System: Moving average length automatically adjusts based on RSI, providing quick response in trending movements and stability in sideways markets
• 8 Moving Average Types: T3, EMA, SMA, WMA, VWMA, HMA, RMA, DEMA - ability to choose the optimal type for different market conditions
• Multi-level Filtering:
- Volume Filter - signal confirmation with increased activity
- Trend Filter - trading in the direction of the main trend
- ATR Filter - accounting for market volatility
- Ichimoku Cloud - additional trend direction confirmation
• Professional Risk Management: Customizable stop-loss and take-profit levels
═════════════════════════════════════════
⚙️ HOW IT WORKS
1. Signal Generation:
• Original Mode: Classic MA crossover signals with lagged version
• Band Break Mode: Volatility band breakouts (based on standard deviation)
2. RSI Adaptation:
• High RSI (overbought) → uses short MA length for quick response
• Low RSI (oversold) → uses long MA for noise smoothing
• Adaptation range is configured by Min/Max length parameters
3. Filter System:
• Each filter can be enabled/disabled independently
• Signal is generated only when passing all active filters
• Ichimoku filter blocks counter-trend trades
═════════════════════════════════════════
📈 STRATEGY PARAMETERS
Main Settings:
• Strategy Type: Long Only / Short Only / Both
• Data Source: Close, Open, High, Low, HL2, HLC3, OHLC4
RSI Settings:
• RSI Length: Calculation period (default 14)
• RSI Smoothing: Smoothing to reduce noise
T3/MA Settings:
• Min/Max Length: Adaptive length range (5-50)
• Volume Factor: T3 smoothing coefficient (0.7)
• MA Type: Moving average type selection
Filters:
• Volume Filter: Volume multiplier (1.5x average)
• Trend Filter: Trend MA period (200)
• ATR Filter: Minimum volatility for entry
• Ichimoku Filter: Cloud for trend determination
Risk Management:
• Stop Loss: Percentage from entry price (1.2%)
• Take Profit: Percentage from entry price (5.9%)
• Position Size: 50,000 USDT (effective leverage 5x)
═════════════════════════════════════════
💡 USAGE RECOMMENDATIONS
Optimal Conditions:
• Timeframe: 1H (developed and optimized)
• Instrument: BTC/USDT and other liquid cryptocurrencies
• Market Conditions: Trending and moderately volatile markets
Customize to Your Style:
1. Conservative: Increase signal confirmation period, enable all filters
2. Aggressive: Reduce filters, use Band Break mode
3. Scalping: Decrease Min/Max length, disable trend filter
═════════════════════════════════════════
📊 VISUALIZATION
Strategy displays:
• Main MA Line - changes color depending on direction
• Lag Line - for visualizing crossover moment
• Volatility Bands - upper and lower boundaries
• Trend MA - orange line (200 periods)
• SL/TP Levels - red and green lines for open positions
═════════════════════════════════════════
🔔 ALERTS
Strategy supports alert configuration for:
• Long position entry signals
• Short position entry signals
• Position exit signals
• Ichimoku line crossings
═════════════════════════════════════════
⚠️ RISK WARNING
IMPORTANT NOTICE: Trading in financial markets involves substantial risk of capital loss. Past performance presented in this strategy is based solely on historical data and under no circumstances constitutes a guarantee of future returns.
The strategy author is not responsible for:
• Any direct or indirect financial losses resulting from the use of this strategy
• Trading decisions made based on strategy signals
• Interpretation of backtesting results as a forecast of future performance
This strategy is provided exclusively for educational and research purposes. Backtesting results are affected by numerous factors including but not limited to: slippage, spread, commissions, market liquidity, and technical failures.
Before using the strategy in live trading:
• Conduct your own testing on a demo account
• Ensure understanding of all parameters and logic
• Only use funds you can afford to lose
• Consider consulting with a qualified financial advisor
DISCLAIMER: By using this strategy, you acknowledge and accept all risks associated with financial market trading and confirm that the author does not provide investment advice and bears no fiduciary responsibility to users.
═════════════════════════════════════════
🛠 TECHNICAL SUPPORT
For questions about setup and optimization:
• Leave comments under the publication
• Follow strategy updates
• Study the code for deep understanding of logic
═════════════════════════════════════════
📝 VERSION AND UPDATES
Version: 1.0.0
Pine Script: v6
Last Updated: 2025
Changelog:
• Added support for 8 MA types
• Integrated Ichimoku Cloud filter
• Optimized risk management system
• Improved signal visualization
═════════════════════════════════════════
© 2025 BRT Trading Systems
Strategy is protected by copyright. Commercial use without author's permission is prohibited.
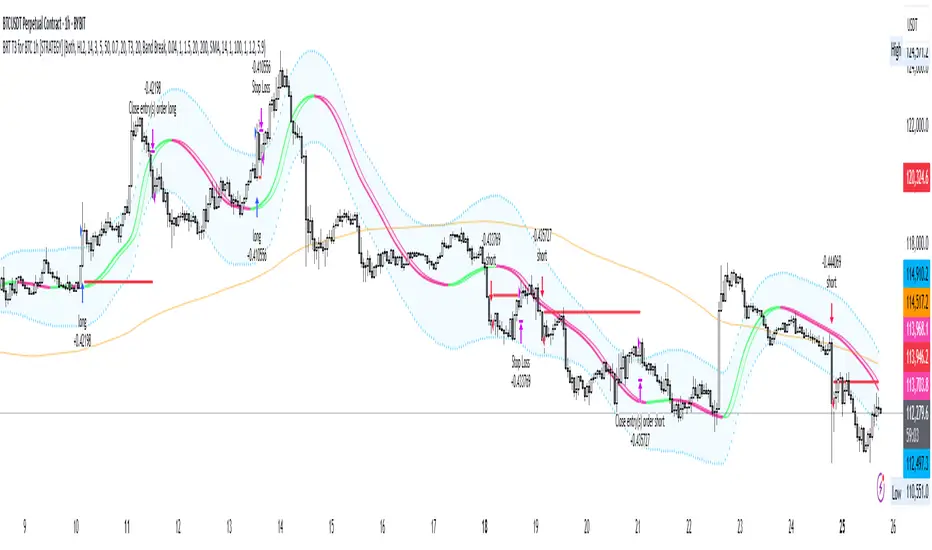
Recovery Zone Hedging [Starbots]Recovery Zone Hedging Strategy — Advanced Adaptive Hedge Recovery System
This strategy introduces an innovative zone-based hedge recovery approach tailored to TradingView’s single-direction trading model. Designed for serious traders and professionals, it combines multiple technical indicators with dynamic position sizing and adaptive take-profit mechanisms to manage drawdowns and maximize recovery efficiency.
How Recovery Zones Are Calculated
The strategy defines recovery zones as a configurable percentage distance from the last executed trade price. This percentage can be adjusted to suit different market volatility environments — wider zones for volatile assets, tighter zones for stable ones. When price moves into a recovery zone against the open position, the strategy places a hedge trade in the opposite direction to help recoup losses.
Dynamic Take-Profit Calculation
Take-profit targets are not fixed. Instead, they increase dynamically based on any accumulated losses from previous hedge trades. For example, if your initial target is 2%, but you have a $5 loss from prior hedges, the next take-profit target adjusts upward to cover both the loss and your profit goal, ensuring the entire hedge sequence closes in net profit.
Originality & Value
Unlike traditional hedging or recovery scripts that rely on static stop losses and fixed trade sizing, this strategy offers:
- Dynamic Hedge Entry Zones: Uses configurable percentage-based recovery zones that adapt to price volatility, allowing precise placement of hedge trades at meaningful reversal levels.
- Multi-Indicator Signal Fusion: Integrates MACD and Directional Movement Index (DMI) signals to confirm trade entries, improving signal accuracy and reducing false triggers.
- Exponential Position Sizing: Each hedge trade’s size grows exponentially using a customizable multiplier, accelerating loss recovery while carefully balancing capital usage.
- Adaptive Take-Profit Logic: The take-profit target adjusts dynamically based on accumulated losses and profit margins, ensuring that the entire hedge sequence closes with a net gain.
- Capital Usage Monitoring: A built-in dashboard tracks real-time equity consumption, preventing over-leveraging by highlighting critical capital thresholds.
- Fail-Safe Exit Mechanism: An optional forced exit beyond the last hedge zone protects capital in extreme market scenarios.
This strategy’s layered design and adaptive mechanisms provide a unique and powerful tool for traders seeking robust recovery systems beyond standard hedge or martingale methods.
How Components Work Together
- Entry Signals: The script listens for MACD line crossovers and DMI directional crosses to open an initial trade.
- Recovery Zones: If the market moves against the initial position, the strategy calculates a recovery zone a set percentage away and places a hedge trade in the opposite direction.
- Position Scaling: Each subsequent hedge trade increases in size exponentially according to the hedge multiplier, designed to recover all previous losses plus a profit.
- Take-Profit Target: Rather than a fixed target, the TP level is dynamically calculated considering current drawdown and desired profit margin, ensuring the entire hedge sequence closes profitably.
- Cycle Management: Trades alternate direction following the recovery zones until profit is realized or a maximum hedge count is reached. If needed, a forced stop-out limits risk exposure.
Key Benefits for Professional Traders
- Enhanced Risk Management: Real-time capital usage visualization helps maintain safe exposure levels.
- Strategic Hedge Recovery: The adaptive recovery zones and exponential sizing accelerate loss recoupment more efficiently than traditional fixed-step systems.
- Multi-Indicator Confirmation: Combining MACD and DMI reduces false signals and improves hedge timing accuracy.
- Versatility: Suitable for multiple timeframes and asset classes with adjustable parameters.
- Comprehensive Visuals: On-chart recovery zones, hedge levels, dynamic take-profits, and equity usage tables enable informed decision-making.
Recommended Settings & Use Cases
- Initial Position Size: 0.1–1% of account equity
- Recovery Zone Distance: 2–5% price movement
- Hedge Multiplier: 1.5–1.85x growth per hedge step
- Max Hedge Steps: 5–10 for controlled risk exposure
Ideal for trending markets where price retracements create viable recovery opportunities. Use caution in sideways markets to avoid extended hedge sequences.
Important Notes
- TradingView’s single-direction model means hedging is simulated via alternating trades.
- Position sizes grow rapidly—proper parameter tuning is essential to avoid over-leveraging.
This script is designed primarily for professional traders seeking an advanced, automated hedge recovery framework, offering superior capital efficiency and loss management.

VoVix DEVMA🌌 VoVix DEVMA: A Deep Dive into Second-Order Volatility Dynamics
Welcome to VoVix+, a sophisticated trading framework that transcends traditional price analysis. This is not merely another indicator; it is a complete system designed to dissect and interpret the very fabric of market volatility. VoVix+ operates on the principle that the most powerful signals are not found in price alone, but in the behavior of volatility itself. It analyzes the rate of change, the momentum, and the structure of market volatility to identify periods of expansion and contraction, providing a unique edge in anticipating major market moves.
This document will serve as your comprehensive guide, breaking down every mathematical component, every user input, and every visual element to empower you with a profound understanding of how to harness its capabilities.
🔬 THEORETICAL FOUNDATION: THE MATHEMATICS OF MARKET DYNAMICS
VoVix+ is built upon a multi-layered mathematical engine designed to measure what we call "second-order volatility." While standard indicators analyze price, and first-order volatility indicators (like ATR) analyze the range of price, VoVix+ analyzes the dynamics of the volatility itself. This provides insight into the market's underlying state of stability or chaos.
1. The VoVix Score: Measuring Volatility Thrust
The core of the system begins with the VoVix Score. This is a normalized measure of volatility acceleration or deceleration.
Mathematical Formula:
VoVix Score = (ATR(fast) - ATR(slow)) / (StDev(ATR(fast)) + ε)
Where:
ATR(fast) is the Average True Range over a short period, representing current, immediate volatility.
ATR(slow) is the Average True Range over a longer period, representing the baseline or established volatility.
StDev(ATR(fast)) is the Standard Deviation of the fast ATR, which measures the "noisiness" or consistency of recent volatility.
ε (epsilon) is a very small number to prevent division by zero.
Market Implementation:
Positive Score (Expansion): When the fast ATR is significantly higher than the slow ATR, it indicates a rapid increase in volatility. The market is "stretching" or expanding.
Negative Score (Contraction): When the fast ATR falls below the slow ATR, it indicates a decrease in volatility. The market is "coiling" or contracting.
Normalization: By dividing by the standard deviation, we normalize the score. This turns it into a standardized measure, allowing us to compare volatility thrust across different market conditions and timeframes. A score of 2.0 in a quiet market means the same, relatively, as a score of 2.0 in a volatile market.
2. Deviation Analysis (DEV): Gauging Volatility's Own Volatility
The script then takes the analysis a step further. It calculates the standard deviation of the VoVix Score itself.
Mathematical Formula:
DEV = StDev(VoVix Score, lookback_period)
Market Implementation:
This DEV value represents the magnitude of chaos or stability in the market's volatility dynamics. A high DEV value means the volatility thrust is erratic and unpredictable. A low DEV value suggests the change in volatility is smooth and directional.
3. The DEVMA Crossover: Identifying Regime Shifts
This is the primary signal generator. We take two moving averages of the DEV value.
Mathematical Formula:
fastDEVMA = SMA(DEV, fast_period)
slowDEVMA = SMA(DEV, slow_period)
The Core Signal:
The strategy triggers on the crossover and crossunder of these two DEVMA lines. This is a profound concept: we are not looking at a moving average of price or even of volatility, but a moving average of the standard deviation of the normalized rate of change of volatility.
Bullish Crossover (fastDEVMA > slowDEVMA): This signals that the short-term measure of volatility's chaos is increasing relative to the long-term measure. This often precedes a significant market expansion and is interpreted as a bullish volatility regime.
Bearish Crossunder (fastDEVMA < slowDEVMA): This signals that the short-term measure of volatility's chaos is decreasing. The market is settling down or contracting, often leading to trending moves or range consolidation.
⚙️ INPUTS MENU: CONFIGURING YOUR ANALYSIS ENGINE
Every input has been meticulously designed to give you full control over the strategy's behavior. Understanding these settings is key to adapting VoVix+ to your specific instrument, timeframe, and trading style.
🌀 VoVix DEVMA Configuration
🧬 Deviation Lookback: This sets the lookback period for calculating the DEV value. It defines the window for measuring the stability of the VoVix Score. A shorter value makes the system highly reactive to recent changes in volatility's character, ideal for scalping. A longer value provides a smoother, more stable reading, better for identifying major, long-term regime shifts.
⚡ Fast VoVix Length: This is the lookback period for the fastDEVMA. It represents the short-term trend of volatility's chaos. A smaller number will result in a faster, more sensitive signal line that reacts quickly to market shifts.
🐌 Slow VoVix Length: This is the lookback period for the slowDEVMA. It represents the long-term, baseline trend of volatility's chaos. A larger number creates a more stable, slower-moving anchor against which the fast line is compared.
How to Optimize: The relationship between the Fast and Slow lengths is crucial. A wider gap (e.g., 20 and 60) will result in fewer, but potentially more significant, signals. A narrower gap (e.g., 25 and 40) will generate more frequent signals, suitable for more active trading styles.
🧠 Adaptive Intelligence
🧠 Enable Adaptive Features: When enabled, this activates the strategy's performance tracking module. The script will analyze the outcome of its last 50 trades to calculate a dynamic win rate.
⏰ Adaptive Time-Based Exit: If Enable Adaptive Features is on, this allows the strategy to adjust its Maximum Bars in Trade setting based on performance. It learns from the average duration of winning trades. If winning trades tend to be short, it may shorten the time exit to lock in profits. If winners tend to run, it will extend the time exit, allowing trades more room to develop. This helps prevent the strategy from cutting winning trades short or holding losing trades for too long.
⚡ Intelligent Execution
📊 Trade Quantity: A straightforward input that defines the number of contracts or shares for each trade. This is a fixed value for consistent position sizing.
🛡️ Smart Stop Loss: Enables the dynamic stop-loss mechanism.
🎯 Stop Loss ATR Multiplier: Determines the distance of the stop loss from the entry price, calculated as a multiple of the current 14-period ATR. A higher multiplier gives the trade more room to breathe but increases risk per trade. A lower multiplier creates a tighter stop, reducing risk but increasing the chance of being stopped out by normal market noise.
💰 Take Profit ATR Multiplier: Sets the take profit target, also as a multiple of the ATR. A common practice is to set this higher than the Stop Loss multiplier (e.g., a 2:1 or 3:1 reward-to-risk ratio).
🏃 Use Trailing Stop: This is a powerful feature for trend-following. When enabled, instead of a fixed stop loss, the stop will trail behind the price as the trade moves into profit, helping to lock in gains while letting winners run.
🎯 Trail Points & 📏 Trail Offset ATR Multipliers: These control the trailing stop's behavior. Trail Points defines how much profit is needed before the trail activates. Trail Offset defines how far the stop will trail behind the current price. Both are based on ATR, making them fully adaptive to market volatility.
⏰ Maximum Bars in Trade: This is a time-based stop. It forces an exit if a trade has been open for a specified number of bars, preventing positions from being held indefinitely in stagnant markets.
⏰ Session Management
These inputs allow you to confine the strategy's trading activity to specific market hours, which is crucial for day trading instruments that have defined high-volume sessions (e.g., stock market open).
🎨 Visual Effects & Dashboard
These toggles give you complete control over the on-chart visuals and the dashboard. You can disable any element to declutter your chart or focus only on the information that matters most to you.
📊 THE DASHBOARD: YOUR AT-A-GLANCE COMMAND CENTER
The dashboard centralizes all critical information into one compact, easy-to-read panel. It provides a real-time summary of the market state and strategy performance.
🎯 VOVIX ANALYSIS
Fast & Slow: Displays the current numerical values of the fastDEVMA and slowDEVMA. The color indicates their direction: green for rising, red for falling. This lets you see the underlying momentum of each line.
Regime: This is your most important environmental cue. It tells you the market's current state based on the DEVMA relationship. 🚀 EXPANSION (Green) signifies a bullish volatility regime where explosive moves are more likely. ⚛️ CONTRACTION (Purple) signifies a bearish volatility regime, where the market may be consolidating or entering a smoother trend.
Quality: Measures the strength of the last signal based on the magnitude of the DEVMA difference. An ELITE or STRONG signal indicates a high-conviction setup where the crossover had significant force.
PERFORMANCE
Win Rate & Trades: Displays the historical win rate of the strategy from the backtest, along with the total number of closed trades. This provides immediate feedback on the strategy's historical effectiveness on the current chart.
EXECUTION
Trade Qty: Shows your configured position size per trade.
Session: Indicates whether trading is currently OPEN (allowed) or CLOSED based on your session management settings.
POSITION
Position & PnL: Displays your current position (LONG, SHORT, or FLAT) and the real-time Profit or Loss of the open trade.
🧠 ADAPTIVE STATUS
Stop/Profit Mult: In this simplified version, these are placeholders. The primary adaptive feature currently modifies the time-based exit, which is reflected in how long trades are held on the chart.
🎨 THE VISUAL UNIVERSE: DECIPHERING MARKET GEOMETRY
The visuals are not mere decorations; they are geometric representations of the underlying mathematical concepts, designed to give you an intuitive feel for the market's state.
The Core Lines:
FastDEVMA (Green/Maroon Line): The primary signal line. Green when rising, indicating an increase in short-term volatility chaos. Maroon when falling.
SlowDEVMA (Aqua/Orange Line): The baseline. Aqua when rising, indicating a long-term increase in volatility chaos. Orange when falling.
🌊 Morphism Flow (Flowing Lines with Circles):
What it represents: This visualizes the momentum and strength of the fastDEVMA. The width and intensity of the "beam" are proportional to the signal strength.
Interpretation: A thick, steep, and vibrant flow indicates powerful, committed momentum in the current volatility regime. The floating '●' particles represent kinetic energy; more particles suggest stronger underlying force.
📐 Homotopy Paths (Layered Transparent Boxes):
What it represents: These layered boxes are centered between the two DEVMA lines. Their height is determined by the DEV value.
Interpretation: This visualizes the overall "volatility of volatility." Wider boxes indicate a chaotic, unpredictable market. Narrower boxes suggest a more stable, predictable environment.
🧠 Consciousness Field (The Grid):
What it represents: This grid provides a historical lookback at the DEV range.
Interpretation: It maps the recent "consciousness" or character of the market's volatility. A consistently wide grid suggests a prolonged period of chaos, while a narrowing grid can signal a transition to a more stable state.
📏 Functorial Levels (Projected Horizontal Lines):
What it represents: These lines extend from the current fastDEVMA and slowDEVMA values into the future.
Interpretation: Think of these as dynamic support and resistance levels for the volatility structure itself. A crossover becomes more significant if it breaks cleanly through a prior established level.
🌊 Flow Boxes (Spaced Out Boxes):
What it represents: These are compact visual footprints of the current regime, colored green for Expansion and red for Contraction.
Interpretation: They provide a quick, at-a-glance confirmation of the dominant volatility flow, reinforcing the background color.
Background Color:
This provides an immediate, unmistakable indication of the current volatility regime. Light Green for Expansion and Light Aqua/Blue for Contraction, allowing you to assess the market environment in a split second.
📊 BACKTESTING PERFORMANCE REVIEW & ANALYSIS
The following is a factual, transparent review of a backtest conducted using the strategy's default settings on a specific instrument and timeframe. This information is presented for educational purposes to demonstrate how the strategy's mechanics performed over a historical period. It is crucial to understand that these results are historical, apply only to the specific conditions of this test, and are not a guarantee or promise of future performance. Market conditions are dynamic and constantly change.
Test Parameters & Conditions
To ensure the backtest reflects a degree of real-world conditions, the following parameters were used. The goal is to provide a transparent baseline, not an over-optimized or unrealistic scenario.
Instrument: CME E-mini Nasdaq 100 Futures (NQ1!)
Timeframe: 5-Minute Chart
Backtesting Range: March 24, 2024, to July 09, 2024
Initial Capital: $100,000
Commission: $0.62 per contract (A realistic cost for futures trading).
Slippage: 3 ticks per trade (A conservative setting to account for potential price discrepancies between order placement and execution).
Trade Size: 1 contract per trade.
Performance Overview (Historical Data)
The test period generated 465 total trades , providing a statistically significant sample size for analysis, which is well above the recommended minimum of 100 trades for a strategy evaluation.
Profit Factor: The historical Profit Factor was 2.663 . This metric represents the gross profit divided by the gross loss. In this test, it indicates that for every dollar lost, $2.663 was gained.
Percent Profitable: Across all 465 trades, the strategy had a historical win rate of 84.09% . While a high figure, this is a historical artifact of this specific data set and settings, and should not be the sole basis for future expectations.
Risk & Trade Characteristics
Beyond the headline numbers, the following metrics provide deeper insight into the strategy's historical behavior.
Sortino Ratio (Downside Risk): The Sortino Ratio was 6.828 . Unlike the Sharpe Ratio, this metric only measures the volatility of negative returns. A higher value, such as this one, suggests that during this test period, the strategy was highly efficient at managing downside volatility and large losing trades relative to the profits it generated.
Average Trade Duration: A critical characteristic to understand is the strategy's holding period. With an average of only 2 bars per trade , this configuration operates as a very short-term, or scalping-style, system. Winning trades averaged 2 bars, while losing trades averaged 4 bars. This indicates the strategy's logic is designed to capture quick, high-probability moves and exit rapidly, either at a profit target or a stop loss.
Conclusion and Final Disclaimer
This backtest demonstrates one specific application of the VoVix+ framework. It highlights the strategy's behavior as a short-term system that, in this historical test on NQ1!, exhibited a high win rate and effective management of downside risk. Users are strongly encouraged to conduct their own backtests on different instruments, timeframes, and date ranges to understand how the strategy adapts to varying market structures. Past performance is not indicative of future results, and all trading involves significant risk.
🔧 THE DEVELOPMENT PHILOSOPHY: FROM VOLATILITY TO CLARITY
The journey to create VoVix+ began with a simple question: "What drives major market moves?" The answer is often not a change in price direction, but a fundamental shift in market volatility. Standard indicators are reactive to price. We wanted to create a system that was predictive of market state. VoVix+ was designed to go one level deeper—to analyze the behavior, character, and momentum of volatility itself.
The challenge was twofold. First, to create a robust mathematical model to quantify these abstract concepts. This led to the multi-layered analysis of ATR differentials and standard deviations. Second, to make this complex data intuitive and actionable. This drove the creation of the "Visual Universe," where abstract mathematical values are translated into geometric shapes, flows, and fields. The adaptive system was intentionally kept simple and transparent, focusing on a single, impactful parameter (time-based exits) to provide performance feedback without becoming an inscrutable "black box." The result is a tool that is both profoundly deep in its analysis and remarkably clear in its presentation.
⚠️ RISK DISCLAIMER AND BEST PRACTICES
VoVix+ is an advanced analytical tool, not a guarantee of future profits. All financial markets carry inherent risk. The backtesting results shown by the strategy are historical and do not guarantee future performance. This strategy incorporates realistic commission and slippage settings by default, but market conditions can vary. Always practice sound risk management, use position sizes appropriate for your account equity, and never risk more than you can afford to lose. It is recommended to use this strategy as part of a comprehensive trading plan. This was developed specifically for Futures
"The prevailing wisdom is that markets are always right. I take the opposite view. I assume that markets are always wrong. Even if my assumption is occasionally wrong, I use it as a working hypothesis."
— George Soros
— Dskyz, Trade with insight. Trade with anticipation.

Keltner Channel StrategyOverview
The Keltner Channel Strategy is a powerful trend-following and mean-reversion system that leverages the Keltner Channels, EMA crossovers, and ATR-based stop-losses to optimize trade entries and exits. This strategy has proven to be highly effective, particularly when applied to Gold (XAUUSD) and other commodities with strong trend characteristics.
📈 How It Works
This strategy incorporates two trading approaches: 1️⃣ Keltner Channel Reversal Trades – Identifies overbought and oversold conditions when price touches the outer bands.
2️⃣ Trend Following Trades – Uses the 9 EMA & 21 EMA crossover, with confirmation from the 50 EMA, to enter trades in the direction of the trend.
🔍 Entry & Exit Criteria
📊 Keltner Channel Entries (Reversal Strategy)
✅ Long Entry: When the price crosses below the lower Keltner Band (potential reversal).
✅ Short Entry: When the price crosses above the upper Keltner Band (potential reversal).
⏳ Exit Conditions:
Long positions close when price crosses back above the mid-band (EMA-based).
Short positions close when price crosses back below the mid-band (EMA-based).
📈 Trend Following Entries (Momentum Strategy)
✅ Long Entry: When the 9 EMA crosses above the 21 EMA, and price is above the 50 EMA (bullish momentum).
✅ Short Entry: When the 9 EMA crosses below the 21 EMA, and price is below the 50 EMA (bearish momentum).
⏳ Exit Conditions:
Long positions close when the 9 EMA crosses back below the 21 EMA.
Short positions close when the 9 EMA crosses back above the 21 EMA.
📌 Risk Management & Profit Targeting
ATR-based Stop-Losses:
Long trades: Stop set at 1.5x ATR below entry price.
Short trades: Stop set at 1.5x ATR above entry price.
Take-Profit Levels:
Long trades: Profit target 2x ATR above entry price.
Short trades: Profit target 2x ATR below entry price.
🚀 Why Use This Strategy?
✅ Works exceptionally well on Gold (XAUUSD) due to high volatility.
✅ Combines reversal & trend strategies for improved adaptability.
✅ Uses ATR-based risk management for dynamic position sizing.
✅ Fully automated alerts for trade entries and exits.
🔔 Alerts
This script includes automated TradingView alerts for:
🔹 Keltner Band touches (Reversal signals).
🔹 EMA crossovers (Momentum trades).
🔹 Stop-loss & Take-profit activations.
📊 Ideal Markets & Timeframes
Best for: Gold (XAUUSD), NASDAQ (NQ), Crude Oil (CL), and trending assets.
Recommended Timeframes: 15m, 1H, 4H, Daily.
⚡️ How to Use
1️⃣ Add this script to your TradingView chart.
2️⃣ Select a 15m, 1H, or 4H timeframe for optimal results.
3️⃣ Enable alerts to receive trade notifications in real time.
4️⃣ Backtest and tweak ATR settings to fit your trading style.
🚀 Optimize your Gold trading with this Keltner Channel Strategy! Let me know how it performs for you. 💰📊

Flux Charts - SFX Automation💎 GENERAL OVERVIEW
The SFX Automation is a powerful and versatile tool designed to help traders rigorously test their trading strategies against historical market data. With various advanced settings, traders can fine-tune their strategies, assess performance, and identify key improvements before deploying in live trading environments. This tool offers a wide range of configurable settings, explained within this write-up.
Features of the new SFX Automation :
Step By Step : Configure your strategy step by step, which will allow you to have OR & AND logic in your strategies.
Highly Configurable : Offers multiple parameters for fine-tuning trade entry and exit conditions.
Multi-Timeframe Analysis : Allows traders to analyze multiple timeframes simultaneously for enhanced accuracy.
Provides advanced stop-loss, take-profit, and break-even settings.
Incorporates Buy & Sell signals, with settings like Signal Sensitivity, Strength, Time Weighting, Dynamic TP & SL Methods and more for refined strategy execution.
🚩 UNIQUENESS
The SFX Automation stands out from conventional backtesting tools due to its unparalleled flexibility, precision, and advanced trading logic integration. Key factors that make it unique include:
✅ Comprehensive Strategy Customization – Unlike traditional backtesters that offer basic entry and exit conditions, SFX Automation provides a highly detailed parameter set, allowing traders to fine-tune their strategies with precision.
✅ Multi-Timeframe Signals – This is the first-ever tool that allows traders to backtest Buy & Sell Signals on multiple timeframes.
✅ Customizable Take-Profit Conditions – Offers various methods to set take-profit exits, including using core features from SFX Algo, and dynamic exits like signal rating upgrades/downgrades, enabling traders to tailor their exit strategies to specific market behaviors.
✅ Customizable Stop-Loss Conditions – Provides several ways to set up stop losses, including using concepts from SFX Algo and trailing stops or dynamic exits like signal rating upgrades/downgrades, allowing for dynamic risk management tailored to individual strategies.
✅ Integration of External Indicators – Allows the inclusion of other indicators or data sources from TradingView for creating strategy conditions, enabling traders to enhance their strategies with additional insights and data points.
By integrating these advanced features, SFX Automation ensures that traders can rigorously test and optimize their strategies with great accuracy and efficiency.
📌 HOW DOES IT WORK ?
The first setting you will want to set it the pyramiding setting. This setting controls the number of simultaneous trades in the same direction allowed in the strategy. For example, if you set it to 1, only one trade can be active in any time, and the second trade will not be entered unless the first one is exited. If it is set to 2, the script will handle both of them at the same time. Note that you should enter the same value to this pyramiding setting, and the pyramiding setting in the "Properties" tab of the script for this to work.
You can enable and set a backtesting window that will limit the entries to between the start date & end date.
Entry Conditions
From the "Long Conditions" or the "Short Conditions" groups, you can set your position entry conditions. For settings like "initial capital" or "order size", you can open the "Properties" tab, where these are handled.
The SFX Algo can use the following conditions for entry conditions :
1. Buy Signal (Any, or 1-5 ☆)
This condition is triggered when a Buy Signal occurs. Other timeframes are supported with this condition.
2. Buy | TP (1, 2 or 3)
This condition is triggered when a TP signal of any Buy signal occurs.
3. Buy | SL
This condition is triggered when a SL signal of any Buy signal occurs.
4. Buy | Rating Upgrade
This condition is triggered when the rating of a buy signal is increased.
5. Buy | Rating Downgrade
This condition is triggered when the rating of a buy signal is decreased.
6. Sell Signal (Any, or 1-5 ☆)
This condition is triggered when a Sell Signal occurs. Other timeframes are supported with this condition.
7. Sell | TP (1, 2 or 3)
This condition is triggered when a TP signal of any Sell signal occurs.
8. Sell | SL
This condition is triggered when a SL signal of any Sell signal occurs.
9. Sell | Rating Upgrade
This condition is triggered when the rating of a sell signal is increased.
10. Sell | Rating Downgrade
This condition is triggered when the rating of a sell signal is decreased.
11. Retracement Wave Retest (Bullish or Bearish)
A retest on the Retracement Wave occurs when the price temporarily moves against the prevailing trend, touching or entering the wave before continuing in the original trend direction. This retest serves as a confirmation that the wave is acting as dynamic support or resistance.
12. Retracement Wave Retracement (Bullish or Bearish)
A retracement on the Retracement Wave occurs when the price touches the wave, the condition is triggered immediately.
13. Volatility Bands Retest (Bullish or Bearish)
A retest of Volatility Bands occurs when the price initially moves beyond the bands, then pulls back to "retest" the band it just broke through before continuing its move. This can provide traders with confirmation of a breakout or signal a potential reversal.
14. Volatility Bands Retracement (Bullish or Bearish)
A retracement on the Volatility Bands occur when the price touches the band, the condition is triggered immediately.
🕒 TIMEFRAME CONDITIONS
The SFX Automation supports Multi-Timeframe (MTF) features for Buy & Sell signals. When setting an entry condition, you can also choose the timeframe.
External Conditions
Users can use external indicators on the chart to set entry conditions.
The second dropdown in the external condition settings allows you to choose a conditional operator to compare external outputs. Available options include:
Less Than or Equal To: <=
Less Than: <
Equal To: =
Greater Than: >
Greater Than or Equal To: >=
The position entry conditions work like this ;
Each side has 3 SFX Algo conditions and 2 Source conditions. Each condition can be enabled or disabled using the checkbox on the left side of them.
You can select which timeframe this condition should work on for Buy & Sell signals. If you select "Chart", the condition will work for the chart's current timeframe.
Lastly select the step of this condition from 1 to 6.
The Source Condition
The last condition on each side is a source condition that is different from the others. Using this condition, you can create your own logic using other indicators' outputs on your chart. For example, suppose that you have an EMA indicator in your chart. You can have the source condition to something like "EMA > high".
The Step System
Each condition has a step number, and conditions are in topological order based on them.
The conditions are executed step by step. This means the condition with step 2 cannot be executed before the condition with step 1 is executed.
Conditions with the same step numbers have "OR" logic. This means that if you have 2 conditions with step 3, the condition with step 4 can trigger after only one of the step 3 conditions is executed.
➕ OTHER ENTRY FEATURES
The SFX Automation allows traders to choose when to execute trades and when not to execute trades.
1. Only Take Trades
This setting lets users specify the time period when their strategy can open or execute trades.
2. Don't Take Trades
This setting lets users specify time periods when their strategy can't open or execute trades.
↩️ EXIT CONDITIONS
1. Exit on Opposite Signal
When enabled, a long position will close when short entry conditions are met, and a short position will close when long entry conditions are met.
2. Exit on Session End
When enabled, positions will be closed at the end of the trading session.
📈 TAKE PROFIT CONDITIONS
There are several methods available for setting take profit exits and conditions.
1. Entry Condition TP
Users can use entry conditions as triggers for take profit exits. This setting can be found under the long and short exit conditions.
2. Fixed TP
Users can set a fixed TP for exits. This setting can be found under the long and short exit conditions. Users can choose between the following:
Price: This method triggers a TP exit when price reaches a specified level. For example, if you set the Price TP to 10 and buy NASDAQ:TSLA at $190, the trade will automatically exit when the price reaches $200 ($190 + $10).
Ticks: This method triggers a TP exit when price moves a specified number of ticks.
Percentage (%): This method triggers a TP exit when price moves a specified percentage.
ATR: This method triggers a TP exit based on a specified multiple of the Average True Range (ATR).
🧩EXIT PERCENTAGES
For each 3 dynamic take-profit conditions, you can set the amount of the position to exit in terms of percentage. It's important to make sure that the total of the exit percentages are 100%.
📉 STOP LOSS CONDITIONS
There are several methods available for setting stop-loss exits and conditions.
1. Entry Condition SL
Users can use entry conditions as triggers for stop-loss exits. This setting can be found under the long and short exit conditions.
2. Fixed SL
Users can set a fixed SL for exits. This setting can be found under the long and short exit conditions. Users can choose between the following:
Price: This method triggers a SL exit when price reaches a specified level. For example, if you set the Price SL to 10 and buy NASDAQ:TSLA at $200, the trade will automatically exit when the price reaches $190 ($200 - $10).
Ticks: This method triggers a SL exit when price moves a specified number of ticks.
Percentage (%): This method triggers a SL exit when price moves a specified percentage.
ATR: This method triggers a SL exit based on a specified multiple of the Average True Range (ATR).
3. Trailing Stop
An explanation & example for the trailing stop feature is present on the write-up within the next section.
Exit conditions have the same logic of constructing conditions like the entry ones. You can construct a Take-Profit Condition & a Stop-Loss Condition. Note that the Take-Profit condition will only work if the position is in profit, regardless of if it's triggered or not. The same applies for the Stop-Loss condition, meaning that it will only work if the position is in loss.
You can also set a Fixed TP & Fixed SL based on the price movement after the position is entered. You have options like "Price", "Ticks", "%", or "Average True Range". For example, you can set a Fixed TP like "5%", and the position will be entered once it moves 5% up in a long position.
Trailing Stop
For the Fixed SL, you also have a "Trailing" stop option, which you can set it's activation level as well. The Trailing stop activation level and it's value are expressed in ticks. Check this scenerio for an example :
We have a ticker with a tick value of $1. Our Trailing Stop is set to 10 ticks, and the activation level is set to 30 ticks.
We buy 1 contract when the price is $100.
When the price becomes $110, we are in $10 (10 ticks) profit and the trailing stop is now activated.
The current price our stop's on is $110 - $30 (30 ticks), which is the level of $80.
The trailing stop will only move if the price moves up the highest high the price has been after we entered the position.
Let's suppose that price moves up $40 right after our trailing stop is activated. The price will now be $150, and our trailing stop will sit on $150 - $30 (30 ticks) = $120.
If the price is down the $120 level, our stop loss will be triggered.
There is also a "Hard SL" option designed for a backup stop-loss when trailing stops are enabled. You can enable & set this option and if the price goes down before our trailing stop even activates, the position will be exited.
You can also move stop-loss to the break-even (entry price of the position) after a certain profit is achieved using the last setting of the exit conditions. Note that for this to work, you will need to have a Fixed SL setup.
➕ OTHER EXIT FEATURES
1. Move Stop Loss to Breakeven
This setting allows the strategy to automatically move the SL to Breakeven (BE) when the position is in profit by a certain amount. Users can choose between the following:
Price: This method moves the SL to BE when price reaches a specified level.
Ticks: This method moves the SL to BE when price moves a specified number of ticks.
Percentage (%): This method moves the SL to BE when price moves a specified percentage.
ATR: This method moves the SL to BE when price moves a specified multiple of the Average True Range (ATR).
Example Entry Scenario
To give an example , check this scenario; out conditions are :
LONG CONDITIONS
Buy Signal Any☆, Step 1
Bullish R. Wave Retest, Step 2
Bullish V. Bands Retest, Step 2
open > close, Step 3
First, the strategy needs to detect a Buy Signal with any star rating in order to start working.
After it's detected, now it's looking for either a Bullish R. Wave Retest, or a Bullish V. Bands Retest to proceed to the next step, the reason for this is that they both have the same step number.
After one of them is detected, the strategy will consistently check candlesticks for the condition open > close. If a bullish candlestick occurs, a long position will be entered.
⏰ ALERTS
This indicator uses TradingView's strategy alert system. All entries and exits will be sent as an alert if configured. It's possible to further customize these alerts to your liking. For more information, check TradingView's strategy alert customization page: www.tradingview.com
⚙️ SETTINGS
1. Backtesting Settings
Pyramiding: Controls the number of simultaneous trades allowed in the strategy. This setting must have the same value that is entered on the script's properties tab on the settings pane.
Enable Custom Backtesting Period: Restricts backtesting to a specific date range.
Start & End Time Configuration: Define precise start and end dates for historical analysis.
2. Algorithm Settings
Sensitivity: The sensitivity setting is a key parameter that influences the number of signals the SFX Algo generates. By adjusting this parameter, you can control the frequency of signals produced by the algorithm.
Signal Strength: The Signal Strength setting filters signals based on their quality, allowing traders to focus on the most reliable opportunities. This feature helps traders balance the quantity and reliability of the algorithm’s signals to suit their trading strategy.
Time Weighting: The Time Weighting setting determines how the SFX Algo evaluates historical market data to generate signals.
a) Recent Trends
Focuses on the most recent movements for short-term analysis. This setting is good for scalpers and intraday traders who need to react quickly to market changes.
b) Mixed Trends
Balances recent and historical price movements for a comprehensive market view. This setting is well-suited for swing traders and those who want to capture medium-term opportunities by combining the benefits of short-term responsiveness with the reliability of long-term trends.
c) Long-term Trends
Relies on extended historical market data to identify broader market trends, making it an excellent choice for traders focused on long-term strategies.
Minimum Star Rating: The Minimum Star Rating setting allows you to filter signals based on their strength, showing only those that meet or exceed your chosen threshold. For instance, setting the minimum star rating to 3 ensures you only receive signals with a rating of 3 stars or higher.
3. Take Profit / Stop Loss Methods
Key Levels
The Key Levels method uses pivot points to set take profit and stop-loss levels. The TP and SL levels are shown when a new signal is generated.
Volatility Bands
This TP/SL method uses the Volatility Bands overlay to set dynamic TP and SL levels. These levels are not predetermined so they will not be shown in advance when a signal is generated.
Signal Rating
Sets take profit and stop-loss levels based on changes in a signal's rating strength. These levels are not predetermined so they will not be shown in advance when a signal is generated.
Auto Stop-Loss
The auto method can only be applied to the SL. The auto method allows the algorithm to detect SL automatically when a momentum shift is detected. You can adjust the risk tolerance of the Auto SL by adjusting the ‘Auto Risk Tolerance’ setting. You can choose between Low, Medium, and High. A high-risk tolerance will result in stop losses being triggered less often.
4. Entry Conditions for Long & Short Trades
Multiple Conditions (1-6): Configure up to six independent conditions per trade direction.
Timeframe Specification: Choose between timeframes for Buy & Sell signals.
Trade Execution Filters: Restrict trades within specific trading sessions.
5. Exit Conditions for Long & Short Trades
Exit on Opposite Signal: Automatically exit trades upon opposite trade conditions.
Exit on Session End: Closes all positions at the end of the trading session.
Multiple Take-Profit (TP) and Stop-Loss (SL) Configurations:
TP/SL based on % move, ATR, Ticks, or Fixed Price.
Hard SL option for additional risk control.
Move SL to BE (Break Even) after a certain profit threshold.

SL Hunting Detector📌 Step 1: Identify Liquidity Zones
The script plots high-liquidity zones (red) and low-liquidity zones (green).
These are areas where big players target stop-losses before reversing the price.
Example:
If price is near a red liquidity zone, expect a potential stop-loss hunt & reversal downward.
If price is near a green liquidity zone, expect a potential stop-loss hunt & reversal upward.
📌 Step 2: Watch for Stop-Loss Hunts (Fakeouts)
The indicator marks stop-loss hunts with red (bearish) or green (bullish) arrows.
When do stop-loss hunts occur?
✅ A long wick below support (with high volume) = Stop hunt before reversal upward.
✅ A long wick above resistance (with high volume) = Stop hunt before reversal downward.
Confirmation:
Volume must spike (volume > 1.5x the average volume).
ATR-based wicks must be longer than usual (showing a stop-hunt trap).
📌 Step 3: Enter a Trade After a Stop-Hunt
🔹 Bullish Trade (Buying a Dip)
If a green arrow appears (stop-hunt below support):
✅ Enter a long (buy) trade at or just above the wick’s recovery level.
✅ Stop-loss: Below the wick’s low (avoid getting hunted again).
✅ Take-profit: Next resistance level or mid-range of the liquidity zone.
🔹 Bearish Trade (Shorting a Fakeout)
If a red arrow appears (stop-hunt above resistance):
✅ Enter a short (sell) trade at or just below the wick’s rejection level.
✅ Stop-loss: Above the wick’s high (avoid getting stopped out).
✅ Take-profit: Next support level or mid-range of the liquidity zone.
📌 Step 4: Set Alerts & Automate
✅ The indicator triggers alerts when a stop-hunt is detected.
✅ You can set TradingView to notify you instantly when:
A bullish stop-hunt occurs → Look for long entry.
A bearish stop-hunt occurs → Look for short entry.
📌 Example Trade Setup
Example (BTC Long Trade on Stop-Hunt)
BTC is near $40,000 support (green liquidity zone).
A long wick drops to $39,800 with a green arrow (bullish stop-hunt signal).
Volume spikes, and price recovers quickly back above $40,000.
Trade entry: Buy at $40,050.
Stop-loss: Below wick ($39,700).
Take-profit: $41,500 (next resistance).
Result: BTC pumps, stop-loss remains safe, and trade profits.
🔥 Final Tips
Always wait for confirmation (don’t enter blindly on signals).
Use higher timeframes (15m, 1H, 4H) for better accuracy.
Combine with Order Flow tools (like Bookmap) to see real liquidity zones.
🚀 Now try it on TradingView! Let me know if you need adjustments. 📈🔥

Risk Management Calculator with Fees and Take Profit [CHE]Risk Management Calculator with Fees and Take Profit
Welcome to the Risk Management Calculator with Fees and Take Profit script! This powerful tool is designed to help traders manage their risk effectively, calculate leverage, and set take profit targets. The script is inspired by and builds upon the ideas from the following TradingView script: ().
This script is inspired by and builds upon the ideas from the following TradingView script:
Features
1. Portfolio Size Input: Enter the size of your portfolio to accurately calculate your risk and leverage.
2. Max Loss Percent Input: Specify the maximum percentage of your portfolio that you are willing to risk on a single trade.
3. Max Leverage Input: Set the maximum leverage you are comfortable using.
4. Trading Fee Input: Include trading fees in your calculations to get a more realistic view of your potential losses and gains.
5. ATR Settings: Configure the ATR period and multiplier to calculate your stop loss and take profit levels.
6. RSI Settings: Adjust the RSI period for trend analysis.
How to Use
Portfolio Size
- Description: This is the total value of your trading account.
- Input: `portfolioSize`
- Default Value: 100
- Minimum Value: 0.001
Max Loss Percent
- Description: The maximum percentage of your portfolio you are willing to lose on a single trade.
- Input: `maxLossPercent`
- Default Value: 3%
- Range: 0.1% to 100%
Max Leverage
- Description: The maximum leverage you wish to use.
- Input: `maxLeverage`
- Default Value: 125
- Range: 1 to 125
Trading Fee
- Description: The fee percentage you pay per trade.
- Input: `feeRate`
- Default Value: 1%
- Range: 0% to 10%
ATR Settings
- ATR Period: Number of bars used to calculate the Average True Range.
- Input: `atrPeriod`
- Default Value: 5
- ATR Multiplier: Multiplier for ATR to set stop loss levels.
- Input: `atrMultiplier`
- Default Value: 2.0
Take Profit Multiplier
- Description: Multiplier for ATR to set take profit levels.
- Input: `takeProfitMultiplier`
- Default Value: 2.0
RSI Settings
- RSI Period: Period for the RSI calculation.
- Input: `rsiPeriod`
- Default Value: 14
Dashboard
The script includes a customizable dashboard that displays the following information:
- Portfolio Size
- Maximum Loss Amount
- Entry Price
- Stop Loss Price
- Stop Loss Percentage
- Calculated Leverage
- Order Value
- Order Quantity
- Trend Direction
- Adjusted Maximum Loss Percentage
- Take Profit Price
Dashboard Settings
- Location: Choose the position of the dashboard on the chart.
- Options: 'Top Right', 'Bottom Right', 'Top Left', 'Bottom Left'
- Size: Adjust the size of the dashboard text.
- Options: 'Tiny', 'Small', 'Normal', 'Large'
- Text/Frame Color: Set the color for the text and frame of the dashboard.
Underlying Principles and Assumptions
Leverage Calculation
The leverage calculation is fundamental to risk management in trading. It ensures that the risk per trade does not exceed a specified percentage of the portfolio. This calculation takes into account the potential loss from the entry price to the stop loss level, adjusted for trading fees. By dividing the maximum acceptable loss by the total potential loss (including fees), we derive a leverage that limits the exposure per trade. This approach helps traders avoid over-leveraging, which can lead to significant losses.
ATR and Stop Loss
The Average True Range (ATR) is used to set stop loss levels because it measures market volatility. A higher ATR indicates more volatility, which means wider stop losses are needed to avoid being prematurely stopped out by normal market fluctuations. By using an ATR multiplier, the stop loss is dynamically adjusted based on current market conditions, providing a more robust risk management strategy.
Take Profit Calculation
The take profit level is calculated as a multiple of the ATR, ensuring that it is set at a realistic level relative to market volatility. This method aims to capture significant price movements while avoiding the noise of smaller fluctuations. Setting take profit targets this way helps in locking in profits when the market moves favorably.
RSI for Trend Confirmation
The Relative Strength Index (RSI) is used to confirm the trend direction. An RSI above 50 typically indicates a bullish trend, while an RSI below 50 indicates a bearish trend. By aligning trades with the prevailing trend, the script increases the probability of successful trades. This trend confirmation helps in making informed decisions about leverage and position sizing.
Risk Color Coding
The script uses color coding to visually indicate the risk level and trend direction. Green indicates a favorable condition for long trades, red for short trades, and gray for neutral conditions. This intuitive color coding aids in quickly assessing the market conditions and making timely trading decisions.
Conclusion
This script aims to provide a comprehensive risk management tool for traders. By integrating portfolio size, leverage, fees, ATR, and RSI, it helps in making informed trading decisions. We hope you find this tool useful in your trading journey.
Happy Trading!

Position Size Calculator for ContractDescription:
Position Size Calculator is a versatile Pine Script tool designed to help traders manage their risk and position sizing effectively. This script calculates essential trading metrics and visualizes them directly on your chart, helping you make informed trading decisions.
Features:
- Account Size & Risk Management:
- Account Size: Input your total account balance to calculate position sizes.
- Maximum Risk: Define how much of your account you are willing to risk per trade in dollars.
- Pip Value: Set the value of a single pip for one contract, which is crucial for calculating risk
and position size.
Trade Setup Visualization:
- Entry Price: Specify the price at which you plan to enter the trade.
- Stop Loss: Define your stop loss level to manage your risk.
- Take Profit: Set your target profit level for the trade.
- Visualize the Entry, Stop Loss, and Take Profit levels on your chart with customizable line
colors and text sizes.
- View the distance in pips between the Entry, Stop Loss, and Take Profit levels.
Position Size Calculation:
- Calculates the number of contracts to open based on your risk tolerance and the pip value.
- Displays the maximum number of contracts you can open given your risk parameters.
Customizable Table Display:
- Table Position: Choose the position of the summary table on the chart (Top-Left, Top-Right,
Bottom-Left, Bottom-Right, etc.).
- Table Text Size: Adjust the text size for the summary table.
- Table Background Color: Set the background color for the summary table.
- Table Border Color: Customize the border color of the summary table.
How to Use:
1- Input your Account Size: Enter your current account balance.
2- Set Maximum Risk and Pip Value: Define how much you're willing to risk per trade and the
pip value for your contract.
3- Define Trade Levels: Input your desired Entry Price, Stop Loss, and Take Profit levels.
4- Customize Visuals: Adjust the line styles and table settings to fit your preferences.
5- View Calculations: The script will display the distance in pips and the calculated position
size directly on your chart.
Example Usage:
Example to calculate the value of 1 pips with 1 contract:
Inputs:
Account Size: Your total trading account balance.
Maximum Risk: Risk amount per trade in dollars.
Pip Value: Value of one pip for a single contract.
Entry Price: The price at which you plan to enter the trade.
Stop Loss: The level at which you will exit the trade to cut losses.
Take Profit: The target price to lock in profits.
Line Text Size: Size of the text for the Entry, Stop Loss, and Take Profit lines.
Line Extend: Option to extend the lines for visual clarity.
Table Position: Position of the summary table on the chart.
Table Text Size: Size of the text in the summary table.
Table Background Color: Background color of the summary table.
Table Border Color: Border color of the summary table.
Visuals:
Entry Price, Stop Loss, and Take Profit levels are clearly marked on the chart.
Summary Table with important trade metrics displayed.

IsAlgo - Support & Resistance Strategy► Overview:
The Support & Resistance Strategy is designed to identify critical support and resistance levels and execute trades when the price crosses these levels. Utilizing a combination of a moving average, ATR indicator, and the highest and lowest prices, this strategy aims to accurately pinpoint entry and exit points for trades based on market movements.
► Description:
The Support & Resistance Strategy leverages the ATR (Average True Range) and a moving average to identify key support and resistance levels. The strategy calculates these levels by measuring the distance between the current market price and the moving average. This distance is continuously compared with each new candle to provide an estimate of the support and resistance levels.
The ATR is utilized to determine the width of these levels, ensuring they adjust to market volatility. To validate these levels, the strategy counts how often a candle’s low or high touches the estimated support or resistance and then bounces back. A higher frequency of such touches indicates a stronger, more reliable level.
Once the levels are confirmed, the strategy waits for a candle to close above the resistance level or below the support level. A candle closing above the resistance triggers a long entry, while a candle closing below the support triggers a short entry.
The strategy incorporates multiple stop-loss options to manage risk effectively. These options include setting stop-loss levels based on fixed pips, ATR calculations, or the highest/lowest prices of previous candles. Up to three take-profit levels can be set using fixed pips, ATR, or risk-to-reward ratios. A trailing stop feature adjusts the stop loss as the trade moves into profit, and a break-even feature moves the stop loss to the entry price once a certain profit level is reached.
Additionally, the strategy can close trades if the price crosses the opposite support or resistance level or if a candle moves significantly against the trade direction.
↑ Long Entry Example:
↓ Short Entry Example:
► Features & Settings:
⚙︎ Levels: Configure the length, width, and ATR period for support and resistance levels.
⚙︎ Moving Average: Use an Exponential Moving Average (EMA) to confirm trend direction. This can be enabled or disabled.
⚙︎ Entry Candle: Define the minimum and maximum body size and the body-to-candle size ratio for entry candles.
⚙︎ Trading Session: Specify the trading hours during which the strategy operates.
⚙︎ Trading Days: Select which days of the week the strategy is active.
⚙︎ Backtesting: Set a backtesting period with start and end dates. This feature can be deactivated.
⚙︎ Trades: Customize trade direction (long, short, or both), position sizing (fixed or percentage-based), maximum open trades, and daily trade limits.
⚙︎ Trades Exit: Choose from various exit methods, including profit/loss limits, trade duration, or crossing the opposite support/resistance level.
⚙︎ Stop Loss: Set stop-loss levels using fixed pips, ATR-based calculations, or the highest/lowest price within a specified number of previous candles.
⚙︎ Break Even: Adjust the stop loss to break-even once certain profit conditions are met.
⚙︎ Trailing Stop: Automatically adjust the stop loss as the trade moves into profit.
⚙︎ Take Profit: Define up to three take-profit levels using fixed pips, ATR, or risk-to-reward ratios based on the stop loss.
⚙︎ Alerts: Receive alerts for significant actions such as trade openings and closings, with support for dynamic values.
⚙︎ Dashboard: A visual display on the chart providing detailed information about ongoing and past trades.
► Backtesting Details:
Timeframe: 1-hour US30 chart
Initial Balance: $10,000
Order Size: 5 Units
Commission: $0.5 per contract
Slippage: 5 ticks
Stop Loss: Based on the opposite support/resistance level or break-even adjustments

Notional Trade Table
Notional Trade Table indicator displays notional trade values for given Buy and Sell of given input of Symbol, Quantity, Entry Price and Stop Loss .
Sections of Input Menu Table are supported with Tool Tip icons.
Input Symbols:
(Refer Input Menu)
User can choose maximum 20 Symbols.
Input Side Choice (BUY/SELL):
(Refer Input Menu)
After choosing Symbol, User has to choose the BUY or SELL option for each Symbol against the corresponding Sybol number. If NIL is selected “Nil is selected ” message is displayed prompting the user to select BUY or SELL sides.
For example in the above Input Menu:
Sym1 is BATS:AAPL. Corresponding Side 1 is Sell1.
Sym2 is BATS:NVDA Corresponding Side 2 Sell 2.
Sym12 is BATS:NFLX. Corresponding Side 12 is Buy12 and so on.
Input Quantity:
(Refer Input Menu)
Next enter Corresponding Quantity of BUY or SELL in relevant Quantity Input Box. Quantity cannot be Zero. Defval is 1.
For Sym1 input in Qty 1 box,for Sym2 input in Qty 2 box and so on.
Input Entry Price:
(Refer Input Menu)
After entering Quantity Input Entry Price for Corresponding Symbol.
Input for Sym1 Entry Price in EP1 box
Input for Sym2 Entry Price in EP2 box
and so on.
Input Stop Loss:
(Refer Input Menu)
Next Enter corresponding Stop Loss for each Symbol.
SL1 input box denotes Sym1 Stop Loss.
SL2 input box denotes Sym2 Stop Loss.
SL3 input box denotes Sym3 Stop Loss and so on.
Stop Loss for Chosen BUY side should be below corresponding Entry Price/Last Price. Otherwise a message is displayed “SL Hit”. User has to enter valid data.
Stop Loss for Chosen SELL side should be above corresponding Entry Price/Last Price. Otherwise a message is displayed “SL Hit”. User has to enter valid data.
Notional Trade Table:
(Refer the Table on Chart)
From the input menu filled by User script captures the Symbol, BUY/SELL options, Quantity,
Entry Price and Stop Loss details under the corresponding heads in the Notional Trade Table.
The script captures the live Last traded Price under the head LP and calculates and displays corresponding Profit or Loss under PR/LO column in the table.
SL+- LP is the difference between Last traded Price (LP) and Stop Loss Price. Positive figure under this head reflects Stop Loss cushion available .
Nil header column reflects message “NIL selected” prompting the User to select BUY or SELL sides.
SLH header displays “SL Hit” on Stop Loss Hit or wrong input of Stop Loss inconsistent with BUY or SELL sides of Trade. On “SL Hit” message all values in corresponding Symbol becomes Zero. User has to re-enter the details fresh .
On the top left side corner of the table there are 2 cells with Prono and Lono.They denote the number of trades which are in Profit (Prono) and which are in Loss(Lono).
It is preferable to choose Symbols from a single country exchange commensurate with the Time zone. Otherwise if Exchange and Chart time Zone differs there is risk of data loss in the table.
DISCLAIMER: For educational and entertainment purpose only .Nothing in this content should be interpreted as financial advice or a recommendation to buy or sell any sort of security/ies or investment/s.
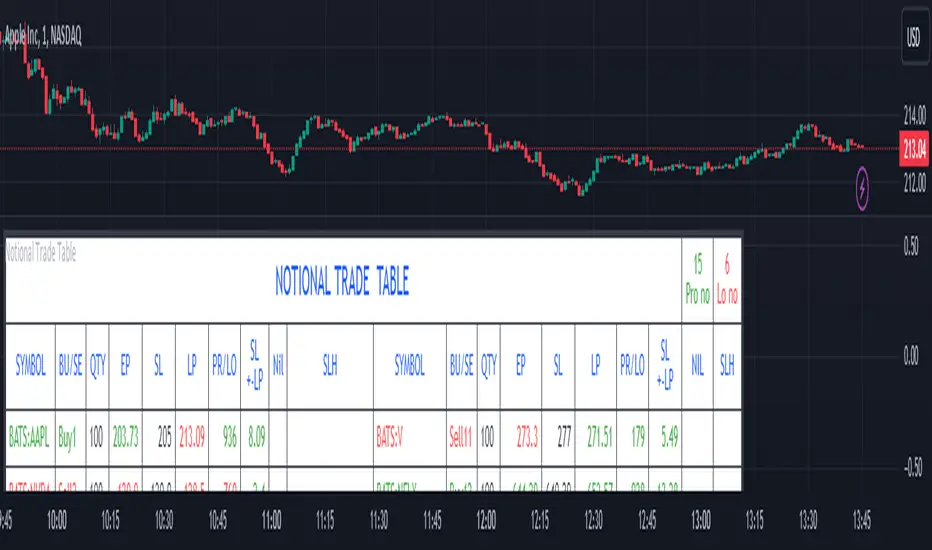
Wolf DCA CalculatorThe Wolf DCA Calculator is a powerful and flexible indicator tailored for traders employing the Dollar Cost Averaging (DCA) strategy. This tool is invaluable for planning and visualizing multiple entry points for both long and short positions. It also provides a comprehensive analysis of potential profit and loss based on user-defined parameters, including leverage.
Features
Entry Price: Define the initial entry price for your trade.
Total Lot Size: Specify the total number of lots you intend to trade.
Percentage Difference: Set the fixed percentage difference between each DCA point.
Long Position: Toggle to switch between long and short positions.
Stop Loss Price: Set the price level at which you plan to exit the trade to minimize losses.
Take Profit Price: Set the price level at which you plan to exit the trade to secure profits.
Leverage: Apply leverage to your trade, which multiplies the potential profit and loss.
Number of DCA Points: Specify the number of DCA points to strategically plan your entries.
How to Use
1. Add the Indicator to Your Chart:
Search for "Wolf DCA Calculator" in the TradingView public library and add it to your chart.
2. Configure Inputs:
Entry Price: Set your initial trade entry price.
Total Lot Size: Enter the total number of lots you plan to trade.
Percentage Difference: Adjust this to set the interval between each DCA point.
Long Position: Use this toggle to choose between a long or short position.
Stop Loss Price: Input the price level at which you plan to exit the trade to minimize losses.
Take Profit Price: Input the price level at which you plan to exit the trade to secure profits.
Leverage: Set the leverage you are using for the trade.
Number of DCA Points: Specify the number of DCA points to plan your entries.
3. Analyze the Chart:
The indicator plots the DCA points on the chart using a stepline style for clear visualization.
It calculates the average entry point and displays the potential profit and loss based on the specified leverage.
Labels are added for each DCA point, showing the entry price and the lots allocated.
Horizontal lines mark the Stop Loss and Take Profit levels, with corresponding labels showing potential loss and profit.
Benefits
Visual Planning: Easily visualize multiple entry points and understand how they affect your average entry price.
Risk Management: Clearly see your Stop Loss and Take Profit levels and their impact on your trade.
Customizable: Adapt the indicator to your specific strategy with a wide range of customizable parameters.

Nifty 50 5mint Strategy
The script defines a specific trading session based on user inputs. This session is specified by a time range (e.g., "1000-1510") and selected days of the week (e.g., Monday to Friday). This session definition is crucial for trading only during specific times.
Lookback and Breakout Conditions:
The script uses a lookback period and the highest high and lowest low values to determine potential breakout points. The lookback period is user-defined (default is 10 periods).
The script also uses Bollinger Bands (BB) to identify potential breakout conditions. Users can enable or disable BB crossover conditions. BB consists of an upper and lower band, with the basis.
Additionally, the script uses Dema (Double Exponential Moving Average) and VWAP (Volume Weighted Average Price) . Users can enable or disable this condition.
Buy and Sell Conditions:
Buy conditions are met when the close price exceeds the highest high within the specified lookback period, Bollinger Bands conditions are satisfied, Dema-VWAP conditions are met, and the script is within the defined trading session.
Sell conditions are met when the close price falls below the lowest low within the lookback period, Bollinger Bands conditions are satisfied, Dema-VWAP conditions are met, and the script is within the defined trading session.
When either condition is met, it triggers a "long" or "short" position entry.
Trailing Stop Loss (TSL):
Users can choose between fixed points ( SL by points ) or trailing stop (Profit Trail).
For fixed points, users specify the number of points for the stop loss. A fixed stop loss is set at a certain distance from the entry price if a position is opened.
For Profit Trail, users can enable or disable this feature. If enabled, the script uses a "trail factor" (lookback period) to determine when to adjust the stop loss.
If the price moves in the direction of the trade and reaches a certain level (determined by the trail factor), the stop loss is adjusted, trailing behind the price to lock in profits.
If the close price falls below a certain level (lowest low within the trail factor(lookback)), and a position is open, the "long" position is closed (strategy.close("long")).
If the close price exceeds a certain level (highest high within the specified trail factor(lookback)), and a position is open, the "short" position is closed (strategy.close("short")).
Positions are also closed if they are open outside of the defined trading session.
Background Color:
The script changes the background color of the chart to indicate buy (green) and sell (red) signals, making it visually clear when the strategy conditions are met.
In summary, this script implements a breakout trading strategy with various customizable conditions, including Bollinger Bands, Dema-VWAP crossovers, and session-specific rules. It also includes options for setting stop losses and trailing stop losses to manage risk and lock in profits. The "trail factor" helps adjust trailing stops dynamically based on recent price movements. Positions are closed under certain conditions to manage risk and ensure compliance with the defined trading session.
CE=Buy, CE_SL=stoploss_buy, tCsl=Trailing Stop_buy.
PE=sell, PE_SL= stoploss_sell, tpsl=Trailing Stop_sell.
Remember that trading involves inherent risks, and past performance is not indicative of future results. Exercise caution, manage risk diligently, and consider the advice of financial experts when using this script or any trading strategy.

Premium Volatility Breakout Strategy [wbburgin]This the premium version of my Volatility Breakout strategy, which improves significantly on the original strategy (publicly available on my profile). Improvements are below. A note about any of my premium scripts: I will continue updating and improving the original (public) versions.
This strategy is not built for any specific asset or timeframe, and has been backtested on crypto, equities, and forex from 1min - 1day. However, I recommend using it on more volatile assets because it is a breakout strategy.
********** My Background
I am an investor, trader, and entrepreneur with 10 years of cryptocurrency and equity trading experience and founder of two fintech startups. I am a graduate of a prestigious university in the United States and carry broad and inclusive interests in mathematical finance, computer science, machine learning / artificial intelligence, as well as other fields.
**********
Improvements over the original Volatility Breakout strategy include:
Faster Trend Detection → The Premium Volatility Breakout strategy will catch trends faster by using adaptive volatility-weighted bands instead of standard-width volatility-weighted bands. This can improve win size and has performed well in my backtesting.
ADX Filter → False breakouts dampen the overall results of the original script, as well as the % profitable,so an ADX filter has been programmed into the script (toggle on/off in settings). This filter will only enter long and short trades when the ADX is above a certain threshold. This is by default toggled off because in most instances it will not be necessary, but in certain environments may be useful.
MA Configuration → Different types of moving averages and weights are now configurable in the settings. These can change the responsiveness of the strategy.
External Trend Filter → I use this strategy as a filter for some of my low-timeframe algorithms. I have added an external trend filter (a plot only displayed in the data window) that will return “1” when the trend is long and “-1” when the trend is short (displayed on-chart with red and green trend curves).
Customizable Alert Messages In-Strategy → In the settings, there will be text boxes where you can create your own alerts. All you will need to do is create an alert in the alert panel on TradingView and leave the message box blank - if you fill out the alert boxes in the settings, these will automatically populate into your alerts. There are in total four different customizable alerts messages: Entry and Exit alerts for both Long and Short sides. If you disable stop loss and/or take profit, these alerts will also be disabled. Similarly, if you disable shorts, all short alerts will be disabled.
About stop losses: This strategy does not come with a stop loss because the moving average acts as a stop loss / trade exit for both long and short entries.
**********
Display
You can turn off highlighting or barcolor in the settings. Additionally, future updates may include a color scheme for users using a light-themed window.
**********
Configuring Alerts
In TradingView desktop, go to the ‘Alerts’ tab on the right panel. Click the “+” button to create a new alert. Select this strategy for the condition and one of the two options that includes alert() function calls. Name the alert what you wish and clear the default message, because your text in the settings will replace this message.
Now that the alert is configured, you can go to the settings of the strategy and fill in your chosen text for the specific alert condition. You will need to check “Long and Short” in the “Trade Direction” setting in order for any Short Alerts to become active.
**********
Disclaimer
Copyright by wbburgin.
The information contained in my Scripts/Indicators/Algorithms does not constitute financial advice or a solicitation to buy or sell any securities of any type. I will not accept liability for any loss or damage, including without limitation any loss of profit, which may arise directly or indirectly from the use of or reliance on such information.
All investments involve risk, and the past performance of a security, industry, sector, market, financial product, trading strategy, backtest, or individual's trading does not guarantee future results or returns. Investors are fully responsible for any investment decisions they make. Such decisions should be based solely on an evaluation of their financial circumstances, investment objectives, risk tolerance, and liquidity needs.

Myfractalrange TrendHello Traders!
This is our main addition to MFR TradingView account: Myfractalrange Trend.
Many Trend signals exist out there, each trader has at some point created its own.
At Myfractalrange, we have developed a proprietary formula based on Price, Volume and Volatility.
Before going into how subscribers can use the Trend script, let't have a look at the different data point provided one by one:
- Bullish Trend: If the price of the asset is above this value, the asset is considered to be Bullish Trend. Default colour is green
- Bearish Trend : If the price of the asset is below this value, the asset is considered to be Bearish Trend. Default colour is red
- Neutral Trend: If the price of the asset is between the value of the Bullish Trend and the value of the Bearish Trend, the asset is considered to be Neutral Trend. Default colour is yellow
How does the script work?
The provided script is proprietary, so while the specific calculations and data sources cannot be disclosed, here is a broad explanation on how it works:
- It will retrieve the relevant data from the asset, could be volume, close, high, low, etc.
- The script will then check the length for the trend calculation of this specific asset and compute the Trend line
- From the value of this Trend line, we will then generate the "bullish" and "bearish" values
- The script will then plot the Bullish and Bearish values on the chart, the area between both being set as the Neutral area
How to use trend when trading?
When trading, understanding and utilising trends can be valuable for making informed trading decisions. Here are some key ways to use trends in trading:
- Trend Identification: Identifying the presence and direction of a trend is crucial
- Trend Following: One common trading strategy is trend following, which involves trading in the direction of the prevailing trend. In an uptrend, traders may look for opportunities to buy or go long, while in a downtrend, they may seek opportunities to sell or go short. Trend following strategies assume that trends are more likely to continue than reverse, and traders aim to capitalise on sustained price movements
- Trend Reversals: Identifying potential trend reversals is another approach. Traders may look for signs that a trend is losing momentum or showing signs of exhaustion. Traders may then consider taking contrarian positions or closing existing trades.
- Timing Entries and Exits: Trends can help with timing entry and exit points. Traders often aim to enter trades at favourable points within a trend, such as during pullbacks in an uptrend or rallies in a downtrend. This allows them to potentially capture favourable risk-to-reward ratios
- Risk Management: Incorporating trend analysis into risk management is crucial. Traders can set stop-loss orders or trailing stops based on the trend, aiming to protect profits or limit losses if the trend reverses. Position sizing can also be adjusted based on the strength or duration of a trend, with larger positions taken in strong, well-established trends
- Multiple Time Frame Analysis: Examining trends across different time frames can provide a broader perspective. Traders can look for alignment in trends across shorter-term and longer-term charts to gain confidence in their trading decisions. For example, a Trend on a daily chart may align with a Trend on a hourly chart, reinforcing the potential trading opportunity
The Myfractalrange Trend signal can be used for all the possibilities listed above
Here is an example of a Bullish Trend pattern: BTFD set up
Here is an example of a Bearish Trend pattern: STFR set up
Why use Trend in combination with other indicators, such as Hurst and probable Range?
Using Trend in combination with Hurst exponent and probable Range can provide traders with a more comprehensive view of market dynamics and potential trading opportunities. Here's how the three concepts can complement each other:
- Trend Analysis: Trend analysis helps identify the prevailing direction of the market. It provides insights into whether the market is in an uptrend (Bullish), downtrend (Bearish), or sideways consolidation (Neutral). Trend analysis helps traders align their positions with the dominant market direction, increasing the likelihood of successful trades
- Hurst exponent: Hurst exponent is a measure of the persistence or mean reversion characteristics of a time series. It provides insights into the strength and sustainability of price movements. Hurst momentum analysis helps traders understand whether the market is exhibiting trending behaviour or mean-reverting behaviour. It can help identify potential reversals or continuation patterns in the price action.
- Probable Range: The Range refers to the expected price range within which an asset is likely to fluctuate, in our case the MFR Ranges (normal and longer-term). It helps traders set realistic profit targets and stop-loss levels. By combining the probable range with the trend and the Hurst Exponent, traders can better gauge the potential extent of price movements and make more informed decisions regarding entry and exit points.
How to use these tools together?
- Confirmation and Confluence: Combining Trend with Hurst & Range can provide confirmation and confluence signals. For instance, when the trend analysis indicates an uptrend, Hurst confirms strong positive momentum and Range confirms the upside potential, it provides a stronger signal for potential bullish trades
- Timing Entries and Exits: The combination of trend analysis, Hurst and Range can assist in timing entry and exit points. For example, when trend analysis indicates an uptrend, traders can look for bullish signals from Hurst value and low of the MFR Range to identify potential entry points during pullbacks or periods of consolidation. Conversely, in a downtrend, bearish signals from Hurst at the top of the MFR Range can guide traders in identifying potential short-selling opportunities during corrective rallies
- Risk Management: The integration of trend analysis with Hurst and Range can also aid in risk management. Traders can adjust their stop-loss levels and profit targets based on the strength of the trend, its strength and its Range. Tighter stop-loss levels can be set when both trend analysis, Hurst value and Range are aligned, indicating a higher probability of trend continuation. Conversely, wider stop-loss levels may be used when conflicting signals or weakening trends are observed
By combining Trend analysis, Hurst exponent and MFR probable Range, traders can gain a more comprehensive understanding of the market's behaviour and make more informed trading decisions.
It's important to note that while Trend is a useful tool, it should not be relied upon solely for making trading decisions. It's recommended to use it in conjunction with other technical analysis tools and consider other factors such as market conditions, risk management, and fundamental analysis. Remember that the momentum indicator is just one tool among many, and it's important to consider other factors such as volume, momentum, volatility, and overall market conditions when making trading decisions. Additionally, using stop-loss orders and proper risk management techniques is crucial to mitigate potential losses.
We hope that you will find these explanations useful, please contact us by private message for access.
Enjoy!
DISCLAIMER: No sharing, copying, reselling, modifying, or any other forms of use are authorised. This script is strictly for individual use and educational purposes only. This is not financial or investment advice. Investments are always made at your own risk and are based on your personal judgement. Myfractalrange is not responsible for any losses you may incur. Please invest wisely.