SPY to ES / MESSPY to ES is an indicator that converts SPY price targets to ES / MES futures price targets.
This indicator is helpful when you have price targets for SPY but trade ES or MES futures instead of SPY. It coverts the SPY price targets to ES / MES futures, and draws the SPY VWAP line on your ES / MES chart.
It supports the following lines
Bullish Above
Bearish Below
Long PT1
Long PT2
Long PT3
Short PT1
Short PT2
Short PT3
It also converts the SPY VWAP to it's current ES / MES value.
Note: The conversion do not work during pre and after market and the lines are only correct during market hours.
"spy" için komut dosyalarını ara

SPY VWAPSPY VWAP adds the VWAP indicator for SPY on your current chart, and shows the current SPY VWAP level converted to ES / MES value. It uses the last close price of SPY and ES / MES to calculate the level.
By adding the regular VWAP indicator to your MES / ES chart, you will clearly see the difference between the VWAP of SPY and the futures chart. This is helpful when trading as price may respect both VWAP levels.
This indicator should only be used on ES and MES futures chart. It will behave weirdly if used on different tickers and it is not supported in the current version.

SPY Targets to ESSPY Targets to ES is an indicator that draws lines on an ES / MES futures chart based of price targets given for SPY.
This is useful if given support/resistance levels or price targets for SPY and you like to see the converted value to ES / MES
This indicator also converts VWAP from SPY and adds it to the ES / MES chart.
Note that conversion is happening on price updates, and there are small conversion differences between ES and SPY as price moves. This is why lines are not perfectly straight. To counter this, smoothing is added which evens out the variations. Please give yourself up to 0.5-1 handle deviation from the line drawn on the futures chart.
Version 1.0 supports up to 30 price targets. More targets will be added in later version
SPY/VXX/TLT RSI crisscrossAre treasuries moving with VIX or are they correlated with equities?
Who's changing faster, VXX or SPY?
The indicator displays the RSI's of SPY, VXX and TLT so you can see how they are moving relative to each other.

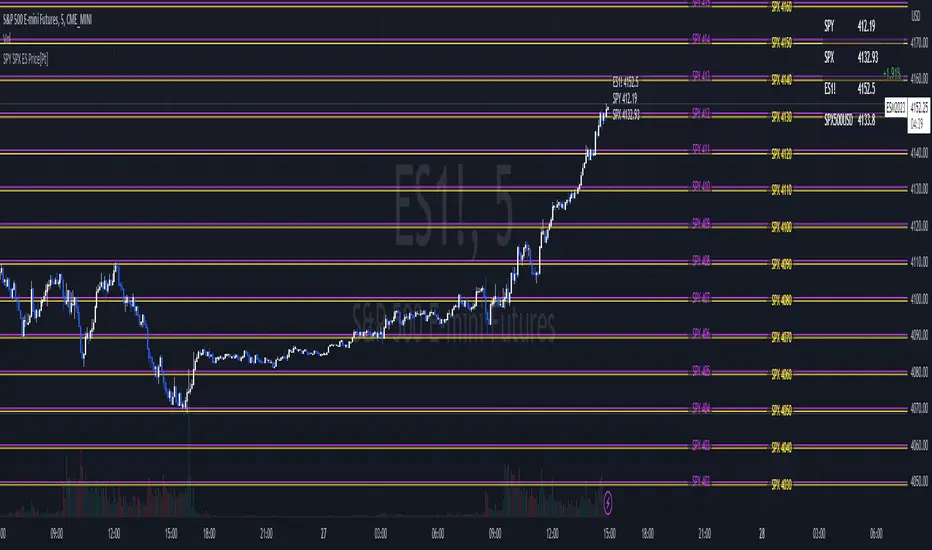
SPY SPX ES Price Converter+ [Pt]This is a + version of my original SPY SPX ES Price Converter indicator
Description
The SPY SPX ES Price Converter is a powerful and easy-to-use tool that allows traders to view corresponding price levels for linked instruments in real-time. This includes SPY, SPX, ES, and SPX500USD. Although these instruments often move in sync, differences in price movements, volume, and trading hours can create unique key levels and support/resistance areas for each. By mapping these levels on the same chart, traders can more easily spot trading opportunities and improve their chances of success.
Customizable features
- multiplier from the closest whole number price level
- line color
- line style
- label position / size
- # of levels to display
- toggle current price display table
|| ------------------------------------------------------------------------------------------------------------------------------------------------------------------------------------||
This script includes the following premium unique features.
SPY / SPX Gaps detector
A gap is an area on a chart where the price between two bars changes significantly without any trades happening between them. Such gaps often occur when a strong shift in sentiment happens during the hours when markets are usually closed. This indicator highlights these gaps on the chart and extends them further until they have been covered (i.e., when a newer bar has crossed that gap).
Overnight gaps from SPY or SPX can be mapped directly onto ES chart
VWAPs
VWAPs of these linked instruments can be mapped onto the chart. For example, ES VWAP mapped onto SPY chart, or vise versa. This allows for clear visualization of the price action near these VWAP levels.
Custom Cross Instruments Price Targets
Want to trade SPY options while watching ES chart or vise versa? You can setup to 8 price targets and see the corresponding converted price level. No need to switch between charts to try to figure out which price level corresponds to which.

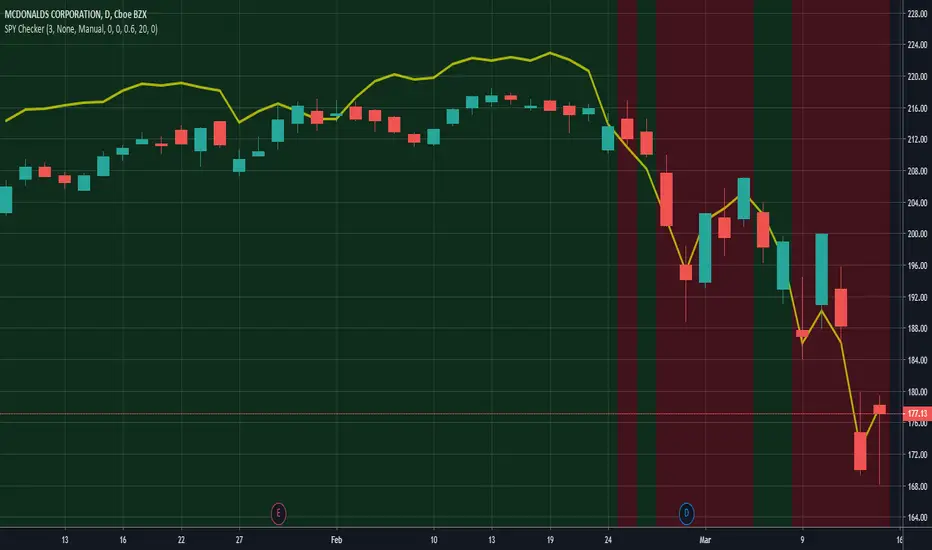
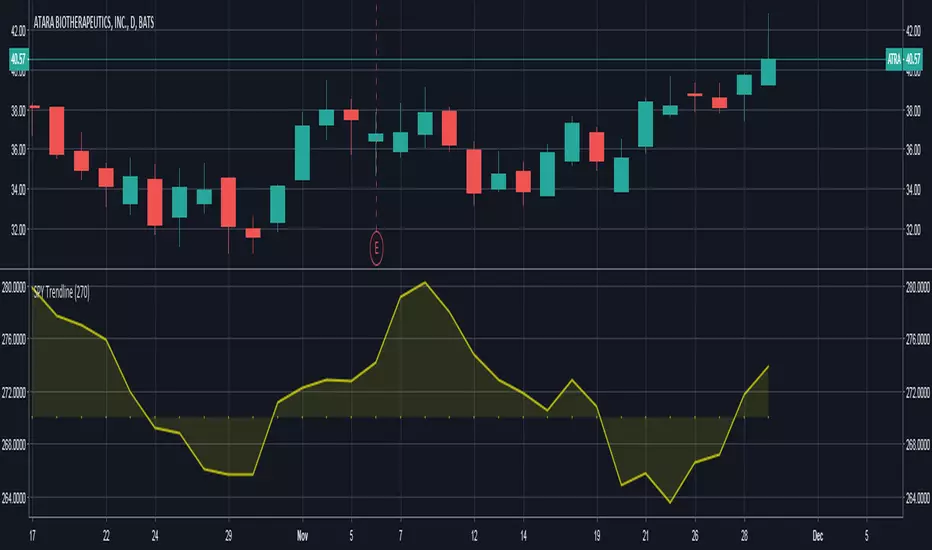
SPY CheckerUsing this indicator allows you to check the SPY for large gaps and candles (e.g. >1%) directly in your stock chart at first glance.
It is now also possible to use this indicator for all stock charts and to get the SPY indication on them visible without opening the SPY chart explicitly.
You are able to display the SPY trendline in the current chart as an overlay (yellow line) and configure the SPY trendline adjustment in the indicator settings. This will allow you to determine if the current stock chart is following the SPY or not. And you can also select a trading stop for several days in the indicator settings, which is visible through the green and red background color.
Hope this helps many of you to be more efficient in your SPY verification - have fun!
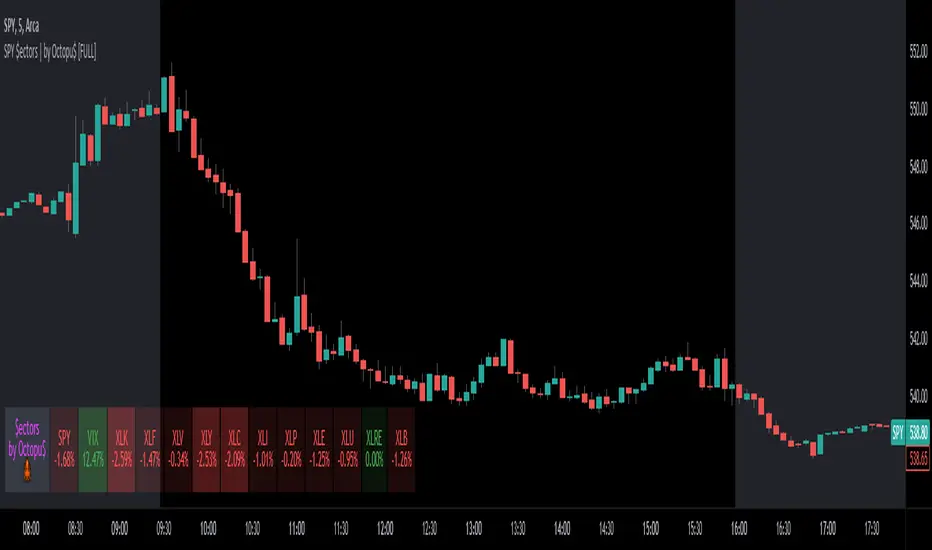
SPY $ectors | by Octopu$🏭 SPY Sectors with % Variance and Ticker Status| by Octopu$
What is SPY Sectors?
They are 11 SPY Sectors based on activity, which groups together their specific markets as well as the composition about the Tickers on the Sector.
For example: information technology, consumer discretionary, consumer staples, health care, financials, industrials, communication services, energy, , materials, utilities, real estate.
It is an useful resource for a trading system:
Can be used to follow up with tickers/sectors up and down moves and percentages as well as overall status and market sentiment as a whole.
AMEX:SPY
This indicator however should not be used as a standalone tool.
(The combination of factors relies on your own knowledge about Confluence Factors along with your Due Diligence)
This indicator is not an advice to buy or sell securities in any form.
ANY Ticker. ANY Timeframe.
Features:
• ALL Sector Track
• Up and Down Status
• Green and Red Colors
• % Indication
Options:
• Customization
• Location
Notes:
v1.0
Indicator release.
Changes and updates can come in the future for additional functionalities or per requests. Follow and Stay Tuned!
Did you like it? Please Support and Shoot me a message! I'd appreciate if you dropped by to say thanks! Thank you.
- Octopu$
🐙
SPY to ES or QQQ to NQThis indicator is used to automatically map SPY VWAP and 10 levels of your choice to ES / MES or map QQQ VWAP and 10 levels of your choice to NQ / MNQ . Since SPY and QQQ have the same price action as their futures iteration, there seems to a direct correlation between their levels and VWAP. This indicator is made to easily map the key levels of your choice to the appropriate futures instrument.

SPY/QQQ Customizable Price ConverterThis is a minimalist utility tool designed for Index traders (SPX, NDX, RUT). It allows you to monitor the price of a reference asset (like SPY, QQQ) directly on your main chart without cluttering your screen.
Key Features:
1.🖱️ Crosshair Sync for Historical Data (Highlight): Unlike simple info tables that only show the latest price, this script allows for historical inspection.
· How it works: Simply move your mouse crosshair over ANY historical candle on your chart.
· The script will instantly display the closing price of the reference asset (e.g., SPY) for that specific time in the Status Line (top-left) or the Data Window. Perfect for backtesting and reviewing price action.
2.🔄 Fully Customizable Ticker: Default is set to SPY, but you can change it to anything in the settings.
e.g.
· Trading NDX Change it to QQQ.
· Trading RUT Change it to IWM.
3.📊 Clean Real-Time Dashboard:
· A floating table displays the current real-time price of your reference asset.
· Color-coded text (Green/Red) indicates price movement.
· Fully customizable size, position, and colors to fit your layout.

SPY SPX ES Price Converter [Pt]A must have tool for SPY SPX ES traders~!!!
Description
The SPY SPX ES Price Converter is a powerful and easy-to-use tool that allows traders to view corresponding price levels for linked instruments in real-time. This includes SPY, SPX, ES, and SPX500USD. Although these instruments often move in sync, differences in price movements, volume, and trading hours can create unique key levels and support/resistance areas for each. By mapping these levels on the same chart, traders can more easily spot trading opportunities and improve their chances of success.
Customizable features
- multiplier from the closest whole number price level
- line color
- line style
- label position / size
- # of levels to display
- toggle current price display table
SPY Daily Gamma Levels [Manual Input With Alerts]Overview This indicator plots key options-based support and resistance levels (Gamma Exposure / GEX) directly on your chart. Unlike standard technical analysis, these levels (Call Wall, Gamma Flip, Put Support, and Volatility Trigger) represent where Market Makers are positioned, often acting as "magnets" or "repellents" for price action.
Important Note: TradingView Pine Script cannot currently access external options open interest data natively. Therefore, this is a Manual Input Indicator. You must update the four price levels in the settings each morning before the market opens.
Key Features:
4 Key Levels: Plots the Call Wall, Gamma Flip (Zero Gamma), Put Support, and Volatility Trigger.
Auto-Cleaning: Automatically deletes yesterday's lines to keep your chart clean; lines only show for the current session.
Alerts Included: Built-in alert conditions allow you to set notifications when price crosses the Gamma Flip or breaks the Vol Trigger.
Customization: Fully customizable colors and line styles.
Best Practices:
Timeframe: Works best on 15-minute charts for trend identification and 5-minute charts for entry execution.
Strategy:
Above Gamma Flip: Market generally stabilizes; dealers buy dips.
Below Gamma Flip: Volatility expands; dealers sell rips.
Below Vol Trigger: "Danger Zone" – expect accelerated selling pressure.
How to Get the Data (The AI Workflow)
Since these numbers change daily, I use Google Gemini to fetch the data and remind me every morning. Here is how you can set up the same automated workflow:
1. The Prompt You can ask Gemini (or your preferred AI) the following prompt manually each morning:
"Find the daily SPY Call Wall, Gamma Flip, Put Support, and Vol Trigger levels for today to input into my TradingView indicator."
2. Automating the Routine I have set up a scheduled daily reminder with Gemini. To do this yourself, simply ask Gemini:
"Can you schedule a daily task to search for these SPY Gamma levels and send them to me every morning at 8:00 AM?"
3. Updating the Chart
Receive the notification from the AI.
Open the Indicator Settings in TradingView.
Type in the new numbers.
The chart updates instantly.
Disclaimer: This tool is for educational purposes only. Gamma levels are estimates based on Open Interest and Dealer Gamma exposure models. Always manage your risk.

SPY Expected Move by VIXThis indicator shows 1 and 2 standard deviation price move from the VWAP based on VIX. Implied Volatility (IV) is being used extensively in the Option world to project the Expected Move for the underlying instrument. VIX is used as a proxy for SPY's IV for 30 days.
This indicator is meaningful only for SPY but can be used in any other instrument which has a strong correlation to SPY.

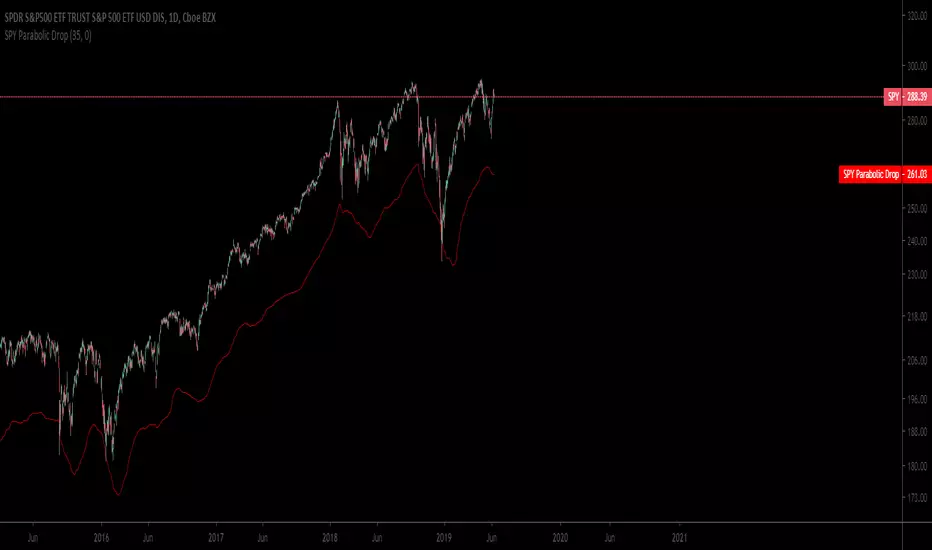
SPY BackgroundColors background green if AMEX:SPY 1 day performance is positive
Colors background red if AMEX:SPY 1 day performance is negative

SPY BackgroundColors background green if AMEX:SPY 1 day performance is positive
Colors background red if AMEX:SPY 1 day performance is negative
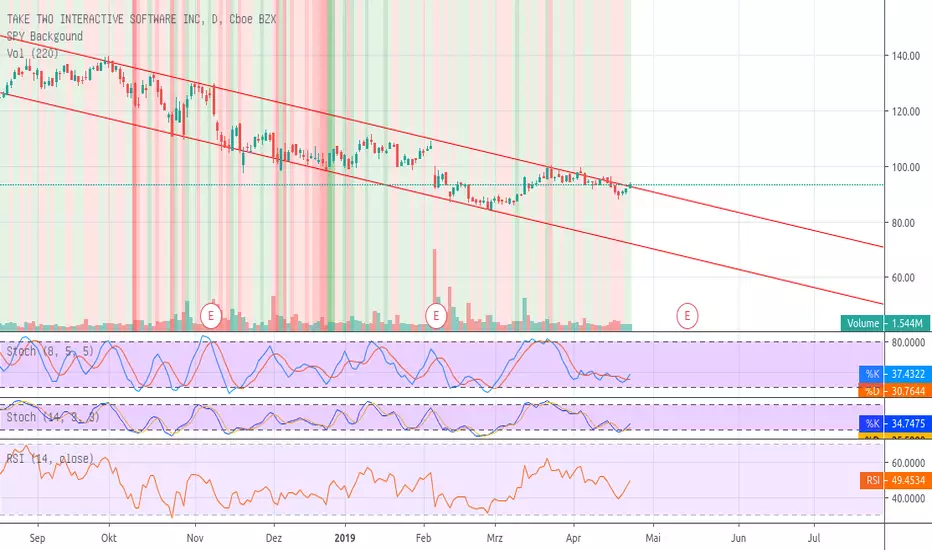
SPY BackgoundColors background green if AMEX:SPY 1 day performance is positive
Colors background red if AMEX:SPY 1 day performance is negative

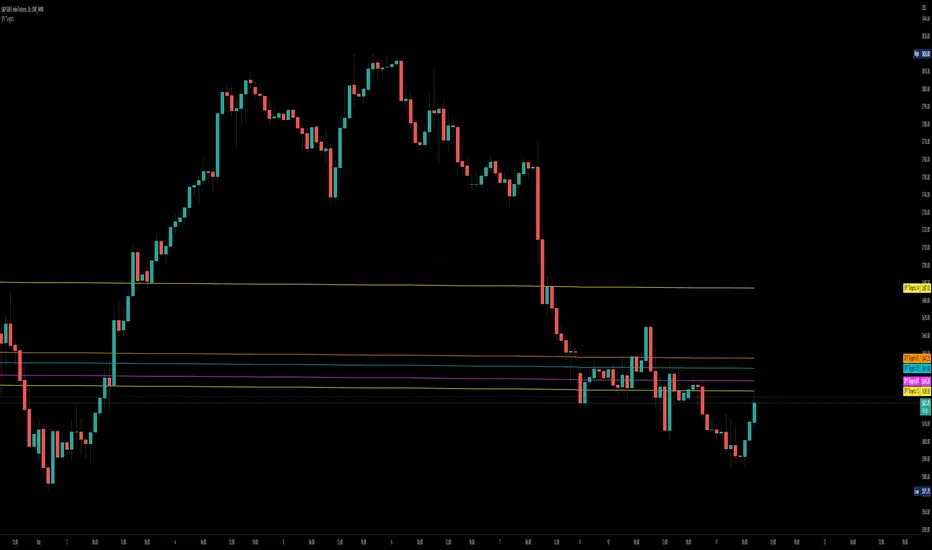
SPY TrendlineThis indicator helps to see the SPY trendline in all stock charts without opening the SPY chart explicitly.
Hope this helps many of you to be more efficient in your chart analysis - have fun!
SPY Sub-Sector Daily Money Flow TableThis calculates the dollar volume per candlestick (2nd row) and cumulative (3rd row) of the entire trading day for each subsector of the SPY.
The 'Total' column is the total of all the subsectors combined. It is calculated separately from SPY volume.
The money flow is calculated with (open+close)/2 which means different timeframes yield different results and won't be especially accurate day-by-day. This is useful to quickly see rotation and possible divergences.
Enjoy!

SPY RelativeShows an instrument's sentiment in a day (or week) compared to the market (SPY default). The Red line shows bearish sentiment compared to the market and the green is bullish. Technically this works like a proxy for Alpha/Beta factor.

SPY vs TQQQ Candle Divergence# SPY vs TQQQ Candle Divergence Indicator
## Description
This indicator monitors and visualizes candlestick divergences between SPY (S&P 500 ETF) and TQQQ (ProShares UltraPro QQQ ETF). It identifies situations where one security is showing bullish movement (green candle) while the other is showing bearish movement (red candle) within the same time period.
## Features
- Real-time divergence detection between SPY and TQQQ
- Visual markers with distinct colors for each type of divergence
- Built-in alert conditions for automated monitoring
- Works on any timeframe
- Overlay indicator that plots directly on the chart
## Divergence Types
### SPY Bullish / TQQQ Bearish
- Condition: SPY forms a green candle while TQQQ forms a red candle
- Marker: Green label with "SPY" text above the bar
- Alert Message: "SPY is green while TQQQ is red"
### SPY Bearish / TQQQ Bullish
- Condition: SPY forms a red candle while TQQQ forms a green candle
- Marker: Red label with "SPY" text below the bar
- Alert Message: "TQQQ is green while SPY is red"
### TQQQ Bullish / SPY Bearish
- Visualization: Blue label with "TQQQ" text above the bar
- Indicates TQQQ strength relative to SPY
### TQQQ Bearish / SPY Bullish
- Visualization: Purple label with "TQQQ" text below the bar
- Indicates TQQQ weakness relative to SPY
## Technical Implementation
- Built on Pine Script version 5
- Uses `request.security()` to fetch data for both symbols
- Implements simple candle color detection (1 for green, -1 for red, 0 for doji)
- Plots markers using `plotshape()` with different colors and positions
## Visual Elements
- Label Colors:
- SPY Bullish: Green
- SPY Bearish: Red
- TQQQ Bullish: Blue
- TQQQ Bearish: Purple
- All labels use white text for visibility
- Small label size for clean chart appearance
- Labels positioned above/below bars for clear identification
## Alert System
Two built-in alert conditions:
1. "SPY Green TQQQ Red Divergence"
2. "TQQQ Green SPY Red Divergence"
## Usage
1. Add the indicator to any chart (preferably SPY or TQQQ)
2. Look for colored labels indicating divergences
3. Set up alerts for automated monitoring
4. Use divergences as potential signals for:
- Market sector rotation
- Relative strength analysis
- Trading opportunities
- Risk management
## Notes
- Best used in conjunction with other technical indicators
- Consider overall market conditions when interpreting signals
- Useful for identifying potential market reversals or continuations
- Can help in timing entries and exits
## Limitations
- Requires data feed for both SPY and TQQQ
- Only considers candle color, not candle size or volume
- May generate frequent signals in choppy markets
## Disclaimer
This indicator is for informational purposes only. Always use proper risk management and consider multiple factors when making trading decisions.

QQQ and SPY Price Levels [MW]Introduction:
Don’t let SPY and QQQ resistance levels hurt your futures trading anymore. The QQQ and SPY Price Levels indicator automagically provides easily accessible QQQ price levels for NASDAQ-related charts such as QQQ, /NQ and /MNQ futures, and leveraged ETFs such as TQQQ and SQQQ as well as for SPY price levels for S&P 500-related charts such as SPY, /ES and /MES futures, SPX, and leveraged ETFs such as UPRO and SPXU. If you’ve ever traded futures, or anything QQQ- or SPY-related and wanted to know at what price would the corresponding asset reach a key whole number level of QQQ or SPY, like 400, 440, 445, or even 447.50, this tool is for you. Key 10x, 5x, and even 2.5x multiples of QQQ and SPY can act as support or resistance for other related-assets. Until now, there hasn’t been an indicator that can serve as an easy visual cue to know exactly when that is about to happen across assets.
This indicator is a fork of the original SPY Price Levels indicator, which only considered SPY-related assets.
Settings:
QQQ/SPY 2.5x: Show closest levels above and below that are multiples of 2.5 on QQQ
QQQ/SPY 5x: Show closest levels above and below that are multiples of 5 on QQQ
QQQ/SPY 10x: Show closest levels above and below that are multiples of 10 on QQQ
Show QQQ/SPY Price Label: Show the current QQQ/SPY price
Extend lines to the left: Extend label lines for each price level to the beginning of the chart
Calculations:
This indicator defines the ratio between the price of QQQ/SPY and another NASDAQ/S&P-related asset and uses that multiplier once the user-defined price increments are defined. For example, if /MNQ is at 19000 and QQQ is at 465, then the ratio would be 40.8.
The incremental QQQ levels that are above and below the QQQ price are calculated using the following equations:
qqqLevelUp = _multiplier * math.ceil(_qqqClose / _multiplier)
qqqLevelDown = _multiplier * math.floor(_qqqClose / _multiplier)
The conversion ratio is then multiplied by that amount to get the final estimated corresponding price using the calculation:
levelUp := _conversion * qqqLevelUp
levelDown := _conversion * qqqLevelDown
For leveraged assets, the conversion must be used on the difference between the current QQQ price and the incremental upper and lower levels.
For example, the calculation for the next level up looks like the following:
levelUpDelta := math.abs(_qqqClose - qqqLevelUp)
levelUp := close + _conversion * (levelUpDelta * _leverage)
This logic is identical for SPY-related assets.
How to Use:
The QQQ and SPY Price Levels indicator aims to be as unobtrusive as possible. The default view shows 3 labels and 2 lines that are all aligned to the right of the main chart, so that it interferes as little as possible with any other indicators. It can be added to any /NQ or /MNQ futures chart, SQQQ, TQQQ, and, of course, QQQ as well as any /ES /MES futures chart, SPXU, UPRO, SPX, and of course SPY. The most immediate price levels for each multiplier appears above and below the current price along with the price of QQQ/SPY.
For example, MNQU2024 is currently at 19594. By looking at the indicator the next QQQ increment below is at 475, or 19556 on the MNQU2024 chart. This potential support is marked with a green label that shows both prices. The next increment above is at QQQ 477.50, or 19659 on the MESU2024 chart. And the QQQ price itself, is also shown (and can be removed) at 475.92.
QQQ and SPY price increments of 2.5, 5, and 10 tend to consistently act at the very least as emotional support and resistance levels. Weak, or weakening volume and/or momentum when these levels are hit can trigger a strong rejection, and can sometimes precipitate lengthy consolidation periods at those levels. Watching an NASDAQ- and S&P 500-related asset come to a halt, fall off a cliff, or react in some other unintuitive way could very well be the result of a QQQ/SPY level being reached. Even though many of us know that this relationship exists, it’s easy to forget. So, this indicator helps to ensure that its users keep that relationship front and center.
By extending the lines into the past on QQQ/SPY and their related assets, you can see what reactions happened at these key levels.
Other Usage Notes and Limitations:
The calculations used only provide an estimated relationship or a close approximation, and are not exact.
It's important for traders to be aware of the limitations of any indicator and to use them as part of a broader, well-rounded trading strategy that includes risk management, fundamental analysis, and other tools that can help with reducing false signals, determining trend direction, and providing additional confirmation for a trade decision. Diversifying strategies and not relying solely on one type of indicator or analysis can help mitigate some of these risks.

TwinPulse Q Lead SPY x QQQ Intermarket Pulse 1HTwinPulse Q Lead is a concise one hour indicator for SPY and QQQ that converts three sources of market information into a single pulse line, a mode readout with BUY SELL WAIT, and compact alerts. It blends intermarket leadership between QQQ and SPY, intraday flow from the slope of session VWAP, and where the current price sits inside the regular trading hours range. The three components are normalized, fused, compressed to a stable range, and smoothed for clear thresholds. The aim is a readable intraday regime signal that helps you decide when to participate and when to stand aside.
The script is built with Pine v6, uses request security with lookahead off, and does not repaint. It is an indicator, not a strategy. It does not contain any solicitation, links, or outside references. The description is self contained and explains both logic and use so that any trader can understand the design without reading code.
What makes this original and useful
Intermarket leadership is measured directly from QQQ and SPY on your working timeframe using a Z score of the return spread. When growth is leading value heavy large caps, leadership turns positive. When it lags, leadership turns negative. This gives a real time read of the Nasdaq versus S and P tug of war that most day traders watch informally.
Intraday flow is taken from the slope of the session VWAP. A linear regression of VWAP over a short window captures whether value is rising or falling inside the day. Dividing by ATR normalizes slope by typical movement so that the signal is comparable across weeks.
Session position places price inside the current regular hours high to low. It answers whether the day is trading in the top half, the bottom half, or the middle. This is a simple but powerful context filter for breakouts and fades.
The three components are fused into one pulse, compressed with either hyperbolic tangent or softsign to keep values bounded, and then smoothed by a short EMA. This yields a stable range with a zero line so the eye can read shifts quickly.
The panel shows a human readable mode with reasons and a strength score. Traders who do not want to read lines can rely on a simple state and a compact justification that explains why the state is set.
This is not a mashup that simply overlays unrelated indicators. Each component was chosen to answer a distinct question that is common to SPY and QQQ intraday decision making. Leadership answers who is in charge, flow answers whether value inside the session is building or leaking, and position answers if price is pressing the extremes or circling the middle. The pulse ties the three together and prevents any single component from dominating.
How the calculations work
Leadership. Compute a short rate of change for SPY and QQQ. Subtract SPY from QQQ to get spread returns, then compute a rolling Z score over a longer window. Positive values mean QQQ is leading. Negative values mean SPY is leading.
Flow. Compute session VWAP on the active symbol. Regress VWAP over a short window to obtain a slope estimate. Divide by ATR to scale slope by current volatility so that a small rise on a quiet day is not treated the same as a small rise on a wild day.
Position. Track the highest high and lowest low since the start of regular hours. Place the current close inside that range on a zero to one scale, then recenter to a minus one to plus one scale. Positive means the top half of the day, negative means the bottom half.
Fusion. Multiply each component by a weight so users can emphasize or de emphasize leadership, flow, or position. Sum to a raw pulse.
Compression. Pass the raw pulse through a bounded function. Hyperbolic tangent is smooth and has natural saturation near the extremes. Softsign is faster and behaves like a smoother version of sign near zero. Compression avoids unbounded excursions and makes thresholds meaningful across days.
Smoothing. Apply a short EMA to the compressed pulse to reduce noise. This creates the main line called TwinPulse in the plot.
Thresholds. You can use static symmetric levels or adaptive levels. The adaptive option computes a mean and a standard deviation of the smoothed pulse over a user window, then sets upper and lower thresholds as mean plus or minus sigma times standard deviation. This allows thresholds to adjust across regimes. Static levels are still available for traders who want repeatable levels.
Events and mode. A long event fires when the smoothed pulse crosses the upper threshold with positive flow and any optional filters agree. A short event fires on the symmetric condition. The mode reads the current state rather than fire and forget. It returns BUY when the smoothed pulse is above the upper threshold with positive flow, SELL when the smoothed pulse is below the lower threshold with negative flow, otherwise WAIT. A cooldown controls how often events can fire so alerts do not spam during choppy periods.
Inputs and default values
The script ships with defaults chosen for SPY and QQQ on one hour charts.
Symbols. SPY and QQQ by default. You can switch to any pair. Many users may test IWM versus SPY for small cap reads.
Regular hours selector. On by default. This restricts the position factor to New York regular hours. Turn it off if you prefer full session behavior.
ROC length is three bars. Z score length is fifty bars. VWAP slope window is ten bars. ATR length is fourteen bars. Pulse smoothing length is three bars.
Compression mode. Choose hyperbolic tangent or softsign. Hyperbolic tangent is default.
Weights. Leadership and flow are one by default. Position is set to zero point seven to give a modest influence to where price sits inside the day.
Thresholds. Adaptive thresholds are on by default with a lookback of one hundred bars and a sigma width of zero point eight. Static levels at plus or minus zero point six are ready if you disable adaptive mode.
Filters. ADX filter is off by default. If you enable it, the script requires ADX above a user minimum before it will signal. Higher time frame confirmation is off by default. When enabled it compares the smoothed pulse on the confirm timeframe to zero and requires alignment for longs or shorts.
Cooldown. Three bars by default so that alerts do not trigger too frequently.
UI. Bar coloring is on by default. The panel is on by default and sits at the top right.
All request security calls use lookahead off and will not request future data. All persistent state variables are assigned in a way that prevents repainting. The indicator does not use non standard chart types in its logic.
How to use the indicator
Load a one hour chart of SPY or QQQ. Keep a clean chart so that the script output is easy to read.
Turn on regular hours if you want the session position to reflect the cash session. This is recommended for SPY and QQQ.
Watch the panel. Mode reads BUY or SELL or WAIT. The strength value is a simple vote based score that ranges from zero to one hundred. It counts leadership, flow, ADX if enabled, and higher time frame confirmation if enabled. You can use strength to filter weak states.
Consider action only when mode is BUY or SELL and the signal has not just fired on the last bar. The triangles mark where an event fired. Alerts use the same logic as the events. WAIT means stand aside.
To slow the system, enable ADX and set a higher minimum or enable higher time frame confirmation. To speed it up, disable the filters, disable adaptive thresholds, or tighten the sigma width.
When publishing, use a clean chart with only this indicator. Show the symbol and timeframe clearly and make sure the plot legend is visible. If you add drawings on the chart, only include ones that help readers understand the output.
Publication notes and compliance
This description is written in English. The title uses ASCII and only uses capital letters for common abbreviations. The script is original and explains how and why the components work together. There are no links or promotional material. The script does not claim performance. It does not use lookahead. The panel and alerts exist to help a human read and act with discipline. The indicator can be published as open source or as protected. If you choose protected, the description still allows readers to understand how the logic works without access to the code.
If you later convert the logic into a strategy for publication, use realistic commission and slippage, risk no more than a small share of equity per trade, and choose a dataset that yields a large enough sample. Explain any deviations from these default recommendations in your strategy description. Do not publish results from non standard chart types since they can mislead readers on signal timing.
Limitations and risks
Intermarket leadership is a relative measure. There are hours when both SPY and QQQ fall while leadership remains positive. Treat leadership as a context, not a stand alone trigger.
VWAP slope is a path measure inside the session. It can flip several times on a choppy day. That is why the script uses a short smoothing and an optional cooldown. Use ADX or higher time frame confirmation to avoid the worst chop.
Session position assumes a meaningful regular hours range. On half days or around openings with gaps the position factor can be less informative. If this bothers you, reduce the weight of position or turn it off.
Compression and smoothing introduce lag by design. The goal is stability and clarity. If you want earlier but noisier signals, reduce smoothing and weights, and use static thresholds.
No indicator guarantees future results. TwinPulse Q Lead is a decision aid. It should be combined with your risk rules, position size policy, and a clear exit plan. Past behavior is not a promise for the future.
Frequently asked questions
What symbols are supported. Any symbol can be used as the chart symbol. Leadership uses the two user symbols which default to SPY and QQQ. Many traders may try IWM versus SPY or DIA versus SPY.
Can I change the timeframe. Yes, but the design target is one hour. On very short timeframes the VWAP slope becomes very sensitive and you should consider stronger filters.
Does the script repaint. No. It uses request security with lookahead off and the panel updates on the last bar only. Events are based on bar close conditions unless you attach alerts on any alert function call which will still respect the logic without looking into the future.
How are the strength numbers built. The strength score is the share of aligned votes across leadership, flow, ADX if enabled, and higher time frame confirmation if enabled. A value near one hundred means many filters agree. A value near fifty means partial alignment. It is not a probability or an accuracy number.
Can I use non standard chart types. You can view the indicator on them but do not publish signals from non standard chart types because that can mislead readers about timing. Use classic candles or bars when you publish and when you test.
Why do I sometimes see BUY but the price is not moving. A BUY mode requires pulse above the upper threshold and positive flow. It does not require higher highs immediately. Treat BUY as a permission to look for entries using your own execution rules.

SPY Levels on ES# SPY Levels on ES - Professional Support & Resistance Indicator
## 🎯 Overview
Transform your S&P 500 futures trading with precision-engineered SPY support and resistance levels. This professional-grade indicator displays critical SPY price levels directly on your ES (E-mini S&P 500) and MES (Micro E-mini S&P 500) charts, providing institutional-quality analysis for retail traders.
## ⚡ Key Features
### 📊 Dual-Level System
- Whole Number Levels : 10 closest round SPY levels around current price
- Half Levels : 0.5 increment levels for granular analysis
- Smart Scaling : Automatically converts SPY levels to ES/MES prices
### 🎨 Professional Visualization
- Clean Design : Minimalist lines that don't clutter your chart
- Customizable Colors : Choose your own colors for whole and half levels
- Historical Extension : Lines extend across your entire chart for context
- Dynamic Labels : Real-time SPY price display with clear level identification
### ⚙️ Intelligent Features
- Auto-Detection : Works seamlessly on SPY, ES, and MES charts
- Real-Time Updates : Levels adjust automatically as SPY price moves
- Performance Optimized : Efficient code that won't slow down your charts
- Flexible Settings : Toggle levels on/off based on your trading style
## 🎯 Perfect For
- ES Futures Traders seeking SPY correlation levels
- MES Micro Futures traders needing precise entry/exit points
- SPY Options Traders analyzing support/resistance zones
- Day Traders requiring quick visual reference points
- Swing Traders identifying key technical levels
## 📈 How It Works
The indicator fetches real-time SPY prices and calculates the 10 closest whole number levels (e.g., 580, 581, 582) plus half levels (580.5, 581.5, 582.5) around the current price. When applied to ES or MES charts, it automatically scales these levels to match futures pricing, giving you precise SPY-correlated support and resistance zones.
## 🔧 Customization Options
- SPY Price Label : Toggle on/off
- Whole Number Levels : Show/hide with custom colors
- Half Levels : Show/hide with custom colors and transparency
- Visual Styling : Personalize colors to match your chart theme
## 💡 Trading Applications
- Support/Resistance : Identify key psychological levels
- Entry/Exit Points : Use levels for precise trade execution
- Risk Management : Set stops and targets at significant levels
- Market Structure : Understand institutional price zones
- Confluence Analysis : Combine with other technical indicators
