zibi fib1So lets make thing smarter:)
ZIBI is volume indicator that i created which calculate prive volume per candle
it set buy point when it cross low fib =green
sell point when it cross down high fib
have fun
alerts inside
Komut dosyalarını "smart" için ara

Kaufman Efficiency RateKaufman Efficiency Rate
The Efficiency Ratio (ER) was first presented by Perry Kaufman in his 1995 book ‘Smarter Trading‘.
It is calculated by dividing the price change over a period by the absolute sum of the price movements that occurred to achieve that change.
The resulting ratio ranges between 0 and 1 with higher values representing a more efficient or trending market.
The ER is actually very similar to the Chande Momentum Oscillator (CMO) presented by Tushar S. Chande in ‘The New Technical Trader‘ (1994).
The difference is that the CMO takes into account for market direction but if you take the absolute CMO and divide by 100 you you get the Efficiency Ratio.
A measure of a trends strength can be very useful as some strategies work best on a trending market and some in a range bound market.
Likewise different moving average lengths will perform better depending on the market type at that time.

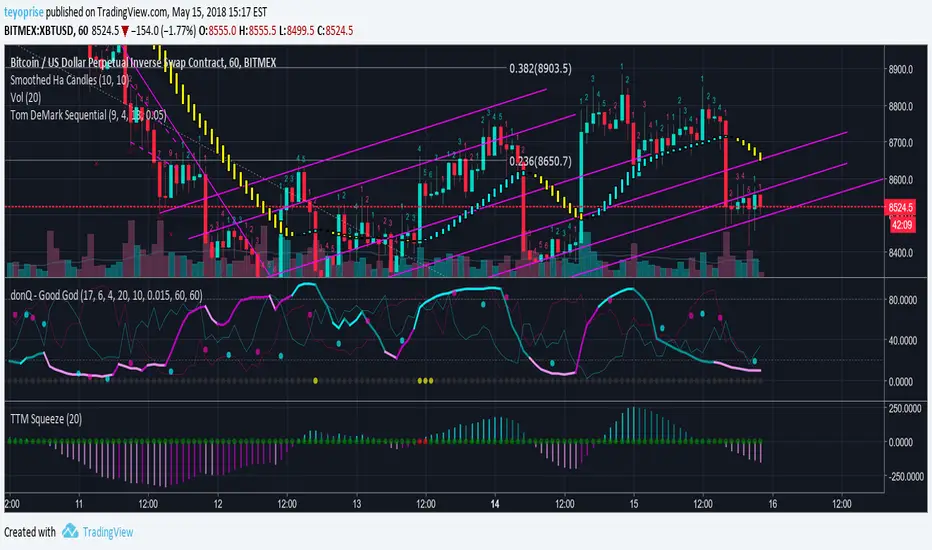
donQ - Good God
Godmode + TTM -4.50% Squeeze + Shorts and Longs (thin red and blue lines).
coming soon - distance to VWAP
- smarter buy sell logic with connection to shorts / longs / vwap / ttm -4.50%
have fun
donQ

donQ - Good GodGodmode + TTM Squeeze + Shorts and Longs (thin red and blue lines).
coming soon - distance to VWAP
- smarter buy sell logic with connection to shorts / longs / vwap / ttm
have fun
donQ
Gambit Trading Suite v3.0Gambit Trading Suite v3.0
New features:
* Better trading algorithms
* Every feature and candle color can now be fully customized
* Better RSI Divergence logic
* Built in trading alerts
* Cleaner code
& more!
The Gambit Trading Suite was designed to combine all of the best signals into one single indicator. This suite should tell you everything you need to know about price.
Try this indicator for FREE! Leave a comment below and we will give you access to the trading suite generally within 72 hours.
Quick Setup (after you have been granted access):
1. Navigate to any chart and right click on the background. Click on "Insert Indicator."
2. Click on "Invite-Only Scripts" and you will see the Gambit Trading Suite as an option. Click it to add it to your chart.
3. By default, the majority of the indicators are disabled. Click the gear icon to the right of the indicator name at the top left of your chart. It should be the second button after "Gambit Trading Suite v3.0."
4. After opening the config menu, you can enable whichever indicators you want.
(For the complete step-by-step setup guide & full indicator documentation, please send me a message)
Confirmed Reversals
These offer the best locations to buy/long with the least risk. The majority of the time they turn out to be the reversals from bearish price action. If the trade does not turn profitable immediately, the algorithm is designed to fail as soon as possible so you can close at breakeven or a very small loss. The profitable trades can be left to run. Over time and when stacked with other indicators, these entries can increase the profitability of your trades and reduce your losing ones. Confirmed Reversals on the chart show up as the letter C with an arrow upwards. They are blue in the example above.
Colored Candles
Helps you to see the strength of the trend in real-time, and helps you to make smarter trade entries and exits.
Bullish Breakout = Blue
Bullish Unconfirmed Reversal = Yellow
Bullish Trend (Weak) = Pistachio Green
Bullish Trend (Strong) = Lime Green
Bearish Breakdown = Dark Purple
Bearish Pivot (1 to 3 candles bearish bias) = Orange, shown with a downward arrow and the letter B on the chart. The signal fails if a future candle closes above the orange one.
Bearish Trend = Red
Stalled After Price Breakout = Olive Green
Neutral Pivot , Minor Bullish Bias = Bright Purple
Neutral / No Trend = Gray
Gambit Daily & Weekly Levels
These provide dynamically-updated daily and weekly support and resistance levels. It is very common to see price retest these levels, so it offers a decent place to set alarms or bids.
RSI Divergences
The Gambit Trading Suite posts green flags for bullish RSI divs, and red flags for bearish RSI divs. Both hidden and regular divergences are marked.
Gambit StochRSI Grid (This indicator is listed separately. Please visit my profile page to get it)
This indicator highlights StochRSI overbought/oversold values for 1D, 2H, 1H, & 30m timeframes (From top to bottom. Timeframes can be changed in settings).
If the lower three timeframes are all overbought/oversold, a direction arrow will show, suggesting the direction of the trend. By default, there are four available timeframes tracked, three of which are low timeframe and one is for a quick-glance at the 1D. Only the lower three are utilized for printing arrow signals.
Public indicators:
For your convenience, we have bundled the most commonly requested indicators inside the suite. They include:
Ichimoku Cloud (Optimized for the cryptocurrency markets by default but it can be optimized to any settings)
EMA #1 (Shown as purple and pink crosses in the example above)
EMA #2 (Shown as pink crosses)
Bollinger Bands
Pivot Points
For a detailed step-by-step setup guide & full documentation on the indicators, feel free to message me.

Candle CountingI was talking with one of the biggest hedge fund traders in the world the other day. He goes to me, "Brian, why don't you come and work for us, since you're a better trader than anyone at our firm?" Well I said I would, but there's no one there with an iq as high as mine, so I'd have no one to talk to when I'm eatin my sammiches. Man I'm a savant mate, I'm a f***ing CANDLE COUNTER. I tell people all the time, know your market. And that's your tip of the day really, I mean nobody out there knows Yen better than me. I mean the other day I was 70,000 in the hole, but I didn't get out, I was balls deep making a cheese sammich on the George Forman. Now I mean you can try and do what I'm doing, but understand something, I am 100% smarter than you, and your machines. In the industry, they call me Mr. Yen, I touch the sun, and my d*ck, regularly.

Gambit Trading Suite v2.49Gambit Trading Suite v2.49
The Gambit Trading Suite was designed to combine all of the best signals into one single indicator. This suite should tell you everything you need to know about price.
Try this indicator for FREE! Leave a comment below and we will give you access to the trading suite generally within 24 hours.
Quick Setup (after you have been granted access):
1. Navigate to any chart and right click on the background. Click on "Insert Indicator."
2. Click on "Invite-Only Scripts" and you will see the Gambit Trading Suite as an option. Click it to add it to your chart.
3. By default, the majority of the indicators are disabled. Click the gear icon to the right of the indicator name at the top left of your chart. It should be the second button after "Gambit Trading Suite v2.49."
4. After opening the config menu, you can enable whichever indicators you want.
(For the complete step-by-step setup guide & full indicator documentation, please send me a message)
Private indicators:
Confirmed Reversals
These offer the best locations to buy/long with the least risk. The majority of the time they turn out to be the reversals from bearish price action. If the trade does not turn profitable immediately, the algorithm is designed to fail as soon as possible so you can close at breakeven or a very small loss. The profitable trades can be left to run. Over time and when stacked with other indicators, these entries can increase the profitability of your trades and reduce your losing ones.
Colored Candles
Helps you to see the strength of the trend in real-time, and helps you to make smarter trade entries and exits.
Bullish Breakout = Blue
Bullish Unconfirmed Reversal = Yellow
Bullish Trend (Weak) = Pistachio Green
Bullish Trend (Strong) = Lime Green
Bearish Breakdown = Dark Purple
Bearish Pivot (1 to 3 candles bearish bias) = Orange
Bearish Trend = Red
Stalled After Price Breakout = Olive Green
Neutral Pivot, Minor Bullish Bias = Bright Purple
Neutral / No Trend = Gray
Daily & Weekly S&R Levels
These provide dynamically-updated daily and weekly support and resistance levels. It is very common to see price retest these levels, so it offers a decent place to set alarms or bids.
Candle Structure Labeling
For newer traders, we offer the ability to have every candle automatically labeled by its structure, whether it is a bullish harami, bearish engulfing, etc. We also offer a small bar at the bottom for price hints so you can see a quick summary of whether the current candle is bullish or bearish.
RSI Divergences
The Gambit Trading Suite posts green flags for bullish RSI divs, and red flags for bearish RSI divs. Both hidden and regular divergences are marked.
Gambit StochRSI Grid (This indicator is listed separately. Please visit my profile page to get it)
This indicator highlights StochRSI overbought/oversold values for 1D, 2H, 1H, & 30m timeframes (From top to bottom. Timeframes can be changed in settings).
If the lower three timeframes are all overbought/oversold, a direction arrow will show, suggesting the direction of the trend. By default, there are four available timeframes tracked, three of which are low timeframe and one is for a quick-glance at the 1D. Only the lower three are utilized for printing arrow signals.
Public indicators:
For your convenience, we have bundled the most commonly requested indicators inside the Gambit suite in order to allow you to get up to 10 indicators enabled at once. The public included indicators are:
Ichimoku Cloud
EMA #1
EMA #2
Bollinger Bands
Pivot Points
For a detailed step-by-step setup guide and complete documentation on the indicators (as well as best practices on how to use the Gambit Trading Suite), feel free message me.
Leave a comment below to try the Gambit Trading Suite for FREE.

Binary 15 V1 w/ AlertsSo this is my first time coding Pinescript. I used bits and pieces of idea from smarter people like JustUncle, uscgears and Chris Moody.
I then combined bits and pieces and came with my own criteria for Binary Options.
Please use and provide feedback.
Rules:
Fuschia Bar: Sell for next available 15 min expiry
Yellow Bar: Buy for next available 15 min expiry
Notes:
When Stoch is OB/OS avoid trade
Alert Capable
Avoid trading in low volume times or during new releases

Buyside & Sellside Liquidity by Abu-sarahThe Liquidity Zones Indicator is built to automatically identify and visualize one of the core foundations of smart money trading: liquidity pools and levels.
These are areas on the chart where clusters of orders are typically positioned – such as stop losses above highs (buyside) or below lows (sellside). Recognizing these levels can help traders anticipate where price might gravitate to, reverse, or continue its movement.
🔶 SETTINGS
🔹 Liquidity Levels
Detection Length: Number of candles used to scan and define swing points.
Margin: Adjusts how sensitive the script is when confirming a liquidity level.
🔹 Liquidity Zones
Buyside Liquidity: Activates zones above repeated highs.
Sellside Liquidity: Activates zones below repeated lows.
Margin & Colors: Fully customizable width and color display for both buyside and sellside areas.
🔹 Liquidity Voids
Option to highlight imbalances (FVGs) both bullish and bearish.
Labels can be enabled to clearly tag voids for quick recognition.
🔹 Display Options
Mode: Choose between Present (last 500 bars focus) or Historical (full chart scan).
Visible Levels: Control how many liquidity areas are shown at once.
🔶 HOW IT WORKS
Liquidity, in simple terms, is the presence of pending orders at certain price levels.
Buyside Liquidity (BLIQ): typically above swing highs, where short sellers’ stops rest.
Sellside Liquidity (SLIQ): typically under swing lows, where long traders’ stops are placed.
When price sweeps through these pools, two common reactions occur:
Reversal: Price clears liquidity then snaps back in the opposite direction.
Continuation: Price breaks through, retests, and extends further in the same direction.
Additionally, Liquidity Voids (imbalances) appear as strong displacement candles with little to no wicks, signaling inefficient trading ranges. Such gaps are often revisited and filled later by price action.
🔶 DETAILS
Helps traders spot stop hunts & fakeouts.
Shows where institutions & smart money are likely targeting orders.
Zones can double as support/resistance and provide setups for entries/exits.
Fully customizable visuals for better chart readability.
تم تصميم هذا المؤشر ليكشف بشكل تلقائي ويعرض أحد أهم مفاهيم التداول بالمال الذكي: مناطق السيولة (Liquidity Pools & Levels).
هذه المناطق تمثل تجمعات أوامر السوق المخفية، مثل أوامر إيقاف الخسارة (Stops) المتمركزة غالبًا فوق القمم (سيولة شرائية) أو تحت القيعان (سيولة بيعية). معرفة أماكنها تمنح المتداول ميزة في توقّع الأماكن التي قد ينجذب إليها السعر ويحدث عندها اختراق أو ارتداد قوي.
🔶 الإعدادات
🔹 مستويات السيولة
طول الكشف (Detection Length): عدد الشموع المستخدمة لمسح وتحديد القمم والقيعان.
الهامش (Margin): يحدد مدى حساسية المؤشر عند تأكيد المستوى.
🔹 مناطق السيولة (Liquidity Zones)
سيولة شرائية (Buyside): تفعل إظهار المناطق أعلى القمم المتكررة.
سيولة بيعية (Sellside): تفعل إظهار المناطق أسفل القيعان المتكررة.
الهامش والألوان: تحكم كامل في عرض الحدود ولون المناطق.
🔹 فجوات السيولة (Liquidity Voids)
خيار تفعيل كشف الفجوات السعرية غير المتوازنة (FVG) الصاعدة والهابطة.
إمكانية إظهار ملصق (Label) لتوضيح أماكن الفجوات بشكل مباشر.
🔹 خيارات العرض
الوضع (Mode):
الحالي (Present): يركز على آخر 500 شمعة.
التاريخي (Historical): يفحص كامل البيانات المتوفرة على الشارت.
عدد المستويات المرئية: لتحديد كم منطقة سيولة تظهر على الرسم.
🔶 آلية عمل المؤشر
ببساطة، السيولة تعني وجود أوامر معلقة عند مستويات سعرية محددة.
سيولة شرائية (Buyside): غالبًا فوق القمم حيث يتمركز ستوبات البائعين.
سيولة بيعية (Sellside): غالبًا تحت القيعان حيث يتمركز ستوبات المشترين.
عند ضرب السعر لهذه المستويات قد يحدث:
انعكاس (Reversal): السعر يخترق المنطقة سريعًا ثم ينعكس بالاتجاه المعاكس.
استمرار (Continuation): المنطقة تنكسر ويعيد السعر اختبارها ثم يكمل بنفس الاتجاه.
أما فجوات السيولة (Voids/FVGs) فتظهر كشموع قوية متتالية دون ذيول واضحة، مما يشير إلى حركة غير متوازنة غالبًا يعود إليها السعر لاحقًا لملئها.
🔶 التفاصيل
يساعد على رصد الاختراقات الوهمية (Stop Hunt).
يكشف مناطق تجميع أو توزيع المؤسسات والبنوك.
المناطق المرسومة يمكن أن تعمل كـ دعم/مقاومة ذكية.
قابل للتخصيص من حيث الشكل والألوان لتوضيح القراءة على الشارت.
🔶 التنبيهات
يمكن ضبط المؤشر لإرسال تنبيه عند:
اكتشاف/تحديث مستوى سيولة جديد.
اختراق أو كسر منطقة سيولة قائمة.
📌 للمزيد من الشروحات والتحديثات اليومية:
👉 Radar Channel
🔖 هاشتاقات:
#السيولة #التداول #الفوليوم #المؤسسات #SMC #الفوركس #الاسهم #الكريبتو #Options #ICT #Radar

OB old version by triummWhat is an Order Block?
In Smart Money Concepts (SMC), an order block (OB) is the last bullish or bearish candle before a strong impulsive move that breaks structure.
A Bullish OB → the last down candle before price moves strongly up.
A Bearish OB → the last up candle before price moves strongly down.
Order blocks represent areas where institutions or “smart money” placed large buy/sell orders.
🔹 What is a Volume Order Block?
A Volume Order Block adds a volume filter to standard order blocks.
Instead of just marking any OB, it highlights only those that are confirmed by abnormally high trading volume.
📌 Logic:
When banks/institutions create OBs, they usually inject big volume into the market.
Regular OBs may appear everywhere, but volume-based OBs filter out weak ones.
🔹 How to Identify a Volume Order Block
Find the OB normally (last opposite candle before strong move).
Check volume of that OB candle:
If volume is above average → strong OB (institutions active).
If volume is low/normal → weak OB (likely to fail).
🔹 Why Volume OB is Better
Filters fake OBs → many OBs form, but not all are institutional.
Higher probability zones → when price revisits that OB, it’s more likely to respect it.
Confluence with liquidity → strong OB + high volume often means liquidity grab + institutional entry.
🔹 Example (Bullish Volume OB)
Price is in a downtrend.
A bearish candle with unusually high volume forms.
Immediately after, price pushes up strongly, breaking structure.
That bearish candle is now a bullish volume order block.
When price returns to that level → strong buy reaction expected.
🔹 How Traders Use Volume OBs
Entries → wait for price to revisit the OB + volume support.
Stop Loss → usually below (bullish OB) or above (bearish OB).
Target → next liquidity pool, FVG, or imbalance.
Filtering → ignore OBs with low volume → less clutter on chart.
✅ In short:
A Volume Order Block = A normal OB + confirmed by unusually high volume.
It gives you higher quality supply & demand zones backed by institutional activity.

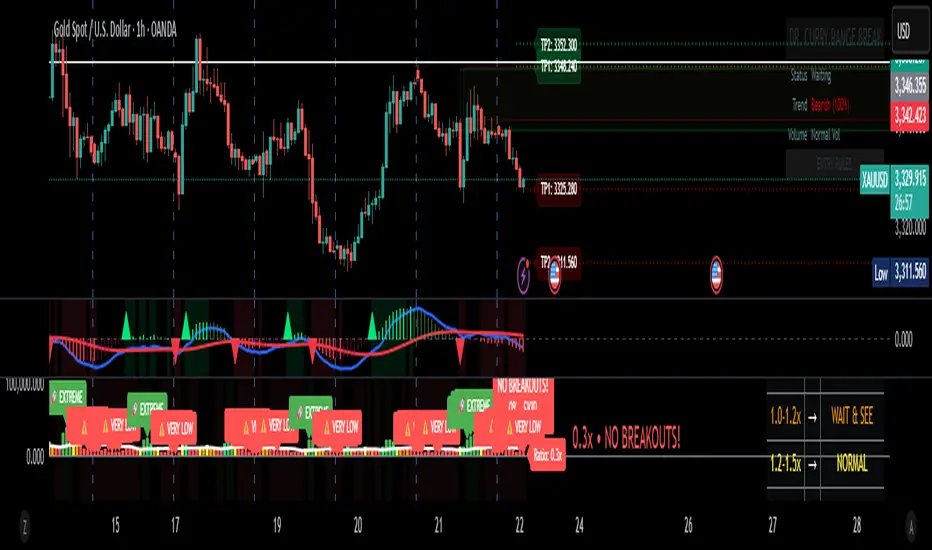
Dr. Curry Range Break# 🚀 DR. CURRY RANGE BREAK - QUICK START CHEAT SHEET
## ⚡ 5-MINUTE SETUP GUIDE
### 1️⃣ **ADD TO CHART**
- Timeframe: **5-MINUTE CHART** (MUST USE!)
- Add indicator: "Dr. Curry Range Break"
- Default settings work great!
### 2️⃣ **WAIT FOR THE BLUE BOX** (9:30-9:45 AM ET)
```
🔵 BLUE BOX = Your Trading Range
- Forms in first 15 minutes
- DO NOT TRADE until box completes!
```
### 3️⃣ **WATCH FOR BREAKOUT SIGNALS**
#### 🟢 **LONG SETUP (BUY)**
- Price CLOSES above blue box
- Look for signal on chart:
- **GREEN = GO!** (★★★ Best)
- **BLUE = GOOD** (★★)
- **GOLD = CAREFUL** (★)
#### 🔴 **SHORT SETUP (SELL)**
- Price CLOSES below blue box
- Look for signal on chart:
- **RED = GO!** (★★★ Best)
- **BLUE = GOOD** (★★)
- **GOLD = CAREFUL** (★)
## 📊 TRADE MANAGEMENT
### **ENTRY CHECKLIST** ✅
1. Blue box complete? ✓
2. Candle CLOSED outside box? ✓
3. Signal appeared? ✓
4. Volume says "HIGH VOL"? (Even better!)
### **WHERE TO EXIT**
- **Take Profit**: Green/Red TP lines on chart
- **Stop Loss**: Opposite side of blue box
- **Quick Rule**: Risk $100 to make $200+
## 🎯 THE ONLY 3 RULES YOU NEED
### RULE 1: **COLOR = ACTION**
```
GREEN/RED Candle = BEST Trade
BLUE Candle = GOOD Trade
GOLD Candle = SKIP (risky)
```
### RULE 2: **STARS = QUALITY**
```
★★★ = Full position size
★★ = Half position size
★ = Don't trade (or tiny size)
```
### RULE 3: **PANEL = CONFIRMATION**
Look for:
- **"HIGH VOL ✓"** = Strong move
- **"Bullish/Bearish"** = With trend
- **Stop Loss price** = Your exit
## 🚦 SIMPLE DECISION TREE
```
Is there a BLUE BOX?
↓ NO → Wait
↓ YES
Did price CLOSE outside box?
↓ NO → Wait
↓ YES
What COLOR is the signal?
↓ GOLD → Skip trade
↓ BLUE → Maybe trade (check stars)
↓ GREEN/RED → TRADE IT!
```
## ⏰ BEST TRADING TIMES
**BEST**: 9:45 AM - 10:30 AM ET
**GOOD**: 10:30 AM - 11:30 AM ET
**AVOID**: After 12:00 PM (lunch chop)
## 💰 POSITION SIZING (Beginners)
- **★★★ Signal**: Risk 1% of account
- **★★ Signal**: Risk 0.5% of account
- **★ Signal**: Don't trade
**Example**: $10,000 account
- ★★★ = Risk $100 per trade
- ★★ = Risk $50 per trade
## 🛑 STOP DOING THIS
❌ Trading before blue box completes
❌ Entering on wick touches (need CLOSE)
❌ Taking ★ trades
❌ Moving your stop loss
❌ Revenge trading after a loss
## ✅ START DOING THIS
✅ Wait for box completion
✅ Only trade ★★ or ★★★
✅ Use the stop loss shown
✅ Take partial profits at TP1
✅ Stop after 2 losses
## 📱 FIRST WEEK GOALS
- **Monday**: Just watch, don't trade
- **Tuesday**: Paper trade only ★★★ signals
- **Wednesday**: Paper trade ★★★ and ★★
- **Thursday**: Small real trades (★★★ only)
- **Friday**: Review and learn
## 🎪 THE "SET IT AND FORGET IT" METHOD
1. **Entry**: Market order on signal
2. **Stop**: Set at opposite box level
3. **Target**: Set at TP1 (first green/red line)
4. **Walk away**: Let it hit stop or target
## 🚨 EMERGENCY RULES
**STOP TRADING IF**:
- Lost 2 trades today
- Feeling emotional
- No clear signals appearing
- Market is choppy (no trend)
---
## 📝 YOUR DAILY ROUTINE
**9:25 AM**: Chart open, indicator on
**9:30 AM**: Watch blue box form
**9:45 AM**: Box complete, watch for breakout
**9:46 AM+**: Take signal if it appears
**10:30 AM**: Review trades, possibly done for day
## 💡 ONE LAST TIP
**Start with SIM/Paper Trading for 1 week minimum!**
The best traders are patient traders. Wait for YOUR setup - the market will always give you another chance tomorrow.
**Remember**: 1 good ★★★ trade > 5 random trades
Good luck! 🍀# Dr. Curry Range Break - Professional Trading Indicator
## Overview
The **Dr. Curry Range Break** is a comprehensive trading system designed to identify high-probability breakout opportunities during the market's opening range period. This professional-grade indicator combines volume analysis, multi-timeframe trend confirmation, and smart money concepts to give traders a complete edge in range breakout trading.
## 🎯 Key Features
### 1. **Opening Range Detection**
- Automatically identifies and marks the opening range (5, 15, or 30-minute options)
- Clear visual box showing the range high and low
- Professional blue color scheme for easy identification
### 2. **Smart Breakout Signals**
- **GREEN CANDLE + "STRONG BUY ★★★"** = High probability setup (with trend + high volume)
- **BLUE CANDLE + "BUY SIGNAL ★★"** = Good setup (with trend, normal volume)
- **GOLD CANDLE + "RISKY BUY ★"** = Caution (against trend)
### 3. **Automatic Target Levels**
- Displays TP1, TP2, TP3 levels based on previous swing points
- Clear price labels showing exact target levels
- Green lines for long targets, red lines for short targets
### 4. **Multi-Timeframe Trend Analysis**
- Analyzes 15m, 60m, and 240m timeframes simultaneously
- Shows trend strength percentage in the panel
- Confirms if your trade aligns with the bigger picture
### 5. **Volume Confirmation**
- Identifies high-volume breakouts automatically
- "HIGH VOL ✓" indicator in panel when volume exceeds threshold
- Helps filter out false breakouts
### 6. **Advanced Features**
- Fair Value Gaps (FVG) detection
- Order Block identification
- Stop loss levels clearly marked
- Professional trading panel with all key information
## 📖 How to Use
### Setup
1. **Best Timeframe**: Use on 5-minute chart (also works on 1m and 15m)
2. **Market Open**: Indicator activates at 9:30 AM ET (configurable)
3. **Range Duration**: Default 15 minutes (9:30-9:45 AM)
### Entry Rules
1. **Wait for Range Lock**: Let the opening range complete (default 15 minutes)
2. **Watch for Breakout**: Price must CLOSE above/below the range
3. **Check the Signal**:
- ★★★ = Take the trade with confidence
- ★★ = Good setup, normal position size
- ★ = Risky, reduce size or skip
### Exit Strategy
- **Take Profit**: Use the TP levels shown on chart
- **Stop Loss**: Opposite side of the range (shown in panel)
- **Trail Stop**: Move to breakeven after TP1
## 🔍 What to Look For
### Best Setups (★★★)
- Green/Red candle on breakout
- "HIGH VOL ✓" in panel
- Trend aligned (Bullish/Bearish in panel)
- Clear TP levels above/below
### Good Setups (★★)
- Blue candle on breakout
- Normal volume
- With trend direction
- Multiple TP levels available
### Avoid These (★)
- Gold/Yellow candle (against trend)
- Low volume breakouts
- Choppy market conditions
- No clear TP levels
## ⚙️ Customization Options
### Visual Settings
- **Minimal Mode**: Reduces clutter for experienced traders
- **Show/Hide**: Targets, FVG, Order Blocks, Swing Points
- **Panel Position**: Choose corner placement
### Range Settings
- **Timezone**: Adjust for your market
- **Duration**: 5, 15, or 30-minute ranges
- **Market Open**: Customize start time
### Advanced Settings
- **Volume Multiplier**: Adjust high volume threshold
- **Target Count**: Show 1-3 TP levels
- **EMA Length**: Trend calculation period
## 💡 Pro Tips
1. **Best Days**: Monday-Thursday typically have cleaner breakouts
2. **Avoid Fridays**: Often choppy with less follow-through
3. **News Days**: Check economic calendar - avoid FOMC days
4. **Time It**: Best breakouts often occur 30-60 minutes after open
5. **Volume Matters**: Never take a ★ trade on low volume
## 🚨 Risk Management
- **Position Size**: Risk 1-2% per trade maximum
- **Stop Loss**: Always use the opposite range level
- **Scaling**: Take partial profits at each TP level
- **Daily Max**: Stop after 2-3 losses in a day
## 📊 Success Metrics
This indicator helps identify:
- High probability breakouts with 60-70% win rate on ★★★ setups
- Clear risk/reward with defined stops and targets
- Optimal entry timing with volume confirmation
- Trend alignment for higher probability trades
---
**Remember**: No indicator is perfect. Always use proper risk management and combine with your market knowledge. The Dr. Curry Range Break is a tool to enhance your decision-making, not replace it.
*Happy Trading! 📈*## 📦 Box Color Guide - Dr. Curry Range Break
### 🔵 **BLUE BOX - Opening Range**
- **What it means**: This is your main trading range (first 15/30 minutes)
- **How to use**: Wait for price to break above/below this box
- **Key levels**: Top = Range High (Long entry above), Bottom = Range Low (Short entry below)
### 🟢 **GREEN BOXES - Bullish Zones**
1. **Light Green Transparent Box (FVG - Fair Value Gap)**
- **What it means**: Bullish imbalance/gap in price
- **How to use**: Acts as support on pullbacks
- **Trading tip**: If price returns to this box after breakout, it's a good re-entry zone
2. **Very Light Green Box (Order Block)**
- **What it means**: Last bearish candle before a strong move up
- **How to use**: Major support zone
- **Trading tip**: Great area to add to positions or enter if missed initial breakout
### 🔴 **RED BOXES - Bearish Zones**
1. **Light Red Transparent Box (FVG - Fair Value Gap)**
- **What it means**: Bearish imbalance/gap in price
- **How to use**: Acts as resistance on pullbacks
- **Trading tip**: If price returns to this box after breakdown, it's a good re-entry zone for shorts
2. **Very Light Red Box (Order Block)**
- **What it means**: Last bullish candle before a strong move down
- **How to use**: Major resistance zone
- **Trading tip**: Great area to add to short positions or enter if missed initial breakdown
### 🟠 **ORANGE BOX - Breaker Block**
- **What it means**: Failed support/resistance that flipped
- **How to use**: Strong reversal zone
- **Trading tip**: Often marks the end of a move - consider taking profits
## 🎯 Quick Reference
```
BLUE = Your main range to trade
GREEN = Support zones (buy/hold)
RED = Resistance zones (sell/short)
ORANGE = Reversal warning
```
## 💡 Pro Tips for Using Boxes
1. **Multiple Green Boxes** = Stronger bullish bias
2. **Multiple Red Boxes** = Stronger bearish bias
3. **Price respecting boxes** = Higher probability trades
4. **Price ignoring boxes** = Potential trend change
### Box Stacking Priority
1. **Most Important**: Blue Opening Range
2. **Very Important**: Order Blocks (light green/red)
3. **Important**: FVG boxes
4. **Warning**: Orange breaker blocks
**Remember**: The more boxes align in one direction, the stronger the move typically is!
BOS FVG IndicatorBOS FVG Indicator (Smart Market Structure Tool)
🔎 Overview
The BOS FVG Indicator is a smart price-action–based tool that combines Break of Structure (BOS), Change of Character (CHoCH), Fair Value Gaps (FVG), Supertrend, and ADX strength into one powerful indicator.
It helps traders identify market structure shifts, imbalances, and high-probability trade setups while also highlighting no-trade zones (NTZ) where the market is choppy or lacks trend strength.
This indicator is designed for intraday and swing traders who follow ICT-style concepts or price-action based trading.
⚡ Key Features
Break of Structure (BOS) & CHoCH Detection
Labels bullish BOS (📈 BOS↑) and bearish BOS (📉 BOS↓).
Highlights structure shifts for trend confirmation.
Fair Value Gaps (FVG)
Auto-detects bullish and bearish FVGs.
Draws transparent boxes with labels where imbalances appear.
Supertrend Confirmation
Adaptive supertrend line with dynamic coloring (green = bullish, red = bearish).
No Trade Zone (NTZ)
Automatically shades background gray when ADX is weak or no BOS detected.
Helps avoid false signals in sideways/choppy markets.
Multi-Timeframe Context
Previous 4H candle range plotted as a dotted yellow box.
Useful for intraday traders tracking HTF liquidity zones.
Signal Strength
Regular and Strong Buy/Sell signals based on ADX confirmation.
Labels include entry info, RR (2:1), and trend strength.
Market Info Dashboard
Table on chart showing ADX strength, current trend, and trade zone status.
🛠 How to Use
Add to Chart → Apply the indicator to any timeframe (works best on 5m–1H for intraday, 4H–Daily for swing).
Choose Mode
Indicator Mode → Shows visual signals, BOS, FVG, NTZ zones, and dashboard.
Strategy Mode → Displays trade entry labels with RR info for backtesting setups.
Filters
Only trade signals when ADX > threshold and NTZ is inactive.
Confirm with Supertrend direction + BOS + FVG alignment.
Entries & Exits
Long Entry → Bullish BOS + Bullish FVG + Trend bullish.
Short Entry → Bearish BOS + Bearish FVG + Trend bearish.
Stop Loss: Recent swing high/low.
Take Profit: Auto-suggested 2:1 RR.
🔔 Alerts
Set alerts to never miss key signals:
✅ Bullish / Bearish BOS
✅ Bullish / Bearish FVG
✅ Strong Buy / Sell
✅ Regular Buy / Sell
✅ Long / Short Entries
✅ No Trade Zone active
Alerts are pre-configured with clear messages (📈, 📉, 🚀, 🟢, 🔴, ⚪).
📌 Best Use Cases
ICT-style liquidity and FVG traders.
Intraday traders filtering strong vs weak signals.
Swing traders using multi-timeframe confirmation.
Traders who want an all-in-one market structure toolkit.
👉 This script is not financial advice. Always backtest before using in live markets.

IFVG by Toño# IFVG by Toño - Pine Script Indicator
## Overview
This Pine Script indicator identifies and visualizes **Fair Value Gaps (FVG)** and **Inverted Fair Value Gaps (IFVG)** on trading charts. It provides advanced analysis of price inefficiencies and their subsequent inversions when mitigated.
## Key Features
### 1. Fair Value Gap (FVG) Detection
- **Bullish FVG**: Detected when `low > high ` (gap between current low and high of 2 bars ago)
- **Bearish FVG**: Detected when `high < low ` (gap between current high and low of 2 bars ago)
- Visual representation using colored rectangles (green for bullish, red for bearish)
### 2. Inverted Fair Value Gap (IFVG) Creation
- **IFVG Formation**: When a FVG gets mitigated (price fills the gap with candle body), an IFVG is created
- **Color Inversion**: The IFVG takes the opposite color of the original FVG
- Mitigated bullish FVG → Creates red (bearish) IFVG
- Mitigated bearish FVG → Creates green (bullish) IFVG
- **Mitigation Logic**: Uses only candle body (not wicks) to determine when a FVG is filled
### 3. Customizable Display Options
- **Show Normal FVG**: Toggle visibility of regular Fair Value Gaps
- **Show IFVG**: Toggle visibility of Inverted Fair Value Gaps
- **Smart FVG Display**: Even when "Show Normal FVG" is disabled, FVGs that are part of IFVGs remain visible
- **Extension Control**: Option to extend FVGs until they are mitigated
### 4. IFVG Extension Methods
- **Full Cross Method**: IFVG remains active until price completely crosses through it (including wicks)
- **Number of Bars Method**: IFVG remains active for a specified number of bars (1-100)
### 5. Visual Mitigation Signals
- **Cross Markers**: Shows X-shaped markers when IFVGs are mitigated
- Green cross above bar: Bearish IFVG mitigated
- Red cross below bar: Bullish IFVG mitigated
### 6. Comprehensive Alert System
- **IFVG Formation Alerts**: Notifications when new IFVGs are created
- **IFVG Mitigation Alerts**: Notifications when IFVGs are filled/mitigated
- **Separate Controls**: Individual toggles for bullish and bearish IFVG alerts
## How It Works
### Step-by-Step Process:
1. **FVG Detection**: Script continuously scans for 3-bar patterns that create price gaps
2. **FVG Tracking**: Each FVG is stored with its coordinates, type, and status
3. **Mitigation Monitoring**: Script watches for candle bodies that fill the FVG
4. **IFVG Creation**: Upon mitigation, creates an IFVG with opposite polarity at the same location
5. **IFVG Management**: Tracks and extends IFVGs according to chosen method
6. **Visual Updates**: Dynamically updates colors and visibility based on user settings
## Use Cases
- **Support/Resistance Analysis**: IFVGs often act as strong support/resistance levels
- **Market Structure Understanding**: Helps identify how market inefficiencies get filled and reversed
- **Entry/Exit Timing**: Can be used to time entries around IFVG formations or mitigations
- **Confluence Analysis**: Combine with other technical analysis tools for stronger signals
## Configuration Parameters
- **Colors**: Customizable colors for bullish/bearish FVGs and IFVGs
- **Extension**: Choose how long to display gaps on the chart
- **Alerts**: Full control over notification preferences
- **Visual Clarity**: Options to show/hide different gap types for cleaner charts
## Technical Specifications
- **Pine Script Version**: 5
- **Overlay**: True (displays directly on price chart)
- **Max Boxes**: 500 (supports up to 500 simultaneous gaps)
- **Performance**: Optimized array management for smooth operation
This indicator is particularly valuable for traders who use **Smart Money Concepts (SMC)** and **Inner Circle Trader (ICT)** methodologies, as it provides clear visualization of how institutional order flow creates and fills market inefficiencies.

SMT for Time-Based Sessions [ufo]SMT for Time-Based Sessions identifies when one asset breaks a session’s high/low while another correlated asset fails to do so. This imbalance often signals engineered liquidity grabs, reversals, or continuation setups. By focusing on divergences within specific trading sessions (London, New York AM, Lunch, New York PM, Asia, Daily or your own custom windows), the tool filters out noise and pinpoints only the most meaningful SMT divergences across multiple symbols in real-time.
Core Concept:
SMT (Smart Money Technique/Tool/Time) is a concept popularized by Inner Circle Trader (ICT) that suggests that when correlated or inversely correlated instruments fail to confirm each other's price movements (e.g., one breaks a high/low while the other doesn’t), it often indicates:
Liquidity manipulation by institutional players
Potential reversal points in the market
Weakness or strength in the current trend
Stop hunt operations before significant moves
This indicator identifies these divergences by comparing your chart symbol against up to two comparison symbols across different sessions and timeframes.
How Time-Based SMT Works:
Unlike basic divergence tools, this indicator is built specifically for Session-Based and Timeframe-Based SMT tracking. It continuously monitors intraday sessions and higher timeframes, then plots divergences the moment they occur.
Time-Based Session SMT
Session Tracking: Monitors highs and lows during each session
Post-Session Analysis: After a session ends, tracks whether price breaks session levels
Divergence Detection: When the main symbol breaks a high/low but comparison symbols don’t (or vice versa), an SMT signal is triggered
(e.g. Nasdaq traded above London high while S&P500 does not)
Visual Confirmation: Lines connect the session reference to the current extreme, with labels showing the diverging session, high/low, and symbol, this information is also displayed in the Info Panel
This will update if a new high/low extreme is made while the SMT is still valid, if invalidated these will be removed from the chart
Example:
This NQ chart includes ES and YM as comparison symbols. At 03:20 AM New York time, both ES and YM broke the Asia session low (20:00 – 00:00), while NQ did not. This creates a bullish session divergence , which the indicator immediately detects and plots.
Although the chart shows three symbols for illustration, you don’t need to manually monitor comparison charts when using this indicator, the SMT divergence will be plotted automatically as soon as it occurs
Consecutive Candle SMT (CC SMT)
Previous Candle Reference: Uses the previous candle's high/low from the selected timeframe
Real-Time Comparison: Monitors if current price breaks these levels across all symbols
Instant Detection: Triggers SMT immediately when divergence occurs
Dynamic Updates: Lines and labels update in real-time as new extremes form and are automatically removed if invalidated
Example:
Here I configured CC SMT Timeframe 1 to monitor the previous 4-hour candle’s high/low. On this NQ chart with ES as a comparison symbol, ES broke above the prior 4-hour high at 14:00 New York time, while NQ did not, showing relative weakness creating a bearish CC SMT divergence
This chart is just an illustration. The indicator will automatically plot SMT divergences on your main chart, regardless of the timeframe you’re viewing
How To Use:
This indicator is not a buy/sell signal on its own. Instead, it is designed to highlight Time-Based SMT divergences so you can combine them with your existing trading strategy or model. It should be used as an extra layer of confluence, helping you confirm trade ideas.
Select your comparison symbols
For example:
Futures: NQ vs ES/YM
Forex: EURUSD vs GBPUSD/DXY(inversely)
Crypto: BTC vs ETH
Commodities: Gold vs Silver
Choose which sessions or candle timeframes you want the indicator to monitor
Watch for divergences the indicator plots when one symbol breaks a high/low while the other does not
Use these divergences as confluence, alongside your own strategy and risk management rules
Key Features:
Multiple Comparison Symbols
Symbol 1 & Symbol 2: Compare your main chart against up to 2 correlated instruments
Symbol Inversion: Perfect for inversely correlated pairs (e.g., EURUSD vs DXY)
Session-Based SMT Tracking
Monitors 7 fully customizable trading sessions with the default being:
London Session (2:00-5:00 NY time)
NY AM Session (9:30-12:00 NY time)
Lunch Session (12:00-13:00 NY time)
NY PM Session (13:00-16:00 NY time)
Asia Session (20:00-00:00 NY time)
Custom Session 6 (if you want to add an extra session)
Daily Session (18:00-18:00 NY time)
Fully customizable session times and names
Automatically detects when the main symbol breaks a session high/low while comparison symbols don't (and vice versa)
Consecutive Candle SMT (CC SMT)
Monitors 3 customizable timeframes
Tracking of divergences based on specific timeframe candles (15min, 60min, 4 hour, weekly, etc.)
Identifies when the current price breaks the previous candle's high/low differently than comparison symbols
Maintains history of past SMTs (configurable)
Timeframe 3 supports custom time shifts for non-standard candle boundaries
Example: 90min timeframe with a +60 shift changes the candle range from:
00:00-01:30, 01:30-03:00 etc
to:
01:00-02:30, 02:30-04:00 etc
Visual Customization
Line Styles: Customize the line styles for different symbols
Colors: Unique color schemes for instant session identification
Adjustable Offsets: Fine-tune label positions with multiplier settings
Show/Hide Controls: Complete control over visual elements
Custom Labels: Customize the SMT labels for highs and lows
Information Panel
Active SMT Conditions: Live tracking of all current divergences
Session Names: Clear identification of which session created the SMT
Symbol Information: Shows which comparison symbol is diverging
Timestamps: Optional time display showing when SMT was first detected
Flexible Positioning: 8 different panel positions
Smart Display Modes: Options to hide inactive sessions/timeframes
Alert System
Configurable alerts for specific sessions or timeframes
Get notified when new divergences appear instantly
Clear, informative alert descriptions
How To Setup Alerts:
Enable the "Enable Alerts" in the settings
Choose which sessions/timeframes to receive alerts for by choosing it in the setting below
(If you select "All Sessions" you will only be alerted for all the sessions you have enabled in the indicator settings)
Create an alert (ALT+A shortcut) or click the the 3 dots on the indicator "Add alert on Session SMT "
- Condition = Session SMT
- Function = Any alert() function call
- Alert name (Message) = Anything you prefer (e.g. SMT Alert)
If you want to create another alert for different settings, first input the new settings in the indicator, then create a new alert.
Note: Previous alerts will continue to notify you based on the settings they were originally set for, even if you change the indicator setting.
How This Helps Your Trading:
This tool automates the heavy lifting of tracking divergences across multiple markets and sessions, continuously monitoring highs and lows in real time and plotting only the most meaningful SMT signals so you can focus on execution, not chart-watching.

T-Virus Sentiment [hapharmonic]🧬 T-Virus Sentiment: Visualize the Market's DNA
Remember the iconic T-Virus vial from the first Resident Evil? That powerful, swirling helix of potential has always fascinated me. It sparked an idea: what if we could visualize the market's underlying health in a similar way? What if we could capture the "genetic code" of market sentiment and contain it within a dynamic, 3D indicator? This project is the result of that idea, brought to life with Pine Script.
The indicator's main goal is to measure the strength and direction of market sentiment by analyzing the "genetic code" of price action through a variety of trusted indicators. The result is displayed as a liquid level within a DNA helix, a bubble density representing buying pressure, and a T-Virus mascot that reflects the overall mood.
🧐 Core Concept: How It Works
The primary output of the indicator is the "Active %" gauge you see on the right side of the vial. This percentage represents the overall sentiment score, calculated as an average from 7 different technical analysis tools. Each tool is analyzed on every bar and assigned a score from 1 (strong bearish pressure) to 5 (strong bullish potential).
In this indicator, we re-imagine market dynamics through the lens of a viral outbreak. A strong bear market is like a virus taking hold, pulling all technical signals down into a state of weakness. Conversely, a powerful bull market is like an antiviral serum ; positive signals rise and spread toward the top of the vial, indicating that the system is being injected with strength.
This is not just another line on a chart. It's a comprehensive sentiment dashboard designed to give an immediate, at-a-glance understanding of the confluence between 7 classic technical indicators. The incredible 3D model of the vial itself was inspired by a design concept found here .
⚛️ The 4 Core Elements of T-Virus Sentiment
These four elements work in harmony to give a complete, multi-faceted picture of market sentiment. Each component tells a different part of the story.
The Virus Mascot: An instant emotional cue. This character provides the quickest possible read on the overall market mood, combining sentiment with volume pressure.
The Antiviral Serum Level: The main quantitative output. This is the liquid level in the DNA helix and the percentage gauge on the right, representing the average sentiment score from all 7 indicators.
Buy Pressure & Bubble Density: This visualizes volume flow. The density of bubbles represents the intensity of accumulation (buying) versus distribution (selling). It's the "power" behind the move.
The Signal Distribution: This shows the confluence (or dispersion) of sentiment. Are all signals bullish and clustered at the top, or are they scattered, indicating a conflicted market? The position of the indicator labels is crucial, as each is assigned to one of five distinct zones:
Base Bottom: The market is at its weakest. Signals here suggest strong bearish control and distribution.
Lower Zone: The market is still bearish, but signals may be showing early signs of accumulation or bottoming.
Neutral Core (Center): A state of balance or sideways consolidation. The market is waiting for a new direction.
Upper Zone: Bullish momentum is becoming clear. Signals are strengthening and showing bullish control.
Top Cap: The market is "heating up" with strong bullish sentiment, potentially nearing overbought conditions.
🐂🐻 The Virus Mascot: The At-a-Glance Indicator
This character acts as a shortcut to confirm market health. It combines the sentiment score with volume, preventing false confidence in a low-volume rally.
Its state is determined by a dual-check: the overall "Antiviral Serum Level" and the "Buy Pressure" must both be above 50%.
Green & Smiling: The 'all clear' signal. This means that not only is the overall technical sentiment bullish, but it's also being supported by real buying pressure. This is a sign of a healthy bull market.
Red & Angry: A warning sign. This appears if either the sentiment is weak, or a bullish sentiment is not being confirmed by buying volume. The latter could indicate a potential "bull trap" or an exhaustive move.
This mascot can be disabled from the settings page under "Virus Mascot Styling" if a cleaner look is preferred.
🫧 Bubble Density: Gauging Buy vs. Sell Pressure
The bubbles visualize the battle between buyers and sellers. There are two modes to control how this is calculated:
Mode 1: Visible Range (The 'Big Picture' View)
This default mode is best for getting a broad, contextual understanding of the current session. It dynamically analyzes the volume of every single candlestick currently visible on the screen to calculate the buy/sell pressure ratio. It answers the question: "Over the entire period I'm looking at, who is in control?" As you zoom in or out, the calculation adapts.
Mode 2: Custom Lookback (The 'Precision' View)
This mode is for traders who need to analyze short-term pressure. You can define a fixed number of recent bars to analyze, which is perfect for scalping or understanding the volume dynamics leading into a key level. It answers the question: "What is happening right now ?" In the example above, a lookback of 2 focuses only on the most recent action, clearly showing intense, immediate selling pressure (few bubbles) and a corresponding drop in the sentiment score to 29%.
ℹ️ Interactive Tooltips: Dive Deeper
We believe in transparency, not 'black box' indicators. This feature transforms the indicator from a visual aid into an active learning tool.
Simply hover the mouse over any indicator label (like EMA, OBV, etc.) to get a detailed tooltip. It will explain the specific data points and thresholds that signal met to be placed in its current zone. This helps build trust in the signals and allows users to fine-tune the indicator settings to better match their own trading style.
🎯 The Scoring Logic Breakdown
The "Antiviral Serum Level" gauge is the average score from 7 technical analysis tools. Each is graded on a 5-point scale (1=Strong Bearish to 5=Strong Bullish). Here’s a detailed, transparent look at how each "gene" is evaluated:
Relative Strength Index (RSI)
Measures momentum and overbought/oversold conditions.
Group 1 (Strong Bearish): RSI > 80 (Extreme Overbought)
Group 2 (Bearish): 70 < RSI ≤ 80 (Overbought)
Group 3 (Neutral): 30 ≤ RSI ≤ 70
Group 4 (Bullish): 20 ≤ RSI < 30 (Oversold)
Group 5 (Strong Bullish): RSI < 20 (Extreme Oversold)
Exponential Moving Averages (EMA)
Evaluates the trend's strength and structure based on the alignment of multiple EMAs (9, 21, 50, 100, 200, 250).
Group 1 (Strong Bearish): A perfect bearish sequence (9 < 21 < 50 < ...)
Group 2 (Bearish Transition): Early signs of a potential reversal (e.g., 9 > 21 but still below 50)
Group 3 (Neutral / Mixed): MAs are intertwined or showing a partial bullish sequence.
Group 4 (Bullish): A strong bullish sequence is forming (e.g., 9 > 21 > 50 > 100)
Group 5 (Strong Bullish): A perfect bullish sequence (9 > 21 > 50 > 100 > 200 > 250)
Moving Average Convergence Divergence (MACD)
Analyzes the relationship between two moving averages to gauge momentum.
Group 1 (Strong Bearish): MACD & Histogram are negative and momentum is falling.
Group 2 (Weakening Bearish): MACD is negative but the histogram is rising or positive.
Group 3 (Neutral / Crossover): A crossover event is occurring near the zero line.
Group 4 (Bullish): MACD & Histogram are positive.
Group 5 (Strong Bullish): MACD & Histogram are positive, rising strongly, and accelerating.
Average Directional Index (ADX)
Measures trend strength, not direction. The score is based on both ADX value and the dominance of DI+ vs DI-.
Group 1 (Bearish / No Trend): ADX < 20 and DI- is dominant.
Group 2 (Developing Bearish Trend): 20 ≤ ADX < 25 and DI- is dominant.
Group 3 (Neutral / Indecision): Trend is weak or DI+ and DI- are nearly equal.
Group 4 (Developing Bullish Trend): 25 ≤ ADX ≤ 40 and DI+ is dominant.
Group 5 (Strong Bullish Trend): ADX > 40 and DI+ is dominant.
Ichimoku Cloud (IKH)
A comprehensive indicator that defines support/resistance, momentum, and trend direction.
Group 1 (Strong Bearish): Price is below the Kumo, Tenkan < Kijun, and Chikou is below price.
Group 2 (Bearish): Price is inside or below the Kumo, with mixed secondary signals.
Group 3 (Neutral / Ranging): Price is inside the Kumo, often with a Tenkan/Kijun cross.
Group 4 (Bullish): Price is above the Kumo with strong primary signals.
Group 5 (Strong Bullish): All signals are aligned bullishly: price above Kumo, bullish Tenkan/Kijun cross, bullish future Kumo, and Chikou above price.
Bollinger Bands (BB)
Measures volatility and relative price levels.
Group 1 (Strong Bearish): Price is below the lower band.
Group 2 (Bearish Territory): Price is between the lower band and the basis line.
Group 3 (Neutral): Price is hovering around the basis line.
Group 4 (Bullish Territory): Price is between the basis line and the upper band.
Group 5 (Strong Bullish): Price is above the upper band.
On-Balance Volume (OBV)
Uses volume flow to predict price changes. The score is based on OBV's trend and its position relative to its moving average.
Group 1 (Strong Bearish): OBV is below its MA and falling.
Group 2 (Weakening Bearish): OBV is below its MA but showing signs of rising.
Group 3 (Neutral): OBV is very close to its MA.
Group 4 (Bullish): OBV is above its MA and rising.
Group 5 (Strong Bullish): OBV is above its MA, rising strongly, and showing signs of a volume spike.
🧭 How to Use the T-Virus Sentiment Indicator
IMPORTANT: This indicator is a sentiment dashboard , not a direct buy/sell signal generator. Its strength lies in showing confluence and providing a quick, holistic view of the market's technical health.
Confirmation Tool: Use the "Active %" gauge to confirm a trade setup from your primary strategy. For example, if you see a bullish chart pattern, a high and rising sentiment score can add confidence to your trade.
Momentum & Trend Gauge: A consistently high score (e.g., > 75%) suggests strong, established bullish momentum. A consistently low score (< 25%) suggests strong bearish control. A score hovering around 50% often indicates a ranging or indecisive market.
Divergence & Warning System: Pay attention to divergences. If the price is making new highs but the sentiment score is failing to follow or is actively decreasing, it could be an early warning sign that the underlying momentum is weakening.
⚙️ Settings & Customization
The indicator is highly customizable to fit any trading style.
Position & Anchor: Control where the vial appears on the chart.
Styling (Vial, Helix, etc.): Nearly every visual element can be color-customized.
Signals: This is where the real power is. All underlying indicator parameters (RSI length, MACD settings, etc.) can be fine-tuned to match a personal strategy. The text labels can also be disabled if the chart feels cluttered.
Enjoy visualizing the market's DNA with the T-Virus Sentiment indicator

SCTI-D1SCTI-D1 Indicator Introduction / 指标简介
The SCTI-D1 (Smart Composite Trading Indicator - Daily) is a comprehensive, multi-feature trading tool designed for serious traders who demand depth, flexibility, and clarity in their market analysis. This indicator combines several powerful concepts into one seamless workflow, including:
Multiple EMA Systems with customizable lengths and visibility
PMA (Projected Moving Average) with fill options between lines
VWAP with configurable anchors and deviation bands
Divergence Detection for MACD and Histogram
Volume Profile with node detection (peaks, troughs, highs, lows)
Smart Money Concepts including order blocks, fair value gaps, equal highs/lows, and market structure shifts
Whether you trade stocks, forex, or cryptocurrencies, the SCTI-D1 helps you identify key levels, track institutional activity, and spot high-probability reversal signals—all in one clean, customizable interface.
SCTI-D1 指标简介
SCTI-D1(智能综合交易指标 - 日线版)是一款功能全面的交易工具,专为需要深度、灵活性和清晰市场分析的专业交易者设计。该指标将多种强大概念融合在一个流畅的工作流程中,包括:
多组EMA系统,可自定义长度和显示
PMA(投影移动平均线),支持均线间填充色
VWAP,可配置锚定周期和偏差带
背离检测,支持MACD和柱状图
成交量分布,支持节点检测(峰值、谷值、最高、最低)
聪明钱概念,包括订单块、公允价值缺口、等高/等低和市场结构转换
无论您交易股票、外汇还是加密货币,SCTI-D1 都能帮助您识别关键水平、跟踪机构资金动向并发现高概率反转信号——所有功能均集成在一个清晰可定制的界面中。

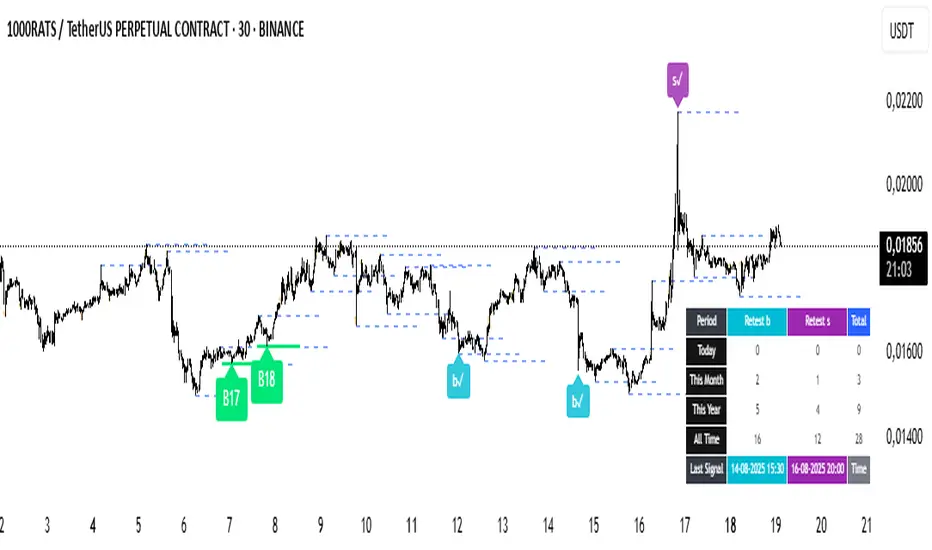
kriptoeth SPKriptoETH SP Indicator - Smart Money Analysis Tool
Main Function
This indicator identifies potential market reversal points based on Smart Money concepts. It analyzes liquidity sweeps and significant support/resistance breaks to generate trading signals.
Key Features
1. Swing Analysis
Identifies high and low levels based on specified swing length (default 15 bars)
These levels are considered potential liquidity zones
2. Liquidity Sweep Detection
Detects short-term violations of support and resistance levels as "sweeps"
Sweep tolerance (%) parameter allows sensitivity adjustment
3. Volume Confirmation
Requires volume spike for signal formation
Volume multiplier sets minimum volume threshold
4. Trend Filter
Analyzes overall trend direction using 50-period MA
Filters signals against the trend to improve success rate
5. Retest Capability
Tracks price return to main signal levels (B/S lines) after initial signals
Shows small confirmation signals when retests occur
Signal Types
B Signal: Potential buy opportunity (green label)
S Signal: Potential sell opportunity (red label)
b✓ / s✓: Retest confirmation signals (small labels)
Filtering System
Filters out too-rapid breaks
Controls for insufficient bar distance
Next bar confirmation option
Eliminates signals inconsistent with trend direction
Statistics Table
Daily, monthly, yearly retest counts
Last signal timestamps
Total signal statistics
Usage Guidelines
Combine signals with other technical analysis tools
Determine your risk-reward ratio in advance
Limit position size to 1-2% of your capital
Consider overall market conditions
Use proper stop-loss levels
Wait for confluence with other indicators
Parameters Explanation
Swing Length: Period for identifying swing highs/lows
Sweep Tolerance: Sensitivity for liquidity sweep detection
Volume Multiplier: Minimum volume increase requirement
Trend Filter: Enable/disable trend-based signal filtering
Retest Filters: Additional confirmation requirements for retest signals
How It Works
Algorithm identifies swing highs and lows as potential liquidity levels
Monitors for price sweeps beyond these levels with volume confirmation
Generates main signals (B/S) when criteria are met
Tracks subsequent retests of these signal levels
Applies multiple filters to reduce false signals
Best Practices
Use higher timeframes for trend confirmation
Combine with support/resistance analysis
Consider market structure context
Apply proper risk management rules
Backtest on historical data before live trading
IMPORTANT DISCLAIMER: This indicator is for educational and analysis purposes only. It does not constitute financial advice. Trading involves substantial risk of loss. Always conduct your own research and consider consulting with a qualified financial advisor before making investment decisions. Past performance does not guarantee future results.
Version Updates
Enhanced filtering system
Improved retest detection
Statistics tracking table
Trend-based signal validation
Multiple confirmation methods
SMC - OB/Breaker Block/Bos/ChoCh (DeadCat) Based on analyzing your Pine Script code, here are comprehensive descriptions that should comply with TradingView's house rules:
Script 1: "PO3 Liquidity w/ CISD (DeadCat)"
Description:
This indicator implements the Power of Three (PO3) liquidity concept combined with Change in State of Delivery (CISD) pattern recognition for Smart Money Concepts (SMC) trading. The script operates on multi-timeframe analysis using automated timeframe selection.
Core Methodology: The indicator identifies C2 liquidity sweeps by detecting when price breaks previous period highs/lows and then reverses back above/below those levels. It specifically looks for:
C2 Buy Setup: When current low breaks previous period low but closes back above it
C2 Sell Setup: When current high breaks previous period high but closes back below it
CISD Pattern Detection: The script implements sophisticated CISD (Change in State of Delivery) pattern recognition by:
Tracking the first break of previous HTF high/low levels
Identifying imbalance candles (gaps between consecutive candles)
Confirming CISD when price reclaims the imbalance level within 2 HTF periods
Validating setups only when both liquidity sweep AND CISD confirmation occur
Visual Components:
HTF Candles: Displays higher timeframe candle structure on current chart
Trading Zones: Shows zones between HTF open and equilibrium levels
CISD Lines: Marks confirmed change in state of delivery levels
C2/C4 Labels: Identifies liquidity sweep entry points and potential continuation setups
Market Structure: Optional HH/HL/LH/LL pivot markers
Unique Features:
Automatic timeframe calculation (15m→4H, 1H→1D, etc.)
Real-time HTF period countdown
Setup invalidation tracking when stops are hit
Progressive setup confirmation (C2→C4 evolution)
Bias filter for directional trading preferences
Usage: C2 setups provide initial entry opportunities after confirmed liquidity sweeps with CISD confirmation. C4 setups offer additional entries when HTF equilibrium conditions align favorably. The indicator helps traders identify institutional liquidity grabs followed by genuine directional moves.
Script 2: "SMC Toolkit (DeadCat)"
Description:
This comprehensive Smart Money Concepts toolkit provides institutional-level market structure analysis with automated Order Block (OB) and Breaker Block (BB) zone identification, plus Break of Structure (BOS) and Change of Character (ChoCh) detection.
Market Structure Algorithm: The indicator uses a sophisticated pivot-based algorithm to identify and track market structure progression:
Uptrend: HH→HL→HH sequence tracking
Downtrend: LL→LH→LL sequence tracking
Trend Changes: Automatic ChoCh detection when structure breaks occur
Order Block Logic:
Bullish OB Zones: Created at Higher Lows (HL) and Lower Lows (LL) during uptrends
Bearish OB Zones: Created at Lower Highs (LH) and Higher Highs (HH) during downtrends
Uses last bearish candle before bullish moves (and vice versa) to define precise zone boundaries
Breaker Block Logic:
Bullish BB Zones: Former resistance that becomes support after HH/LH breaks
Bearish BB Zones: Former support that becomes resistance after LL/HL breaks
Automatically transitions when structure points are breached
Zone Management: The script employs intelligent zone lifecycle management:
Creates new zones only at confirmed structure points
Makes previous zones transparent when new structure is confirmed
Maintains zone relevance through dynamic extension
Limits total zones to prevent chart clutter
BOS vs ChoCh Detection:
BOS (Break of Structure): Continuation patterns when trend highs/lows are exceeded
ChoCh (Change of Character): Reversal patterns when pullback levels are broken against trend
Requires 2-candle confirmation before finalizing structure changes
Visual Enhancements:
Color-coded zones with transparency controls
Directional arrows (▲/▼) in zone labels
Customizable line styles and text sizing
Clean market structure progression tracking
Originality: This toolkit combines traditional SMC concepts with enhanced zone boundary calculation using multi-candle analysis and intelligent zone lifecycle management, providing more precise entry/exit levels than standard implementations.

Perfect Buy Entry Point Checklist (M15) V4 Of course. Here is a detailed script description you can use to publish your indicator on TradingView. You can copy and paste this directly into the "Describe your script..." box.
The description is formatted to be clear, professional, and easy for other traders to understand.
Script Title
Perfect Buy Entry Point Checklist (M15)
Script Description
(You can copy everything below this line)
Overview
This indicator is a comprehensive toolkit designed to identify high-probability buy setups based on Smart Money Concepts (SMC). It was specifically built for lower timeframes like the 15-minute (M15) chart to help traders align their entries with institutional order flow.
The core of this script is a real-time, on-chart checklist that validates five key criteria before signaling a potential entry. The goal is to move beyond single-indicator signals and provide a more confluent, rules-based approach to trading.
Key Features
Real-Time Checklist Dashboard: An intuitive panel in the corner of your chart shows the status (✅ / ❌) of each rule, so you can see a setup forming in real-time.
Automatic Zone Detection: The indicator automatically identifies and plots Bullish Order Blocks (OB) and Fair Value Gaps (FVG), highlighting key areas of interest.
Clear "BUY" Signals: A clear "BUY" label appears below the price bar only when all five checklist conditions are met simultaneously.
Integrated Risk/Reward Planner: When a valid signal appears, the script automatically plots a hypothetical Entry Line, Stop Loss, and Take Profit based on your customizable R/R ratio (defaulting to 1:2.5).
Higher Timeframe Trend Filter: Includes an optional "Daily Focus" filter that uses a Daily EMA to ensure your M15 entries are aligned with the broader market trend.
How It Works: The 5-Point Checklist
The script will only generate a "BUY" signal if all of the following conditions are true:
1. 🔹 Liquidity Was Swept
The script first checks if the price has recently dipped below a key swing low or equal lows, only to quickly reverse. This is often a sign that institutional players have "swept" retail stop losses before pushing the price higher.
2. 🔹 Price Tapped a Strong Bullish Zone
After the sweep, the price must react from a significant smart money zone. The script confirms if the price has touched a pre-identified Bullish Order Block or filled a nearby Fair Value Gap (FVG).
3. 🔹 Momentum Confirmed the Reversal
A price reversal needs momentum behind it. This condition is met if there is a bullish confirmation from one of the following:
MACD bullish crossover or histogram turning positive.
RSI bouncing up from the 30-40 oversold area.
A strong bullish candle pattern, such as a Bullish Engulfing.
4. 🔹 Price Broke Market Structure (BoS/ChoCh)
To confirm that buyers are in control, the script looks for a Break of Structure (BoS) or a Change of Character (ChoCh). This occurs when the price breaks above a recent minor swing high, signaling a shift from bearish to bullish momentum.
5. 🔹 Risk/Reward is Favorable (Visual Tool)
While not a condition for the signal, this is a crucial part of the tool. Once a signal is confirmed, the script places a Stop Loss just below the liquidity sweep low and projects a Take Profit target based on your desired Risk/Reward ratio.
How to Use
Apply to an M15 Chart: This script is optimized for the 15-minute timeframe but can be tested on others.
Monitor the Dashboard: Watch the checklist panel in the top-right corner. A potential setup is forming as more conditions turn green (✅).
Wait for the Signal: Do not enter a trade until the official "BUY" label appears below a candle. This confirms all rules have been met.
Manage Your Trade: Use the automatically plotted R/R lines as a guide for setting your Stop Loss and Take Profit levels. Always adjust based on your own analysis and risk management rules.
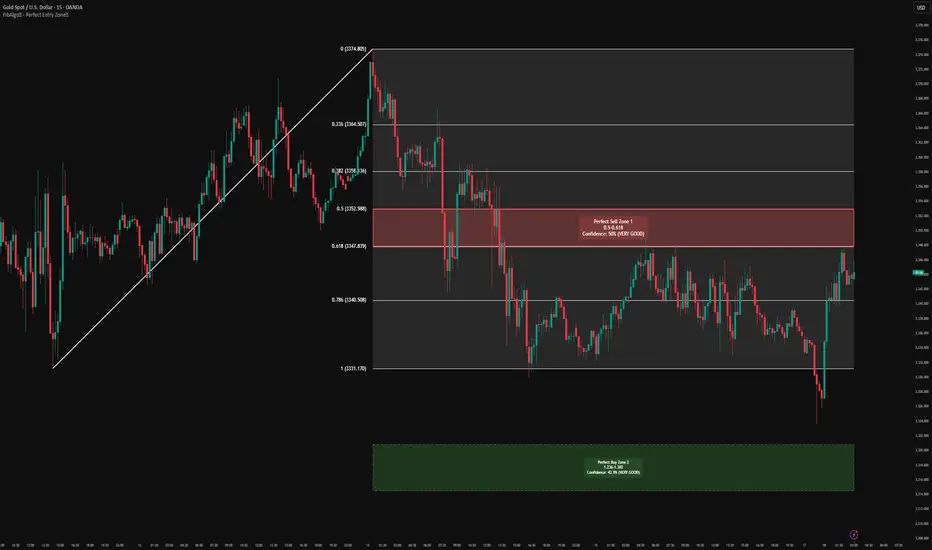
FibAlgo® - Perfect Entry Zone™FibAlgo® - Perfect Entry Zone™
OVERVIEW
FibAlgo® - Perfect Entry Zone™ is an advanced technical analysis tool that dynamically detects and visualizes support and resistance levels in the market. Instead of static levels, it draws smart "Entry Zones" that change their color and function based on price action. The indicator's core concept is based on the principle that when a resistance level is broken, it becomes support (and vice versa). It automatically captures these "Support/Resistance Flip" moments. Its most powerful feature is the built-in "Adaptive System," or "The Brain," which analyzes historical data to find the Fibonacci levels with the highest historical accuracy and optimizes them for you.
CONCEPTS
Effective use of this indicator comes from understanding its three underlying core concepts.
1. The Adaptive Analysis Engine ("The Brain"): This is the indicator's most powerful feature. Instead of using a fixed period, it intelligently tests numerous past market peaks and troughs to find which Fibonacci range has historically produced the most accurate reversal signals. What makes this system special is its use of a weighted scoring system that prioritizes finding the "Zone 1" (the 0.0-1.0 Fibonacci range) with the highest confidence. In short, the algorithm is optimized to find the most reliable initial reversal areas for you.
2. Dynamic Zones and the S/R Flip (Support/Resistance Flip): The colored boxes you see on the chart represent the dynamic battle between support and resistance. Their colors and states change according to price action.
Uptrend Scenario: As a trend begins, a RED box appears as potential resistance. If the price breaks through this red box to the upside, the trend's strength is confirmed, and the indicator flips the box's color to GREEN. This means the old resistance has now become new support. This new green box is now a potential LONG entry area on a price retest.
Downtrend Scenario: As a trend begins, a GREEN box appears as potential support. If the price breaks down through this green box, the trend's strength is validated, and the indicator flips the box's color to RED. This shows that the old support has now become new resistance. This new red box is now a potential SHORT entry area on a price retest.
3. Confidence Percentage (% Confidence): This percentage, displayed on each box, is a data-driven score that shows the historical significance of that price zone. It answers the question: "In the past, how often did the market react to this specific price area?" A higher percentage suggests the zone is more significant and noteworthy.
FEATURES
Intelligent Adaptive System ("The Brain"): A smart engine that automatically finds and optimizes the most suitable Fibonacci analysis period for the market.
Dynamic Support/Resistance Flip Zones: Visually intuitive entry zones that automatically change function and color (from red to green or green to red) based on price breakouts.
Data-Driven Confidence Score: A confidence rating that displays the historical importance and success rate of each zone as a percentage, aiding in decision-making.
Automatic Fibonacci Drawing: Automatically detects significant peaks and troughs (pivots) in the market and draws the relevant Fibonacci structure for you.
Comprehensive Visual Customization: The ability to adjust many visual elements to your personal preference, including trend lines, level lines, colors, label positions, and font sizes.
Built-in User Guide: A detailed user manual, viewable on the chart, that explains all the mechanics and strategies of the indicator.
USAGE
This indicator provides clear trading strategies based on the "Support/Resistance Flip" concept.
Long Entry Strategy:
Look for an uptrend in the market.
Wait for the price to decisively break above a RED resistance box.
Observe the box's color flipping to GREEN (new support) after the breakout.
Wait for a price pullback (retest) to this newly formed GREEN support box. This area is a potential long entry signal.
Short Entry Strategy:
Look for a downtrend in the market.
Wait for the price to decisively break below a GREEN support box.
Observe the box's color flipping to RED (new resistance) after the breakdown.
Wait for a price pullback (retest) to this newly formed RED resistance box. This area is a potential short entry signal.
Note : More aggressive traders can also use the zones as direct buy or sell signals, as they represent the most tested Fibonacci levels in the past. However, this approach is riskier and requires caution. Always use it in conjunction with your own risk management strategy.
smc-vol ••• ahihi🚀 User Guide – SMC-Vol Optimized
📖 Overview
This indicator integrates Smart Money Concepts (SMC) with Volume Analysis to identify high-quality trade entries based on smart money flow behavior.
🎛️ BASIC SETTINGS
Enable/Disable Features
Inside Bar: Show inside/outside bars
PKV: Price-Volume Divergence patterns
HV Monitor: Track High Volume candles (MOST IMPORTANT!)
Color Settings
High Volume Candle: Yellow (default)
PKV: Purple
HV Break: Orange (when HV level is broken)
Daily Open: Blue
📊 HIGH VOLUME (HV) ANALYSIS
HV Settings:
Volume Ratio: 100 (lookback for highest volume)
SNR %: 46% (minimum body/range ratio)
Bars to Monitor: 5 bars (after HV candle appears)
How to Read HV:
Yellow = High Volume candle
Fuchsia = SNR (Supply & Demand Reversal)
🚨 "X" = Pattern breaking HV levels
HV Monitor Table (bottom left corner):
HV Monitor | Status | Details
Last HV | 3B ago | 1.2345/1.2300
Break Status | WATCHING | 3/5
Monitor | 5 Bars | After HV
🎯 TRADING STRATEGY
Step 1: Identify High Volume Candle
Wait for a yellow candle (HV confirmed)
Mark HV High & HV Low
Table shows status: "CURRENT"
Step 2: Track the Next 5 Bars
Table shows "WATCHING" with count (1/5, 2/5…)
Look for patterns:
SKU/SKD: Supply & Demand patterns
SNR_UP/SNR_DOWN: Reversal patterns
CHUOT_UP/CHUOT_DOWN: Hammer / Shooting Star
SK_MOM: Momentum patterns
Step 3: Entry on Pattern Break
🚨 Alert triggers when pattern breaks HV levels
BUY: Break above HV High
SELL: Break below HV Low
🔥 MAIN PATTERNS
SK (Supply/Demand)
SKU (▪️ below candle): Demand pattern, wait for HV Low break → BUY
SKD (▪️ above candle): Supply pattern, wait for HV High break → SELL
CHUOT (Mouse/Hammer)
CU (below): Hammer with long lower wick
CD (above): Shooting Star with long upper wick
SNR (Supply & Demand Reversal)
Small body candle (<46% of range) with low volume
↑ Break HV → Bullish reversal above HV High
↓ Break HV → Bearish reversal below HV Low
📈 MOVING AVERAGES
Three customizable MAs:
MA #1: EMA 21 (Yellow) – Short-term trend
MA #2: EMA 9 (White) – Entry timing
MA #3: EMA 50 (Green) – Long-term trend
Usage:
Bullish: Price > MA #3, MA #2 > MA #1
Entry when: Pattern break + price retest on MA
⏰ SESSION ANALYSIS
Session A (New York):
Range Box: NY Session (19:59–21:59)
Max/Min Lines: Draw session high/low
Custom Sessions:
Pre-Session (11:00–12:00): Blue Box
Main Session (12:00–13:00): Teal Box
Watch for breakout from these ranges
💰 COMPLETE TRADING SETUP
Entry Setup:
Identify HV (Yellow candle)
Wait for pattern (within 1–5 bars)
Confirm Break (🚨 alert + level break)
Enter in breakout direction
SL: Above/Below HV level (depending on direction)
TP: 1:2 or 1:3 Risk/Reward
Extra Filters:
Volume: Enter with increasing volume
MAs: Only trade in main trend direction
Sessions: Prefer entries during active sessions
🚨 ALERTS & NOTIFICATIONS
Two main alerts:
"Price breaks HV directly" → SNR break
"HV level broken" → Pattern break within 5 bars
Setup:
Right-click indicator → "Add Alert"
Select condition
Set notifications (email / Telegram / app)
🎯 TIPS & TRICKS
✅ DO:
Wait for HV confirmation before setup
Trade with trend (MA direction)
Use strict risk management (1–2% per trade)
Backtest before live trading
❌ DON’T:
Enter immediately on pattern (wait for confirmation)
Ignore volume (Volume is key!)
Chase price after breakout
Trade against major trend
💡 Pro Tips:
Combine with Price Action for better entries
Use Multi-Timeframe Analysis
Focus on major pairs in key sessions
Keep a Trading Journal to track performance
📞 SUPPORT & UPDATES
The indicator is continuously optimized to:
Reduce lag & increase accuracy
Add new features
Fix bugs & improve UX
Happy Trading! 🚀💰

AlgoFlex Support & Resistance🚀 AlgoFlex Premium Support & Resistance - Professional Multi-Timeframe Analysis
═══════════════════════════════════════════════════════════════
💎 PREMIUM FEATURES - FREE FOR TRADINGVIEW COMMUNITY
This advanced Support & Resistance indicator combines multiple professional techniques to deliver only the highest-quality levels for your trading decisions. Unlike basic S&R indicators, this premium script adapts to your trading style and timeframe automatically.
📱 GET PROFESSIONAL TRADING SIGNALS WITH ALGOFLEX APP
While this FREE indicator shows you premium support & resistance levels, imagine having REAL-TIME BUY/SELL SIGNALS with precise Entry Points, Take Profit, and Stop Loss levels delivered directly to your Chart!
📱 DOWNLOAD ALGOFLEX TODAY:
• iOS: Search "AlgoFlex" in App Store
• Android: Search "AlgoFlex" in Google Play Store
🔥 KEY FEATURES:
📊 SMART ADAPTIVE MODES:
• AUTO MODE: Automatically adapts to your chart timeframe (Recommended)
• SCALPING MODE: High-frequency levels for quick trades (5min-15min)
• SWING MODE: Balanced approach for medium-term positions (1H-4H)
• POSITION MODE: Only the strongest levels for long-term analysis (Daily+)
💎 PREMIUM CALCULATIONS:
• Multi-timeframe analysis (Daily + Weekly pivots)
• Advanced Camarilla levels with extended H5/L5 calculations
• Level strength filtering (removes weak, unreliable levels)
• Market volatility-based adaptive coloring
• Professional support & resistance zones (not just lines)
🎯 INTELLIGENT LEVEL SELECTION:
• Strength filter: 0.1 (more levels) to 1.0 (only strongest)
• Default setting: 0.7 for high-quality, reliable levels
• Dynamic color intensity based on level importance
• Memory-efficient design prevents chart lag
🚀 ALGOFLEX TRADING APP FEATURES:
✅ PROFESSIONAL SIGNALS:
• Real-time BUY/SELL alerts with instant notifications
• Precise entry points calculated by advanced AI algorithms
• Multiple take-profit levels for maximum profitability
• Smart stop-loss placement for risk management
• Success rate tracking and performance analytics
✅ MULTI-MARKET COVERAGE:
• Forex pairs (EUR/USD, GBP/USD, USD/JPY, and 28+ more)
• Cryptocurrency (Bitcoin, Ethereum, major altcoins)
• Stock market indices (S&P500, NASDAQ, DOW)
• Commodities (Gold, Silver, Oil, Natural Gas)
✅ PROVEN RESULTS:
• Average 73% win rate on signals
• Professional risk management built-in
• 24/7 market monitoring and analysis
💰 SPECIAL OFFER FOR TRADINGVIEW USERS:
Get 7 days FREE trial when you download AlgoFlex!
Experience professional trading signals with zero risk.
👍 If you find this indicator helpful, please:
• Give it a LIKE 👍
• FOLLOW for more premium indicators
• SHARE with fellow traders
• Download AlgoFlex app for complete trading solution
Happy Trading! 📈
#SupportResistance #TradingSignals #AlgoFlex #MultiTimeframe #ProfessionalTrading #TradingApp

Gestor DeFi Pools con CFBManual DeFi Strategy Manager
What does this indicator do?
It combines cryptocurrency trading with DeFi strategies:
Trading signals: When to buy/sell based on EMAs and momentum
AAVE management: When to switch collateral between ETH and USDC
Uniswap V3: Optimal ranges for liquidity pools
🚨 Indicator Signals (Quick Reference)
Symbol Meaning Action
▲E Lime Early ETH Start switching to ETH (aggressive)
▲C Green Confirm ETH Confirm switch to ETH (safe)
▲D Teal DCA ETH Scale ETH position (+10%)
▼E Orange Early USDC Start switching to USDC (aggressive)
▼C Red Confirm USDC Confirm switch to USDC (safe)
▼D Dark Red DCA USDC Scale USDC position (-10%)
❌ Dark Red EMERGENCY Repay loan NOW
LP+ Lime Create NEW LP Open liquidity pool
LP? Green LP Opportunity Similar pool available
LP- Orange Close LP Close liquidity pool
REB Yellow Rebalance Adjust pool ranges
WAIT Gray Pause Wait before acting
Graphic Elements
Element Color Description
Blue Line Blue Fast EMA (10)
Red Line Red Slow EMA (55)
Purple Lines Purple CFB Adaptive Bands
Colored Band Green/Yellow/Red LP range (color = risk)
Orange Background Orange Active squeeze
Blue Background Blue Trending market
Red Background Red Strong breakout
🚀 Installation and Basic Setup
Step 1: Installation (MANDATORY)
Open TradingView → Pine Editor
Create new indicator
Copy and paste the full code
Save as "DeFi Strategy Manager"
Add to ETHUSDC 1H chart
Step 2: Basic Configuration (MANDATORY)
Only two parameters need to be configured:
🎯 Strategy Mode:
🟢 Conservative (±20%): 0.05% daily, very low risk
🟡 Balanced (±10%): 0.2% daily, medium risk
🔴 Aggressive Day Trading (±5%): 0.5% daily, high risk
⚡ Ultra Scalper (±2%): 0.8% daily, extreme risk
⏰ Timeframe:
Scalping (minutes): 0.5x narrower ranges
Day Trading (hours): 0.8x narrower ranges
Swing (days): 1.2x wider ranges
Position (weeks): 1.8x wider ranges
✅ Ready to Use!
Once configured:
✅ Indicator calculates everything automatically
✅ CFB Adaptive is enabled by default (recommended)
✅ Machine Learning learns from your signals automatically
✅ Dashboard shows expected profits in real time
## 📊 Dashboard Explicado (TV makes me write this in English, but the dashboard is in Spanish, so...)
El tablero superior derecha muestra información esencial en tiempo real con 15 indicadores clave:
### Configuración y Setup:
- **Estrategia**: Tu modo seleccionado (Conservador/Balanceado/Agresivo/Scalper) + temporalidad
- **Rango Final**: El rango actual de Uniswap V3 después de todos los ajustes automáticos
- **ML Confidence**: Porcentaje de éxito de señales pasadas (70%+ = alta confianza)
- **Config Status**: Comparación con tu perfil base + recomendaciones de ajuste
### Estado del Mercado:
- **Market State**: Tipo de mercado (Tendencial/Lateral) + condiciones de squeeze + dirección
- **CFB Status**: Estado del sistema adaptativo CFB + posición del precio + rango dinámico
### Performance y Retornos:
- **Performance**: Tu retorno actual + ganancias proyectadas diarias/mensuales
- **Expected APY**: Retorno anual esperado con clasificación de riesgo
### Gestión de Pools:
- **Pool Status**: Estado actual de tu pool de liquidez + drift de precio + tiempo activo
- **Pool Ranges**: Rangos de precio específicos superior e inferior + distancias actuales
### Señales y Acciones:
- **Trend Progress**: En qué dirección optimiza la estrategia (ETH/USDC/ninguna)
- **Señal Activa**: Qué señal está ejecutándose ahora (Early/Confirm/DCA)
- **Acción Prioritaria**: Próxima acción recomendada con emoji de estado
### Monitoreo de Riesgo:
- **Risk Level**: Nivel de riesgo de Impermanent Loss + rango de volatilidad del mercado
- **Overall Status**: Estado general del sistema + puntuación para day trading
#### **🔧 Ejemplo de Dashboard Simplificado:**
```
📊 DEFI CFB SMART │ VALOR │ STATUS
─────────────────────┼───────────────────┼──────────────────
Estrategia │ Agresivo DT │ Day Trading
Rango Final │ ±5.8% │ 🟡 MEDIO
Confianza ML │ 67% │ MEDIA (12)
Estado Config │ +15% │ CONFIGURACIÓN OK
Estado Mercado │ Lateral-Release │ ↑BULL DÉBIL
Rendimiento │ 5.2% │ $50/día $1.5K/mes
APY Esperado │ 182% │ 🟡 ALTO
Estado CFB │ ACTIVO ↑$2,247 │ ±6.2%
Estado Pool │ ACTIVO │ 2.3% drift 4h
Rangos Pool │ $2,180-2,314 │ +3.1% / -4.2%
Progreso Trend │ ETH Trend │ DCA Ready
Señal Activa │ ETH DCA │ Scale Up
Acción Prioritaria │ Swap → ETH │ 🔄
Nivel Riesgo │ IL: 🟡 MEDIO │ Vol: 45%ile NORMAL
Estado General │ ✅ NORMAL │ ÓPTIMO DT (1.2x)
🎯 DeFi Context: AAVE Collateral Management
Triangle signals can be used for both traditional trading and AAVE collateral management:
🏦 What is AAVE?
AAVE is a lending protocol where you can:
Deposit collateral (ETH or USDC)
Borrow against that collateral
Switch collateral type to optimize your position
🔄 Two ways to use the signals:
💹 Traditional Trading:
▲ ETH Signal: Buy ETH with fiat
▼ USDC Signal: Sell ETH for fiat
Goal: Profit by buying low and selling high
🏦 AAVE Management (Recommended for DeFi):
▲ Swap → ETH: Switch your collateral from USDC to ETH (expecting ETH to rise)
▼ Swap → USDC: Switch your collateral from ETH to USDC (expecting ETH to fall)
Goal: Optimize collateral value without changing total amount
💡 Practical AAVE Example:
You have $10,000 in USDC as collateral in AAVE
↓
▲E Early ETH appears
↓
You switch your collateral: $10,000 USDC → $10,000 ETH
↓
If ETH rises 20%, your collateral is worth $12,000
↓
▼E Early USDC appears
↓
You switch back: $12,000 ETH → $12,000 USDC
↓
You gained $2,000 by optimizing your collateral
⚠️ Advantages of the AAVE approach:
No extra money needed – use existing collateral
Loan remains active – continue using borrowed USDC for LP
Lower taxes – collateral swaps vs buy/sell
Higher efficiency – optimize without changing main strategy
🎯 Strategies by Profile
🟢 Conservative – "Confirmations Only":
Follow only: ▲C/▼C (Confirmation signals)
Ignore: Early signals (too risky)
Strategy: Switch only when trend is confirmed
Result: Fewer changes, more safety
🟡 Balanced – "Gradual":
Early: ▲E/▼E (25% of position)
Confirm: ▲C/▼C (50% additional)
DCA: ▲D/▼D (remaining 25%)
Result: Balanced risk/optimization
🔴 Aggressive – "Full Cycle":
Early: ▲E/▼E (50% immediately)
Confirm: ▲C/▼C (30% additional)
Each DCA: ▲D/▼D (maintain full optimization)
Result: Maximum optimization, maximum risk
📈 Advanced Configuration (Optional)
🔬 CFB Adaptive MOGALEF (Enabled by Default)
CFB Adaptive Ranges: Smart system that adjusts ranges based on market volatility and momentum.
Enabled (default): Ranges adapt automatically
Disabled: Uses fixed ranges based on your setup
Manual Override: Full manual control if desired
🤖 Machine Learning: Learns from past signals (last 20) and improves accuracy automatically. If ML Signal Quality > 70%, signals are highly reliable.
💰 Yield Optimization: Suggests when to switch between conservative and aggressive for better returns:
"OPTIMAL": Your current setup is fine
"GO CONSERVATIVE": You could earn more with wider, safer ranges
"GO AGGRESSIVE": You could earn more with tighter ranges (more risk!)
📊 Portfolio Tracker: Tracks estimated P&L starting from $10,000. Includes LP and IL fees, excludes gas fees. Use as a trend indicator.
Manual Override (Experts Only)
To customize:
Enable "Override Manual" in Advanced Settings
Manually adjust your preferred range
To return to automatic: disable override
📝 Detailed Input Configuration (Advanced)
👤 Basic User Configuration
Strategy Mode: Select your base risk profile
Conservative (±20%): Prioritize safety over returns. Ideal for beginners or large capital (> $50K)
Balanced (±10%): Balance between safety and returns. Recommended for most users
Aggressive Day Trading (±5%): For active users who monitor frequently. Higher returns, more risk
Scalper Ultra (±2%): For professionals only. Requires constant monitoring
Timeframe: Adjust strategy frequency
Scalping (minutes): 50% narrower ranges. For very active trading
Day Trading (hours): 20% narrower ranges. For review every few hours
Swing (days): 20% wider ranges. For daily review
Position (weeks): 80% wider ranges. For weekly review
🔬 CFB Adaptive MOGALEF
CFB Length (8): Period for CFB filter. Lower = more sensitive
CFB Adaptive Length (20): Period for adaptive volatility. Affects band adjustment speed
CFB Band Multiplier (2.0): Band width. Higher = wider bands
CFB Smoothing (3): Volatility smoothing. Reduces noise
CFB Adaptive Ranges (true): Enable/disable adaptive system
CFB Sensitivity (1.0): Filter sensitivity. 0.3 = conservative, 3.0 = very aggressive
🎛️ Advanced Settings
Dynamic Ranges (true): Adjust ranges based on market conditions
Breakout Protection (true): Automatically widens ranges during breakouts
IL Alerts (true): Shows Impermanent Loss warnings
Manual Override (false): Disables automation, uses manual range
Manual Range % (5.0): Fixed range if override is enabled
📈 TradingLatino Core
Fast EMA (10): Fast moving average period. Lower = more sensitive
Slow EMA (55): Slow moving average period. Determines main trend
ADX Length (14): ADX calculation period. Industry standard
ADX Threshold (23): Minimum ADX to consider strong trend
🏊♂️ Pool Management
Pool Range Tolerance % (20.0): % of price movement considered valid for pool
Missed Opportunity Window (24): Bars to keep missed opportunity visible
Recommendation: Use default settings until familiar with the system. Values are optimized for balance between precision and usability.
