Divergence Macro Sentiment Indicator (DMSI)The Divergence Macro Sentiment Indicator (DMSI)
Think of DMSI as your daily “mood ring” for the markets. It boils down the tug-of-war between growth assets (S&P 500, copper, oil) and safe havens (gold, VIX) into one clear histogram—so you instantly know if the bulls have broad backing or are charging ahead with one foot tied behind.
🔍 What You’re Seeing
Green bars (above zero): Risk-on conviction.
Equities and commodities are rallying while gold and volatility retreat.
Red bars (below zero): Risk-off caution.
Gold or VIX are climbing even as stocks rise—or stocks aren’t fully joined by oil/copper.
Zero line: The line in the sand between “full-steam ahead” and “proceed with care.”
📈 How to Read It
Cross-Zero Signals
Bullish trigger: DMSI flips up through zero after a red stretch → fresh long entries.
Bearish trigger: DMSI tumbles below zero from green territory → tighten stops or go defensive.
Divergence Warnings
If SPX makes new highs but DMSI is rolling over (lower green bars or red), that’s your early red flag—rallies may fizzle.
Strength Confirmation
On pullbacks, only buy dips when DMSI ≥ 0. When DMSI is deeply positive, you can be more aggressive on position size or add leverage.
💡 Trade Guidance & Use Cases
Trend Filter: Only take your S&P or sector-ETF long setups when DMSI is non-negative—avoids hollow rallies.
Macro Pair Trades:
Deep red DMSI: go long gold or gold miners (GLD, GDX).
Strong green DMSI: lean into cyclicals, industrials, even energy names.
Risk Management:
Scale out as DMSI fades into negative territory mid-trade.
Scale in or add to winners when it stays bullish.
Swing Confirmation: Overlay on any oscillator or price-pattern system—accept signals only when the macro tide is flowing in your favour.
🚀 Why It Works
Markets don’t move in a vacuum. When stocks rally but the “real-economy” metals and volatility aren’t cooperating, something’s off under the hood. DMSI catches those cross-asset cracks before price alone can—and gives you an early warning system for smarter entries, tighter risk, and bigger gains when the macro trend really kicks in.
"smart" için komut dosyalarını ara

Ceres Trader Simple Trend & Momentum SignalsCeres Trader – Simple Trend & Momentum Signals
Description:
Cut through chart noise with a lightweight, two-factor signal system that combines a classic trend filter (200 EMA) with momentum confirmation (smoothed RSI as a QQE proxy). This indicator plots clean entry arrows—no background shading, no clutter—so you can trade only in the high-probability regime:
Trend Filter: 200-period exponential moving average
Momentum Filter: RSI(14) smoothed over N bars, offset by 50 to create a zero-line
Long Entry: Price above the 200 EMA and the smoothed RSI crosses up through zero → green up-arrow below bar
Short Entry: Price below the 200 EMA and the smoothed RSI crosses down through zero → red down-arrow above bar
Key Features:
Minimalist display: only the 200 EMA and entry arrows
Customizable inputs: EMA length, RSI length, RSI smoothing period
Ultra-low CPU load: suitable for lower timeframes (e.g. 1 min gold futures)
Yellow label text: for optimal visibility on dark or light chart backgrounds
How to Use:
Add the script to your TradingView chart.
Choose your timeframe and adjust inputs as needed.
Take only the long signals when price is above the EMA, and only the short signals when price is below.
Place stops just beyond the EMA; targets can be measured swings or fixed R-multiples.
Notes:
Designed as a regime-based entry filter—no exits or background fills included.
Feel free to combine with your own stop-loss, take-profit, and money-management rules.
Trade smarter, not harder—let the market tell you only when both trend and momentum align.

ADX Supertrend | [DeV]The "ADX Supertrend" indicator is a user-friendly tool that blends two popular trading indicators—the Supertrend and the Average Directional Index (ADX)—to help traders spot trends and make smarter trading decisions. By combining these two, it offers a clearer picture of when a market is trending strongly and in which direction, while cutting down on misleading signals. Here’s a straightforward explanation of how each part works, how they team up, the benefits of using them together, and why the ADX makes the Supertrend even better.
Supertrend:
It's like a guide that follows the market’s price movements to tell you whether prices are trending up or down. It creates two lines, one above and one below the price, based on how much the market is bouncing around (its volatility). When the price moves above the upper line, it signals an uptrend (a good time to buy), and the indicator draws a line below the price to show support. When the price drops below the lower line, it signals a downtrend (a potential time to sell), and the line appears above the price as resistance. The Supertrend is great because it adjusts to market conditions, widening the gap between lines in wild markets and tightening it in calm ones.
Average Directional Index:
The ADX is all about measuring how strong a trend is, without caring whether it’s going up or down. Think of it as a meter that tells you if the market is charging forward with purpose or just drifting aimlessly. It uses a scale from 0 to 100, where higher numbers mean a stronger trend. For example, an ADX above 25 often suggests a solid trend worth paying attention to, while a low ADX signals a sleepy, sideways market. The ADX also looks at whether buyers or sellers are in control to confirm the trend’s direction.
Confluence:
The Supertrend is great at spotting trends, but it can be a bit trigger-happy, giving signals in markets that aren’t really trending. That’s where the ADX shines. It acts like a quality control check, making sure the Supertrend’s signals only count when the market is moving with conviction. By filtering out weak or messy trends, the ADX helps you avoid wasting time on trades that fizzle out. It also double-checks the trend’s direction, so you’re not just guessing whether buyers or sellers are in charge. This teamwork means you get signals that are more reliable and less likely to lead you astray, especially in tricky markets where prices bounce around without a clear path.
Multi-VWAP System🚀 Multi-VWAP System — Anchored VWAP & Deviation Bands
Overview
The Multi-VWAP System provides traders with a professional-grade approach to anchored VWAP analysis. Inspired by Brian Shannon's pioneering work on Anchored VWAP, this indicator automatically calculates and plots:
Current Session VWAP
Previous Session VWAP (also known as "2-Day VWAP")
High-of-Day (HOD) Anchored VWAP
Each VWAP can also display optional Standard Deviation Bands to highlight statistically significant deviations from the volume-weighted average price.
🔍 Why Anchored VWAP Matters
Volume Weighted Average Price (VWAP) is among the most critical institutional indicators, as it represents the average price paid for a stock adjusted by trading volume. This makes VWAP crucial for identifying fair value and significant areas of institutional activity.
Institutions utilize VWAP extensively to guide their execution algorithms. For instance, if price dips below a 2-day anchored VWAP (anchored to the previous session's open), many institutions interpret this as a discounted entry, potentially triggering large-scale buy programs. Conversely, sustained movement above VWAP signals strong buying pressure and bullish sentiment.
📌 Why Multiple Anchors?
Traders commonly anchor VWAPs at critical reference points:
Current Session VWAP:
Essential for day traders as a reference for intraday sentiment. Price action above this line generally indicates bullish sentiment, while price below signals bearish sentiment.
Previous Session (2-Day) VWAP:
Heavily used by institutions and swing traders, it provides insight into multi-session sentiment. Institutions commonly activate buy or sell programs based on whether price is trading at a premium or discount relative to this VWAP.
High-of-Day (HOD) VWAP:
Frequently used by momentum traders, this anchor captures sentiment after the most recent intraday high. Price above the HOD VWAP suggests sustained bullish momentum, while price below might signal weakening momentum.
🌟 Standard Deviation Bands
Each anchored VWAP in this indicator includes optional Standard Deviation Bands, highlighting statistical extremes. Traders use these bands to:
Identify potentially overextended moves (beyond +2σ or +3σ).
Gauge momentum strength (holding above +1σ).
Spot mean-reversion setups when price returns to VWAP after extreme moves.
🎨 Dynamic Background and Momentum Colorization
To visually highlight strength or weakness in price action relative to VWAP:
Dynamic Background Fill between Current and Previous VWAPs:
Green background appears when the Current VWAP is above the Previous VWAP and the linear regression slope (adjustable length) is positive, indicating bullish sentiment.
Red background appears when the Current VWAP is below the Previous VWAP and the slope is negative, indicating bearish sentiment.
No fill when conditions are mixed or momentum is uncertain.
Gold Fill above HOD VWAP:
When price action is above the High-of-Day VWAP and momentum (linear regression slope) is positive, a subtle gold shading appears, quickly highlighting bullish momentum.
⚙ Fully Customizable Settings
Session Times: Adjust session start and end times to match your specific market hours.
Standard Deviation Bands: Enable or disable each VWAP’s deviation bands individually and select how many bands (1σ, 2σ, or 3σ) you'd like to display.
Momentum Slope Length: Adjustable lookback for linear regression slope calculation—giving you full control of trend sensitivity.
🎯 Who Should Use This Indicator?
This indicator is perfect for:
Day Traders who want quick insights into intraday sentiment shifts.
Swing Traders tracking institutional footprints and seeking optimal entry/exit points.
Momentum Traders who rely on clearly visible momentum signals from HOD anchored VWAPs.
Institutional Traders and Professionals seeking sophisticated, institutionally-inspired VWAP analysis without manual anchoring.
📈 Summary of Features
✅ Automatic VWAP Anchors (Current Session, Previous Session, High-of-Day)
✅ Optional Standard Deviation Bands for each VWAP anchor
✅ Dynamic Background Coloring based on price action and momentum conditions
✅ Gold Momentum Highlight for quick bullish momentum identification above HOD VWAP
✅ Fully Customizable Inputs for precise personalization and flexibility
📢 Conclusion
The Multi-VWAP System isn't just another VWAP indicator. It's an institutional-level, dynamic, multi-dimensional analysis tool inspired by the work of Brian Shannon and leading institutional traders. It takes the guesswork out of anchoring and analysis, leaving you free to focus on identifying and executing high-probability trade setups.
Enjoy trading smarter—not harder. Happy Trading! 🚀📊

Volume Intelligence Suite (VIS) v2📊 Volume Intelligence Suite – Smart Volume, Smart Trading
The Volume Intelligence Suite is a powerful, all-in-one TradingView indicator designed to give traders deeper insight into market activity by visualizing volume behavior with price action context. Whether you're a scalper, day trader, or swing trader, this tool helps uncover hidden momentum, institutional activity, and potential reversals with precision.
🔍 Key Features:
Dynamic Volume Zones – Highlights high and low volume areas to spot accumulation/distribution ranges.
Volume Spikes Detector – Automatically marks abnormal volume bars signaling potential breakout or trap setups.
Smart Delta Highlighting – Compares bullish vs bearish volume in real time to reveal buyer/seller strength shifts.
Session-Based Volume Profiling – Breaks volume into key trading sessions (e.g., London, New York) for clearer context.
Volume Heatmap Overlay – Optional heatmap to show intensity and velocity of volume flow per candle.
Custom Alerts – Built-in alerts for volume surges, divergences, and exhaustion signals.
Optimized for Kill Zone Analysis – Pairs perfectly with ICT-style session strategies and Waqar Asim’s trading methods.
🧠 Why Use Volume Intelligence?
Most traders overlook the story behind each candle. Volume Intelligence Suite helps you "see the why behind the move" — exposing key areas of interest where smart money may be active. Instead of reacting late, this tool puts you in position to anticipate.
Use it to:
Validate breakouts
Detect fakeouts and liquidity grabs
Confirm bias during kill zones
Analyze volume divergence with price swings
⚙️ Fully Customizable:
From volume thresholds to visual styles and session timings, everything is user-adjustable to fit your market, timeframe, and strategy.
✅ Best For:
ICT/Smart Money Concepts (SMC) traders
Breakout & reversal traders
Kill zone session scalpers
Institutional footprint followers

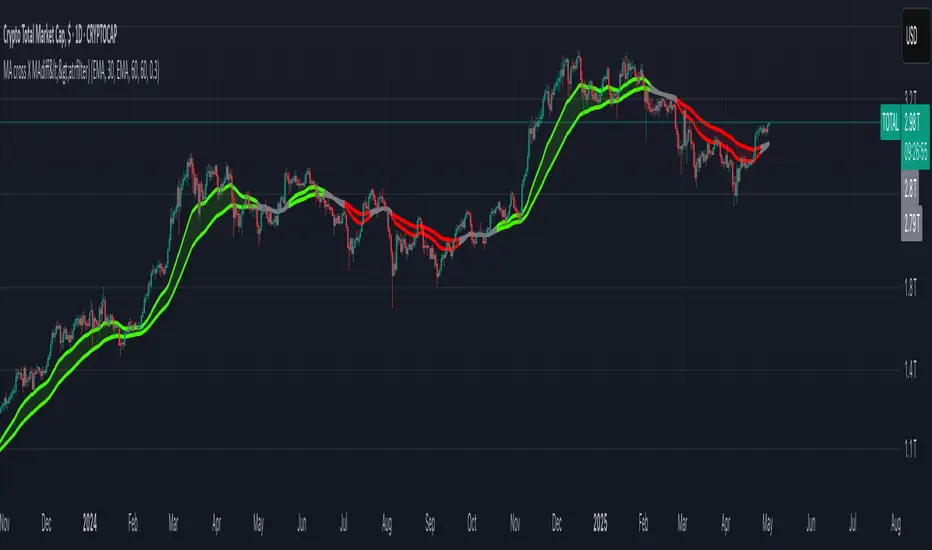
MA cross X MAdiff<>atrfilter)📈 MA cross X MAdiff<>ATR filter
Smarter Trend Confirmation Using Adaptive Volatility Thresholds
🔍 What It Does
This indicator upgrades classic moving average crossovers by adding volatility awareness via ATR filtering. Instead of reacting to every small crossover, it waits for the distance between two moving averages to exceed a volatility-adjusted threshold, making signals more meaningful and less noisy.
⚙️ Core Logic
Calculates the difference between a Fast MA and a Slow MA.
Uses Average True Range (ATR) as a dynamic volatility filter.
Confirms trend only when MA difference exceeds:
diff > ATR × multiplier → Bullish
diff < -ATR × multiplier → Bearish
Otherwise: Neutral (gray zone)
The gray zone avoids false signals by detecting indecision or choppy markets.
🧠 Customizable Inputs
Choose any MA type independently for Fast and Slow:
SMA, EMA, WMA, VWMA, RMA, DEMA, TEMA, LSMA, Kijun
Control sensitivity via:
ATR Length
ATR Multiplier
✅ Why It Works
Reduces fake outs in ranging markets.
Adapts to volatility automatically.
Fully customizable for any asset or style.
Ideal for trend traders, momentum entries, or as a confluence layer.
London/NY Sessions + SMC Levels📜 Indicator Description: London/NY Sessions + SMC Levels
Overview: This indicator highlights the key trading sessions — London, New York, NY Lunch, and Asian Range — providing structured visual guides based on Smart Money Concepts (SMC) and ICT principles.
It dynamically plots:
Session Backgrounds and Boxes for London, NY, Lunch, and Asian sessions
Reference Levels for the High, Low, and Close from today, previous day, or weekly data
Midnight Open line for ICT-style power of three setups
Real-time alerts for session starts, session closes, and important price level crossings
Features:
🕰️ Session Visualization:
Toggle London, NY, Lunch, and Asian session ranges individually, with customizable colors and transparent backgrounds.
🔔 Built-in Alerts:
Alerts for:
Price crossing the previous day's high/low
Price crossing the Midnight Open
Start and end of major sessions (London, NY, Lunch, Asian)
🟩 Reference Levels:
Plot selectable session reference levels:
Today’s intraday High/Low/Close
Previous Day’s High/Low/Close
This Week’s or Previous Week’s levels for broader context.
🌙 Midnight Open:
Track the Midnight New York Open as a reference point for daily bias shifts.
🎯 Customizable Settings:
Choose your session time zones (UTC, New York, London, etc.)
Customize all border colors, background colors, and session hours.
Use Cases:
Identify killzones and optimal trade entry windows for Smart Money Concepts (SMC) and ICT strategies.
Monitor liquidity pool sweeps and session transitions.
Confirm or refine your intraday or swing trading setups by referencing session highs/lows.
Recommended For:
ICT traders
Smart Money Concepts (SMC) practitioners
Forex, indices, crypto, and futures traders focusing on session-based volatility patterns
Anyone wanting a clean, professional session mapping tool
📈
Designed to help you trade with session precision and Smart Money accuracy.
Integrates seamlessly into any ICT, Wyckoff, or Liquidity-based trading approach.

Dskyz (DAFE) Aurora Divergence – Quant Master Dskyz (DAFE) Aurora Divergence – Quant Master
Introducing the Dskyz (DAFE) Aurora Divergence – Quant Master , a strategy that’s your secret weapon for mastering futures markets like MNQ, NQ, MES, and ES. Born from the legendary Aurora Divergence indicator, this fully automated system transforms raw divergence signals into a quant-grade trading machine, blending precision, risk management, and cyberpunk DAFE visuals that make your charts glow like a neon skyline. Crafted with care and driven by community passion, this strategy stands out in a sea of generic scripts, offering traders a unique edge to outsmart institutional traps and navigate volatile markets.
The Aurora Divergence indicator was a cult favorite for spotting price-OBV divergences with its aqua and fuchsia orbs, but traders craved a system to act on those signals with discipline and automation. This strategy delivers, layering advanced filters (z-score, ATR, multi-timeframe, session), dynamic risk controls (kill switches, adaptive stops/TPs), and a real-time dashboard to turn insights into profits. Whether you’re a newbie dipping into futures or a pro hunting reversals, this strat’s got your back with a beginner guide, alerts, and visuals that make trading feel like a sci-fi mission. Let’s dive into every detail and see why this original DAFE creation is a must-have.
Why Traders Need This Strategy
Futures markets are a battlefield—fast-paced, volatile, and riddled with institutional games that can wipe out undisciplined traders. From the April 28, 2025 NQ 1k-point drop to sneaky ES slippage, the stakes are high. Meanwhile, platforms are flooded with unoriginal, low-effort scripts that promise the moon but deliver noise. The Aurora Divergence – Quant Master rises above, offering:
Unmatched Originality: A bespoke system built from the ground up, with custom divergence logic, DAFE visuals, and quant filters that set it apart from copycat clutter.
Automation with Precision: Executes trades on divergence signals, eliminating emotional slip-ups and ensuring consistency, even in chaotic sessions.
Quant-Grade Filters: Z-score, ATR, multi-timeframe, and session checks filter out noise, targeting high-probability reversals.
Robust Risk Management: Daily loss and rolling drawdown kill switches, plus ATR-based stops/TPs, protect your capital like a fortress.
Stunning DAFE Visuals: Aqua/fuchsia orbs, aurora bands, and a glowing dashboard make signals intuitive and charts a work of art.
Community-Driven: Evolved from trader feedback, this strat’s a labor of love, not a recycled knockoff.
Traders need this because it’s a complete, original system that blends accessibility, sophistication, and style. It’s your edge to trade smarter, not harder, in a market full of traps and imitators.
1. Divergence Detection (Core Signal Logic)
The strategy’s core is its ability to detect bullish and bearish divergences between price and On-Balance Volume (OBV), pinpointing reversals with surgical accuracy.
How It Works:
Price Slope: Uses linear regression over a lookback (default: 9 bars) to measure price momentum (priceSlope).
OBV Slope: OBV tracks volume flow (+volume if price rises, -volume if falls), with its slope calculated similarly (obvSlope).
Bullish Divergence: Price slope negative (falling), OBV slope positive (rising), and price above 50-bar SMA (trend_ma).
Bearish Divergence: Price slope positive (rising), OBV slope negative (falling), and price below 50-bar SMA.
Smoothing: Requires two consecutive divergence bars (bullDiv2, bearDiv2) to confirm signals, reducing false positives.
Strength: Divergence intensity (divStrength = |priceSlope * obvSlope| * sensitivity) is normalized (0–1, divStrengthNorm) for visuals.
Why It’s Brilliant:
- Divergences catch hidden momentum shifts, often exploited by institutions, giving you an edge on reversals.
- The 50-bar SMA filter aligns signals with the broader trend, avoiding choppy markets.
- Adjustable lookback (min: 3) and sensitivity (default: 1.0) let you tune for different instruments or timeframes.
2. Filters for Precision
Four advanced filters ensure signals are high-probability and market-aligned, cutting through the noise of volatile futures.
Z-Score Filter:
Logic: Calculates z-score ((close - SMA) / stdev) over a lookback (default: 50 bars). Blocks entries if |z-score| > threshold (default: 1.5) unless disabled (useZFilter = false).
Impact: Avoids trades during extreme price moves (e.g., blow-off tops), keeping you in statistically safe zones.
ATR Percentile Volatility Filter:
Logic: Tracks 14-bar ATR in a 100-bar window (default). Requires current ATR > 80th percentile (percATR) to trade (tradeOk).
Impact: Ensures sufficient volatility for meaningful moves, filtering out low-volume chop.
Multi-Timeframe (HTF) Trend Filter:
Logic: Uses a 50-bar SMA on a higher timeframe (default: 60min). Longs require price > HTF MA (bullTrendOK), shorts < HTF MA (bearTrendOK).
Impact: Aligns trades with the bigger trend, reducing counter-trend losses.
US Session Filter:
Logic: Restricts trading to 9:30am–4:00pm ET (default: enabled, useSession = true) using America/New_York timezone.
Impact: Focuses on high-liquidity hours, avoiding overnight spreads and erratic moves.
Evolution:
- These filters create a robust signal pipeline, ensuring trades are timed for optimal conditions.
- Customizable inputs (e.g., zThreshold, atrPercentile) let traders adapt to their style without compromising quality.
3. Risk Management
The strategy’s risk controls are a masterclass in balancing aggression and safety, protecting capital in volatile markets.
Daily Loss Kill Switch:
Logic: Tracks daily loss (dayStartEquity - strategy.equity). Halts trading if loss ≥ $300 (default) and enabled (killSwitch = true, killSwitchActive).
Impact: Caps daily downside, crucial during events like April 27, 2025 ES slippage.
Rolling Drawdown Kill Switch:
Logic: Monitors drawdown (rollingPeak - strategy.equity) over 100 bars (default). Stops trading if > $1000 (rollingKill).
Impact: Prevents prolonged losing streaks, preserving capital for better setups.
Dynamic Stop-Loss and Take-Profit:
Logic: Stops = entry ± ATR * multiplier (default: 1.0x, stopDist). TPs = entry ± ATR * 1.5x (profitDist). Longs: stop below, TP above; shorts: vice versa.
Impact: Adapts to volatility, keeping stops tight but realistic, with TPs targeting 1.5:1 reward/risk.
Max Bars in Trade:
Logic: Closes trades after 8 bars (default) if not already exited.
Impact: Frees capital from stagnant trades, maintaining efficiency.
Kill Switch Buffer Dashboard:
Logic: Shows smallest buffer ($300 - daily loss or $1000 - rolling DD). Displays 0 (red) if kill switch active, else buffer (green).
Impact: Real-time risk visibility, letting traders adjust dynamically.
Why It’s Brilliant:
- Kill switches and ATR-based exits create a safety net, rare in generic scripts.
- Customizable risk inputs (maxDailyLoss, dynamicStopMult) suit different account sizes.
- Buffer metric empowers disciplined trading, a DAFE signature.
4. Trade Entry and Exit Logic
The entry/exit rules are precise, filtered, and adaptive, ensuring trades are deliberate and profitable.
Entry Conditions:
Long Entry: bullDiv2, cooldown passed (canSignal), ATR filter passed (tradeOk), in US session (inSession), no kill switches (not killSwitchActive, not rollingKill), z-score OK (zOk), HTF trend bullish (bullTrendOK), no existing long (lastDirection != 1, position_size <= 0). Closes shorts first.
Short Entry: Same, but for bearDiv2, bearTrendOK, no long (lastDirection != -1, position_size >= 0). Closes longs first.
Adaptive Cooldown: Default 2 bars (cooldownBars). Doubles (up to 10) after a losing trade, resets after wins (dynamicCooldown).
Exit Conditions:
Stop-Loss/Take-Profit: Set per trade (ATR-based). Exits on stop/TP hits.
Other Exits: Closes if maxBarsInTrade reached, ATR filter fails, or kill switch activates.
Position Management: Ensures no conflicting positions, closing opposites before new entries.
Built To Be Reliable and Consistent:
- Multi-filtered entries minimize false signals, a stark contrast to basic scripts.
- Adaptive cooldown prevents overtrading, especially after losses.
- Clean position handling ensures smooth execution, even in fast markets.
5. DAFE Visuals
The visuals are a DAFE hallmark, blending function with clean flair to make signals intuitive and charts stunning.
Aurora Bands:
Display: Bands around price during divergences (bullish: below low, bearish: above high), sized by ATR * bandwidth (default: 0.5).
Colors: Aqua (bullish), fuchsia (bearish), with transparency tied to divStrengthNorm.
Purpose: Highlights divergence zones with a glowing, futuristic vibe.
Divergence Orbs:
Display: Large/small circles (aqua below for bullish, fuchsia above for bearish) when bullDiv2/bearDiv2 and canSignal. Labels show strength (0–1).
Purpose: Pinpoints entries with eye-catching clarity.
Gradient Background:
Display: Green (bullish), red (bearish), or gray (neutral), 90–95% transparent.
Purpose: Sets the market mood without clutter.
Strategy Plots:
- Stop/TP Lines: Red (stops), green (TPs) for active trades.
- HTF MA: Yellow line for trend context.
- Z-Score: Blue step-line (if enabled).
- Kill Switch Warning: Red background flash when active.
What Makes This Next-Level?:
- Visuals make complex signals (divergences, filters) instantly clear, even for beginners.
- DAFE’s unique aesthetic (orbs, bands) sets it apart from generic scripts, reinforcing originality.
- Functional plots (stops, TPs) enhance trade management.
6. Metrics Dashboard
The top-right dashboard (2x8 table) is your command center, delivering real-time insights.
Metrics:
Daily Loss ($): Current loss vs. day’s start, red if > $300.
Rolling DD ($): Drawdown vs. 100-bar peak, red if > $1000.
ATR Threshold: Current percATR, green if ATR exceeds, red if not.
Z-Score: Current value, green if within threshold, red if not.
Signal: “Bullish Div” (aqua), “Bearish Div” (fuchsia), or “None” (gray).
Action: “Consider Buying”/“Consider Selling” (signal color) or “Wait” (gray).
Kill Switch Buffer ($): Smallest buffer to kill switch, green if > 0, red if 0.
Why This Is Important?:
- Consolidates critical data, making decisions effortless.
- Color-coded metrics guide beginners (e.g., green action = go).
- Buffer metric adds transparency, rare in off-the-shelf scripts.
7. Beginner Guide
Beginner Guide: Middle-right table (shown once on chart load), explains aqua orbs (bullish, buy) and fuchsia orbs (bearish, sell).
Key Features:
Futures-Optimized: Tailored for MNQ, NQ, MES, ES with point-value adjustments.
Highly Customizable: Inputs for lookback, sensitivity, filters, and risk settings.
Real-Time Insights: Dashboard and visuals update every bar.
Backtest-Ready: Fixed qty and tick calc for accurate historical testing.
User-Friendly: Guide, visuals, and dashboard make it accessible yet powerful.
Original Design: DAFE’s unique logic and visuals stand out from generic scripts.
How to Use
Add to Chart: Load on a 5min MNQ/ES chart in TradingView.
Configure Inputs: Adjust instrument, filters, or risk (defaults optimized for MNQ).
Monitor Dashboard: Watch signals, actions, and risk metrics (top-right).
Backtest: Run in strategy tester to evaluate performance.
Live Trade: Connect to a broker (e.g., Tradovate) for automation. Watch for slippage (e.g., April 27, 2025 ES issues).
Replay Test: Use bar replay (e.g., April 28, 2025 NQ drop) to test volatility handling.
Disclaimer
Trading futures involves significant risk of loss and is not suitable for all investors. Past performance is not indicative of future results. Backtest results may not reflect live trading due to slippage, fees, or market conditions. Use this strategy at your own risk, and consult a financial advisor before trading. Dskyz (DAFE) Trading Systems is not responsible for any losses incurred.
Backtesting:
Frame: 2023-09-20 - 2025-04-29
Fee Typical Range (per side, per contract)
CME Exchange $1.14 – $1.20
Clearing $0.10 – $0.30
NFA Regulatory $0.02
Firm/Broker Commis. $0.25 – $0.80 (retail prop)
TOTAL $1.60 – $2.30 per side
Round Turn: (enter+exit) = $3.20 – $4.60 per contract
Final Notes
The Dskyz (DAFE) Aurora Divergence – Quant Master isn’t just a strategy—it’s a movement. Crafted with originality and driven by community passion, it rises above the flood of generic scripts to deliver a system that’s as powerful as it is beautiful. With its quant-grade logic, DAFE visuals, and robust risk controls, it empowers traders to tackle futures with confidence and style. Join the DAFE crew, light up your charts, and let’s outsmart the markets together!
(This publishing will most likely be taken down do to some miscellaneous rule about properly displaying charting symbols, or whatever. Once I've identified what part of the publishing they want to pick on, I'll adjust and repost.)
Use it with discipline. Use it with clarity. Trade smarter.
**I will continue to release incredible strategies and indicators until I turn this into a brand or until someone offers me a contract.
Created by Dskyz, powered by DAFE Trading Systems. Trade fast, trade bold.

Whale Psychology Insights
### 🧠 Whale Psychology Insights – Unmasking Smart Money Moves
**Understand the mind games behind every candle.**
This advanced indicator is designed to reveal the psychological warfare played by whales and market manipulators in the crypto space. Stop trading blind—start trading with the insights of the smart money.
#### 🔍 What It Does:
- **Liquidity Zone Detection** – Automatically identifies key **swing highs/lows** where stop hunts are likely.
- **Volume Spike Alerts** – Spot **suspicious activity** where big players enter or exit.
- **Order Block Zones** – Highlights **bullish/bearish engulfing patterns** used by institutions.
- **Fair Value Gaps (FVG)** – Marks price inefficiencies where price may return.
- **Fakeout Detection** – Finds **manipulative wicks** designed to trap retail traders.
#### 💡 Use Cases:
- Avoid getting stopped out by **liquidity grabs**
- Enter after the **whales have made their move**
- Identify **high-probability reversal zones**
- Trade **with smart money**, not against it
Perfect for scalpers, intraday traders, and swing traders looking to understand *why* price moves—not just *where*.
> 🧠 **Trade the psychology, not just the chart.**

Dskyz Options Flow Flux (OFF) - FuturesDskyz Options Flow Flux (OFF) - Futures
*This is a repost due to moderator intervention on use of ™ in my scripts. I'm in the process of getting this rectified. This was originally posted around mid-night CDT.
🧠 The Dskyz Options Flow Flux (OFF) - Futures indicator is a game changer for futures traders looking to tap into institutional activity with limited resources. Designed for TradingView this tool simulates options flow data (call/put volume and open interest) for futures contracts like MNQ MES NQ and ES giving u actionable insights through volume spike detection volatility adjustments and stunning visuals like aurora flux bands and round number levels. Whether u’re a beginner learning the ropes or a pro hunting for an edge this indicator delivers real time market sentiment and key price levels to boost ur trading game
Key Features
⚡ Simulated Options Flow: Breaks down call/put volume and open interest using market momentum and volatility
📈 Spike Detection: Spots big moves in volume and open interest with customizable thresholds
🧠 Volatility Filter: Adapts to market conditions using ATR for smarter spike detection
✨ Aurora Flux Bands: Glows with market sentiment showing u bullish or bearish vibes at a glance
🎯 Round Number Levels: Marks key psychological levels where big players might step in
📊 Interactive Dashboard: Real time metrics like sentiment score and volatility factor right on ur chart
🚨 Alerts: Get notified of bullish or bearish spikes so u never miss a move
How It Works
🧠 This indicator is built to make complex options flow analysis simple even with the constraints of Pine Script. Here’s the step by step:
Simulated Volume Data (Dynamic Split):
Pulls daily volume for ur chosen futures contract (MNQ1! MES1! NQ1! ES1!)
Splits it into call and put volume based on momentum (ta.mom) and volatility (ATR vs its 20 period average)
Estimates open interest (OI) for calls and puts (1.15x for calls 1.1x for puts)
Formula: callRatio = 0.5 + (momentum / close) * 10 + (volatility - 1) * 0.1 capped between 0.3 and 0.7
Why It Matters: Mimics how big players might split their trades giving u a peek into institutional sentiment
Spike Detection:
Compares current volume/OI to short term (lookbackShort) and long term (lookbackLong) averages
Flags spikes when volume/OI exceeds the average by ur set threshold (spikeThreshold for regular highConfidenceThreshold for strong)
Adjusts for volatility so u’re not fooled by choppy markets
Output: optionsSignal (2 for strong bullish -2 for strong bearish 1 for bullish -1 for bearish 0 for neutral)
Why It Matters: Pinpoints where big money might be stepping in
Volatility Filter:
Uses ATR (10 periods) and its 20 period average to calculate a volatility factor (volFactor = ATR / avgAtr)
Scales spike thresholds based on market conditions (volAdjustedThreshold = spikeThreshold * max(1 volFactor * volFilter))
Why It Matters: Keeps ur signals reliable whether the market is calm or wild
Sentiment Score:
Calculates a call/put ratio (callVolume / putVolume) and adjusts for volatility
Converts it to a 0 to 100 score (higher = bullish lower = bearish)
Formula: sentimentScore = min(max((volAdjustedSentiment - 1) * 50 0) 100)
Why It Matters: Gives u a quick read on market bias
Round Number Detection:
Finds the nearest round number (e.g. 100 for MNQ1! 50 for MES1!)
Checks for volume spikes (volume > 3 period SMA * spikeThreshold) and if price is close (within ATR * atrMultiplier)
Updates the top activity level every 15 minutes when significant activity is detected
Why It Matters: Highlights psychological levels where price often reacts
Visuals and Dashboard:
Combines aurora flux bands glow effects round number lines and a dashboard to make insights pop (see Visual Elements below)
Plots triangles for call/put spikes (green/red for strong lime/orange for regular)
Sets up alerts for key market moves
Why It Matters: Makes complex data easy to read at a glance
Inputs and Customization
⚙️ Beginners can tweak these settings to match their trading style while pros can dig deeper for precision:
Futures Symbol (symbol): Pick ur contract (MNQ1! MES1! NQ1! ES1!). Default: MNQ1!
Short Lookback (lookbackShort): Days for short term averages. Smaller = more sensitive. Range: 1+. Default: 5
Long Lookback (lookbackLong): Days for long term averages. Range: 5+. Default: 10
Spike Threshold (spikeThreshold): How big a spike needs to be (e.g. 1.1 = 10% above average). Range: 1.0+. Default: 1.1
High Confidence Threshold (highConfidenceThreshold): For strong spikes (e.g. 3.0 = 3x average). Range: 2.0+. Default: 3.0
Volatility Filter (volFilter): Adjusts for market volatility (e.g. 1.2 = 20% stricter in volatile markets). Range: 1.0+. Default: 1.2
Aurora Flux Transparency (glowOpacity): Controls band transparency (0 = solid 100 = invisible). Range: 0 to 100. Default: 65
Show Show OFF Dashboard (showDashboard): Toggles the dashboard with key metrics. Default: true
Show Nearest Round Number (showRoundNumbers): Displays round number levels. Default: true
ATR Multiplier for Proximity (atrMultiplier): How close price needs to be to a round number (e.g. 1.5 = within 1.5x ATR). Range: 0.5+. Default: 1.5
Functions and Logic
🧠 Here’s the techy stuff pros will love:
Simulated Volume Data : Splits daily volume into call/put volume and OI using momentum and volatility
Volatility Filter: Scales thresholds with volFactor = atr / avgAtr for adaptive detection
Spike Detection: Flags spikes and assigns optionsSignal (2, -2, 1, -1, 0) for sentiment
Sentiment Score: Converts call/put ratio into a 0-100 score for quick bias reads
Round Number Detection: Identifies key levels and significant activity for trading zones
Dashboard Display: Updates real time metrics like sentiment score and volatility factor
Visual Elements
✨ These visuals make data come alive:
Gradient Background: Green (bullish) red (bearish) or yellow (neutral/choppy) at 95% transparency to show trend
Aurora Flux Bands: Stepped bands (linewidth 3) around a 14 period EMA ± ATR * 1.8. Colors shift with sentiment (green red lime orange gray) with glow effects at 85% transparency
Round Number Visualization: Stepped lines (linewidth 2) at key levels (solid if active dashed if not) with labels (black background white text size.normal)
Visual Signals: Triangles above/below bars for spikes (size.small for strong size.tiny for regular)
Dashboard: Bottom left table (2 columns 10 rows) with a black background (29% transparency) gray border and metrics:
⚡ Round Number Activity: “Detected” or “None”
📈 Trend: “Bullish” “Bearish” or “Neutral” (colored green/red/gray)
🧠 ATR: Current 10 period ATR
📊 ATR Avg: 20 period SMA of ATR
📉 Volume Spike: “YES” (green) or “NO” (red)
📋 Call/Put Ratio: Current ratio
✨ Flux Signal: “Strong Bullish” “Strong Bearish” “Bullish” “Bearish” or “Neutral” (colored green/red/gray)
⚙️ Volatility Factor: Current volFactor
📈 Sentiment Score: 0-100 score
Usage and Strategy Recommendations
🎯 For Beginners: Use high confidence spikes (green/red triangles) for easy entries. Check the dashboard for a quick market read (sentiment score above 60 = bullish below 40 = bearish). Watch round number levels for support/resistance
💡 For Pros: Combine flux signals with round number activity for high probability setups. Adjust lookbackShort/lookbackLong for trending vs choppy markets. Use volFactor for position sizing (higher = smaller positions)

SMT SwiftEdge PowerhouseSMT SwiftEdge Powerhouse: Precision Trading with Divergence, Liquidity Grabs, and OTE Zones
The SMT SwiftEdge Powerhouse is a powerful trading tool designed to help traders identify high-probability entry points during the most active market sessions—London and New York. By combining Smart Money Technique (SMT) Divergence, Liquidity Grabs, and Optimal Trade Entry (OTE) Zones, this script provides a unique and cohesive strategy for capturing market reversals with precision. Whether you're a scalper or a swing trader, this indicator offers clear visual signals to enhance your trading decisions on any timeframe.
What Does This Script Do?
This script integrates three key concepts to identify potential trading opportunities:
SMT Divergence:
SMT Divergence compares the price action of two correlated assets (e.g., Nasdaq and S&P 500 futures) to detect hidden market reversals. When one asset makes a higher high while the other makes a lower high (bearish divergence), or one makes a lower low while the other makes a higher low (bullish divergence), it signals a potential reversal. This technique leverages institutional "smart money" behavior to anticipate market shifts.
Liquidity Grabs:
Liquidity Grabs occur when price breaks above recent highs or below recent lows on higher timeframes (5m and 15m), often triggering stop-loss orders from retail traders. These breakouts are identified using pivot points and confirm institutional activity, setting the stage for a reversal. The script focuses on liquidity grabs during the London and New York sessions for maximum market activity.
Optimal Trade Entry (OTE) Zones:
OTE Zones are Fibonacci-based retracement areas (e.g., 61.8%) calculated after a liquidity grab. These zones highlight where price is likely to retrace before continuing in the direction of the reversal, offering a high-probability entry point. The script adjusts the width of these zones using the Average True Range (ATR) to adapt to market volatility.
By combining these components, the script identifies when institutional activity (liquidity grabs) aligns with market reversals (SMT divergence) and pinpoints precise entry points (OTE zones) during high-liquidity sessions.
Why Combine These Components?
The integration of SMT Divergence, Liquidity Grabs, and OTE Zones creates a robust trading system for several reasons:
Synergy of Institutional Signals: SMT Divergence and Liquidity Grabs both reflect "smart money" behavior—divergence shows hidden reversals, while liquidity grabs confirm institutional intent to trap retail traders. Together, they provide a strong foundation for identifying high-probability setups.
Session-Based Precision: Focusing on the London and New York sessions ensures signals occur during periods of high volatility and liquidity, increasing their reliability.
Precision Entries with OTE: After confirming a setup with divergence and liquidity grabs, OTE zones provide a clear entry area, reducing guesswork and improving trade accuracy.
Adaptability: The script works on any timeframe, with adjustable settings for signal sensitivity, session times, and Fibonacci levels, making it versatile for different trading styles.
This combination makes the script unique by aligning institutional insights with actionable entry points, tailored to the most active market hours.
How to Use the Script
Setup:
Add the script to your chart (works on any timeframe, e.g., 1m, 5m, 15m).
Configure the settings in the indicator's inputs:
Session Settings: Adjust the start/end times for London and New York sessions (default: London 8-11 UTC, New York 13-16 UTC). You can disable session restrictions if desired.
Asset Settings: Set the primary and secondary assets for SMT Divergence (default: NQ1! and ES1!). Ensure the assets are correlated.
Signal Settings: Adjust the lookback period, ATR period, and signal sensitivity (Low/Medium/High) to control the frequency of signals.
OTE Settings: Choose the Fibonacci level for OTE zones (default: 61.8%).
Visual Settings: Enable/disable OTE zones, SMT labels, and debug labels for troubleshooting.
Interpreting Signals:
Blue Circles: Indicate a liquidity grab (price breaking a 5m or 15m pivot high/low), marking the start of a potential setup.
Blue OTE Zones: Appear after a liquidity grab, showing the retracement area (e.g., 61.8% Fibonacci level) where price is likely to enter for a reversal trade. The label "OTE Trigger 5m/15m" confirms the direction (Short/Long) and session.
Green/Red Entry Boxes: Mark precise entry points when price enters the OTE zone and confirms the SMT Divergence. Green boxes indicate a long entry, red boxes a short entry.
Trading Example:
On a 1m chart, a blue circle appears when price breaks a 5m pivot high during the London session.
A blue OTE zone forms, showing a retracement area (e.g., 61.8% Fibonacci level) with the label "OTE Trigger 5m/15m (Short, London)".
Price retraces into the OTE zone, and a red "Short Entry" box appears, confirming a bearish SMT Divergence.
Enter a short trade at the red box, with a stop-loss above the OTE zone and a take-profit at the next support level.
Originality and Utility
The SMT SwiftEdge Powerhouse stands out by merging SMT Divergence, Liquidity Grabs, and OTE Zones into a single, session-focused indicator. Unlike traditional indicators that focus on one aspect of price action, this script combines institutional reversal signals with precise entry zones, tailored to the most active market hours. Its adaptability across timeframes, customizable settings, and clear visual cues make it a versatile tool for traders seeking to capitalize on smart money movements with confidence.
Tips for Best Results
Use on correlated assets like NQ1! (Nasdaq futures) and ES1! (S&P 500 futures) for accurate SMT Divergence.
Test on lower timeframes (1m, 5m) for scalping or higher timeframes (15m, 1H) for swing trading.
Adjust the "Signal Sensitivity" to "High" for more signals or "Low" for fewer, high-quality setups.
Enable "Show Debug Labels" if signals are not appearing as expected, to troubleshoot pivot points and liquidity grabs.

Daily ATR BandsATR Finder – Volatility Scanner for Smarter Trade Setups
The ATR Finder is a precision tool designed to help traders quickly identify high-volatility assets using the Average True Range (ATR) – a key metric in assessing market momentum and potential breakout zones. By automatically scanning and highlighting tickers or candles with elevated ATR values relative to their recent historical range, this indicator helps you filter for setups that are more likely to experience significant price moves.
Whether you're a day trader seeking intraday momentum or a swing trader looking for setups with strong follow-through potential, the ATR Finder cuts through the noise and visually signals which assets are "on the move." It can be paired with other indicators or price action tools to create a high-conviction trading strategy focused on volatility expansion.
Key Features:
Dynamic ATR Calculation over a user-defined period
Visual Alerts or Color-Coding for above-threshold volatility spikes
Supports Multiple Timeframes for both short- and long-term volatility analysis
Great for spotting breakout opportunities, gap continuations, or trend reversals
Use the ATR Finder to stay ahead of price action and build a watchlist that moves with purpose. Perfect for scalpers, breakout traders, and anyone who respects the power of volatility.
Chandelier Exit with ZLSMA SwiftEdgeChandelier Exit with ZLSMA
Overview
The "Chandelier Exit with ZLSMA" indicator is a powerful trading tool designed to identify trend reversals and high-probability entry points in financial markets. By combining the volatility-based Chandelier Exit with the low-lag Zero Lag Least Squares Moving Average (ZLSMA), this indicator provides clear Buy and Sell signals, enhanced with a unique signal strength score to help traders prioritize high-quality opportunities. Visual enhancements, including dynamic color coding, background highlights, and trend arrows, make it intuitive and visually appealing for both novice and experienced traders.
What It Does
This indicator generates Buy and Sell signals when a trend reversal is detected by the Chandelier Exit, but only if the price crosses the ZLSMA for the first time in the direction of the trend. Each signal is accompanied by a percentage score (0-100%) that measures its strength based on price movement and momentum. The indicator overlays directly on the price chart, displaying:
Buy/Sell labels with signal strength (e.g., "Buy (85%)").
A ZLSMA line that changes color (green for bullish, red for bearish) to indicate trend direction.
Background highlights to mark signal candles.
Trend arrows to visually confirm signal points.
How It Works
The indicator combines two complementary components:
Chandelier Exit:
Uses the Average True Range (ATR) to create dynamic trailing stop levels (long_stop and short_stop) that adapt to market volatility.
Signals a Buy when the price crosses above the short stop (indicating a potential uptrend) and a Sell when it crosses below the long stop (indicating a potential downtrend).
Default settings use an ATR period of 1 and a multiplier of 2.0 for high sensitivity to short-term price movements.
Zero Lag LSMA (ZLSMA):
A low-lag moving average based on linear regression, designed to reduce delay compared to traditional moving averages.
Acts as a trend filter: Buy signals are only generated when the price closes above ZLSMA for the first time, and Sell signals when it closes below for the first time.
Default length of 50 balances smoothness with responsiveness.
Signal Strength Score:
Each signal is assigned a score (0-100%) based on:
Distance to ZLSMA (60% weight): How far the price is from ZLSMA, normalized by ATR. Larger distances indicate stronger breakouts.
Candlestick size (40% weight): The size of the signal candle, normalized by ATR. Larger candles suggest stronger momentum.
A high score (e.g., >80%) indicates a robust signal, while a low score (e.g., <50%) suggests caution.
Visual Features:
The ZLSMA line changes color (green for bullish, red for bearish) to reflect the trend.
Signal candles are highlighted with a subtle green (Buy) or red (Sell) background.
Tiny triangular arrows appear below Buy signals and above Sell signals for clear visual confirmation.
Why Combine Chandelier Exit and ZLSMA?
The Chandelier Exit excels at identifying trend reversals through volatility-based stops, but it can generate false signals in choppy markets due to its sensitivity (especially with a short ATR period of 1). The ZLSMA addresses this by acting as a trend filter, ensuring signals are only triggered when the price confirms a trend by crossing the ZLSMA for the first time. This combination reduces noise and focuses on high-probability setups. The signal strength score further enhances decision-making by quantifying the conviction behind each signal, making the indicator feel intuitive and "smart."
How to Use
Setup:
Add the indicator to your chart in TradingView.
Adjust inputs in the settings panel:
ATR Period (default: 1): Controls the sensitivity of Chandelier Exit. Increase for smoother signals.
ATR Multiplier (default: 2.0): Sets the distance of stop levels from price extremes.
ZLSMA Length (default: 50): Adjusts the smoothness of the ZLSMA line. Shorter lengths (e.g., 20-30) are more responsive; longer lengths (e.g., 50-100) are smoother.
Use Close Price for Extremums (default: true): Determines whether Chandelier Exit uses closing prices or high/low prices for calculations.
Interpreting Signals:
Buy Signal: A green "Buy (X%)" label appears below a candle when the price crosses above the Chandelier Exit short stop and closes above ZLSMA for the first time. The percentage indicates signal strength (higher = stronger).
Sell Signal: A red "Sell (X%)" label appears above a candle when the price crosses below the Chandelier Exit long stop and closes below ZLSMA for the first time.
Use the ZLSMA line’s color (green for bullish, red for bearish) to confirm the overall trend.
Prioritize signals with high strength scores (e.g., >70%) for better reliability.
Trading Considerations:
Combine signals with other analysis (e.g., support/resistance, volume) for confirmation.
Test the indicator on a demo account or use TradingView’s Strategy Tester to evaluate performance.
Be cautious with the default ATR period of 1, as it is highly sensitive and may generate frequent signals in volatile markets.
What Makes It Unique
This indicator stands out due to its thoughtful integration of Chandelier Exit and ZLSMA, creating a synergy that balances sensitivity with reliability. The first-cross filter ensures signals are triggered only at the start of potential trends, reducing false positives. The signal strength score adds a layer of intelligence, helping traders assess the quality of each signal without needing external tools. Visual enhancements, such as dynamic ZLSMA coloring, background highlights, and trend arrows, make the indicator user-friendly and visually engaging, appealing to traders seeking a modern, intuitive tool.
Limitations and Notes
The short ATR period (1) makes the indicator highly sensitive, which suits short-term traders but may produce noise in sideways markets. Increase the ATR period for smoother signals.
The signal strength score is a heuristic based on price movement and momentum, not a predictive model. Use it as a guide, not a definitive predictor.
Always backtest the indicator on your preferred market and timeframe to ensure it aligns with your trading strategy.

ICT SMC Liquidity Grabs and OBsICT SMC Liquidity Grabs + Order Blocks + Fibonacci OTE Levels
A High-Probability Entry Engine for Smart Money Concept Traders
This script combines three powerful Smart Money Concepts (SMC) into a single tool: Liquidity Grabs, Order Block Zones, and Fibonacci OTE Levels, allowing traders to identify institutional entry models with clean, rule-based visual signals.
It’s designed to simplify SMC trading by highlighting confluence zones where price is likely to reverse or continue — with clear visual zones, entry arrows, and take profit projections.
🔍 What This Script Does:
Detects Liquidity Grabs
Identifies when price sweeps above/below the highest high or lowest low within a user-defined lookback period and closes back inside.
Plots orange labels on the chart to signal potential liquidity events (LG-H / LG-L).
Plots Order Blocks After Liquidity Grabs
After a liquidity grab, the script looks for displacement candles (strong bullish or bearish moves) and draws highlighted OB zones extending several bars to the right.
These zones represent potential institutional footprints for price reversals.
Draws Fibonacci OTE Levels (Optimal Trade Entry)
Uses recent swing high and low pivots to automatically calculate OTE zones (default: 62% and 75% retracement levels).
Draws these retracement zones for both bullish and bearish setups.
Marks Valid OTE Entry Zones
Buy/Sell zones only trigger when:
A liquidity grab occurs,
Price enters the OTE zone,
And a strong confirming candle is present.
Plots green/red arrows for valid buy/sell OTE entries.
Auto-Draws Take Profit Zones
TP1 = Previous swing high/low
TP2 = Risk-based R-multiplied extension (e.g., 1.5R — customizable)
Alerts
Triggers alerts when valid buy or sell OTE setups are detected.
⚙️ Customization Features:
Toggle each feature: Liquidity Grabs, Order Blocks, Fibonacci OTE levels
Set Fibonacci retracement percentages (e.g., 0.62 / 0.75)
Adjust lookback window for liquidity detection
Customize the take-profit multiplier (R-based)
Full control over visuals: colors, labels, and lines
💡 How to Use:
Use this script to scan for high-confluence trade setups based on Smart Money principles.
Combine with session timing (e.g., New York open), major swing structure, or Kill Zone windows for maximum edge.
Look for arrows inside OB zones or OTE levels following liquidity sweeps for cleaner entries.
🔗 Works Best With:
✅ First FVG — Opening Range Fair Value Gap Detector: Identify early inefficiencies to set the narrative for the day.
✅ Liquidity Levels — Smart Swing Lows: Spot key structural lows that can fuel stop hunts and reversals.
✅ ICT Turtle Soup — Liquidity Reversal: Add a classic reversal pattern to your toolkit to catch fakeouts cleanly.
Together, these tools build a complete Smart Money ecosystem for entry precision, risk management, and price behavior forecasting.

ICT Turtle Soup Ultimate V2📜 ICT Turtle Soup Ultimate V2 — Advanced Liquidity Reversal System
Overview:
The ICT Turtle Soup Ultimate V2 is a next-generation liquidity reversal indicator built on the principles of smart money concepts (SMC) and the classic ICT Turtle Soup setup. It is designed to detect false breakouts (liquidity grabs) at key swing points, enhanced by proprietary logic that filters out low-quality signals using a combination of trend context, kill zone timing, candle wick behavior, and multi-timeframe imbalance zones.
This tool is ideal for intraday traders seeking high-probability entry signals near liquidity pools and imbalance zones — where smart money makes its move.
🔍 What This Script Does
🧠 Liquidity Grab Detection (Turtle Soup Core Logic)
The script scans for recent swing highs/lows using a user-defined lookback.
A signal is generated when price breaks above/below a previous swing level but closes back inside — indicating a liquidity run and likely reversal.
A special Wick Trap Mode enhances this logic by detecting long-wick fakeouts — where the wick grabs stops but the candle body closes opposite the breakout direction.
📉 Trend Filter with ATR Buffer
Optional trend filter uses a simple moving average (SMA) to gauge market direction.
Instead of hard filtering, it applies an ATR-based buffer to allow for entries near the trend line, reducing signal suppression from micro-fluctuations.
🕰️ Kill Zone Session Filtering
Only show signals during institutional trading hours:
London Session
New York AM
Or any custom user-defined session
Helps traders avoid low-volume hours and focus on where stop hunts and price expansions typically occur.
🧱 Multi-Timeframe FVG Confluence (Optional)
Signal validation is strengthened by checking if price is within a higher timeframe Fair Value Gap — commonly used to identify imbalances or inefficiencies.
Filters out setups that lack underlying displacement or order flow justification.
🎨 Visual Feedback
Plots 🔺 bullish and 🔻 bearish markers at signal candles.
Optionally displays:
Swing High/Low Labels (SH / SL)
Reversal distance labels
Background color shading on valid signals
Includes built-in alerts for automated trade notification.
🔑 Unique Benefits
Wick Trap Detection: A proprietary approach to detecting stop hunts via wick behavior, not just candle closes.
ATR-based trend filtering: Avoids unnecessary filtering while still maintaining directional bias.
All-in-one system: No need to stack multiple indicators — swing detection, reversal logic, session filtering, and imbalance confirmation are all integrated.
💡 How to Use
Enable Wick Trap Mode to detect stealthy liquidity grabs with strong wicks.
Use Kill Zone filters to trade only when institutions are active.
Optionally enable FVG confluence to improve confidence in reversal zones.
Watch for Bullish signals near SL levels and Bearish signals near SH levels.
Combine with your own execution strategy or other SMC tools for optimal results.
🔗 Best Used With:
Maximize your edge by combining this script with complementary SMC-based tools:
✅ First FVG — Opening Range Fair Value Gap Detector
✅ ICT SMC Liquidity Grabs + OB + Fibonacci OTE Levels
✅ Liquidity Levels — Smart Swing Highs and Lows with horizontal line projections

ICT Turtle Soup (Liquidity Reversal)ICT Turtle Soup — Liquidity Reversal Detection
Classic Liquidity Trap Reversal Strategy for Smart Money Traders
This indicator implements the ICT Turtle Soup concept — a classic liquidity-based reversal pattern — which occurs when price runs above or below a recent swing level to grab liquidity, then sharply reverses. This pattern is commonly used in Smart Money Concepts (SMC) and Inner Circle Trader (ICT) strategies to anticipate false breakouts and high-probability reversals.
🔍 What This Script Does:
Identifies Swing Highs & Lows
Detects recent swing highs and lows using a customizable lookback period.
Tracks Liquidity Grabs
A bearish Turtle Soup setup is triggered when price breaks above a recent swing high but closes back below it.
A bullish Turtle Soup setup is triggered when price breaks below a recent swing low but closes back above it.
These conditions often signal liquidity traps, where price sweeps resting orders before reversing.
Plots Signals Directly on the Chart
Turtle Soup setups are marked with 🐢🔻 (bearish) and 🐢🔺 (bullish) labels.
Optional full-text labels can also be displayed for clarity and journaling.
Includes Alert Conditions
Alerts can be enabled to notify you of bullish or bearish Turtle Soup reversals in real-time.
⚙️ Customization Features:
Adjustable swing lookback period
Enable/disable Turtle Soup labels
Set label font size
Choose your preferred bullish/bearish signal colors
💡 How to Use:
Add this script to your chart (ideally on intraday timeframes such as 5m–15m).
Wait for a Turtle Soup signal near a key swing high/low or liquidity zone.
Combine with other confirmation tools (e.g., FVGs, Order Blocks, OTE) for stronger setups.
Use alerts to stay ahead of fast-moving reversals.
🧠 Why It Works:
Turtle Soup setups are rooted in liquidity theory — they exploit the market’s tendency to sweep obvious swing levels before reversing. These moves often trap retail traders and mark the beginning of Smart Money entries.
🔗 Best Used With:
Maximize the edge by combining this with other SMC tools:
✅ First FVG — Opening Range Fair Value Gap Detector
✅ ICT SMC Liquidity Grabs + OB + Fibonacci OTE Levels
✅ Liquidity Levels — Smart Swing Lows
Together, they create a complete ecosystem for identifying, confirming, and executing liquidity-driven trade setups with precision.

ICT SMC Liquidity Grabs and OBsICT SMC Liquidity Grabs + OB + Fibonacci OTE Levels
Smart Money Concepts Trading Assistant
This script is built for traders who follow ICT (Inner Circle Trader) and Smart Money Concepts. It intelligently combines three critical components of SMC trading: Liquidity Grabs, Order Blocks, and Fibonacci-based Optimal Trade Entry (OTE) zones — giving traders visual cues for potential high-probability reversals and entry points.
🔍 What This Script Does:
Detects Liquidity Grabs
Identifies swing highs/lows where price sweeps liquidity, then immediately reverses.
Labels them with orange markers when price takes out previous highs/lows but closes back inside.
Draws Order Blocks
After a liquidity grab, the script looks for strong bullish or bearish candles and automatically highlights the OB zone.
These OB zones are visualized with transparent colored boxes extending several bars forward.
Plots Fibonacci OTE Levels
Uses recent swing high/low pivots to dynamically draw customizable OTE retracement levels (e.g., 62% and 75%) for both long and short setups.
Highlights Optimal Entry Zones
Marks valid OTE-based buy/sell opportunities only when:
Liquidity has been taken,
Price enters the OTE zone,
And a strong confirming candle appears.
Adds visual zones, trade labels, and optional alerts for each qualified entry.
Includes Take Profit Targets
Automatically calculates take-profit levels based on previous structure and risk-reward ratios.
TP1 is the previous swing, and TP2 is an extended R-multiple (customizable by user).
⚙️ Customization Options:
Toggle each feature (Liquidity Grabs, OBs, Fibonacci Levels)
Adjust Fibonacci levels (default: 62% and 75%)
Set lookback period for liquidity checks
Customize the R-multiple for TP2 levels
💡 How to Use:
Enable desired features from the input panel.
Watch for Buy/Sell OTE zones highlighted in green/red.
Confirm with liquidity sweep and OB support for stronger signals.
Use the automatically generated TP levels to manage risk.
🚀 What Makes It Unique:
Unlike other open-source mashups, this script synchronizes multiple SMC concepts into a single tool that:
Waits for high-confidence conditions (not just blind fib or OB detection)
Validates entries using multiple confluences
Visually marks actionable setups
Automates trade management zones
Whether you're trend-trading, scalping, or swing trading ICT-style, this tool offers a streamlined, smart-money-aligned workflow directly on your chart.

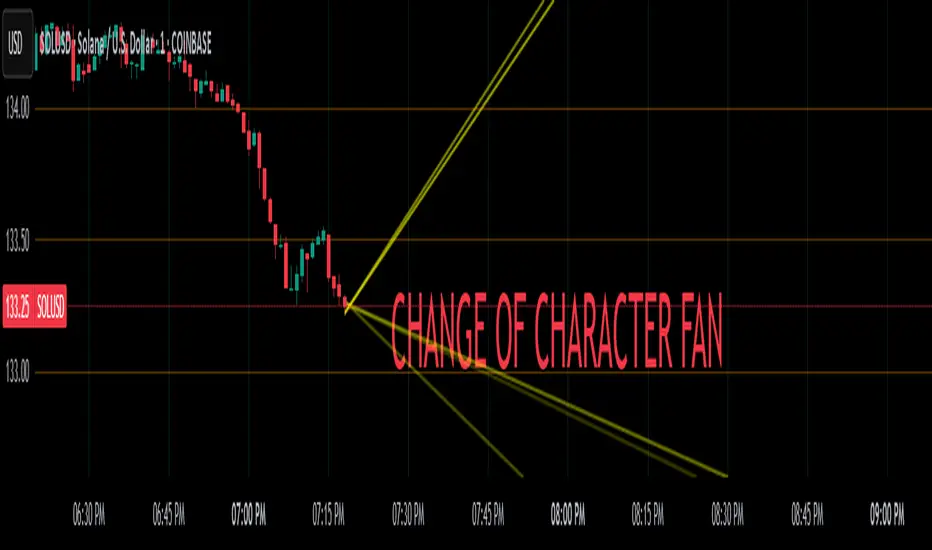
Change of Character FanChange of Character Fan
Overview
The Change of Character Fan is designed to help traders detect shifts (changes of character) in market direction and sentiment before they become fully visible through traditional candlestick analysis. Instead of relying solely on the shape or close of candlesticks, this indicator offers a direct, real-time look at the internal price action occurring within a single bar. This visibility into intrabar dynamics can potentially allow traders to enter or exit trades earlier, minimize false signals, and reduce their dependence on multiple lower-timeframe charts.
How it Works:
The indicator plots a "fan" consisting of five distinct slope lines within the current bar. Each line represents the internal trend of price movement based on user-defined lower timeframe data intervals.
By default, these intervals are set to 3, 5, 8, 13, and 21 samples from 1-second timeframe data.
Each line only appears when it has collected the minimum required number of intrabar data points.
The fan lines use a progressive opacity scale (lighter to darker), visually highlighting the confidence level or probability of directional continuation within the current bar.
At the open of every new bar, the fan disappears completely and gradually reappears as new data is gathered, ensuring clarity and eliminating outdated signals.
Understanding the Mathematics: Linear Regression Model
This indicator is built around the concept of a linear regression model. Linear regression is a statistical technique used to model and analyze relationships between variables—in this case, time (independent variable) and price (dependent variable).
How Linear Regression Works:
Linear regression fits a straight line (called a "line of best fit") through a set of data points, minimizing the overall distance between each point and the line itself.
Mathematically, this is achieved by minimizing the squared differences (errors) between the observed values (actual prices) and the predicted values (prices on the line).
The linear model used here can be expressed in the form:
y = mx + b
where:
𝑦
y is the predicted price,
𝑥
x represents time (each data sample interval),
𝑚
m is the slope of the line, representing the direction and velocity of the trend,
𝑏
b is the intercept (the theoretical price when x=0).
Why a Linear Model is Beneficial in this Indicator:
Simplicity and Reliability: Linear regression is simple, robust, and widely accepted as a baseline predictive model. It requires minimal computational resources, providing instant updates in real-time trading conditions.
Immediate Directional Feedback: The slope derived from linear regression immediately communicates the directional tendency of recent price action. A positive slope indicates upward pressure, and a negative slope signals downward pressure.
Noise Reduction: Even when price fluctuations are noisy or erratic, linear regression summarizes overall direction clearly, making it easier to detect genuine directional shifts (change of character) rather than random price noise.
Intrabar Analysis: Traditional candlestick analysis relies on fully formed candles, potentially delaying signals. By using linear regression on very short-term (intrabar) data, traders can detect shifts in momentum more quickly, providing an earlier signal than conventional candle patterns alone.
Practical Application:
This indicator helps traders to visually identify:
Early Trend Reversals: Intrabar analysis reveals momentum shifts potentially signaling reversals before they become obvious on conventional candles.
Momentum Continuations: Confidence is gained when all lines in the fan are clearly pointing in the same direction, indicating strong intrabar conviction.
Reduced False Signals: Traditional candlestick signals (e.g., hammer candles) sometimes produce false signals due to intrabar noise. By looking directly into intrabar dynamics, traders gain better context on whether candle patterns reflect genuine directional change or merely noise.
Important Requirements and Recommendations:
Subscription Requirements:
A TradingView subscription that supports sub-minute data (e.g., 1-second or 5-second resolution) is strongly recommended.
If your subscription doesn't include this data granularity, you must use a 1-minute lower timeframe, significantly reducing responsiveness. In this scenario, it's best suited for a 15-minute or higher chart, adjusting intervals to shorter periods.
Live Data Essential:
Real-time market data subscription is essential for the accuracy and effectiveness of this indicator.
Using delayed data reduces responsiveness and weakens the indicator's primary advantage.
Recommended Settings for Different Chart Timeframes:
1-minute chart: Use 1-second lower timeframe intervals (default intervals: 3, 5, 8, 13, 21).
5-minute chart: Adjust to a 5- or 10-second lower timeframe, possibly reducing intervals to shorter periods (e.g., 3, 5, 8, 10, 12).
15-minute or higher charts: Adjust lower timeframe to 1-minute if granular data is unavailable, with reduced interval lengths to maintain responsiveness.
Conclusion:
The Change of Character Fan empowers traders with early insight into directional shifts within each candle, significantly enhancing reaction speed, signal accuracy, and reducing dependency on multiple charts. Built on robust linear regression mathematics, it combines clarity, responsiveness, and ease-of-use in a powerful intrabar analysis tool.
Trade smarter, see sooner, and react faster.
Ultimate Moving Average Crossover Indicator by SAMQUANT📈 Ultimate Moving Average Crossover Indicator | All-in-One MA Strategy
Unlock the power of multiple moving averages in one versatile indicator designed to give you clear, actionable signals in any market condition.
📌 Key Features:
- Supports **all major moving averages**:
- **SMA, EMA, WMA, HMA, RMA, DEMA, TEMA**, and more.
- Each MA is **fully customizable** with different lengths and types for ultimate flexibility.
- **Binary Long/Short signals** based on crossover logic—perfect for alerts, strategies, or discretionary trading.
- **Dynamic background coloring**:
- **Green** for bullish trends
- **Red** for bearish trends
Quickly gauge market direction at a glance.
---
🚀 Why Use This Indicator?
✅ Combines the strength of all major MA types
✅ Customizable to fit any trading style—scalping, swing, or trend following
✅ Built-in alerts ready for your next trade
✅ Visually intuitive with built-in signal clarity
✅ Excellent tool for **confluence-based** strategies
---
Great trades start with great tools. Clarity, precision, and flexibility—this indicator brings it all to your charts. Trade smarter, not harder.
---
> ⚠️ **Disclaimer:**
This script is intended for **educational and informational purposes only**. It does not constitute financial advice. Past performance is not indicative of future results. Always practice sound risk management and test strategies thoroughly before using real capital.

Dskyz (DAFE) AI Adaptive Regime - Beginners VersionDskyz (DAFE) AI Adaptive Regime - Pro: Revolutionizing Trading for All
Introduction
In the fast-paced world of financial markets, traders need tools that can keep up with ever-changing conditions while remaining accessible. The Dskyz (DAFE) AI Adaptive Regime - Pro is a groundbreaking TradingView strategy that delivers advanced, AI-driven trading capabilities to everyday traders. Available on TradingView (TradingView Scripts), this Pine Script strategy combines sophisticated market analysis with user-friendly features, making it a standout choice for both novice and experienced traders.
Core Functionality
The strategy is built to adapt to different market regimes—trending, ranging, volatile, or quiet—using a robust set of technical indicators, including:
Moving Averages (MA): Fast and slow EMAs to detect trend direction.
Average True Range (ATR): For dynamic stop-loss and volatility assessment.
Relative Strength Index (RSI) and MACD: Multi-timeframe confirmation of momentum and trend.
Average Directional Index (ADX): To identify trending markets.
Bollinger Bands: For assessing volatility and range conditions.
Candlestick Patterns: Recognizes patterns like bullish engulfing, hammer, and double bottoms, confirmed by volume spikes.
It generates buy and sell signals based on a scoring system that weighs these indicators, ensuring trades align with the current market environment. The strategy also includes dynamic risk management with ATR-based stops and trailing stops, as well as performance tracking to optimize future trades.
What Sets It Apart
The Dskyz (DAFE) AI Adaptive Regime - Pro distinguishes itself from other TradingView strategies through several unique features, which we compare to common alternatives below:
| Feature | Dskyz (DAFE) | Typical TradingView Strategies|
|---------|-------------|------------------------------------------------------------|
| Regime Detection | Automatically identifies and adapts to **four** market regimes | Often static or limited to trend/range detection |
| Multi‑Timeframe Analysis | Uses higher‑timeframe RSI/MACD for confirmation | Rarely incorporates multi‑timeframe data |
| Pattern Recognition | Detects candlestick patterns **with volume confirmation** | Limited or no pattern recognition |
| Dynamic Risk Management | ATR‑based stops and trailing stops | Often uses fixed stops or basic risk rules |
| Performance Tracking | Adjusts thresholds based on past performance | Typically static parameters |
| Beginner‑Friendly Presets | Aggressive, Conservative, Optimized profiles | Requires manual parameter tuning |
| Visual Cues | Color‑coded backgrounds for regimes | Basic or no visual aids |
The Dskyz strategy’s ability to integrate regime detection, multi-timeframe analysis, and user-friendly presets makes it uniquely versatile and accessible, addressing the needs of everyday traders who want professional-grade tools without the complexity.
-Key Features and Benefits
[Why It’s Ideal for Everyday Traders
⚡The Dskyz (DAFE) AI Adaptive Regime - Pro democratizes advanced trading by offering professional-grade tools in an accessible package. Unlike many TradingView strategies that require deep technical knowledge or fail in changing market conditions, this strategy simplifies complex analysis while maintaining robustness. Its presets and visual aids make it easy for beginners to start, while its adaptive features and performance tracking appeal to advanced traders seeking an edge.
🔄Limitations and Considerations
Market Dependency: Performance varies by market and timeframe. Backtesting is essential to ensure compatibility with your trading style.
Learning Curve: While presets simplify use, understanding regimes and indicators enhances effectiveness.
No Guaranteed Profits: Like all strategies, success depends on market conditions and proper execution. The Reddit discussion highlights skepticism about TradingView strategies’ universal success (Reddit Discussion).
Instrument Specificity: Optimized for futures (e.g., ES, NQ) due to fixed tick values. Test on other instruments like stocks or forex to verify compatibility.
📌Conclusion
The Dskyz (DAFE) AI Adaptive Regime - Pro is a revolutionary TradingView strategy that empowers everyday traders with advanced, AI-driven tools. Its ability to adapt to market regimes, confirm signals across timeframes, and manage risk dynamically. sets it apart from typical strategies. By offering beginner-friendly presets and visual cues, it makes sophisticated trading accessible without sacrificing power. Whether you’re a novice looking to trade smarter or a pro seeking a competitive edge, this strategy is your ticket to mastering the markets. Add it to your chart, backtest it, and join the elite traders leveraging AI to dominate. Trade like a boss today! 🚀
Use it with discipline. Use it with clarity. Trade smarter.
**I will continue to release incredible strategies and indicators until I turn this into a brand or until someone offers me a contract.
-Dskyz

Quarterly Theory ICT 04 [TradingFinder] SSMT 4Quarter Divergence🔵 Introduction
Sequential SMT Divergence is an advanced price-action-based analytical technique rooted in the ICT (Inner Circle Trader) methodology. Its primary objective is to identify early-stage divergences between correlated assets within precise time structures. This tool not only breaks down market structure but also enables traders to detect engineered liquidity traps before the market reacts.
In simple terms, SMT (Smart Money Technique) occurs when two correlated assets—such as indices (ES and NQ), currency pairs (EURUSD and GBPUSD), or commodities (Gold and Silver)—exhibit different reactions at key price levels (swing highs or lows). This lack of alignment is often a sign of smart money manipulation and signals a lack of confirmation in the ongoing trend—hinting at an imminent reversal or at least a pause in momentum.
In its Sequential form, SMT divergences are examined through a more granular temporal lens—between intraday quarters (Q1 through Q4). When SMT appears at the transition from one quarter to another (e.g., Q1 to Q2 or Q3 to Q4), the signal becomes significantly more powerful, often aligning with a critical phase in the Quarterly Theory—a framework that segments market behavior into four distinct phases: Accumulation, Manipulation, Distribution, and Reversal/Continuation.
For instance, a Bullish SMT forms when one asset prints a new low while its correlated counterpart fails to break the corresponding low from the previous quarter. This usually indicates absorption of selling pressure and the beginning of accumulation by smart money. Conversely, a Bearish SMT arises when one asset makes a higher high, but the second asset fails to confirm, signaling distribution or a fake-out before a decline.
However, SMT alone is not enough. To confirm a true Market Structure Break (MSB), the appearance of a Precision Swing Point (PSP) is essential—a specific candlestick formation on a lower timeframe (typically 5 to 15 minutes) that reveals the entry of institutional participants. The combination of SMT and PSP provides a more accurate entry point and better understanding of premium and discount zones.
The Sequential SMT Indicator, introduced in this article, dynamically scans charts for such divergence patterns across multiple sessions. It is applicable to various markets including Forex, crypto, commodities, and indices, and shows particularly strong performance during mid-week sessions (Wednesdays and Thursdays)—when most weekly highs and lows tend to form.
Bullish Sequential SMT :
Bearish Sequential SMT :
🔵 How to Use
The Sequential SMT (SSMT) indicator is designed to detect time and structure-based divergences between two correlated assets. This divergence occurs when both assets print a similar swing (high or low) in the previous quarter (e.g., Q3), but in the current quarter (e.g., Q4), only one asset manages to break that swing level—while the other fails to reach it.
This temporal mismatch is precisely identified by the SSMT indicator and often signals smart money activity, a market phase transition, or even the presence of an engineered liquidity trap. The signal becomes especially powerful when paired with a Precision Swing Point (PSP)—a confirming candle on lower timeframes (5m–15m) that typically indicates a market structure break (MSB) and the entry of smart liquidity.
🟣 Bullish Sequential SMT
In the previous quarter, both assets form a similar swing low.
In the current quarter, one asset (e.g., EURUSD) breaks that low and trades below it.
The other asset (e.g., GBPUSD) fails to reach the same low, preserving the structure.
This time-based divergence reflects declining selling pressure, potential absorption, and often marks the end of a manipulation phase and the start of accumulation. If confirmed by a bullish PSP candle, it offers a strong long opportunity, with stop-losses defined just below the swing low.
🟣 Bearish Sequential SMT
In the previous quarter, both assets form a similar swing high.
In the current quarter, one asset (e.g., NQ) breaks above that high.
The other asset (e.g., ES) fails to reach that high, remaining below it.
This type of divergence signals weakening bullish momentum and the likelihood of distribution or a fake-out before a price drop. When followed by a bearish PSP candle, it sets up a strong shorting opportunity with targets in the discount zone and protective stops placed above the swing high.
🔵 Settings
⚙️ Logical Settings
Quarterly Cycles Type : Select the time segmentation method for SMT analysis.
Available modes include: Yearly, Monthly, Weekly, Daily, 90 Minute, and Micro.
These define how the indicator divides market time into Q1–Q4 cycles.
Symbol : Choose the secondary asset to compare with the main chart asset (e.g., XAUUSD, US100, GBPUSD).
Pivot Period : Sets the sensitivity of the pivot detection algorithm. A smaller value increases responsiveness to price swings.
Activate Max Pivot Back : When enabled, limits the maximum number of past pivots to be considered for divergence detection.
Max Pivot Back Length : Defines how many past pivots can be used (if the above toggle is active).
Pivot Sync Threshold : The maximum allowed difference (in bars) between pivots of the two assets for them to be compared.
Validity Pivot Length : Defines the time window (in bars) during which a divergence remains valid before it's considered outdated.
🎨 Display Settings
Show Cycle :Toggles the visual display of the current Quarter (Q1 to Q4) based on the selected time segmentation
Show Cycle Label : Shows the name (e.g., "Q2") of each detected Quarter on the chart.
Show Bullish SMT Line : Draws a line connecting the bullish divergence points.
Show Bullish SMT Label : Displays a label on the chart when a bullish divergence is detected.
Bullish Color : Sets the color for bullish SMT markers (label, shape, and line).
Show Bearish SMT Line : Draws a line for bearish divergence.
Show Bearish SMT Label : Displays a label when a bearish SMT divergence is found.
Bearish Color : Sets the color for bearish SMT visual elements.
🔔 Alert Settings
Alert Name : Custom name for the alert messages (used in TradingView’s alert system).
Message Frequency :
All: Every signal triggers an alert.
Once Per Bar: Alerts once per bar regardless of how many signals occur.
Per Bar Close: Only triggers when the bar closes and the signal still exists.
Time Zone Display : Choose the time zone in which alert timestamps are displayed (e.g., UTC).
Bullish SMT Divergence Alert : Enable/disable alerts specifically for bullish signals.
Bearish SMT Divergence Alert : Enable/disable alerts specifically for bearish signals
🔵 Conclusion
The Sequential SMT (SSMT) indicator is a powerful and precise tool for identifying structural divergences between correlated assets within a time-based framework. Unlike traditional divergence models that rely solely on sequential pivot comparisons, SSMT leverages Quarterly Theory, in combination with concepts like liquidity sweeps, market structure breaks (MSB) and precision swing points (PSP), to provide a deeper and more actionable view of market dynamics.
By using SSMT, traders gain not only the ability to identify where divergence occurs, but also when it matters most within the market cycle. This empowers them to anticipate major moves or traps before they fully materialize, and position themselves accordingly in high-probability trade zones.
Whether you're trading Forex, crypto, indices, or commodities, the true strength of this indicator is revealed when used in sync with the Accumulation, Manipulation, Distribution, and Reversal phases of the market. Integrated with other confluence tools and market models, SSMT can serve as a core component in a professional, rule-based, and highly personalized trading strategy.

Multi Candle Body MapperMulti Candle Body Mapper
Visualize higher-timeframe candle structure within lower timeframes — without switching charts.
This tool maps grouped candle bodies and wicks (e.g., 15min candles on a 5min chart) using precise boxes and lines. Ideal for intraday traders who want to analyze market intent, body bias, and wick rejection in a compressed, organized view.
Features:
Visualize 3, 6, or 12 candle groups (e.g., 15min / 30min / 1H views)
Body box shows bullish/bearish color with adjustable transparency
Wick box shows high-low range with adjustable thickness and color
Dashed line at group close level for market direction hint
Full color customization
Toggle individual elements ON/OFF
Clean overlay – doesn’t interfere with price candles
Great for spotting:
Hidden support/resistance
Momentum buildup
Reversal traps and continuation setups
Keep your chart simple but smarter — all without changing your timeframe.