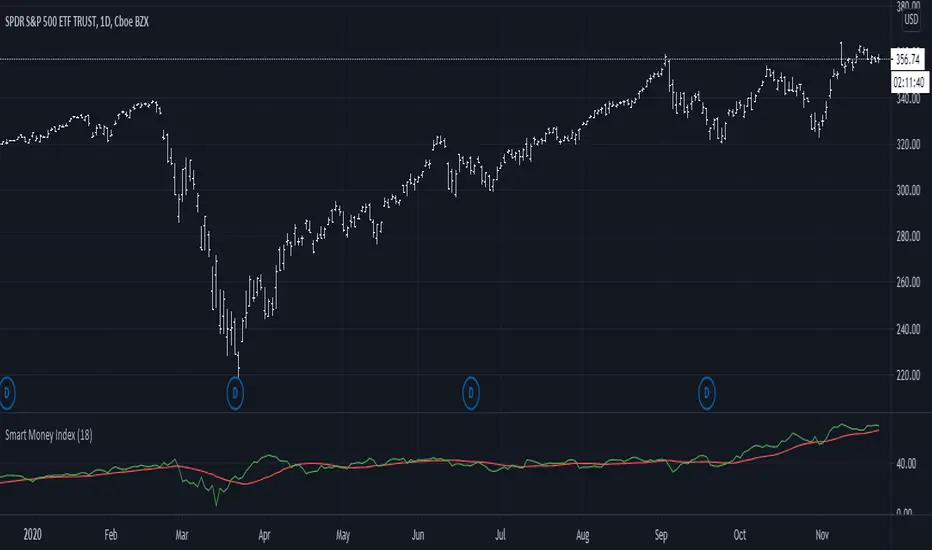
Smart Money Index (SMI)Smart money index (SMI) or smart money flow index is a technical analysis indicator demonstrating investors sentiment.
The index was invented and popularized by money manager Don Hays. The indicator is based on intra-day price patterns.
The main idea is that the majority of traders (emotional, news-driven) overreact at the beginning of the trading day
because of the overnight news and economic data. There is also a lot of buying on market orders and short covering at the opening.
Smart, experienced investors start trading closer to the end of the day having the opportunity to evaluate market performance.
Therefore, the basic strategy is to bet against the morning price trend and bet with the evening price trend. The SMI may be calculated
for many markets and market indices (S&P 500, DJIA, etc.)
The SMI sends no clear signal whether the market is bullish or bearish. There are also no fixed absolute or relative readings signaling
about the trend. Traders need to look at the SMI dynamics relative to that of the market. If, for example, SMI rises sharply when the
market falls, this fact would mean that smart money is buying, and the market is to revert to an uptrend soon. The opposite situation
is also true. A rapidly falling SMI during a bullish market means that smart money is selling and that market is to revert to a downtrend
soon. The SMI is, therefore, a trend-based indicator.
Some analysts use the smart money index to claim that precious metals such as gold will continually maintain value in the future.
"smart money" için komut dosyalarını ara

Smart Money Proxy IndexOverview
The Smart Money Proxy Index (SMPI) is an educational tool that attempts to identify potential institutional-style behavior patterns using publicly available market data. This comprehensive tool combines multiple institutional analysis techniques into a single, easy-to-read 0-100 oscillator.
Important Disclaimer
This is an educational proxy indicator that analyzes volume and price patterns. It cannot identify actual institutional trading activity and should not be interpreted as tracking real "smart money." Use for educational purposes and combine with other analysis methods.
Inspiration & Methodology
This indicator is inspired by MAPsignals' Big Money Index (BMI) methodology but uses publicly available price and volume data with original calculations. This is an independent educational interpretation designed to teach smart money concepts to retail traders.
What It Analyzes
SMPI tracks potential "smart money" activity by combining:
Block Trading Detection - Identifies unusual volume surges with significant price impact
Money Flow Analysis - Volume-weighted price pressure using Money Flow Index
Accumulation/Distribution Patterns - Modified On-Balance Volume signals
Institutional Control Proxy - End-of-day positioning and control analysis
Key Features
– Multi-Component Analysis - Combines 4 different institutional detection methods
– BMI-Style 0-100 Scale - Familiar oscillator range with clear extreme levels
– Professional Visualization - Dynamic colors, gradient fills, and clean data table
– Comprehensive Alerts - Buy/sell signals plus divergence detection
– Fully Customizable - Adjust all parameters, colors, and display options
– Non-Repainting Signals - All alerts use confirmed data for reliability
– Educational Focus - Designed to teach institutional flow concepts
How to Interpret
Above 80: Potential smart money distribution phase (bearish pressure)
Below 20: Potential smart money accumulation phase (bullish opportunity)
Signal Generation: Buy signals when crossing above 20, sell signals when crossing below 80
Divergences: Price vs SMPI divergences can signal potential trend changes
Volume Confirmation: Higher volume ratios strengthen signal reliability
Best Practices
Timeframes: Works best on higher timeframes for institutional behavior analysis
Confirmation: Combine with other technical analysis tools and market context
Volume: Pay attention to volume confirmation in the data table
Context: Consider overall market conditions and fundamental factors
Risk Management: Not recommended as standalone trading system
Customizable Parameters
Block Volume Threshold: Sensitivity for unusual volume detection (default: 2.5x average)
SMPI Smoothing Period: Index calculation smoothing (default: 25 bars)
Extreme Levels: Overbought/oversold thresholds (default: 80/20)
Money Flow Length: MFI calculation period (default: 14)
Visual Options: Colors, signals, and display preferences
Available Alerts
Buy Signal: SMPI crosses above oversold level (20)
Sell Signal: SMPI crosses below overbought level (80)
Extreme Levels: Alerts when reaching overbought/oversold zones
Divergence Detection: Bullish and bearish price vs SMPI divergences
Educational Purpose & Limitations
This indicator is designed as an educational proxy for understanding institutional flow concepts. It analyzes publicly available price and volume data to identify potential smart money behavior patterns.
Cannot access actual institutional transaction data
Signals may be slower than day-trading indicators (intentionally designed for institutional timeframes)
Should be used in conjunction with other analysis methods
Past performance does not guarantee future results
What Makes This Different
Unlike simple volume or momentum indicators, SMPI combines multiple institutional analysis techniques into one comprehensive tool. The multi-component approach provides a more robust view of potential smart money activity.

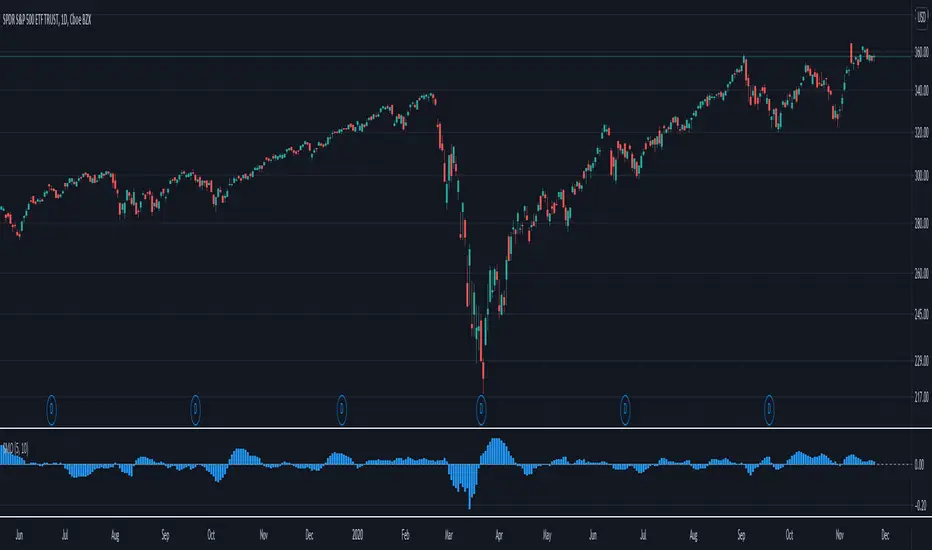
Smart Money Index (SMI)It came to my attention that one very common implementation of SMI was incorrect; rather than subtracting the first hour delta and adding the last hour delta it subtracts the whole day delta and adds the last 30m delta. While this indicator might have had some use, it is not what I understand to be the actual Smart Money Index and so I post this as a correction for use in other scripts.
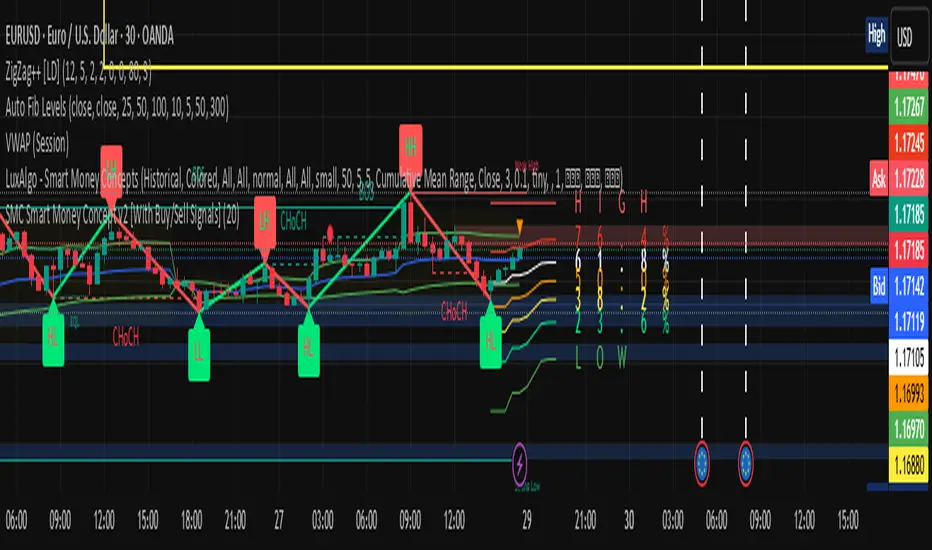
Smart Money Concepts [Modern Neon V2]This is a visually overhauled version of the popular Smart Money Concepts (SMC) indicator, designed specifically for traders who prefer Dark Mode, High Contrast, and Maximum Visibility.
While the underlying logic preserves the robust structure detection of the original LuxAlgo script, the visual presentation has been completely modernized. The default "dull" colors have been replaced with a vibrant Cyberpunk Neon palette, and text labels have been significantly upscaled to ensure market structure is readable at a glance, even on high-resolution monitors.
🎨 Visual & Style Enhancements:
Neon Palette:
Bullish: Electric Cyan (#00F5FF)
Bearish: Neon Hot Pink (#FF007F)
Neutral/Levels: Bright Gold (#FFD700)
High Visibility Text: Market Structure labels (BOS, CHoCH, HH/LL) have been upgraded from "Tiny" to Normal size. Key Swing Points (Strong High/Low) are set to Large.
Modern "Solid" Blocks: Order Blocks and FVGs feature reduced transparency (60%) for a bolder, solid look that doesn't get washed out on dark backgrounds.
Decluttered: Removed unnecessary "Small" elements and dotted lines to focus on price action.
🛠 Key Features:
Real-Time Structure: Automatic detection of Internal and Swing structure (BOS & CHoCH) with trend coloring.
Order Blocks: Highlights Bullish and Bearish Order Blocks with new mitigation logic.
Fair Value Gaps (FVG): Auto-threshold detection for high-probability gaps.
Premium & Discount Zones: Automatically plots equilibrium zones for better entry targeting.
Multi-Timeframe Levels: Display Daily, Weekly, and Monthly highs/lows.
Trend Dashboard: (If you added the dashboard code) A clean panel displaying the current Internal and Swing trend bias.
CREDITS & LICENSE: This script is a modification of the "Smart Money Concepts " indicator.
Original Author: © LuxAlgo
License: Attribution-NonCommercial-ShareAlike 4.0 International (CC BY-NC-SA 4.0)
creativecommons.org

Smart Money Index (50)Added MA50 to help interpret Smart Money Flow Index. Original SMI script by HPotter, idea of MA50 gotten from Troy Bombardia.

Liquidity + Order-Flow Exhaustion (Smart-Money Logic)Liquidity + Order-Flow Exhaustion (Smart-Money Logic) is a visual tool that helps traders recognize where big market participants (“smart money”) are likely accumulating or distributing positions.
It identifies liquidity sweeps (stop-hunts above or below previous swing levels) and market structure shifts (reversals confirmed by price closing back in the opposite direction).
In simple terms, it shows where price “tricks” retail traders into chasing breakouts — right before reversing.
How it works:
The script scans recent highs and lows to find when price breaks them and quickly rejects — a sign of stop-hunts or liquidity grabs.
It then checks for a close back inside the previous range to confirm a possible Market Structure Shift (MSS).
When this happens, the chart highlights the zone and optionally adds directional labels (🔹 or 🔸) to mark where the liquidity event occurred.
How to read the signals:
🟢 Bullish shift — Price takes out a previous low, then closes higher. This often marks the end of a short-term down-move.
🔴 Bearish shift — Price sweeps a previous high, then closes lower. This often marks the end of a short-term rally.
Colored backgrounds and labels help visualize these key reversals directly on the chart.
How to use it:
Apply to any timeframe; 15-minute to 4-hour charts work best.
Use it to confirm reversals near major swing points or liquidity zones.
Combine with volume spikes, displacement candles, or Fair-Value Gaps (FVGs) for stronger confirmation.
What makes it original:
Simple, self-contained logic inspired by Smart Money Concepts (SMC).
Automatically detects both liquidity sweeps and the subsequent structural shift.
Visual and alert-ready design — perfect for discretionary or algorithmic strategies.
Tip: For even better accuracy, align detected shifts with higher-timeframe bias or VWAP deviations.

Smart Money Oscillator [Nic]Smart money index (SMI) or smart money flow index is a technical analysis indicator demonstrating investors' sentiment. The index was invented and popularized by money manager Don Hays. The indicator is based on intra-day price patterns.
The main idea is that the majority of traders (emotional, news-driven) overreact at the beginning of the trading day because of the overnight news and economic data. There is also much buying on market orders and short covering at the opening. Therefore, the basic strategy is to bet against the morning price trend and bet with the evening price trend. The SMI may be calculated for many markets and market indices (S&P 500, Dow Jones, etc.)
This script turns the smart money index into an oscillator so you can determine the relative strength of the smart money.
Smart Money Flow - Exchange & TVL Composite# Smart Money Flow - Exchange & TVL Composite Indicator
## Overview
The **Smart Money Flow (SMF)** indicator combines two powerful on-chain metrics - **Exchange Flows** and **Total Value Locked (TVL)** - to create a composite index that tracks institutional and "smart money" movement in the cryptocurrency market. This indicator helps traders identify accumulation and distribution phases by analyzing where capital is flowing.
## What It Does
This indicator normalizes and combines:
- **Exchange Net Flow** (from IntoTheBlock): Tracks Bitcoin/Ethereum movement to and from exchanges
- **Total Value Locked** (from DefiLlama): Measures capital locked in DeFi protocols
The composite index is displayed on a 0-100 scale with clear zones for overbought/oversold conditions.
## Core Concept
### Exchange Flows
- **Negative Flow (Outflows)** = Bullish Signal
- Coins moving OFF exchanges → Long-term holding/accumulation
- Indicates reduced selling pressure
- **Positive Flow (Inflows)** = Bearish Signal
- Coins moving TO exchanges → Preparation for selling
- Indicates potential distribution phase
### Total Value Locked (TVL)
- **Rising TVL** = Bullish Signal
- Capital flowing into DeFi protocols
- Increased ecosystem confidence
- **Falling TVL** = Bearish Signal
- Capital exiting DeFi protocols
- Decreased ecosystem confidence
### Combined Signals
**🟢 Strong Bullish (70-100):**
- Exchange outflows + Rising TVL
- Smart money accumulating and deploying capital
**🔴 Strong Bearish (0-30):**
- Exchange inflows + Falling TVL
- Smart money preparing to sell and exiting positions
**⚪ Neutral (40-60):**
- Mixed or balanced flows
## Key Features
### ✅ Auto-Detection
- Automatically detects chart symbol (BTC/ETH)
- Uses appropriate exchange flow data for each asset
### ✅ Weighted Composite
- Customizable weights for Exchange Flow and TVL components
- Default: 50/50 balance
### ✅ Normalized Scale
- 0-100 index scale
- Configurable lookback period for normalization (default: 90 days)
### ✅ Signal Zones
- **Overbought**: 70+ (Strong bullish pressure)
- **Oversold**: 30- (Strong bearish pressure)
- **Extreme**: 85+ / 15- (Very strong signals)
### ✅ Clean Interface
- Minimal visual clutter by default
- Only main index line and MA visible
- Optional elements can be enabled:
- Background color zones
- Divergence signals
- Trend change markers
- Info table with detailed metrics
### ✅ Divergence Detection
- Identifies when price diverges from smart money flows
- Potential reversal warning signals
### ✅ Alerts
- Extreme overbought/oversold conditions
- Trend changes (crossing 50 line)
- Bullish/bearish divergences
## How to Use
### 1. Trend Confirmation
- Index above 50 = Bullish trend
- Index below 50 = Bearish trend
- Use with price action for confirmation
### 2. Reversal Signals
- **Extreme readings** (>85 or <15) suggest potential reversal
- Look for divergences between price and indicator
### 3. Accumulation/Distribution
- **70+**: Accumulation phase - smart money buying/holding
- **30-**: Distribution phase - smart money selling
### 4. DeFi Health
- Monitor TVL component for DeFi ecosystem strength
- Combine with exchange flows for complete picture
## Settings
### Data Sources
- **Exchange Flow**: IntoTheBlock real-time data
- **TVL**: DefiLlama aggregated DeFi TVL
- **Manual Mode**: For testing or custom data
### Indicator Settings
- **Smoothing Period (MA)**: Default 14 periods
- **Normalization Lookback**: Default 90 days
- **Exchange Flow Weight**: Adjustable 0-100%
- **Overbought/Oversold Levels**: Customizable thresholds
### Visual Options
- Show/Hide Moving Average
- Show/Hide Zone Lines
- Show/Hide Background Colors
- Show/Hide Divergence Signals
- Show/Hide Trend Markers
- Show/Hide Info Table
## Data Requirements
⚠️ **Important Notes:**
- Uses **daily data** from IntoTheBlock and DefiLlama
- Works on any chart timeframe (data updates daily)
- Auto-switches between BTC and ETH based on chart
- All other crypto charts default to BTC exchange flow data
## Best Practices
1. **Use on Daily+ Timeframes**
- On-chain data is daily, most effective on D/W/M charts
2. **Combine with Price Action**
- Use as confirmation, not standalone signals
3. **Watch for Divergences**
- Price making new highs while indicator falling = warning
4. **Monitor Extreme Zones**
- Sustained readings >85 or <15 indicate strong conviction
5. **Context Matters**
- Consider broader market conditions and fundamentals
## Calculation
1. **Exchange Net Flow** = Inflows - Outflows (inverted for index)
2. **TVL Rate of Change** = % change over smoothing period
3. **Normalize** both metrics to 0-100 scale
4. **Composite Index** = (ExchangeFlow × Weight) + (TVL × Weight)
5. **Smooth** with moving average
## Disclaimer
This indicator uses on-chain data for analysis. While valuable, it should not be used as the sole basis for trading decisions. Always combine with other technical analysis tools, fundamental analysis, and proper risk management.
On-chain data reflects blockchain activity but may lag price action. Use this indicator as part of a comprehensive trading strategy.
---
## Credits
**Data Sources:**
- IntoTheBlock: Exchange flow metrics
- DefiLlama: Total Value Locked data
**Indicator by:** @iCD_creator
**Version:** 1.0
**Pine Script™ Version:** 6
---
## Updates & Support
For questions, suggestions, or bug reports, please comment below or message the author.
**Like this indicator? Leave a 👍 and share your feedback!**

Smart Money Concepts [XoRonX]# Smart Money Concepts (SMC) - Advanced Trading Indicator
## 📊 Deskripsi
**Smart Money Concepts ** adalah indicator trading komprehensif yang menggabungkan konsep Smart Money Trading dengan berbagai alat teknikal analisis modern. Indicator ini dirancang untuk membantu trader mengidentifikasi pergerakan institusional (smart money), struktur pasar, zona supply/demand, dan berbagai sinyal trading penting.
Indicator ini mengintegrasikan multiple timeframe analysis, order blocks detection, fair value gaps, fibonacci retracement, volume profile, RSI multi-timeframe, dan moving averages dalam satu platform yang powerful dan mudah digunakan.
---
## 🎯 Fitur Utama
### 1. **Smart Money Structure**
- **Internal Structure** - Struktur pasar jangka pendek untuk entry presisi
- **Swing Structure** - Struktur pasar jangka panjang untuk trend analysis
- **BOS (Break of Structure)** - Konfirmasi kelanjutan trend
- **CHoCH (Change of Character)** - Deteksi potensi reversal
### 2. **Order Blocks**
- **Internal Order Blocks** - Zona demand/supply jangka pendek
- **Swing Order Blocks** - Zona demand/supply jangka panjang
- Filter otomatis berdasarkan volatilitas (ATR/Range)
- Mitigation tracking (High/Low atau Close)
- Customizable display (jumlah order blocks yang ditampilkan)
### 3. **Equal Highs & Equal Lows (EQH/EQL)**
- Deteksi otomatis equal highs/lows
- Indikasi liquidity zones
- Threshold adjustment untuk sensitivitas
- Visual lines dan labels
### 4. **Fair Value Gaps (FVG)**
- Multi-timeframe FVG detection
- Auto threshold filtering
- Bullish & Bearish FVG boxes
- Extension control
- Color customization
### 5. **Premium & Discount Zones**
- Premium Zone (75-100% dari range)
- Equilibrium Zone (47.5-52.5% dari range)
- Discount Zone (0-25% dari range)
- Auto-update berdasarkan swing high/low
### 6. **Fibonacci Retracement**
- **Equilibrium to Discount** - Fib dari EQ ke discount zone
- **Equilibrium to Premium** - Fib dari EQ ke premium zone
- **Discount to Premium** - Fib full range
- Reverse option
- Show/hide lines
- Custom colors
### 7. **Volume Profile (VRVP)**
- Visible Range Volume Profile
- Point of Control (POC)
- Value Area (70% volume)
- Auto-adjust rows
- Placement options (Left/Right)
- Width customization
### 8. **RSI Multi-Timeframe**
- Monitor 3 timeframes sekaligus
- Overbought/Oversold signals
- Visual table display
- Color-coded signals (Red OB, Green OS)
- Customizable position & size
### 9. **Moving Averages**
- 3 Moving Average lines
- Pilihan tipe: EMA, SMA, WMA
- Automatic/Manual period mode
- Individual color & width settings
- Cross alerts (MA vs MA, Price vs MA)
### 10. **Multi-Timeframe Levels**
- Support up to 5 different timeframes
- Previous high/low levels
- Custom line styles
- Color customization
### 11. **Candle Color**
- Color candles berdasarkan trend
- Bullish = Green, Bearish = Red
- Optional toggle
---
## 🛠️ Cara Penggunaan
### **A. Setup Awal**
1. **Tambahkan Indicator ke Chart**
- Buka TradingView
- Klik "Indicators" → "My Scripts" atau paste code
- Pilih "Smart Money Concepts "
2. **Pilih Mode Display**
- **Historical**: Tampilkan semua struktur (untuk backtesting)
- **Present**: Hanya tampilkan struktur terbaru (clean chart)
3. **Pilih Style**
- **Colored**: Warna berbeda untuk bullish/bearish
- **Monochrome**: Tema warna abu-abu
---
### **B. Penggunaan Fitur**
#### **1. Smart Money Structure**
**Internal Structure (Real-time):**
- ✅ Aktifkan "Show Internal Structure"
- Pilih tampilan: All, BOS only, atau CHoCH only
- Gunakan untuk entry timing presisi
- Filter confluence untuk mengurangi noise
**Swing Structure:**
- ✅ Aktifkan "Show Swing Structure"
- Pilih tampilan struktur bullish/bearish
- Adjust "Swings Length" (default: 50)
- Gunakan untuk konfirmasi trend utama
**Tips:**
- BOS = Konfirmasi trend continuation
- CHoCH = Warning untuk possible reversal
- Tunggu price retest ke order block setelah BOS
---
#### **2. Order Blocks**
**Setup:**
- ✅ Aktifkan Internal/Swing Order Blocks
- Set jumlah blocks yang ditampil (1-20)
- Pilih filter: ATR atau Cumulative Mean Range
- Pilih mitigation: Close atau High/Low
**Cara Trading:**
1. Tunggu BOS/CHoCH terbentuk
2. Identifikasi order block terdekat
3. Wait for price pullback ke order block
4. Entry saat price respek order block (rejection)
5. Stop loss di bawah/atas order block
6. Target: swing high/low berikutnya
**Color Code:**
- 🔵 Light Blue = Internal Bullish OB
- 🔴 Light Red = Internal Bearish OB
- 🔵 Dark Blue = Swing Bullish OB
- 🔴 Dark Red = Swing Bearish OB
---
#### **3. Equal Highs/Lows (EQH/EQL)**
**Setup:**
- ✅ Aktifkan "Equal High/Low"
- Set "Bars Confirmation" (default: 3)
- Adjust threshold (0-0.5, default: 0.1)
**Interpretasi:**
- EQH = Liquidity di atas, kemungkinan sweep lalu dump
- EQL = Liquidity di bawah, kemungkinan sweep lalu pump
- Biasanya smart money akan grab liquidity sebelum move besar
**Trading Strategy:**
- Wait for EQH/EQL formation
- Anticipate liquidity grab
- Entry setelah sweep dengan konfirmasi (order block, FVG, CHoCH)
---
#### **4. Fair Value Gaps (FVG)**
**Setup:**
- ✅ Aktifkan "Fair Value Gaps"
- Pilih timeframe (default: chart timeframe)
- Enable/disable auto threshold
- Set extension bars
**Cara Trading:**
1. Bullish FVG = Support zone untuk buy
2. Bearish FVG = Resistance zone untuk sell
3. Price tends to fill FVG (retest)
4. Entry saat price kembali ke FVG
5. Partial fill = valid, full fill = invalidated
**Tips:**
- FVG + Order Block = High probability setup
- Multi-timeframe FVG lebih kuat
- Unfilled FVG = strong momentum
---
#### **5. Premium & Discount Zones**
**Setup:**
- ✅ Aktifkan "Premium/Discount Zones"
- Zones akan auto-update berdasarkan swing high/low
**Interpretasi:**
- 🟢 **Discount Zone** = Area BUY (price murah)
- ⚪ **Equilibrium** = Neutral (50%)
- 🔴 **Premium Zone** = Area SELL (price mahal)
**Trading Strategy:**
- BUY dari discount zone
- SELL dari premium zone
- Avoid trading di equilibrium
- Combine dengan structure confirmation
---
#### **6. Fibonacci Retracement**
**Setup:**
- Pilih Fib yang ingin ditampilkan:
- Equilibrium to Discount
- Equilibrium to Premium
- Discount to Premium
- Toggle show lines
- Enable reverse jika perlu
- Custom colors
**Key Levels:**
- 0.236 = Shallow retracement
- 0.382 = Common retracement
- 0.5 = 50% golden level
- 0.618 = Golden ratio (penting!)
- 0.786 = Deep retracement
**Cara Pakai:**
- 0.618-0.786 = Ideal entry zone dalam trend
- Combine dengan order blocks
- Wait for confirmation candle
---
#### **7. Volume Profile (VRVP)**
**Setup:**
- ✅ Aktifkan "Show Volume Profile"
- Set jumlah rows (10-100)
- Adjust width (5-50%)
- Pilih placement (Left/Right)
- Enable POC dan Value Area
**Interpretasi:**
- **POC (Point of Control)** = Harga dengan volume tertinggi = magnet
- **Value Area** = 70% volume = fair price range
- **Low Volume Nodes** = Weak support/resistance
- **High Volume Nodes** = Strong support/resistance
**Trading:**
- POC acts as support/resistance
- Price tends to return to POC
- Breakout dari Value Area = momentum
---
#### **8. RSI Multi-Timeframe**
**Setup:**
- ✅ Aktifkan "Show RSI Table"
- Set 3 timeframes (default: chart, 5m, 15m)
- Set RSI period (default: 14)
- Set Overbought level (default: 70)
- Set Oversold level (default: 30)
- Pilih posisi & ukuran table
**Interpretasi:**
- 🟢 **OS (Oversold)** = RSI ≤ 30 = Kondisi jenuh jual
- 🔴 **OB (Overbought)** = RSI ≥ 70 = Kondisi jenuh beli
- **-** = Neutral zone
**Trading Strategy:**
1. Multi-timeframe alignment = strong signal
2. OS + Bullish structure = BUY signal
3. OB + Bearish structure = SELL signal
4. Divergence RSI vs Price = reversal warning
**Contoh:**
- TF1: OS, TF2: OS, TF3: OS + Price di discount zone = STRONG BUY
---
#### **9. Moving Averages**
**Setup:**
- Pilih MA Type: EMA, SMA, atau WMA (berlaku untuk ketiga MA)
- Pilih Period Mode: Automatic atau Manual
- Set period untuk MA 1, 2, 3 (default: 20, 50, 100)
- Custom color & width per MA
- ✅ Enable Cross Alerts
**Interpretasi:**
- **Golden Cross** = MA fast cross above MA slow = Bullish
- **Death Cross** = MA fast cross below MA slow = Bearish
- Price above all MAs = Strong uptrend
- Price below all MAs = Strong downtrend
**Trading Strategy:**
1. MA1 (20) = Short-term trend
2. MA2 (50) = Medium-term trend
3. MA3 (100) = Long-term trend
**Entry Signals:**
- Price bounce dari MA dalam trend = continuation
- MA cross dengan konfirmasi structure = entry
- Multiple MA confluence = strong support/resistance
**Alerts Available:**
- MA1 cross MA2/MA3
- MA2 cross MA3
- Price cross any MA
---
#### **10. Multi-Timeframe Levels**
**Setup:**
- Enable HTF Level 1-5
- Set timeframes (contoh: 5m, 1H, 4H, D, W)
- Pilih line style (solid/dashed/dotted)
- Custom colors
**Cara Pakai:**
- Previous high/low dari HTF = strong S/R
- Breakout HTF level = significant move
- Multiple HTF levels confluence = major zone
---
### **C. Trading Setup Combination**
#### **Setup 1: High Probability Buy (Bullish)**
1. ✅ Swing structure: Bullish BOS
2. ✅ Price di Discount Zone
3. ✅ Pullback ke Bullish Order Block
4. ✅ Bullish FVG di bawah
5. ✅ RSI Multi-TF: Oversold
6. ✅ Price bounce dari MA
7. ✅ POC/Value Area support
8. ✅ Fibonacci 0.618-0.786 retracement
**Entry:** Saat price reject dari order block dengan confirmation candle
**Stop Loss:** Below order block
**Target:** Swing high atau premium zone
---
#### **Setup 2: High Probability Sell (Bearish)**
1. ✅ Swing structure: Bearish BOS
2. ✅ Price di Premium Zone
3. ✅ Pullback ke Bearish Order Block
4. ✅ Bearish FVG di atas
5. ✅ RSI Multi-TF: Overbought
6. ✅ Price reject dari MA
7. ✅ POC/Value Area resistance
8. ✅ Fibonacci 0.618-0.786 retracement
**Entry:** Saat price reject dari order block dengan confirmation candle
**Stop Loss:** Above order block
**Target:** Swing low atau discount zone
---
#### **Setup 3: Liquidity Grab (EQH/EQL)**
1. ✅ Identifikasi EQH atau EQL
2. ✅ Wait for liquidity sweep
3. ✅ Konfirmasi dengan CHoCH
4. ✅ Order block terbentuk setelah sweep
5. ✅ Entry saat retest order block
---
### **D. Tips & Best Practices**
**Risk Management:**
- Selalu gunakan stop loss
- Risk 1-2% per trade
- Risk:Reward minimum 1:2
- Jangan over-leverage
**Confluence adalah Kunci:**
- Minimal 3-4 konfirmasi sebelum entry
- Lebih banyak konfirmasi = higher probability
- Quality over quantity
**Timeframe Analysis:**
- HTF (Higher Timeframe) = Trend direction
- LTF (Lower Timeframe) = Entry timing
- Align dengan HTF trend
**Backtesting:**
- Gunakan mode "Historical"
- Test strategy di berbagai market condition
- Record dan analyze hasil
**Market Condition:**
- Trending market = Follow BOS, use order blocks
- Ranging market = Use premium/discount zones, EQH/EQL
- High volatility = Wider stops, wait for clear structure
**Avoid:**
- Trading di equilibrium zone
- Entry tanpa konfirmasi
- Fighting the trend
- Overleveraging
- Emotional trading
---
## 📈 Recommended Settings
### **For Scalping (1m - 5m):**
- Internal Structure: ON
- Swing Structure: OFF
- Order Blocks: Internal only
- RSI Timeframes: 1m, 5m, 15m
- MA Periods: 9, 21, 50
### **For Day Trading (15m - 1H):**
- Internal Structure: ON
- Swing Structure: ON
- Order Blocks: Both
- RSI Timeframes: 15m, 1H, 4H
- MA Periods: 20, 50, 100
### **For Swing Trading (4H - D):**
- Internal Structure: OFF
- Swing Structure: ON
- Order Blocks: Swing only
- RSI Timeframes: 4H, D, W
- MA Periods: 20, 50, 200
---
## ⚠️ Disclaimer
Indicator ini adalah alat bantu analisis teknikal. Tidak ada indicator yang 100% akurat. Selalu:
- Lakukan analisa fundamental
- Gunakan proper risk management
- Praktik di demo account terlebih dahulu
- Trading memiliki resiko, trade at your own risk
---
## 📝 Version Info
**Version:** 5.0
**Platform:** TradingView Pine Script v5
**Author:** XoRonX
**Max Labels:** 500
**Max Lines:** 500
**Max Boxes:** 500
---
## 🔄 Updates & Support
Untuk update, bug reports, atau pertanyaan:
- Check documentation regularly
- Test new features in replay mode
- Backup your settings before updates
---
## 🎓 Learning Resources
**Recommended Study:**
1. Smart Money Concepts (SMC) basics
2. Order blocks theory
3. Liquidity concepts
4. ICT (Inner Circle Trader) concepts
5. Volume profile analysis
6. Multi-timeframe analysis
**Practice:**
- Start with higher timeframes
- Master one concept at a time
- Keep a trading journal
- Review your trades weekly
---
**Happy Trading! 🚀📊**
_Remember: The best indicator is your own analysis and discipline._

Smart Money IndicatorSmart Money Indicator
Overview:
The "Smart Money Indicator" is a custom Pine Script indicator designed to help traders identify potential instances of "smart money" or institutional activity in the financial markets. The concept of "smart money" suggests that institutional investors or sophisticated market participants may have an edge due to their access to resources, information, and analytical tools.
Indicator Features:
Volume Moving Average: The indicator calculates a simple moving average (SMA) of the trading volume over a specified length (default is 20 bars). This moving average serves as a baseline for evaluating current trading volume.
Smart Money Signals: The indicator plots green triangles below the price bars when the current trading volume is significantly higher (50% above) than the moving average. This is intended to highlight potential instances of "smart money" activity.
Dumb Money Signals: Conversely, the indicator plots red triangles above the price bars when the current trading volume is significantly lower (50% below) than the moving average. This is meant to indicate potential "dumb money" activity.
How to Use:
Traders can use this indicator to identify potential shifts in market sentiment driven by institutional activity. When the green "Smart Money" triangles appear, it may suggest increased institutional interest or significant trading volume, potentially signaling a noteworthy market event. Conversely, red "Dumb Money" triangles may indicate periods of reduced institutional activity.
Disclaimer:
It's important to note that this indicator is a simplified representation of the concept of "smart money" and should be used in conjunction with other technical and fundamental analysis tools. Trading decisions should not be based solely on this indicator, and thorough research and due diligence are essential before making trading or investment decisions.
Customization:
Traders can customize the indicator by adjusting the length of the volume moving average to match their trading preferences and strategies. Experimentation and fine-tuning may be necessary to optimize its performance for specific markets and timeframes.

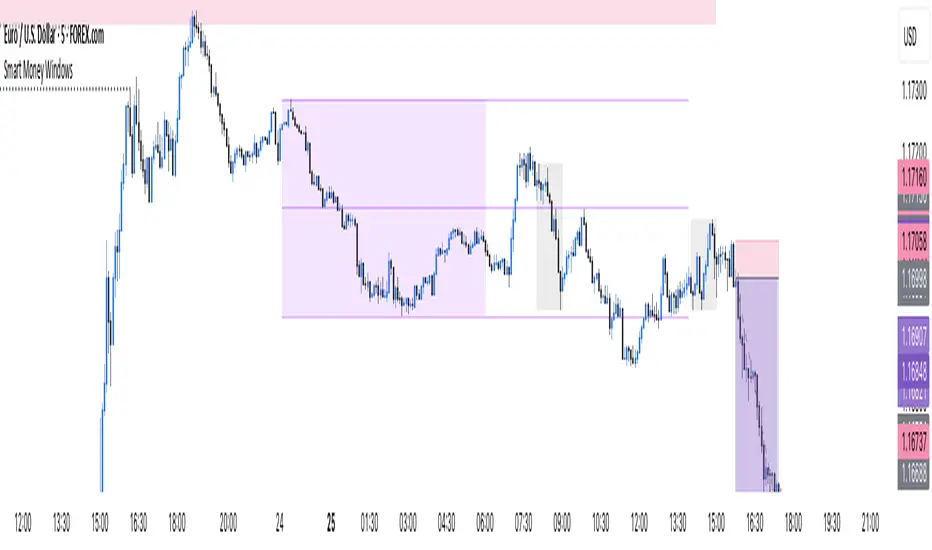
Smart Money Windows- X7Smart Money Windows 📊💰
Unlock the secret moves of the big players! This indicator highlights key liquidity traps, smart money zones, and market kill zones for the Asian, London, and New York sessions. See where the pros hide their orders and spot potential price flips before they happen! 🚀🔥
Features:
Visual session boxes with high/low/mid levels 🟪🟫
NY session shifted 60 mins for precise timing 🕒
Perfect for spotting traps, inducements & smart money maneuvers 🎯
Works on Forex, crypto, and stocks 💹
Get in the “Smart Money Window” and trade like the pros! 💸🔑
By HH
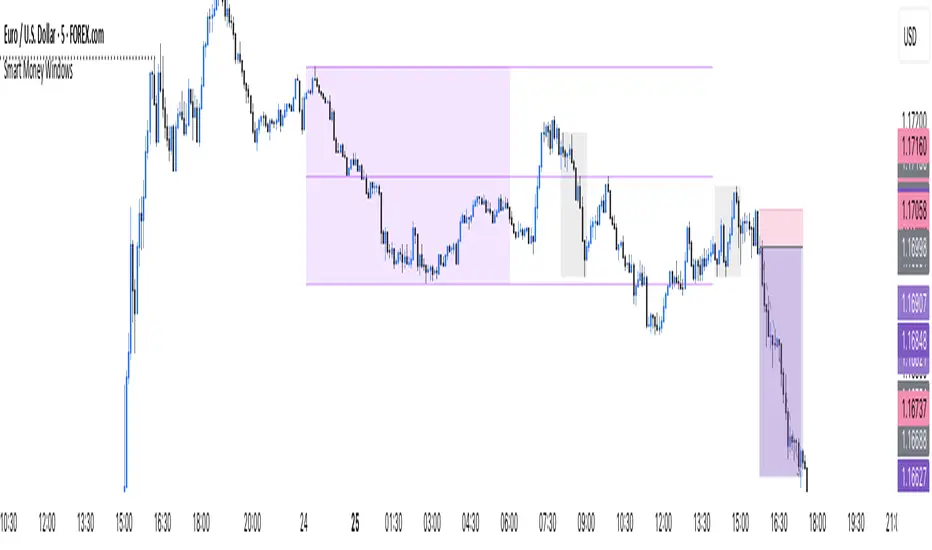
Smart Money Trap SignalSmart Money Trap Signal – Indicator Description
The Smart Money Trap Signal is a precision-based trading tool designed to identify areas where institutional traders (smart money) are likely to trap retail traders through false breakouts and liquidity grabs. These traps often occur near key highs and lows, where retail traders are lured into trades just before price reverses sharply.
🔍 Key Features:
Liquidity Sweep Detection
Identifies false breakouts of recent swing highs or lows, signaling potential liquidity grabs by large players.
Reversal Confirmation
Confirms the trap using a classic price action reversal pattern (bullish or bearish engulfing), helping filter out weak signals.
Optional Volume Spike Filter
Allows additional confirmation based on a significant spike in volume, indicating potential institutional involvement.
Buy and Sell Trap Signals
🔴 Smart Money Short (SMT↓) – Triggered when price sweeps a high and reverses down.
🟢 Smart Money Long (SMT↑) – Triggered when price sweeps a low and reverses up.
Alerts & Labels
Real-time alert conditions and on-chart labels to help you catch setups without missing opportunities.
📈 How to Use:
Apply on Higher Timeframes (1H, 4H, Daily) for cleaner signals.
Look for SMT signals at key supply/demand zones or market structure points.
Combine with your existing trading strategy, such as order blocks or break of structure (BoS), for higher accuracy.
Use volume filter only if you're analyzing markets where volume data is reliable.
⚠️ Disclaimer:
This tool is meant to assist with trade identification, not trade execution. Always use proper risk management and validate setups with your trading plan.
Smart Money vs Retail (COT Flow) 0213Smart Money vs Retail (COT Flow) 0213
Smart Money vs Retail (COT Flow) 0213
Smart Money vs Retail (COT Flow) 0213
Smart Money vs Retail (COT Flow) 0213Smart Money vs Retail (COT Flow) 0213
Smart Money vs Retail (COT Flow) 0213
Smart Money vs Retail (COT Flow) 0213

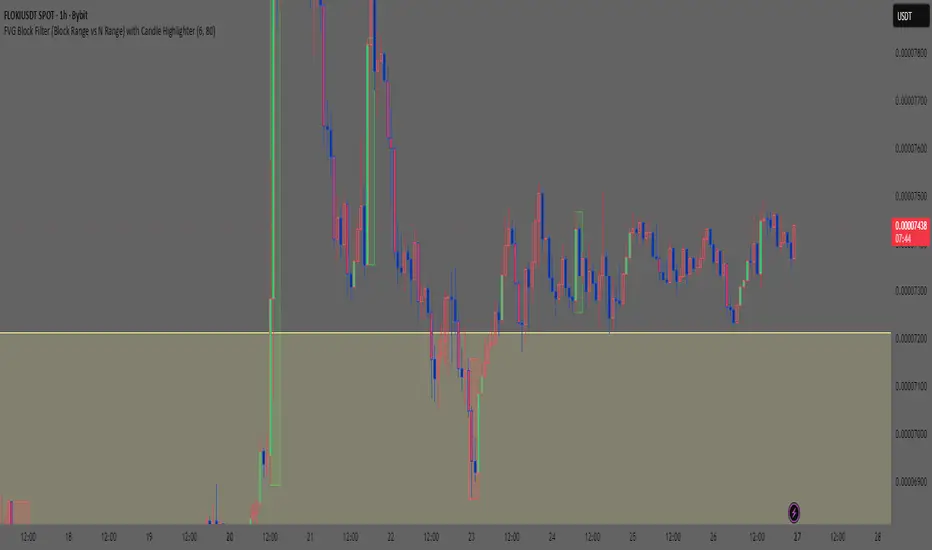
Smart Money Concept: FVG Block Filter Smart Money Concept: FVG Block Filter (FVG Block Range vs N Range) with Candle Highlighter
Summary:
Smart Money Concept (SMC): An advanced indicator designed to visualize and filter Fair Value Gaps (FVG) blocks based on their size (Range) compared to the preceding N Range candle movement. It also includes a customizable Candle Highlighter function that marks the specific candle responsible for creating the FVG. The indicator allows full color customization for both blocks and the highlighter, and features clean, label-free charts by default.
Key Features:
FVG Block Detection: Automatically identifies and groups sequential FVG imbalances to form consolidated FVG blocks.
FVG Block Filtering (N Range): Filters blocks based on a user-defined rule, comparing the block's size (Range) to the range of the preceding N candles (e.g., requiring the FVG block to be larger than the range of the previous 6 candles).
Customizable Candle Highlighter: Marks the central candle (B) within the FVG structure (A-B-C) to highlight the source of the price imbalance. Highlighter colors are fully adjustable via inputs.
Visualization Control: Labels are turned OFF by default to keep the chart clean but can be easily enabled via the indicator settings.
Full Color Customization: Allows independent customization of Bullish and Bearish FVG Block colors, Block Transparency, and Bullish/Bearish Highlighter colors.
Keywords:
Smart Money Concept, SMC, Fair Value Gap, FVG, Imbalance, Block Filter, Candle Highlighter, Range.
Smart Money Concept v1Smart Money Concept Indicator – Visual Interpretation Guide
What Happens When Liquidity Lines Are Broken
🟩 Green Line Broken (Buy-Side Liquidity Pool Swept)
- Indicates price has dipped below a previous swing low where sell stops are likely placed.
- Market Makers may be triggering these stops to accumulate long positions.
- Often followed by a bullish reversal.
- Trader Actions:
• Look for a bullish candle close after the sweep.
• Confirm with nearby Bullish Order Block or Fair Value Gap.
• Consider entering a Buy trade (SLH entry).
- If price continues falling: Indicates trend continuation and invalidation of the buy-side liquidity zone.
🟥 Red Line Broken (Sell-Side Liquidity Pool Swept)
- Indicates price has moved above a previous swing high where buy stops are likely placed.
- Market Makers may be triggering these stops to accumulate short positions.
- Often followed by a bearish reversal.
- Trader Actions:
• Look for a bearish candle close after the sweep.
• Confirm with nearby Bearish Order Block or Fair Value Gap.
• Consider entering a Sell trade (SLH entry).
- If price continues rising: Indicates trend continuation and invalidation of the sell-side liquidity zone.
Chart-Based Interpretation of Green Line Breaks
In the provided DOGE/USD 15-minute chart image:
- Green lines represent buy-side liquidity zones.
- If these lines are broken:
• It may be a stop hunt before a bullish continuation.
• Or a false Break of Structure (BOS) leading to deeper retracement.
- Confirmation is needed from candle structure and nearby OB/FVG zones.
Is the Pink Zone a Valid Bullish Order Block?
To validate the pink zone as a Bullish OB:
- It should be formed by a strong down-close candle followed by a bullish move.
- Price should have rallied from this zone previously.
- If price is now retesting it and showing bullish reaction, it confirms validity.
- If formed during low volume or price never rallied from it, it may not be valid.
Smart Money Concept - Liquidity Line Breaks Explained
This document explains how traders should interpret the breaking of green (buy-side) and red (sell-side) liquidity lines when using the Smart Money Concept indicator. These lines represent key liquidity pools where stop orders are likely placed.
🟩 Green Line Broken (Buy-Side Liquidity Pool Swept)
When the green line is broken, it indicates:
• - Price has dipped below a previous swing low where sell stops were likely placed.
• - Market Makers have triggered those stops to accumulate long positions.
• - This is often followed by a bullish reversal.
Trader Actions:
• - Look for a bullish candle close after the sweep.
• - Confirm with a nearby Bullish Order Block or Fair Value Gap.
• - Consider entering a Buy trade (SLH entry).
🟥 Red Line Broken (Sell-Side Liquidity Pool Swept)
When the red line is broken, it indicates:
• - Price has moved above a previous swing high where buy stops were likely placed.
• - Market Makers have triggered those stops to accumulate short positions.
• - This is often followed by a bearish reversal.
Trader Actions:
• - Look for a bearish candle close after the sweep.
• - Confirm with a nearby Bearish Order Block or Fair Value Gap.
• - Consider entering a Sell trade (SLH entry).
📌 Additional Notes
• - If price continues beyond the liquidity line without reversal, it may indicate a trend continuation rather than a stop hunt.
• - Always confirm with Higher Time Frame bias, Institutional Order Flow, and price reaction at the zone.

Smart Money Structure█████████████████████████████████████████████████████████████████████████████
█ SMART MONEY STRUCTURE | SMS Pro
█ Institutional Order Flow & Liquidity Zones
█ by @scalping-algo
█████████████████████████████████████████████████████████████████████████████
📋 OVERVIEW
━━━━━━━━━━━━━━━━━━━━━━━━━━━━━━━━━━━━━━━━━━━━━━━━━━━━━━━━━━━━━━━━━━━━━━━━━━━━━
This indicator automatically detects and plots Smart Money Concepts (SMC)
including Break of Structure (BOS), Demand & Supply Zones, and Flip Zones.
Perfect for traders who follow institutional order flow and price action.
🎯 INDICATOR COMPONENTS
━━━━━━━━━━━━━━━━━━━━━━━━━━━━━━━━━━━━━━━━━━━━━━━━━━━━━━━━━━━━━━━━━━━━━━━━━━━━━
⚡ BOS (Break of Structure)
┄┄┄┄┄┄┄┄┄┄┄┄┄┄┄┄┄┄┄┄┄┄┄┄┄┄
• Bullish BOS: Price breaks above previous swing high → Trend shift UP
• Bearish BOS: Price breaks below previous swing low → Trend shift DOWN
✦ How to use:
→ Wait for BOS confirmation before entering trades
→ Bullish BOS = Look for long entries
→ Bearish BOS = Look for short entries
→ Combine with zones for high-probability setups
🟦 DEMAND ZONE (Teal Box)
┄┄┄┄┄┄┄┄┄┄┄┄┄┄┄┄┄┄┄┄┄┄┄┄┄
• Last bearish candle before a bullish BOS
• Institutional buying area / Unfilled orders
✦ How to use:
→ Wait for price to retrace into the zone
→ Look for bullish rejection / confirmation candle
→ Enter LONG with stop below the zone
→ Target: Previous high or next supply zone
🟪 SUPPLY ZONE (Purple Box)
┄┄┄┄┄┄┄┄┄┄┄┄┄┄┄┄┄┄┄┄┄┄┄┄┄┄
• Last bullish candle before a bearish BOS
• Institutional selling area / Unfilled orders
✦ How to use:
→ Wait for price to retrace into the zone
→ Look for bearish rejection / confirmation candle
→ Enter SHORT with stop above the zone
→ Target: Previous low or next demand zone
🔵 FLIP+ / MIT+ (Cyan Box)
┄┄┄┄┄┄┄┄┄┄┄┄┄┄┄┄┄┄┄┄┄┄┄┄┄
• FLIP+: Old supply zone that flipped to demand (breaker block)
• MIT+: Mitigation zone - area where price may return to rebalance
✦ How to use:
→ Stronger than regular demand zones
→ Price often reacts sharply at flip zones
→ Great for continuation trades after BOS
→ Enter LONG when price taps the zone
🔴 FLIP- / MIT- (Pink Box)
┄┄┄┄┄┄┄┄┄┄┄┄┄┄┄┄┄┄┄┄┄┄┄┄┄
• FLIP-: Old demand zone that flipped to supply (breaker block)
• MIT-: Mitigation zone - area where price may return to rebalance
✦ How to use:
→ Stronger than regular supply zones
→ Price often reacts sharply at flip zones
→ Great for continuation trades after BOS
→ Enter SHORT when price taps the zone
📐 STRUCTURE LINES (Gray Dashed)
┄┄┄┄┄┄┄┄┄┄┄┄┄┄┄┄┄┄┄┄┄┄┄┄┄┄┄┄┄┄┄
• Connects swing highs and lows
• Shows market structure and trend direction
✦ How to use:
→ Upward sloping = Bullish structure
→ Downward sloping = Bearish structure
→ Trade in the direction of structure
📊 TRADING STRATEGY
━━━━━━━━━━━━━━━━━━━━━━━━━━━━━━━━━━━━━━━━━━━━━━━━━━━━━━━━━━━━━━━━━━━━━━━━━━━━━
LONG SETUP:
┌─────────────────────────────────────────┐
│ 1. Wait for Bullish ⚡ BOS │
│ 2. Mark the DEMAND or FLIP+ zone │
│ 3. Wait for price to retrace to zone │
│ 4. Enter on bullish confirmation │
│ 5. Stop loss: Below the zone │
│ 6. Take profit: Next SUPPLY zone │
└─────────────────────────────────────────┘
SHORT SETUP:
┌─────────────────────────────────────────┐
│ 1. Wait for Bearish ⚡ BOS │
│ 2. Mark the SUPPLY or FLIP- zone │
│ 3. Wait for price to retrace to zone │
│ 4. Enter on bearish confirmation │
│ 5. Stop loss: Above the zone │
│ 6. Take profit: Next DEMAND zone │
└─────────────────────────────────────────┘
⚙️ SETTINGS GUIDE
━━━━━━━━━━━━━━━━━━━━━━━━━━━━━━━━━━━━━━━━━━━━━━━━━━━━━━━━━━━━━━━━━━━━━━━━━━━━━
• Structure Length (default: 9)
└─ Higher = Less signals, stronger zones
└─ Lower = More signals, more noise
└─ Recommended: 7-14 depending on timeframe
• Confirmation Factor (default: 0.33)
└─ Filters out weak structure breaks
└─ Higher = More confirmation needed
└─ Lower = Earlier signals
• Auto-Remove Broken Zones
└─ ON: Removes zones when price breaks through
└─ OFF: Keeps all zones visible
💡 PRO TIPS
━━━━━━━━━━━━━━━━━━━━━━━━━━━━━━━━━━━━━━━━━━━━━━━━━━━━━━━━━━━━━━━━━━━━━━━━━━━━━
✓ Use higher timeframes (4H, Daily) for stronger zones
✓ Combine with volume analysis for confirmation
✓ FLIP zones are generally stronger than regular zones
✓ Fresh (untested) zones have higher probability
✓ Multiple timeframe analysis = Higher accuracy
✓ Don't trade against the BOS direction
⚠️ RISK DISCLAIMER
━━━━━━━━━━━━━━━━━━━━━━━━━━━━━━━━━━━━━━━━━━━━━━━━━━━━━━━━━━━━━━━━━━━━━━━━━━━━━
Trading involves substantial risk. Past performance is not indicative of
future results. This indicator is a tool to assist your analysis, not a
guarantee of profits. Always use proper risk management.
━━━━━━━━━━━━━━━━━━━━━━━━━━━━━━━━━━━━━━━━━━━━━━━━━━━━━━━━━━━━━━━━━━━━━━━━━━━━━
📧 Questions? Leave a comment below!
⭐ If you find this useful, please give it a BOOST!
🔔 Follow @scalping-algo for more indicators
━━━━━━━━━━━━━━━━━━━━━━━━━━━━━━━━━━━━━━━━━━━━━━━━━━━━━━━━━━━━━━━━━━━━━━━━━━━━━

Smart Money — Volume Panel + OBV Smart Money — Volume Panel + Scaled OBV
This indicator combines classic volume analysis with a scaled On-Balance Volume (OBV) line, helping spot smart money activity:
Volume bars – color changes dynamically:
🟢 green = high volume & OBV rising
🔴 red = high volume & OBV falling
🟠 orange = high volume but OBV neutral
⚪ gray = low volume
Yellow line – volume moving average (MA)
Purple line – high-volume threshold (MA × multiplier)
OBV line (green/red) – scaled OBV plotted in the same range as volume for easier comparison.

Smart Money Signals - Minimal v5 (No VWAP, Manual CMF) - RajeevSmart Money Signals - Minimal v5 (No VWAP, Manual CMF) - Rajeev

Smart Money ConceptSmart Money Concept is being used to understand the Market Structure, Demand/Supply, and Risk Management.
- Lines represent BoS and CHoCH.
- X-cross and Diamond shapes represent Peak and Trough.
- Numbers represent the Spread Percentages.

Smart Money Concept [TradingFinder] Major OB + FVG + Liquidity🔵 Introduction
"Smart Money" refers to funds under the control of institutional investors, central banks, funds, market makers, and other financial entities. Ordinary people recognize investments made by those who have a deep understanding of market performance and possess information typically inaccessible to regular investors as "Smart Money".
Consequently, when market movements often diverge from expectations, traders identify the footprints of smart money. For example, when a classic pattern forms in the market, traders take short positions. However, the market might move upward instead. They attribute this contradiction to smart money and seek to capitalize on such inconsistencies in their trades.
The "Smart Money Concept" (SMC) is one of the primary styles of technical analysis that falls under the subset of "Price Action". Price action encompasses various subcategories, with one of the most significant being "Supply and Demand", in which SMC is categorized.
The SMC method aims to identify trading opportunities by emphasizing the impact of large traders (Smart Money) on the market, offering specific patterns, techniques, and trading strategies.
🟣 Key Terms of Smart Money Concept (SMC)
• Market Structure (Trend)
• Change of Character (ChoCh)
• Break of Structure (BoS)
• Order Blocks (Supply and Demand)
• Imbalance (IMB)
• Inefficiency (IFC)
• Fair Value Gap (FVG)
• Liquidity
• Premium and Discount
🔵 How Does the "Smart Money Concept Indicator" Work?
🟣 Market Structure
a. Accumulation
b. Market-Up
c. Distribution
d. Market-Down
a) Accumulation Phase : During the accumulation period, typically following a downtrend, smart money enters the market without significantly affecting the pricing trend.
b) Market-Up Phase : In this phase, the price of an asset moves upward from the accumulation range and begins to rise. Usually, the buying by retail investors is the main driver of this trend, and due to positive market sentiment, it continues.
c) Distribution Phase : The distribution phase, unlike the accumulation stage, occurs after an uptrend. In this phase, smart money attempts to exit the market without causing significant price fluctuations.
d) Market-Down Phase : In this stage, the price of an asset moves downward from the distribution phase, initiating a prolonged downtrend. Smart money liquidates all its positions by creating selling pressure, trapping latecomer investors.
The result of these four phases in the market becomes the market trend.
Types of Trends in Financial Markets :
a. Up-Trend
b. Down Trend
c. Range (No Trend)
a) Up-Trend : The market breaks consecutive highs.
b) Down Trend : The market breaks consecutive lows.
c) No Trend or Range : The market oscillates within a range without breaking either highs or lows.
🟣 Change of Character (ChoCh)
The "ChoCh" or "Change of Character" pattern indicates an initial change in order flow in financial markets. This structural change occurs when a major pivot in the opposite direction of the market trend fails. It signals a potential change in the market trend and can serve as a signal for short-term or long-term trend changes in a trading symbol.
🟣 Break of Structure (BoS)
The "BoS" or "Break of Structure" pattern indicates the continuation of the trend in financial markets. This structure forms when, in an uptrend, the price breaks its ceiling or, in a downtrend, the price breaks its floor.
🟣 Order Blocks (Supply and Demand)
Order blocks consist of supply and demand areas where the likelihood of price reversal is higher. There are six order blocks in this indicator, categorized based on their origin and formation reasons.
a. Demand Main Zone, "ChoCh" Origin.
b. Demand Sub Zone, "ChoCh" Origin.
c. Demand All Zone, "BoS" Origin.
d. Supply Main Zone, "ChoCh" Origin.
e. Supply Sub Zone, "ChoCh" Origin.
f. Supply All Zone, "BoS" Origin.
🟣 FVG | Inefficiency | Imbalance
These three terms are almost synonymous. They describe the presence of gaps between consecutive candle shadows. This inefficiency occurs when the market moves rapidly. Primarily, imbalances and these rapid movements stem from the entry of smart money and the imbalance between buyer and seller power. Therefore, identifying these movements is crucial for traders.
These areas are significant because prices often return to fill these gaps or even before they occur to fill price gaps.
🟣 Liquidity
Liquidity zones are areas where there is a likelihood of congestion of stop-loss orders. Liquidity is considered the driving force of the entire market, and market makers may manipulate the market using these zones. However, in many cases, this does not happen because there is insufficient liquidity in some areas.
Types of Liquidity in Financial Markets :
a. Trend Lines
b. Double Tops | Double Bottoms
c. Triple Tops | Triple Bottoms
d. Support Lines | Resistance Lines
All four types of liquidity in this indicator are automatically identified.
🟣 Premium and Discount
Premium and discount zones can assist traders in making better decisions. For instance, they may sell positions in expensive ranges and buy in cheaper ranges. The closer the price is to the major resistance, the more expensive it is, and the closer it is to the major support, the cheaper it is.
🔵 How to Use
🟣 Change of Character (ChoCh) and Break of Structure (BoS)
This indicator detects "ChoCh" and "BoS" in both Minor and Major states. You can turn on the display of these lines by referring to the last part of the settings.
🟣 Order Blocks (Supply and Demand)
Order blocks are Zones where the probability of price reversal is higher. In demand Zones you can buy opportunities and in supply Zones you can check sell opportunities.
The "Refinement" feature allows you to adjust the width of the order block according to your strategy. There are two modes, "Aggressive" and "Defensive," in the "Order Block Refine". The difference between "Aggressive" and "Defensive" lies in the width of the order block.
For risk-averse traders, the "Defensive" mode is suitable as it provides a lower loss limit and a greater reward-to-risk ratio. For risk-taking traders, the "Aggressive" mode is more appropriate. These traders prefer to enter trades at higher prices, and this mode, which has a wider order block width, is more suitable for this group of individuals.
🟣 Fair Value Gap (FVG) | Imbalance (IMB) | Inefficiency (IFC)
In order to identify the "fair value gap" on the chart, it must be analyzed candle by candle. In this process, it is important to pay attention to candles with a large size, and a candle and a candle should be examined before that.
Candles before and after this central candle should have long shadows and their bodies should not overlap with the central candle body. The distance between the shadows of the first and third candles is known as the FVG range.
These areas work in two ways :
• Supply and demand area : In this case, the price reacts to these areas and the trend is reversed.
• Liquidity zone : In this scenario, the price "fills" the zone and then reaches the order block.
Important note : In most cases, the FVG zone of very small width acts as a supply and demand zone, while the zone of significant width acts as a liquidity zone and absorbs price.
When the FVG filter is activated, the FVG regions are filtered based on the specified algorithm.
FVG filter types include the following :
1. Very Aggressive Mode : In addition to the initial condition, an additional condition is considered. For bullish FVG, the maximum price of the last candle must be greater than the maximum price of the middle candle.
Similarly, for a bearish FVG, the minimum price of the last candle must be lower than the minimum price of the middle candle. This mode removes the minimum number of FVGs.
2. Aggressive : In addition to the very aggressive condition, the size of the middle candle is also considered. The size of the center candle should not be small and therefore more FVGs are removed in this case.
3. Defensive : In addition to the conditions of the very aggressive mode, this mode also considers the size of the middle pile, which should be relatively large and make up the majority of the body.
Also, to identify bullish FVGs, the second and third candles must be positive, while for bearish FVGs, the second and third candles must be negative. This mode filters out a significant number of FVGs and keeps only those of good quality.
4. Very Defensive : In addition to the conditions of the defensive mode, in this mode the first and third candles should not be very small-bodied doji candles. This mode filters out most FVGs and only the best quality ones remain.
🟣 Liquidity
These levels are where traders intend to exit their trades. "Market makers" or smart money usually accumulate or distribute their trading positions near these levels, where many retail traders have placed their "stop loss" orders. When liquidity is collected from these losses, the price often reverses.
A "Stop hunt" is a move designed to offset liquidity generated by established stop losses. Banks often use major news events to trigger stop hunts and capture liquidity released into the market. For example, if they intend to execute heavy buy orders, they encourage others to sell through stop-hots.
Consequently, if there is liquidity in the market before reaching the order block area, the validity of that order block is higher. Conversely, if the liquidity is close to the order block, that is, the price reaches the order block before reaching the liquidity limit, the validity of that order block is lower.
🟣 Alert
With the new alert functionality in this indicator, you won't miss any important trading signals. Alerts are activated when the price hits the last order block.
1. It is possible to set alerts for each "symbol" and "time frame". The system will automatically detect both and include them in the warning message.
2. Each alert provides the exact date and time it was triggered. This helps you measure the timeliness of the signal and evaluate its relevance.
3. Alerts include target order block price ranges. The "Proximal" level represents the initial price level strike, while the "Distal" level represents the maximum price gap in the block. These details are included in the warning message.
4. You can customize the alert name through the "Alert Name" entry.
5. Create custom messages for "long" and "short" alerts to be sent with notifications.
🔵 Setting
a. Pivot Period of Order Blocks Detector :
Using this parameter, you can set the zigzag period that is formed based on the pivots.
b. Order Blocks Validity Period (Bar) :
You can set the validity period of each Order Block based on the number of candles that have passed since the origin of the Order Block.
c. Demand Main Zone, "ChoCh" Origin :
You can control the display or not display as well as the color of Demand Main Zone, "ChoCh" Origin.
d. Demand Sub Zone, "ChoCh" Origin :
You can control the display or not display as well as the color of Demand Sub Zone, "ChoCh" Origin.
e. Demand All Zone, "BoS" Origin :
You can control the display or not display as well as the color of Demand All Zone, "BoS" Origin.
f. Supply Main Zone, "ChoCh" Origin :
You can control the display or not display as well as the color of Supply Main Zone, "ChoCh" Origin.
g. Supply Sub Zone, "ChoCh" Origin :
You can control the display or not display as well as the color of Supply Sub Zone, "ChoCh" Origin.
h. Supply All Zone, "BoS" Origin :
You can control the display or not display as well as the color of Supply All Zone, "BoS" Origin.
i. Refine Demand Main : You can choose to be refined or not and also the type of refining.
j. Refine Demand Sub : You can choose to be refined or not and also the type of refining.
k. Refine Demand BoS : You can choose to be refined or not and also the type of refining.
l. Refine Supply Main : You can choose to be refined or not and also the type of refining.
m. Refine Supply Sub : You can choose to be refined or not and also the type of refining.
n. Refine Supply BoS : You can choose to be refined or not and also the type of refining.
o. Show Demand FVG : You can choose to show or not show Demand FVG.
p. Show Supply FVG : You can choose to show or not show Supply FVG
q. FVG Filter : You can choose whether FVG is filtered or not. Also specify the type of filter you want to use.
r. Show Statics High Liquidity Line : Show or not show Statics High Liquidity Line.
s. Show Statics Low Liquidity Line : Show or not show Statics Low Liquidity Line.
t. Show Dynamics High Liquidity Line : Show or not show Dynamics High Liquidity Line.
u. Show Dynamics Low Liquidity Line : Show or not show Dynamics Low Liquidity Line.
v. Statics Period Pivot :
Using this parameter, you can set the Swing period that is formed based on Static Liquidity Lines.
w. Dynamics Period Pivot :
Using this parameter, you can set the Swing period that is formed based Dynamics Liquidity Lines.
x. Statics Liquidity Line Sensitivity :
is a number between 0 and 0.4. Increasing this number decreases the sensitivity of the "Statics Liquidity Line Detection" function and increases the number of lines identified. The default value is 0.3.
y. Dynamics Liquidity Line Sensitivity :
is a number between 0.4 and 1.95. Increasing this number increases the sensitivity of the "Dynamics Liquidity Line Detection" function and decreases the number of lines identified. The default value is 1.
z. Alerts Name : You can customize the alert name using this input and set it to your desired name.
aa. Alert Demand Main Mitigation :
If you want to receive the alert about Demand Main 's mitigation after setting the alerts, leave this tick on. Otherwise, turn it off.
bb. Alert Demand Sub Mitigation :
If you want to receive the alert about Demand Sub's mitigation after setting the alerts, leave this tick on. Otherwise, turn it off.
cc. Alert Demand BoS Mitigation :
If you want to receive the alert about Demand BoS's mitigation after setting the alerts, leave this tick on. Otherwise, turn it off.
dd. Alert Supply Main Mitigation :
If you want to receive the alert about Supply Main's mitigation after setting the alerts, leave this tick on. Otherwise, turn it off.
ee. Alert Supply Sub Mitigation :
If you want to receive the alert about Supply Sub's mitigation after setting the alerts, leave this tick on. Otherwise, turn it off.
ff. Alert Supply BoS Mitigation :
If you want to receive the alert about Supply BoS's mitigation after setting the alerts, leave this tick on. Otherwise, turn it off.
gg. Message Frequency :
This parameter, represented as a string, determines the frequency of announcements. Options include: 'All' (triggers the alert every time the function is called), 'Once Per Bar' (triggers the alert only on the first call within the bar), and 'Once Per Bar Close' (activates the alert only during the final script execution of the real-time bar upon closure). The default setting is 'Once per Bar'.
hh. Show Alert time by Time Zone :
The date, hour, and minute displayed in alert messages can be configured to reflect any chosen time zone. For instance, if you prefer London time, you should input 'UTC+1'. By default, this input is configured to the 'UTC' time zone.
ii. Display More Info : The 'Display More Info' option provides details regarding the price range of the order blocks (Zone Price), along with the date, hour, and minute. If you prefer not to include this information in the alert message, you should set it to 'Off'.
You also have access to display or not to display, choose the Style and Color of all the lines below :
a. Major Bullish "BoS" Lines
b. Major Bearish "BoS" Lines
c. Minor Bullish "BoS" Lines
d. Minor Bearish "BoS" Lines
e. Major Bullish "ChoCh" Lines
f. Major Bearish "ChoCh" Lines
g. Minor Bullish "ChoCh" Lines
h. Minor Bearish "ChoCh" Lines
i. Last Major Support Line
j. Last Major Resistance Line
k. Last Minor Support Line
l. Last Minor Resistance Line

Smart Money Zones (FVG + OB) + MTF Trend Panel## Overview
Professional-grade institutional trading zones indicator that identifies **Fair Value Gaps (FVG)** and **Order Blocks (OB)** - key price inefficiencies where smart money operates. Includes a comprehensive **Multi-Timeframe Trend Panel** for complete market context at a glance.
## Core Features
### 🎯 Fair Value Gaps (FVG)
Fair Value Gaps occur when price moves so aggressively that it leaves an "imbalance" or "gap" in the market structure. These zones often act as magnets where price returns to find liquidity.
**Detection Logic:**
- **Bullish FVG**: When current candle's low is above the high of the candle 2 bars ago
- **Bearish FVG**: When current candle's high is below the low of the candle 2 bars ago
- Requires strong impulse candle (configurable body percentage threshold)
- Color-coded zones: Green for bullish, Red for bearish
### 📦 Order Blocks (OB)
Order Blocks represent the last opposite candle before a significant price move - the zone where institutional orders were placed before the breakout.
**Detection Logic:**
- Identifies the last bearish candle before a strong bullish breakout (Bullish OB)
- Identifies the last bullish candle before a strong bearish breakout (Bearish OB)
- Validates breakout strength using ATR multiplier (1.2x default)
- Color-coded zones: Blue for bullish, Orange for bearish
### 📊 Multi-Timeframe Trend Panel
Real-time trend analysis across **7 timeframes** displayed in an elegant dashboard:
- **1 Minute** - Ultra short-term scalping
- **5 Minutes** - Short-term momentum
- **15 Minutes** - Intraday swings
- **30 Minutes** - Session trends
- **1 Hour** - Multi-session trends
- **4 Hours** - Daily structure
- **Daily** - Long-term direction
**Visual Indicators:**
- 🟢 Green circle = Bullish trend
- 🔴 Red circle = Bearish trend
- Clean, professional table design with customizable position and size
## Intelligence Features
### 🧠 Zone Strength Rating
Every zone is automatically classified by strength based on size relative to ATR:
- **VERY STRONG** - 2.0x ATR or more (major institutional zones)
- **STRONG** - 1.5x to 2.0x ATR (significant zones)
- **MEDIUM** - 1.0x to 1.5x ATR (moderate zones)
- **WEAK** - Below 1.0x ATR (minor zones)
Strength rating helps you prioritize which zones to trade from!
### 📉 Smart Mitigation Tracking
Zones automatically track how much they've been "filled" or mitigated:
- Calculates penetration percentage as price enters the zone
- Zones turn **gray** when 50%+ mitigated or fully filled
- Option to **auto-delete** mitigated zones to keep chart clean
- Live zones extend dynamically with price action
### 🎨 Trend Filter (Optional)
When enabled, only shows zones aligned with the current trend:
- Uses customizable MA period (default 50)
- Bullish zones only appear in uptrend
- Bearish zones only appear in downtrend
- Reduces noise and false signals significantly
## Customization Options
### Display Settings
- Toggle FVGs and OBs independently
- Adjust max zones per type (5-200)
- Choose to remove or gray out mitigated zones
- Color customization for all zone types
### Detection Parameters
- **Min Impulse Body %**: Controls how strong the impulse candle must be (0.3-1.0)
- **Order Block Lookback**: How many bars to look back for OB validation (5-50)
- **ATR Length**: Period for ATR calculation (5-50)
### Trend Filter
- Enable/disable trend filtering
- Adjustable MA period for trend determination
### MTF Panel
- Show/hide the trend panel
- 4 position options: Top Right, Top Left, Bottom Right, Bottom Left
- 3 size options: Small, Normal, Large
- Customizable MA period for trend calculation across all timeframes
## Trading Applications
### 1. **Liquidity Grab Entries**
Wait for price to sweep a zone (50%+ mitigation) then enter on reversal. Smart money often "hunts" these zones before the real move begins.
### 2. **Confluence Trading**
Look for zones that align with:
- Multiple timeframe trends showing same direction
- Multiple FVGs/OBs stacking in same area
- Key support/resistance levels
### 3. **Breakout Confirmation**
Use Order Blocks to confirm the strength of breakouts. Strong OBs indicate institutional participation.
### 4. **Retracement Entries**
Enter when price returns to a fresh, unmitigated zone in the direction of the higher timeframe trend.
### 5. **Range Trading**
Identify FVG zones at range extremes - price often reverses at these inefficiencies.
## How It Works
**Fair Value Gaps** form when the middle candle creates such aggressive movement that it leaves a price gap between the high/low of surrounding candles. Institutional traders know these gaps get filled.
**Order Blocks** mark the origin of major moves. The last opposite-colored candle before a breakout is where large orders were placed. Price often returns to these zones for "retests" before continuing.
**Mitigation** happens when price returns to fill these zones. The indicator tracks this automatically, showing you which zones are still "fresh" and which have been used up.
## Best Practices
✅ **Use higher timeframe trends** - Always check the MTF panel before taking trades
✅ **Trade fresh zones** - Unmitigated zones (not gray) have the highest probability
✅ **Combine with price action** - Look for rejection wicks and engulfing candles at zones
✅ **Respect zone strength** - VERY STRONG and STRONG zones are most reliable
✅ **Use trend filter** - Especially on lower timeframes to reduce false signals
❌ **Don't overtrade** - Not every zone will react, wait for confirmation
❌ **Don't ignore context** - Check the MTF panel for conflicting trends
❌ **Don't chase** - Wait for price to come to the zone, don't enter mid-zone
## Technical Details
- **Non-repainting**: All zones are drawn on confirmed candles only
- **Performance optimized**: Uses efficient array management with per-type caps
- **Real-time updates**: Zones extend and track mitigation as price moves
- **Universal compatibility**: Works on all markets and timeframes
## Recommended Settings by Style
**Scalping (1m-5m charts):**
- Max zones: 10-15
- Use trend filter: ON
- MTF Panel: Focus on 1m-15m trends
- Remove mitigated: ON (keep chart clean)
**Day Trading (5m-1H charts):**
- Max zones: 15-20
- Use trend filter: ON
- MTF Panel: Focus on 15m-4H trends
- Remove mitigated: OFF (track zone history)
**Swing Trading (1H-D charts):**
- Max zones: 20+
- Use trend filter: Optional
- MTF Panel: Focus on 1H-1D trends
- Remove mitigated: OFF (important zones persist)
---
## Perfect For
- Smart Money Concept (SMC) traders
- ICT methodology followers
- Institutional order flow traders
- Price action traders seeking key zones
- Multi-timeframe analysis enthusiasts
**Compatible with all markets:** Forex, Crypto, Stocks, Indices, Commodities, Futures
*Trade where the institutions trade. Follow the smart money.*
