[SHORT ONLY] Consecutive Bars Above MA Strategy█ STRATEGY DESCRIPTION
The "Consecutive Bars Above MA Strategy" is a contrarian trading system aimed at exploiting overextended bullish moves in stocks and ETFs. It monitors the number of consecutive bars that close above a chosen short-term moving average (which can be either a Simple Moving Average or an Exponential Moving Average). Once the count reaches a preset threshold and the current bar’s close exceeds the previous bar’s high within a designated trading window, a short entry is initiated. An optional EMA filter further refines entries by requiring that the current close is below the 200-period EMA, helping to ensure that trades are taken in a bearish environment.
█ HOW ARE THE CONSECUTIVE BULLISH COUNTS CALCULATED?
The strategy utilizes a counter variable, `bullCount`, to track consecutive bullish bars based on their relation to the short-term moving average. Here’s how the count is determined:
Initialize the Counter
The counter is initialized at the start:
var int bullCount = na
Bullish Bar Detection
For each bar, if the close is above the selected moving average (either SMA or EMA, based on user input), the counter is incremented:
bullCount := close > signalMa ? (na(bullCount) ? 1 : bullCount + 1) : 0
Reset on Non-Bullish Condition
If the close does not exceed the moving average, the counter resets to zero, indicating a break in the consecutive bullish streak.
█ SIGNAL GENERATION
1. SHORT ENTRY
A short signal is generated when:
The number of consecutive bullish bars (i.e., bars closing above the short-term MA) meets or exceeds the defined threshold (default: 3).
The current bar’s close is higher than the previous bar’s high.
The signal occurs within the specified trading window (between Start Time and End Time).
Additionally, if the EMA filter is enabled, the entry is only executed when the current close is below the 200-period EMA.
2. EXIT CONDITION
An exit signal is triggered when the current close falls below the previous bar’s low, prompting the strategy to close the short position.
█ ADDITIONAL SETTINGS
Threshold: The number of consecutive bullish bars required to trigger a short entry (default is 3).
Trading Window: The Start Time and End Time inputs define when the strategy is active.
Moving Average Settings: Choose between SMA and EMA, and set the MA length (default is 5), which is used to assess each bar’s bullish condition.
EMA Filter (Optional): When enabled, this filter requires that the current close is below the 200-period EMA, supporting entries in a downtrend.
█ PERFORMANCE OVERVIEW
This strategy is designed for stocks and ETFs and can be applied across various timeframes.
It seeks to capture mean reversion by shorting after a series of bullish bars suggests an overextended move.
The approach employs a contrarian short entry by waiting for a breakout (close > previous high) following consecutive bullish bars.
The adjustable moving average settings and optional EMA filter allow for further optimization based on market conditions.
Comprehensive backtesting is recommended to fine-tune the threshold, moving average parameters, and filter settings for optimal performance.
"signal" için komut dosyalarını ara

[SHORT ONLY] Consecutive Close>High[1] Mean Reversion Strategy█ STRATEGY DESCRIPTION
The "Consecutive Close > High " Mean Reversion Strategy is a contrarian daily trading system for stocks and ETFs. It identifies potential shorting opportunities by counting consecutive days where the closing price exceeds the previous day's high. When this consecutive day count reaches a predetermined threshold, and if the close is below a 200-period EMA (if enabled), a short entry is triggered, anticipating a corrective pullback.
█ HOW ARE THE CONSECUTIVE BULLISH COUNTS CALCULATED?
The strategy uses a counter variable called `bullCount` to track how many consecutive bars meet a bullish condition. Here’s a breakdown of the process:
Initialize the Counter
var int bullCount = 0
Bullish Bar Detection
Every time the close exceeds the previous bar's high, increment the counter:
if close > high
bullCount += 1
Reset on Bearish Bar
When there is a clear bearish reversal, the counter is reset to zero:
if close < low
bullCount := 0
█ SIGNAL GENERATION
1. SHORT ENTRY
A Short Signal is triggered when:
The count of consecutive bullish closes (where close > high ) reaches or exceeds the defined threshold (default: 3).
The signal occurs within the specified trading window (between Start Time and End Time).
2. EXIT CONDITION
An exit Signal is generated when the current close falls below the previous bar’s low (close < low ), prompting the strategy to exit the position.
█ ADDITIONAL SETTINGS
Threshold: The number of consecutive bullish closes required to trigger a short entry (default is 3).
Start Time and End Time: The time window during which the strategy is allowed to execute trades.
EMA Filter (Optional): When enabled, short entries are only triggered if the current close is below the 200-period EMA.
█ PERFORMANCE OVERVIEW
This strategy is designed for Stocks and ETFs on the Daily timeframe and targets overextended bullish moves.
It aims to capture mean reversion by entering short after a series of consecutive bullish closes.
Further optimization is possible with additional filters (e.g., EMA, volume, or volatility).
Backtesting should be used to fine-tune the threshold and filter settings for specific market conditions.

[SHORT ONLY] Internal Bar Strength (IBS) Mean Reversion Strategy█ STRATEGY DESCRIPTION
The "Internal Bar Strength (IBS) Strategy" is a mean-reversion strategy designed to identify trading opportunities based on the closing price's position within the daily price range. It enters a short position when the IBS indicates overbought conditions and exits when the IBS reaches oversold levels. This strategy is Short-Only and was designed to be used on the Daily timeframe for Stocks and ETFs.
█ WHAT IS INTERNAL BAR STRENGTH (IBS)?
Internal Bar Strength (IBS) measures where the closing price falls within the high-low range of a bar. It is calculated as:
IBS = (Close - Low) / (High - Low)
- Low IBS (≤ 0.2) : Indicates the close is near the bar's low, suggesting oversold conditions.
- High IBS (≥ 0.8) : Indicates the close is near the bar's high, suggesting overbought conditions.
█ SIGNAL GENERATION
1. SHORT ENTRY
A Short Signal is triggered when:
The IBS value rises to or above the Upper Threshold (default: 0.9).
The Closing price is greater than the previous bars High (close>high ).
The signal occurs within the specified time window (between `Start Time` and `End Time`).
2. EXIT CONDITION
An exit Signal is generated when the IBS value drops to or below the Lower Threshold (default: 0.3). This prompts the strategy to exit the position.
█ ADDITIONAL SETTINGS
Upper Threshold: The IBS level at which the strategy enters trades. Default is 0.9.
Lower Threshold: The IBS level at which the strategy exits short positions. Default is 0.3.
Start Time and End Time: The time window during which the strategy is allowed to execute trades.
█ PERFORMANCE OVERVIEW
This strategy is designed for Stocks and ETFs markets and performs best when prices frequently revert to the mean.
The strategy can be optimized further using additional conditions such as using volume or volatility filters.
It is sensitive to extreme IBS values, which help identify potential reversals.
Backtesting results should be analyzed to optimize the Upper/Lower Thresholds for specific instruments and market conditions.

Volatility Momentum Breakout StrategyDescription:
Overview:
The Volatility Momentum Breakout Strategy is designed to capture significant price moves by combining a volatility breakout approach with trend and momentum filters. This strategy dynamically calculates breakout levels based on market volatility and uses these levels along with trend and momentum conditions to identify trade opportunities.
How It Works:
1. Volatility Breakout:
• Methodology:
The strategy computes the highest high and lowest low over a defined lookback period (excluding the current bar to avoid look-ahead bias). A multiple of the Average True Range (ATR) is then added to (or subtracted from) these levels to form dynamic breakout thresholds.
• Purpose:
This method helps capture significant price movements (breakouts) while ensuring that only past data is used, thereby maintaining realistic signal generation.
2. Trend Filtering:
• Methodology:
A short-term Exponential Moving Average (EMA) is applied to determine the prevailing trend.
• Purpose:
Long trades are considered only when the current price is above the EMA, indicating an uptrend, while short trades are taken only when the price is below the EMA, indicating a downtrend.
3. Momentum Confirmation:
• Methodology:
The Relative Strength Index (RSI) is used to gauge market momentum.
• Purpose:
For long entries, the RSI must be above a mid-level (e.g., above 50) to confirm upward momentum, and for short entries, it must be below a similar threshold. This helps filter out signals during overextended conditions.
Entry Conditions:
• Long Entry:
A long position is triggered when the current closing price exceeds the calculated long breakout level, the price is above the short-term EMA, and the RSI confirms momentum (e.g., above 50).
• Short Entry:
A short position is triggered when the closing price falls below the calculated short breakout level, the price is below the EMA, and the RSI confirms momentum (e.g., below 50).
Risk Management:
• Position Sizing:
Trades are sized to risk a fixed percentage of account equity (set here to 5% per trade in the code, with each trade’s stop loss defined so that risk is limited to approximately 2% of the entry price).
• Stop Loss & Take Profit:
A stop loss is placed a fixed ATR multiple away from the entry price, and a take profit target is set to achieve a 1:2 risk-reward ratio.
• Realistic Backtesting:
The strategy is backtested using an initial capital of $10,000, with a commission of 0.1% per trade and slippage of 1 tick per bar—parameters chosen to reflect conditions faced by the average trader.
Important Disclaimers:
• No Look-Ahead Bias:
All breakout levels are calculated using only past data (excluding the current bar) to ensure that the strategy does not “peek” into future data.
• Educational Purpose:
This strategy is experimental and provided solely for educational purposes. Past performance is not indicative of future results.
• User Responsibility:
Traders should thoroughly backtest and paper trade the strategy under various market conditions and adjust parameters to fit their own risk tolerance and trading style before live deployment.
Conclusion:
By integrating volatility-based breakout signals with trend and momentum filters, the Volatility Momentum Breakout Strategy offers a unique method to capture significant price moves in a disciplined manner. This publication provides a transparent explanation of the strategy’s components and realistic backtesting parameters, making it a useful tool for educational purposes and further customization by the TradingView community.

[COG] Advanced School Run StrategyAdvanced School Run Strategy (ASRS) – Explanation
Overview: The Advanced School Run Strategy (ASRS) is an intraday trading approach designed to identify breakout opportunities based on specific time and price patterns. This script applies the concepts of the Advanced School Run Strategy as outlined in Tom Hougaard's research, adapted to work seamlessly on TradingView charts. It leverages 5-minute candlestick data to set actionable breakout levels and provides traders with visual cues and alerts to make informed decisions.
Features:
Dynamic Breakout Levels: Automatically calculates high and low levels based on the market's behavior during the initial trading minutes.
Custom Visualization: Highlights breakout zones with customizable colors and transparency, providing clear visual feedback for bullish and bearish breakouts.
Configurable Alerts: Includes alert conditions for both bullish and bearish breakouts, ensuring traders never miss a trading opportunity.
Reset Logic: Resets breakout levels daily at the market open to ensure accurate signal generation for each session.
How It Works:
The script identifies key levels (high and low) after a configurable number of minutes from the market open (default: 25 minutes).
If the price breaks above the high level or below the low level, a corresponding breakout is detected.
The script draws breakout zones on the chart and triggers alerts based on the breakout direction.
All levels and signals reset at the start of each new trading session, maintaining relevance to current market conditions.
Customization Options:
Line and box colors for bullish and bearish breakouts.
Transparency levels for breakout visualizations.
Alert settings to receive notifications for detected breakouts.
Acknowledgment: This script is inspired by Tom Hougaard's Advanced School Run Strategy. The methodology has been translated into Pine Script for TradingView users, adhering to TradingView’s policies and community guidelines. This script does not redistribute proprietary content from the original research but implements the principles for educational and analytical purposes.

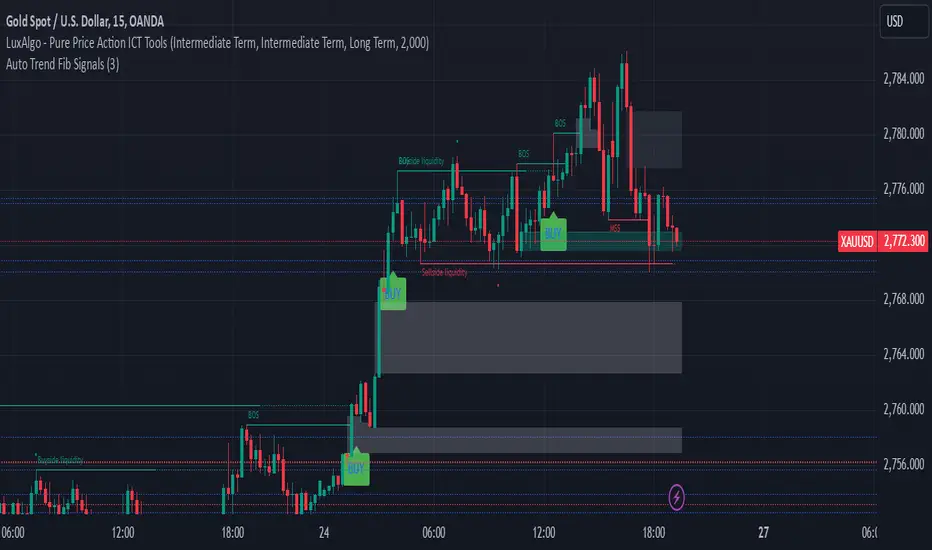
Auto Trend Fib Signals BY studio DivinKey Features
Dynamic SL using ATR volatility measure
Two-Tier Profit Taking for partial/full exits
Automatic Level Calculation based on Fibonacci extensions
Clear Visual Labels with exact price levels
Consistent Risk Management (1.5-2% per trade)
Optimization Table
Parameter Scalping Day Trading Swing Trading
ATR Multiplier 1.0 1.5 2.0
TP1 (1.272) 70% Position 50% Position 30% Position
TP2 (1.618) 30% Position 50% Position 70% Position
Time Frame 15-min 1-hour 4-hour
Pro Tips
Confirm with Volume: Increase volume at Fib levels improves signal reliability
Adjust in Ranging Markets: Use tighter SL (1.0x ATR) during consolidation
Trailing Stop: Move SL to breakeven at TP1 hit
Session Timing: Trade during London/NY overlap for best volatility
Advanced Options Trading Indicator: Buy & Sell Signal Generator This powerful custom indicator combines the Relative Strength Index (RSI) and Moving Average (MA) to help traders identify optimal entry and exit points in the options market. The indicator generates real-time buy and sell signals based on RSI crossovers and price positioning relative to the moving average, providing actionable insights for traders seeking to make informed decisions. Additionally, it calculates potential call and put option strike prices with a buffer for added flexibility and precision, ensuring a well-rounded approach to options trading.

Prime Bands [ChartPrime]The Prime Standard Deviation Bands indicator uses custom-calculated bands based on highest and lowest price values over specific period to analyze price volatility and trend direction. Traders can set the bands to 1, 2, or 3 standard deviations from a central base, providing a dynamic view of price behavior in relation to volatility. The indicator also includes color-coded trend signals, standard deviation labels, and mean reversion signals, offering insights into trend strength and potential reversal points.
⯁ KEY FEATURES AND HOW TO USE
⯌ Standard Deviation Bands :
The indicator plots upper and lower bands based on standard deviation settings (1, 2, or 3 SDs) from a central base, allowing traders to visualize volatility and price extremes. These bands can be used to identify overbought and oversold conditions, as well as potential trend reversals.
Example of 3-standard-deviation bands around price:
⯌ Dynamic Trend Indicator :
The midline of the bands changes color based on trend direction. If the midline is rising, it turns green, indicating an uptrend. When the midline is falling, it turns orange, suggesting a downtrend. This color coding provides a quick visual reference to the current trend.
Trend color examples for rising and falling midlines:
⯌ Standard Deviation Labels :
At the end of the bands, the indicator displays labels with price levels for each standard deviation level (+3, 0, -3, etc.), helping traders quickly reference where price is relative to its statistical boundaries.
Price labels at each standard deviation level on the chart:
⯌ Mean Reversion Signals :
When price moves beyond the upper or lower bands and then reverts back inside, the indicator plots mean reversion signals with diamond icons. These signals indicate potential reversal points where the price may return to the mean after extreme moves.
Example of mean reversion signals near bands:
⯌ Standard Deviation Scale on Chart :
A visual scale on the right side of the chart shows the current price position in relation to the bands, expressed in standard deviations. This scale provides an at-a-glance view of how far price has deviated from the mean, helping traders assess risk and volatility.
⯁ USER INPUTS
Length : Sets the number of bars used in the calculation of the bands.
Standard Deviation Level : Allows selection of 1, 2, or 3 standard deviations for upper and lower bands.
Colors : Customize colors for the uptrend and downtrend midline indicators.
⯁ CONCLUSION
The Prime Standard Deviation Bands indicator provides a comprehensive view of price volatility and trend direction. Its customizable bands, trend coloring, and mean reversion signals allow traders to effectively gauge price behavior, identify extreme conditions, and make informed trading decisions based on statistical boundaries.

Volatility Signaling 50SMAOverview of the Script:
The script implements a volatility signaling indicator using a 50-period Simple Moving Average (SMA). It incorporates Bollinger Bands and the Average True Range (ATR) to dynamically adjust the SMA's color based on volatility conditions. Here's a detailed breakdown:
Components of the Script:
1. Inputs:
The script allows the user to customize key parameters for flexibility:
Bollinger Bands Length (length): Determines the period for calculating the Bollinger Bands.
Source (src): The price data to use, defaulting to the closing price.
Standard Deviation Multiplier (mult): Scales the Bollinger Bands' width.
ATR Length (atrLength): Sets the period for calculating the ATR.
The 50-period SMA length (smaLength) is fixed at 50.
2. Bollinger Bands Calculation:
Basis: Calculated as the SMA of the selected price source over the specified length.
Upper and Lower Bands: Determined by adding/subtracting a scaled standard deviation (dev) from the basis.
3. ATR Calculation:
Computes the Average True Range over the user-defined atrLength.
4. Volatility-Based Conditions:
The script establishes thresholds for Bollinger Band width relative to ATR:
Yellow Condition: When the band width (upper - lower) is less than 1.25 times the ATR.
Orange Condition: When the band width is less than 1.5 times the ATR.
Red Condition: When the band width is less than 1.75 times the ATR.
5. Dynamic SMA Coloring:
The 50-period SMA is colored based on the above conditions:
Yellow: Indicates relatively low volatility.
Orange: Indicates moderate volatility.
Red: Indicates higher volatility.
White: Default color when no conditions are met.
6. Plotting the 50-Period SMA:
The script plots the SMA (sma50) with a dynamically assigned color, enabling visual analysis of market conditions.
Use Case:
This script is ideal for traders seeking to assess market volatility and identify changes using Bollinger Bands and ATR. The colored SMA provides an intuitive way to gauge market dynamics directly on the chart.
Example Visualization:
Yellow SMA: The market is in a low-volatility phase.
Orange SMA: Volatility is picking up but remains moderate.
Red SMA: Higher volatility, potentially signaling significant market activity.
White SMA: Neutral/default state.

Sell Signal - William O'Neil's Rule VisualizationThis indicator might be helpful for traders looking to visualize William O’Neil’s sell condition, a well-known concept in his trading strategies. A sell signal is triggered when:
1. Volume increases compared to the previous day.
2. The price drops by a user-defined percentage (default: 0.2% or more).
The indicator highlights the background for bars meeting these conditions and adds a subtle circle above them. You can adjust the drop rate in the settings to match your preferences.
It could serve as a useful tool for identifying potential distribution days or profit-taking signals, helping traders manage risk during market pullbacks.
このインジケーターは、ウィリアム・オニールの売り抜け条件を可視化したもので、トレーダーの皆さんに役立つかもしれません。シグナルは次の条件を満たすと発生します:
1. 出来高が前日より増加している。
2. 価格がユーザー指定の割合(デフォルトは0.2%以上)で下落している。
条件を満たしたバーには背景色が付き、控えめな丸印が表示されます。設定で下落率を自由に調整することもできます。
このツールは、分配日や利益確定のシグナルを特定するのに役立つかもしれません。市場の調整局面でのリスク管理にご活用ください。

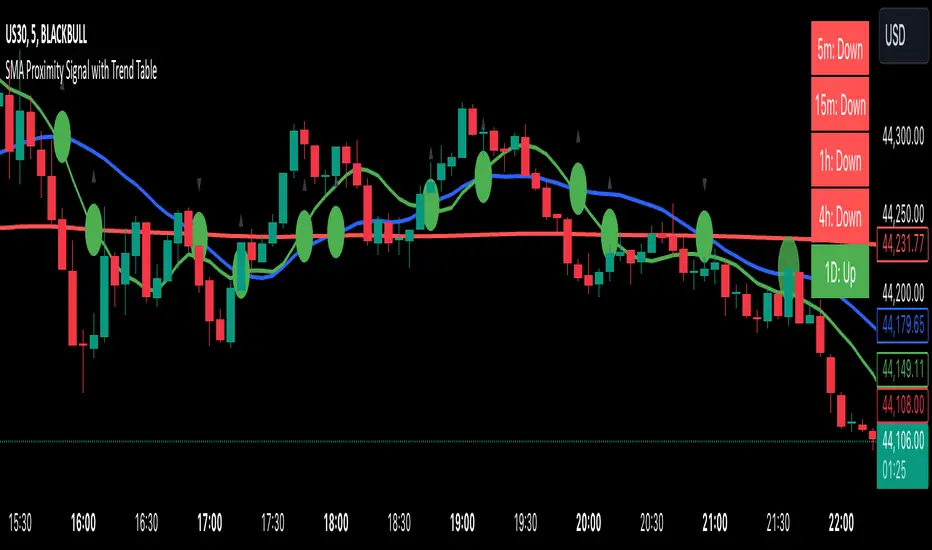
SMA Proximity Signal with Trend TableSummary of the Script:
This Pine Script is designed to provide a variety of technical analysis signals based on Simple Moving Averages (SMAs) and market trends across different timeframes. The script combines multiple indicators, such as the SMA crossover, proximity conditions, and trend analysis, along with visual markers and support/resistance lines. Below is a detailed breakdown of the key features:
The script detects crossovers between SMA1 and SMA2 and SMA1 and SMA3, marking them with green circles exactly at the crossover price level (not on the candles).
The crossover events are identified using ta.crossover and ta.crossunder functions.
Additional circles are drawn when other SMAs are in proximity (narrow stage)
Elephant Candle Pattern:
The script identifies "Elephant Candles" based on a large candle body relative to the overall size of the candle, using the condition where the candle body is at least 80% of the total candle size and at least 1.5 times the average candle size.
These candles are marked with an elephant emoji 🐘 at the top of the candle.
Trend Analysis Across Multiple Timeframes:
The script calculates the trend for different timeframes using the SMA20 of each timeframe:
5m, 15m, 1h, 4h, and 1D
It compares the current SMA20 to its previous value to determine whether the trend is Up, Down, or Flat.
Multi-Timeframe MACD, Signal & Histogram TableThis Pine Script is designed for the TradingView platform to create a multi-timeframe MACD (Moving Average Convergence Divergence), Signal, and Histogram table that displays values for different timeframes. The script uses the MACD indicator to assess market trends across various timeframes and display the results in a table format on the chart. Here's a breakdown of its components and functionality:
1. User Inputs for Timeframes:
The script allows the user to input five different timeframes for the analysis. These are configured using input.string, which enables the user to select from a list of timeframes (from seconds to months).
tf1 to tf5 represent the different timeframes (for example, 5 minutes, 15 minutes, 60 minutes, 240 minutes, and daily).
2. MACD Settings:
The script provides adjustable settings for the MACD calculation:
macdShortLength (default 12): The length of the short-term moving average for the MACD.
macdLongLength (default 26): The length of the long-term moving average for the MACD.
macdSignalLength (default 9): The length of the signal line, which is an EMA (Exponential Moving Average) of the MACD line.
3. MACD Calculation Function (calc_macd):
This function calculates the MACD, Signal, and Histogram values:
MACD Line: Difference between the fast and slow exponential moving averages.
Signal Line: EMA of the MACD line.
Histogram: Difference between the MACD line and Signal line.
4. Requesting Multi-Timeframe Data:
The script calculates the MACD, Signal, and Histogram for the selected timeframes (tf1 to tf5) using request.security, which retrieves data for those timeframes:
macd_tf1, signal_tf1, hist_tf1 for Timeframe 1 (and similar variables for the other timeframes).
5. Rounding Values:
A helper function roundDecimal is used to round MACD, Signal, and Histogram values to two decimal places for readability.
6. Color Assignment Based on Value:
The colors of the values in the table cells are dynamically set based on whether the value is positive or negative:
MACD, Signal, and Histogram: The script uses conditional color assignments (green for positive values, red for negative values).
For example, if the MACD value is greater than or equal to 0, it is colored green, otherwise red. The same logic applies to the Signal and Histogram values.
7. Populating the Table:
For each timeframe (tf1 to tf5), the script populates the table with the following data:
Timeframe (e.g., "5 min")
Rounded MACD value
Rounded Signal value
Rounded Histogram value
The respective color is applied to each value based on whether it is positive or negative.
8. Table Update:
The table is updated dynamically with new data on each new bar. Each timeframe’s values are populated into the table starting from row 1 through row 5.

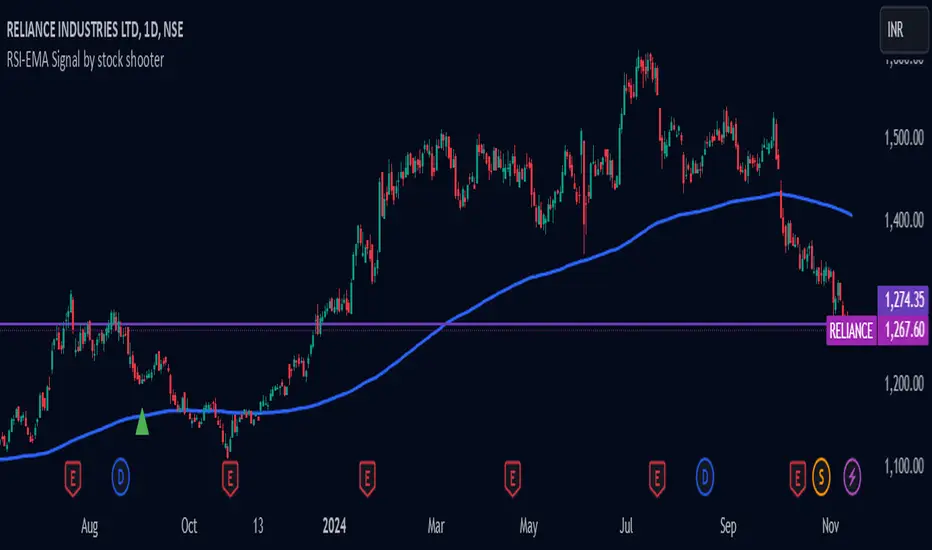
RSI-EMA Signal by stock shooter## Strategy Description: 200 EMA Crossover with RSI, Green/Red Candles, Volume, and Exit Conditions
This strategy combines several technical indicators to identify potential long and short entry opportunities in a trading instrument. Here's a breakdown of its components:
1. 200-period Exponential Moving Average (EMA):
* The 200-period EMA acts as a long-term trend indicator.
* The strategy looks for entries when the price is above (long) or below (short) the 200 EMA.
2. Relative Strength Index (RSI):
* The RSI measures the momentum of price movements and helps identify overbought and oversold conditions.
* The strategy looks for entries when the RSI is below 40 (oversold) for long positions and above 60 (overbought) for short positions.
3. Green/Red Candles:
* This indicator filters out potential entries based on the current candle's closing price relative to its opening price.
* The strategy only considers long entries on green candles (closing price higher than opening) and short entries on red candles (closing price lower than opening).
4. Volume:
* This indicator adds a volume filter to the entry conditions.
* The strategy only considers entries when the current candle's volume is higher than the average volume of the previous 20 candles, aiming for stronger signals.
Overall:
This strategy aims to capture long opportunities during potential uptrends and short opportunities during downtrends, based on a combination of price action, momentum, and volume confirmation.
Important Notes:
Backtesting is crucial to evaluate the historical performance of this strategy before deploying it with real capital.
Consider incorporating additional risk management techniques like stop-loss orders.
This strategy is just a starting point and can be further customized based on your trading goals and risk tolerance.
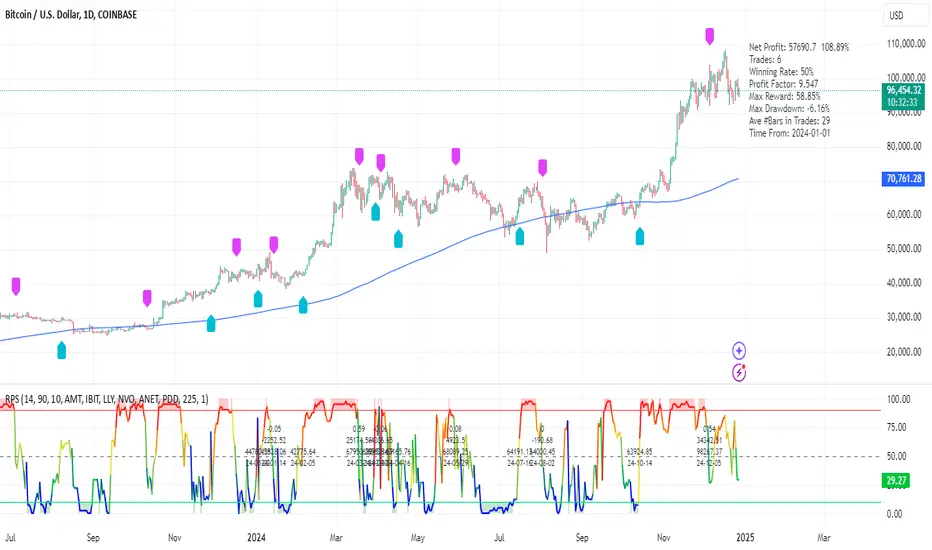
RPS Trading Signals & Backtesting
Overview:
The Enhanced Relative Price Strength (RPS) Indicator is designed for trend traders looking to identify the relative strength of stocks within a select universe. By comparing the price movements of chosen stocks over a specified period, this indicator helps traders make informed decisions about potential buying and selling opportunities.
Key Features:
Relative Strength Ranking: Our RPS indicator ranks the price performance of individual stocks against a curated selection, enabling users to pinpoint which stocks are exhibiting relative strength or weakness.
Customizable Stock Universe: The script evaluates 40 stocks, which include 30 high-weight NDX100 stocks, 4 major index ETFs (SPY, QQQ, DIA, IWM), and allows for the addition of 6 user-defined custom stocks.
Dynamic Color Gradients: The visual representation of the RPS score utilizes a gradient color scheme ranging from purple at low scores to red at high scores, leveraging the color for clear, immediate insight into stock performance.
Threshold Visualization: Users can set specific high (default 85) and low (default 15) thresholds for RPS, highlighted with solid line indicators and area fills. This visual aspect aids traders in quickly spotting entry and exit points.
Trading Signal Generation: The script includes logic for generating buy and sell signals according to defined RPS behaviors relative to the set thresholds, factoring in market conditions based on a long-term moving average.
Backtesting Capabilities: Users can backtest trading signals by inputting desired start and end dates, allowing traders to evaluate the effectiveness of the RPS strategy on historical data for various assets including stocks and cryptocurrencies (e.g., NVDA, LLY, GOOG, BTC, ETH, SOL).
User-Friendly Options: The script allows for adjustments such as moving average lengths, visibility of trading signals, and fills for ease of use and customization according to trading preferences.
How It Works:
The RPS Indicator functions by calculating the performance of stocks relative to each other. Based on the RPS trends, the indicator identifies when to enter or exit trades, providing a framework to capitalize on market movements.
Conclusion:
The Enhanced RPS Indicator aims to empower traders with a powerful analytical tool in their arsenal, tailored to simplify decision-making and bolster trading strategies. As this script evolves, we encourage feedback and collaboration from users to refine and enhance its capabilities further.
Trade Less, Earn More!
*2.2 Aggregate Signal Indicator (trial)How to Use the Indicator:
Trend Detection:
The aggregate trend score will plot above 0 for bullish conditions and below 0 for bearish conditions.
When the trend score is green, it indicates a positive (bullish) trend, while red indicates a negative (bearish) trend.
Visual Representation:
The blue line represents the aggregate trend score, while the grey line at 0 shows the neutral point.
The area between the trend score and the 0-line is filled with green (bullish) or red (bearish) based on the score's direction.
Confirming Trends:
Look for consistency in the trend score remaining above or below 0 to confirm a lasting trend.
Use this indicator alongside other trading strategies to filter out false signals and gain confirmation of market direction.
Customizable Inputs:
The indicator allows you to customize the settings for each individual indicator (e.g., lengths for EMA, ADX, RSI, MACD, etc.) to fine-tune the system to your preference or specific market conditions.

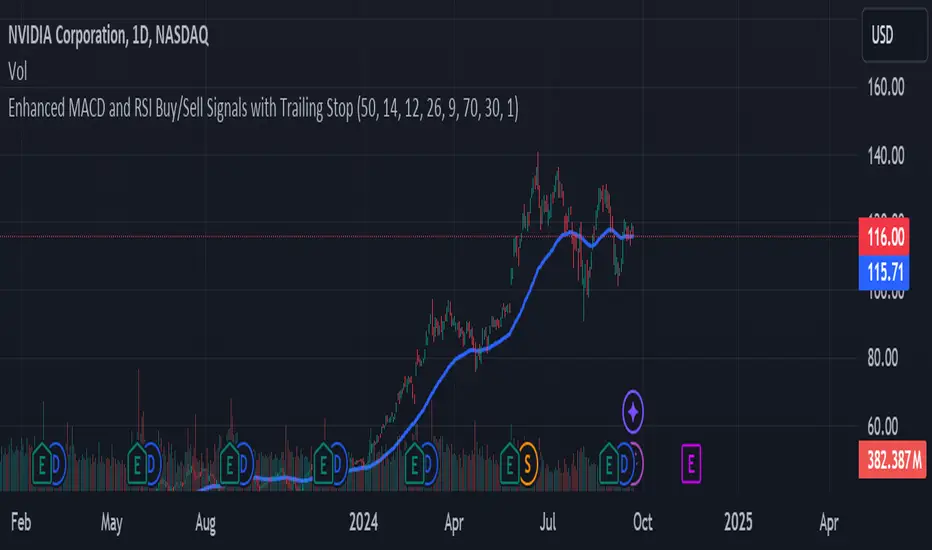
Enhanced MACD and RSI Buy/Sell Signals - Created by Marco NucupKey Features:
EMA Filter: Adds an Exponential Moving Average (EMA) to filter signals based on the trend. Buys are only considered when the price is above the EMA, and sells when below it.
Customizable Inputs: Users can adjust parameters for EMA, MACD, and RSI directly from the TradingView interface, allowing for more personalized strategies.
Alerts: The script includes alert conditions for both buy and sell signals, enabling users to receive notifications.
Signal Plotting: Visual indicators for buy and sell signals on the chart, along with the EMA line for trend reference.
Advanced Volume-Driven Breakout SignalsThe "Advanced Volume-Driven Breakout Signals" indicator is a cutting-edge tool designed to help traders identify high-potential trading opportunities through sophisticated volume analysis techniques. This indicator integrates volume flow analysis, moving averages, and Relative Volume (RVOL) to provide a comprehensive view of market conditions, going beyond traditional Volume Spread Analysis (VSA) methods.
Key Features:
Volume Flow Analysis: Distinguishes bullish and bearish volume flows with distinct colors, making it easier to visualize market sentiment and potential breakout points.
Volume Flow Moving Averages: Calculates moving averages for volume using various methods (SMA, EMA, WMA, HMA, VWMA), accommodating different trading strategies. This includes settings for adjusting the type of moving average and its period, as well as thresholds for high, medium, and low volume levels.
Volume Spikes Detection: Identifies significant volume spikes based on user-defined multipliers and moving averages, highlighting unusual trading activity.
Volume MA Cloud Settings: Computes general moving averages of volume to track trends and detect deviations. This feature includes options to select different moving average types and adjust thresholds for detecting high volume activity.
Relative Volume (RVOL): Measures current volume relative to historical averages, triggering signals when RVOL exceeds predefined thresholds, indicating notable changes in trading activity.
Entry Conditions: Provides clear long and short entry signals based on combined volume flow conditions and RVOL, offering actionable trading opportunities.
Volume Visualization:
— Bullish Volume Flow: Light and dark green bars indicate bullish volume flow.
— Bearish Volume Flow: Light and dark red bars denote bearish volume flow.
— High Volume Bars: Highlighted in yellow, and extreme volume bars in orange for additional context. These bars are plotted for visual aid and do not directly influence trade signals, focusing instead on the quality and strength of the volume flow.
Alerts: Allows users to create alert notifications for long and short entry signals when the criteria are met, enabling traders to respond promptly to trading opportunities.
Usage:
Overlay: Apply the indicator directly to your price chart to visualise real-time signals and volume conditions.
Customisable: Adjust settings for moving averages, RVOL, and other parameters to match your trading strategy and preferences.
Comparison to VSA Scripts: The "Advanced Volume-Driven Breakout Signals" indicator extends beyond traditional VSA scripts by incorporating a wider range of analytical features. While VSA primarily focuses on volume spread patterns and price action, this indicator offers enhanced functionality with advanced RVOL metrics, customizable moving averages, and detailed volume spike detection, making it a more versatile tool for identifying breakout opportunities and managing trades. It is particularly effective when used alongside key levels and order blocks.
Acknowledgements: Special thanks to @oh92 and @goofoffgoose for their invaluable scripts, which served as inspiration in the development of this advanced trading indicator.
Notes: The script is continually evolving, with ongoing refinements aimed at enhancing accuracy and performance.

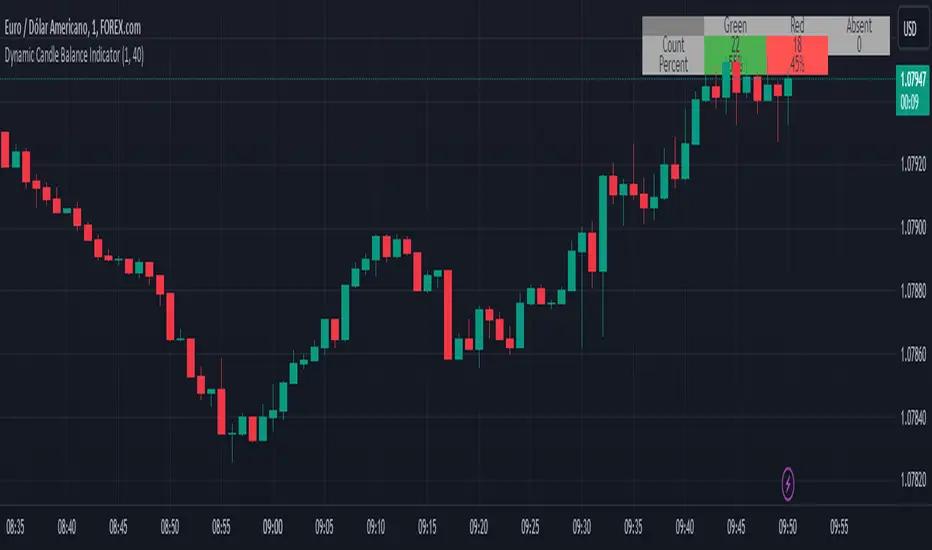
Dynamic Candle Balance Indicator (Binary)
Dynamic Candle Balance Indicator
The Dynamic Candle Balance Indicator is a powerful tool designed to identify imbalances in candle colors on a chart, which can indicate potential reversals or changes in market direction. This indicator is specifically developed for traders operating on short timeframes, such as 1-minute candles, and is particularly useful for identifying opportunities in binary options.
How to Use:
Set Parameters
Initial Position: Specify the number of initial candles to be considered for calculation.
Count: Determine the total number of candles to be analyzed, including the initial position.
Interpret Results:
Green: Indicates the number of bullish candles (where the closing price is higher than the opening price).
Red: Indicates the number of bearish candles (where the closing price is lower than the opening price).
Absent: Indicates the number of candles that were not considered due to the selected interval.
Performance Analysis:
The indicator calculates the percentage of green and red candles relative to the total number of analyzed candles, providing insights into market balance or imbalance.
Identify Trading Opportunities:
Significant imbalances between candle colors can indicate potential reversals or changes in market direction.
Traders can use this information to make informed decisions about their trading strategies, such as identifying entry or exit points.
Example:
In the last 40 candles, there were 13 green candles and 27 red candles, indicating a higher likelihood of the next candle being green.
Usage Tips:
The indicator is most effective when used on a 1-minute timeframe for binary options trading, especially during periods of high imbalance.
Adjust the parameters according to your trading strategy and the timeframe being analyzed.
Combine the Dynamic Candle Balance Indicator with other technical analysis tools to confirm trading signals.
Legal Disclaimer:
This indicator is provided for educational and informational purposes only. It represents a theory and should be used as part of a comprehensive trading strategy. Past performance is not indicative of future results. Traders should always conduct their own analysis before making trading decisions.
Try out the Dynamic Candle Balance Indicator and leverage its functionalities to identify trading opportunities on short-term charts, especially in 1-minute timeframes for binary options trading during periods of high imbalance. Remember to test the indicator on a practice account before using it on a real account.
Gtrades Forex RSI & Volume SignalThe "Forex RSI & Volume Signal" indicator combines Relative Strength Index (RSI) and volume analysis to identify potential buy signals in forex trading. It calculates RSI to gauge overbought or oversold conditions, while comparing current volume to a moving average to determine bullish volume momentum. When RSI indicates oversold conditions and volume suggests bullish momentum, a buy signal is generated. This indicator aims to identify favorable entry points during short-term uptrends in the forex market, leveraging both momentum and volume analysis to inform trading decisions. It provides traders with a comprehensive tool to identify potential buying opportunities based on multiple technical factors.

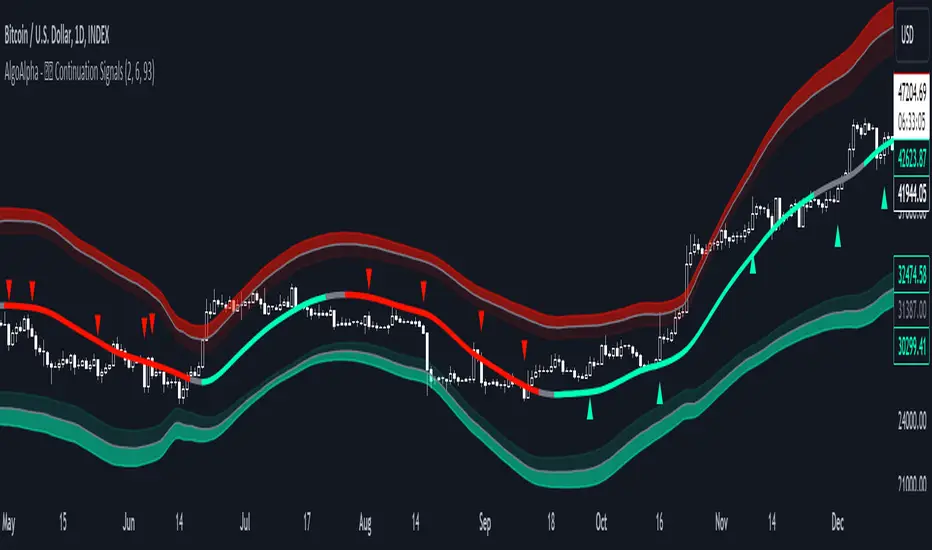
Trend Continuation Signals [AlgoAlpha]Introducing the Trend Continuation Signals by AlgoAlpha 🌟🚀
Elevate your trading game with this multipurpose indicator, designed to pinpoint trend continuation opportunities as well as highlight volatility and oversold/overbought conditions. Whether you're a trading novice or a seasoned market veteran, this tool offers intuitive visual cues to boost your decision-making and enhance your market analysis. Let's explore the key features, how to use it effectively, and delve into the operational mechanics that make this tool a game-changer in your trading arsenal:
Key Features:
🔥 Advanced Trend Detection : Leverages the Hull Moving Average (HMA) for superior trend tracking as compared to other MAs, offering unique insights into market momentum.
🌈 Volatility Bands : Implements adjustable bands around the trend line, which evolve with market conditions to highlight potential trading opportunities.
⚡ Trend Continuation Signals : Identifies bullish and bearish continuation signals, equipping you with actionable signals to exploit the prevailing market trend.
🎨 Intuitive Color Coding : Employs a vibrant color scheme to distinguish between uptrends, downtrends, and neutral phases, facilitating easy interpretation of the indicator's insights.
🛠 How to Use "Trend Continuation Signals ":
🔍 Setting Up : Incorporate the indicator onto your chart and customize the indicator to suite your preferences.
👀 Reading the Signals : Pay attention to the color-coded trend lines and volatility bands. Green indicates an uptrend, red signifies a downtrend, and gray denotes a neutral market condition.
📈 Identifying Entry Points : Look for bullish (▲) and bearish (▼) continuation icons below or above the price bars as signals for potential entry points for long or short positions, respectively.
🔄 Confirmation : Validate your trades with further analysis or other indicators. The Trend Continuation Signals are most effective when complemented by other technical analysis tools or fundamental insights.
📉 Risk Management : Implement stop-loss orders in line with your risk appetite and adjust them based on the volatility bands provided by the indicator to safeguard your investments.
How It Operates:
The essence of the indicator is captured through the hull moving averages for both the primary and secondary lines, set at periods of 93 and 50, respectively, to reflect market trends and pullbacks that trigger the continuation signals every time price recovers from a detected pullback.
Volatility is quantified through the standard deviation of the midline, magnified by a factor, establishing the upper and lower trend band boundaries.
Further volatility bands are plotted around the main volatility band, providing a granular view of market volatility and potential breakout or breakdown zones.
Market trend direction is determined by comparing the HMA line's current position to its previous value, enhanced by the secondary line to identify continuation patterns.
Embrace the power of the Trend Continuation Signals to enhance your trading strategy! It is important to note that all indicators are best used in confluence with other forms of analysis, happy trading! 📊💥
Ichimoku Clouds Strategy Long and ShortOverview:
The Ichimoku Clouds Strategy leverages the Ichimoku Kinko Hyo technique to offer traders a range of innovative features, enhancing market analysis and trading efficiency. This strategy is distinct in its combination of standard methodology and advanced customization, making it suitable for both novice and experienced traders.
Unique Features:
Enhanced Interpretation: The strategy introduces weak, neutral, and strong bullish/bearish signals, enabling detailed interpretation of the Ichimoku cloud and direct chart plotting.
Configurable Trading Periods: Users can tailor the strategy to specific market windows, adapting to different market conditions.
Dual Trading Modes: Long and Short modes are available, allowing alignment with market trends.
Flexible Risk Management: Offers three styles in each mode, combining fixed risk management with dynamic indicator states for versatile trade management.
Indicator Line Plotting: Enables plotting of Ichimoku indicator lines on the chart for visual decision-making support.
Methodology:
The strategy utilizes the standard Ichimoku Kinko Hyo model, interpreting indicator values with settings adjustable through a user-friendly menu. This approach is enhanced by TradingView's built-in strategy tester for customization and market selection.
Risk Management:
Our approach to risk management is dynamic and indicator-centric. With data from the last year, we focus on dynamic indicator states interpretations to mitigate manual setting causing human factor biases. Users still have the option to set a fixed stop loss and/or take profit per position using the corresponding parameters in settings, aligning with their risk tolerance.
Backtest Results:
Operating window: Date range of backtests is 2023.01.01 - 2024.01.04. It is chosen to let the strategy to close all opened positions.
Commission and Slippage: Includes a standard Binance commission of 0.1% and accounts for possible slippage over 5 ticks.
Maximum Single Position Loss: -6.29%
Maximum Single Profit: 22.32%
Net Profit: +10 901.95 USDT (+109.02%)
Total Trades: 119 (51.26% profitability)
Profit Factor: 1.775
Maximum Accumulated Loss: 4 185.37 USDT (-22.87%)
Average Profit per Trade: 91.67 USDT (+0.7%)
Average Trade Duration: 56 hours
These results are obtained with realistic parameters representing trading conditions observed at major exchanges such as Binance and with realistic trading portfolio usage parameters. Backtest is calculated using deep backtest option in TradingView built-in strategy tester
How to Use:
Add the script to favorites for easy access.
Apply to the desired chart and timeframe (optimal performance observed on the 1H chart, ForEx or cryptocurrency top-10 coins with quote asset USDT).
Configure settings using the dropdown choice list in the built-in menu.
Set up alerts to automate strategy positions through web hook with the text: {{strategy.order.alert_message}}
Disclaimer:
Educational and informational tool reflecting Skyrex commitment to informed trading. Past performance does not guarantee future results. Test strategies in a simulated environment before live implementation

Ranges With Targets [ChartPrime]The Ranges With Targets indicator is a tool designed to assist traders in identifying potential trading opportunities on a chart derived from breakout trading. It dynamically outlines ranges with boxes in real-time, providing a visual representation of price movements. When a breakout occurs from a range, the indicator will begin coloring the candles. A green candle signals a long breakout, suggesting a potential upward movement, while a red candle indicates a short breakout, suggesting a potential downward movement. Grey candles indicate periods with no active trade. Ranges are derived from daily changes in price action.
This indicator builds upon the common breakout theory in trading whereby when price breaks out of a range; it may indicate continuation in a trend.
Additionally, users have the ability to customize their risk-reward settings through a multiplier referred to as the Target input. This allows traders to set their Take Profit (TP) and Stop Loss (SL) levels according to their specific risk tolerance and trading strategy.
Furthermore, the indicator offers an optional stop loss setting that can automatically exit losing trades, providing an additional layer of risk management for users who choose to utilize this feature.
A dashboard is provided in the top right showing the statistics and performance of the indicator; winning trades; losing trades, gross profit and loss and PNL. This can be useful when analyzing the success of breakout trading on a particular asset or timeframe.

Trend Lines [LuxAlgo]Our new "Trend Lines" indicator detects and highlights relevant trendlines on the user chart while keeping it free of as much clutter as possible.
The indicator is thought for real-time usage and includes several filters as well as the ability to estimate trendline angles.
🔶 USAGE
Trendlines can act as support/resistance, with a higher number of tests indicating a more significant support/resistance role.
A broken TrendLine can be indicative of a potential trend reversal. The script highlights breaks with a label.
Users can additionally filter trendlines, only showing trendlines whose angles fall within a user set range:
This allows for the removal of potential clutter from the chart but also helps keep steeper or more horizontal trendlines.
🔶 DETAILS
When a swing (pivot point) is found, a Trendline is drawn when certain conditions are fulfilled.
An essential condition is that a Bearish Trendline (red) always occurs on a lower high, while a Bullish Trendline (blue) occurs on a higher low.
Our implementation will first show an initial dotted-styled TrendLine on confirmation, after which a solid-styled secondary TrendLine will develop. The latter will be used for the real-time detection of breaks at that line:
Furthermore, the script allows you to add more conditions:
🔹 Length (Swings)
A swing develops when a high/low is the highest/lowest against x highs/lows on the left AND right of that bar. x can be set by "Length" in settings.
The following images clarify this. The script confirms a swing where the yellow flag is shown; the high (here visualized with a purple label) is the highest point against x bars left and right of that point.
At that moment, this swing is checked against the previous swing. If all conditions are fulfilled, an initial TrendLine is drawn on confirmation.
After that point, a secondary thicker solid line is seen which keeps progressing bar after bar, until:
• a new TrendLine is formed
• the TrendLine is broken
🔹 Breaks between Swings
Once there is confirmation that a TrendLine can be drawn, the script allows you to filter for breakthroughs on that line. This can be set with "Check breaks between"
Disabled : the initial TrendLine is allowed to be pierced:
Check breaks between point A - point B : no breaks are allowed between both Swing points:
Point A - Current bar : no breaks are allowed between the first Swing point and the point of confirmation ('current' bar):
🔹 TrendLine breaks
As mentioned, the secondary TrendLine (solid line) progresses bar after bar until a new TrendLine is formed or the TrendLine is broken. When a TrendLine is broken, the TrendLine stops progressing, but if there isn't a new TrendLine and price return back, the TrendLine will re-appear, potentially giving several signals when the TrendLine is broken again.
Minimal bars allow you to regulate the amount of signals when the TrendLine is broken.
-> The secondary TrendLine must be uninterrupted for at least x bars before a potential break can be considered.
The following example shows 1 signal against 3 by adjusting this setting from 2 to 5:
🔹 Angles
Angles should normally be calculated when the units of the X and Y axis are the same. However, on our charts, the unit of the X-axis is bar_index (bars), and on the Y-axis the unit is price (¥, €, £, $,...).
It is not easy to normalize and create reasonably valid angles. Often certain angle calculations can differ through price changes or volatility.
Our calculate_slope() function tries to make corresponding angles through all bars.
We do this by calculating the difference between the highest/lowest price values in a certain bar range. The bar range is our X-axis, and the price difference is our Y-axis.
Zooming in/out will not change the amount of bars or the price. Since it does change our view on the chart, and thereby how we see the angles, we have included a setting where you can personalize the ratio between X and Y-axis (Angles -> Ratio X-Y axis).
Settings: Angles - Ratio X-Y axis:
🔶 SETTINGS
🔹 Swings
Length: Lookback period for the detection of swing points.
🔹 Trendline validation
Check breaks between :
Disabled : the initial TrendLine is allowed to be pierced
Check breaks between point A - point B : no breaks are allowed between both Swing points
Point A - Current bar : no breaks are allowed between the first Swing point and the point of confirmation ('current' bar)
Source (breaks) : Source which invalidates TrendLine, default: close
🔹 TrendLine breaks
Minimal bars : The secondary TrendLine must be uninterrupted for at least x bars before a potential break can be considered.
🔹 Angles
Show : Toggle labels.
Ratio X-Y axis : Every user has his preferences regarding zoom, chart layout,...
If the shown angles are not according to your expectations, you can adjust this number.
Only TrendLine between : Only allow TrendLines between the minimum and maximum degrees. Set only the minimal and maximum values above 0.
