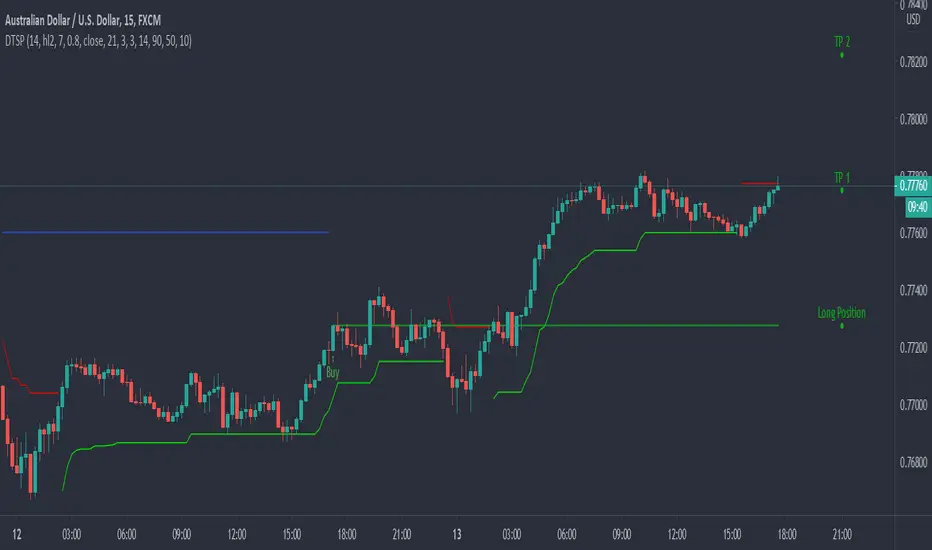
Dynamic Take Profit & Signals (AussieBogan)Dynamic Take Profit & Signals (DTS) help us to dynamically place potential take profit levels. These levels are measured based on standard deviation in conjunction with swing high and low points. Head over to the settings to control your take profit and multiplicative factor setting.
In short, higher values of either setting will return more spread out between tp's. The logic behind using the standard deviation is that a low value of it will return tp closer to where you entered the trade, as such it will have higher chances of the price reaching them.
The Indicator also has alert features for buy and sell so any trader can be aware of every potential signal the indicator produces.
"signal" için komut dosyalarını ara
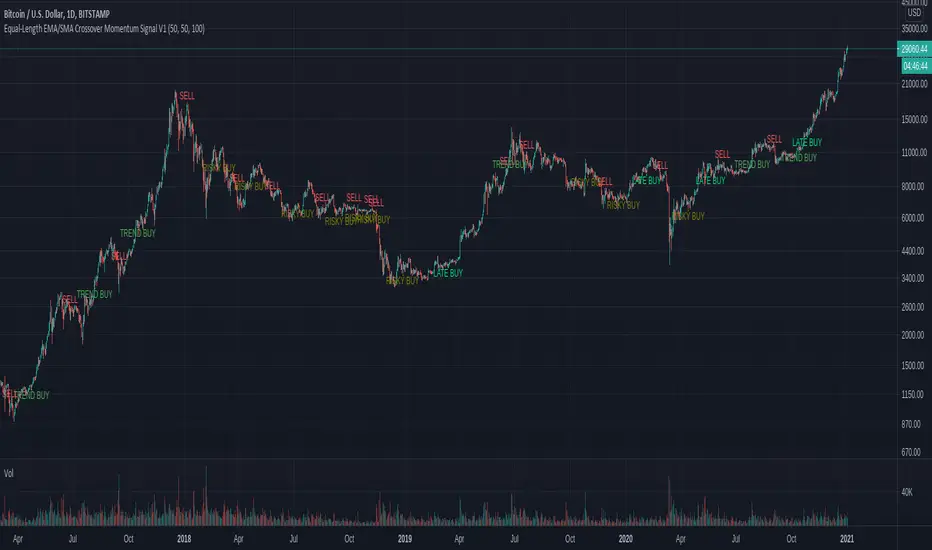
Equal-Length EMA/SMA Crossover Momentum Signal V1Overview:
This momentum and trend-following strategy captures the majority of any trending move, and works well on high timeframes.
It uses an equal-period EMA and SMA crossover to detect trend acceleration/deceleration, since an EMA places a greater weight and significance on the most recent data.
This version is optimized for longs, and designed to cut your losses quickly and let your winners run.
To reduce noise and optimize entries, we combined this with an overall trend bias for further confluence.
How it works:
Signals are determined by the crossover of an EMA and SMA of the same length, e.g. EMA-50 and SMA-50.
The overall trend bias is determined using a slower SMA golden/death cross, e.g. SMA-50 and SMA-100.
The signal is stronger when it occurs in confluence with the overall trend bias, e.g. when EMA-50 crosses over SMA-50, while above the SMA-100. This is analogous to only opening long positions in a bull market.
Signal description:
Trend Buy: EMA crosses above SMA, and overall trend bias is bullish. Buying is in confluence with the overall trend bias.
Risky Buy: EMA crosses above SMA, and overall trend bias is bearish. Buying is early, more risky, and not in confluence with the overall trend bias.
Late Buy: SMA crosses above BIAS_SLOW. This gives further confirmation of bullish trend, but signal comes later.
Sell: EMA crosses under SMA.
Open Close Cross Strategy R6.1 revised by yourmattieOriginal version: Open Close Cross Strategy R5 revised by JustUncle.
Change: script changed to a study script with custom alerts.
This revision is an open Public release, with just some minor changes. It is a revision of the Strategy "Open Close Cross Strategy R2" originally published by @JayRogers.
Revised by JustUncleL
Description :
Strategy based around Open-Close Moving Average Crossovers optionally from a higher time frame.
Read more about the indicator original script
Klik here
##USE AT YOUR OWN RISK##
Use this as overlayer on the original strategy to set custom alerts.
Info: with this study script no buy/sell arrows show up op the chart.
Does some know a solution for this issue:
Issue: sometimes it gives a false signal because even when you set "one per bar close" the custom set alert might come halfway the bar....and it might be a false signal when the bar is closed
Does somone know a fix for this? I tried with barstate.iscomfirmed but it didn't work for me.
Ps. I'm not a developer...just changed the scipt by watching a youtube tutorial.
MACD With Trend Filter: Visual Backtest Module TemplateSample Strategy: MACD Crossover with trend filter options
MA Filter : Price Close Above MA, Search for Buy, Price Close Below MA, Search for Sell
ADX Filter : Take trade only when ADX is above certain treshold
MACD Signal : MACD Cross above signal line while under 0 line indicate Buy Signal
MACD Cross below signal line while above 0 line indicate Sell Signal
-----------------------------
Using Alert Module:
Enable Alert --> Enable TV's alert and plot signal to chart
Alert Type --> Set to take Buy only, Sell only or Both alert
----------------------------
Using Backtest Module:
Enable Backtest --> Enable Backtest simulation
Backtest Type --> Set to take Buy only, Sell only or Both
SL Type -->
ATR : Set SL in ATR times Multiplier below/above entry price
Fixed : Set SL in fixed point below entry point (in 'Dollar'). e.g. for Stocks -> 0.5 equals to 50cent while for EURUSD currency -> 0.005 equal to 50 pips
HiLo Bar : Set SL at highest/lowest wick of previous bar plus/minus Fixed point. e.g. EURUSD HiLo=3 and Fixed Point = 0.0005, buy trade will place SL 5 Pips below lowest of previous 3 bar
SL ATR Period --> Set Lookback Period used for SL's ATR calculation
SL ATR Multi --> Set ATR Multiplier for SL
SL Fixed --> Set Fixed Level for SL (Use when SL Type is either Fixed or HiLo Bar)
SL Bar --> Set Number of previous bar to check for SL placement
TP RR Ratio --> Set TP based on RR multiplier. e.g. 2 means TP level will be twice further from entry point compared to Entry-SL distance.
Notes: The point is for preliminary testing, so it only supports 1 trade at a time and no Trailing Stop
----------------------------
Disclaimer:
This script main objective is to create my personal indicator template so that i just have to modify the indicator module for preliminary testing in future.
Testing Alert Module so i can re-use it as template in future study/indicator
Testing Visual Backtest Module so i can re-use it as template in future study/indicator
i believe using Strategy function is a better approach for this but the entry/exit level seems to be hit n miss (at least for me, still trying to figure what i did wrong)
also, i rather code the strategy in other platform where i can use the more accurate tick data if i want to validate backtest statistics.
My study scripts was built only to test/visualize an idea to see its viability and if it can be used to optimize existing strategy.
credit: ADX code are originally from "ADX and DI" by @BeikabuOyaji although i re-wrote so i can have cleaner read and use RMA instead of SMA

Bjorgum Triple EMA Strat-This script uses a triple EMA strategy to establish trend direction and reversal points
-Inputs are smoothed with Heiken Ashi values to reduce whipsaws, while providing timely execution
-Buy and sell indications are dictated by bar color
-Bar color is dictated by the candle close value in relation to the EMAs, specifically the faster of the 3
(If candle closes above or below the fast and intermediate averages, a buy or sell signal is indicated by bar color change)
-If the close falls between the two a cautionary signal is given. The viewer can hold, or take profit, or evaluate other indicators for clues
-Best results are obtained when coupled with Bjorgum TSI and Bjorgum RSI for confirmation of signals (see TradingView profile)
@Bjorgum on Stocktwits

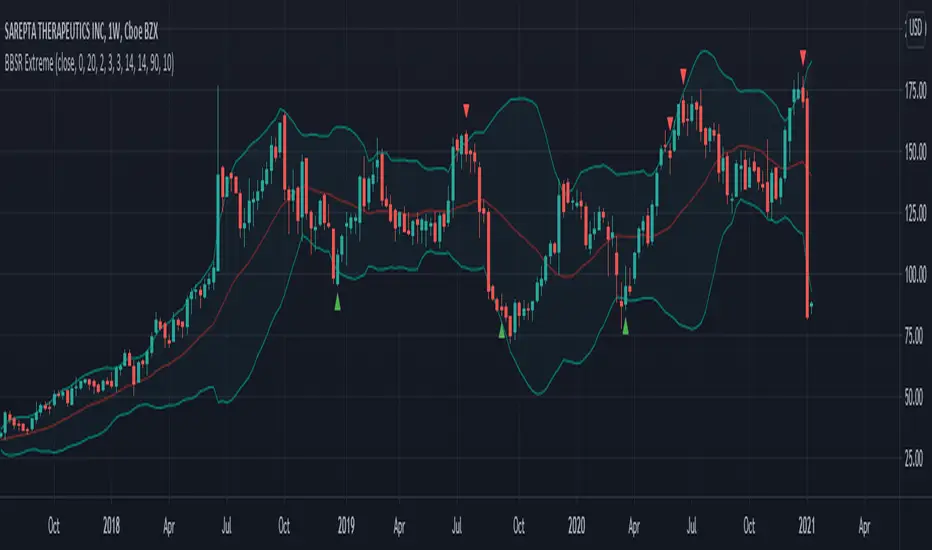
Bollinger Bands Stochastic RSI Extreme SignalThis is the finalized code released to the public that I created in a video linked here.
This indicators combines a Bollinger Band and Stochastic RSI to produce signals for possible price reversal. The signals are displayed by default as green arrows for bullish and red arrows for bearish.
To trigger a signal the indicator checks for the following:
(Bullish)
A candle closes above the upper Bollinger Band
The following candle closes within the upper Bollinger Band
The RSI Stochastic is below the set threshold (10 by default)
(Bearish)
A candle closes below the lower Bollinger Band
The following candle closes within the lower Bollinger Band
The RSI Stochastic is above the set threshold (90 by default)
[blackcat] L2 Ehlers Enhanced Signal to Noise IndicatorLevel: 2
Background
John F. Ehlers introuced another Enhanced Signal to Noise Indicator in his "Rocket Science for Traders" chapter 8.
Function
blackcat L2 Ehlers Signal to Noise Indicator is used to measure Signal-to-Noise Ratio (SNR). In this code, the period of the measured dominant cycle is calculated in exactly the same manner as we calculated it for the Primary SNR Indicator. Near the end of the code, after the dominant cycle is determined, Dr. Ehlers computes the SNR. The Quadrature component Q3 is calculated by multiplying the 2-bar momentum of the Weighted Moving Average (WMA) smoothing by the dominant cycle amplitude correction factor.
Key Signal
Smooth --> 4 bar WMA w/ 1 bar lag
Detrender --> The amplitude response of a minimum-length HT can be improved by adjusting the filter coefficients by
trial and error. HT does not allow DC component at zero frequency for transformation. So, Detrender is used to remove DC component/ trend component.
Q1 --> Quadrature phase signal
I1 --> In-phase signal
Period --> Dominant Cycle in bars
SNR --> Signal-to-Noise Ratio
Pros and Cons
100% John F. Ehlers definition translation of original work, even variable names are the same. This help readers who would like to use pine to read his book. If you had read his works, then you will be quite familiar with my code style.
Remarks
The 6th script for Blackcat1402 John F. Ehlers Week publication.
Readme
In real life, I am a prolific inventor. I have successfully applied for more than 60 international and regional patents in the past 12 years. But in the past two years or so, I have tried to transfer my creativity to the development of trading strategies. Tradingview is the ideal platform for me. I am selecting and contributing some of the hundreds of scripts to publish in Tradingview community. Welcome everyone to interact with me to discuss these interesting pine scripts.
The scripts posted are categorized into 5 levels according to my efforts or manhours put into these works.
Level 1 : interesting script snippets or distinctive improvement from classic indicators or strategy. Level 1 scripts can usually appear in more complex indicators as a function module or element.
Level 2 : composite indicator/strategy. By selecting or combining several independent or dependent functions or sub indicators in proper way, the composite script exhibits a resonance phenomenon which can filter out noise or fake trading signal to enhance trading confidence level.
Level 3 : comprehensive indicator/strategy. They are simple trading systems based on my strategies. They are commonly containing several or all of entry signal, close signal, stop loss, take profit, re-entry, risk management, and position sizing techniques. Even some interesting fundamental and mass psychological aspects are incorporated.
Level 4 : script snippets or functions that do not disclose source code. Interesting element that can reveal market laws and work as raw material for indicators and strategies. If you find Level 1~2 scripts are helpful, Level 4 is a private version that took me far more efforts to develop.
Level 5 : indicator/strategy that do not disclose source code. private version of Level 3 script with my accumulated script processing skills or a large number of custom functions. I had a private function library built in past two years. Level 5 scripts use many of them to achieve private trading strategy.
CSRS v2Candlesticked RSI v2 for price action traders!
See the True Momentum.
6 chart type, smooth RSI , add signal lines, find divergences, special alerts
This is 2nd version with major upgrade
Improved and more powerful
fully customizable.
features:
See RSI in 6 type of chart(Candles, Hollow Candles, Siwi Candles, Heikin Ashi, HL Bar, Line)
Monitor Up to 3 RSI , each one at desired resolution, source and length
Smooth each one of chart separately to remove noises
Add up to 3 signal line to primary chart in your desired source and type( SMA , EMA , WMA , HMA )
Find divergences which has special parameters
Gradient color adjustment of line chart
Add alert for reaching to important levels and detected divergences

Super Guppy StrategyCM Super Guppy with Long/Short signals, backtesting, and additional options. Updated for PineScript v4.
COINBASE:BTCUSD
Features 2 primary modes, depending on your risk profile. These options are available in the settings:
"Early Signals" ON (default):
Prints a "long" on grey to green transitions AND red to gray transitions.
Prints a "short" on green to grey transitions AND gray to red transitions.
Will not print back-to-back repeated positions (i.e. green → grey → red will only print the first green → gray "short" signal and not print "short" twice).
Rotates long and short positions with no delay.
"Early Signals" OFF
Will close trades, but never open new ones, when guppy transitions to from any color to gray.
Open long: guppy transitions gray to green.
Close long: guppy transitions green to gray.
Open short: guppy transitions gray to red.
Close short: guppy transitions red to gray.
Does not rotate long and short positions back to back.
Additionally:
Can toggle on/off the 200EMA. Default is off.
Can toggle on/off short positions. Default is on.
In development: alerts

Trend Indicator with BUY SELL signalsThe Script can be used to identify the main trend and take BUY/SELL decisions in the lower time frames.
The tool can be applied as follows
1) Apply the tool your favorite chart
2) Select the main trend.
3) Go to lower time frames to check the BUY/SELL signals. Example: If the selected main trend is 4 hrs then go to time frames below 4 hrs to find the entry and exit positions.
Feel free to reach out to me if you need any further information

BV's MACD SIGNAL TESTERHello ladies and gentlemen,
Today, as you may have seen in the title, I have coded a strategy to determine once and for all if MACD could make you money in 2020.
So, at the end of this video, you will know which MACD strategy will bring you the most money.
Spoiler alert: we've hit the 90% WinRAte mark on the Euro New Zealand Dollar chart.
I've seen a lot of videos of people testing different MACD signals, some up to 100 times.
But In my opinion, all traders must rely on statistics to put all the odds on their side and good statistics require a lot more data.
The algorithm I'm showing you tests each signal one by one over a 3 year period and on 28 different graphs.
That way we are sure that we have encountered all possible market behavior.
From phases of congestion to major trends or even the effects of COVID-19
I use the ATR to determine my Stop Loss and Take Profits. The Stop Loss is placed at 1.5 times the ATR, the Take Profit is placed at 1 time the ATR.
If my Take Profit is hit, I take 50% of the profits and let the position run by moving my Stop Loss to Zero.
This way, the position can no longer be a losing position.
If you are not familiar with this practice, I invite you to study the "Scaling out" video from the NoNonsenseForex channel.
BV's Trading Journal.

IntradaySignal #Trading #Candlestick #SignalThis is a simple version of taking bull and bear positions.
Time Frame: Although the time frame decided while making the script was for 1 minute chart, but after checking, even Daily charts work good.
Asset class: The underlying here, is XAUUSD (GOLD) but confirmatory strong positional trades on stocks for intraday purposes.
Condition: The signals are meaningful and are of significant importance when its in trending pattern and not in sideways pattern.
The signals are presented by the background color. when the color is red, start taking short positions, and when the signal is green, go with long position.
StopLoss: Complete reliance on the script might not be rewarding, Prepare your own stoploss and targets. I advise you to take profit and book losses as per "resistance & support" zones.

RAT Moving Average Crossover StrategyThis is based on general moving average crossovers but some modifications made to generate buy sell signals.

Twin Range Filter Algo@Colinmck used two different ranges to generate signals. Read his release notes to find out what the original script does.
I added one condition which seems to increase performance on 15m BTCUSD as well as 1h BTCUSD and that is ATR with 32 periods being smaller than ATR with 64 periods. I used my script Volatility Optimiser to discover this tendency.
Both buying and selling conditions are same as in @Colinmck's script plus one condition of my own. You can disable my condition.
Target and stop-loss are manually set values in ticks.
Time stop-loss is manually set value in a number of candles. After this number of candles, a position always exits (or should 😇). You can disable it by inserting a very long period. I do not recommend it, because a value of indicator should not be measured in luck and if market starts moving in the direction after 40 periods, the predictive capability of an indicator is questionable.
I used 300/150/17 for 15m BTCUSD chart and 900/30/17 for 1h BTCUSD. I didn't try to optimize any other parameters for these periods.
Since this script relies mostly on volatility for its prediction, I wouldn't recommend using it on its own. Individual approach to the market is recommended. Also, it didn't work on EURUSD when using the same default values and different order management (tp, sl, time sl), so it is probably not as versatile.
Let me know what do you think of this strategy. If you have some ideas about how to make it more reliable, share it in the comments, I might put it to the test. Good luck 🍀

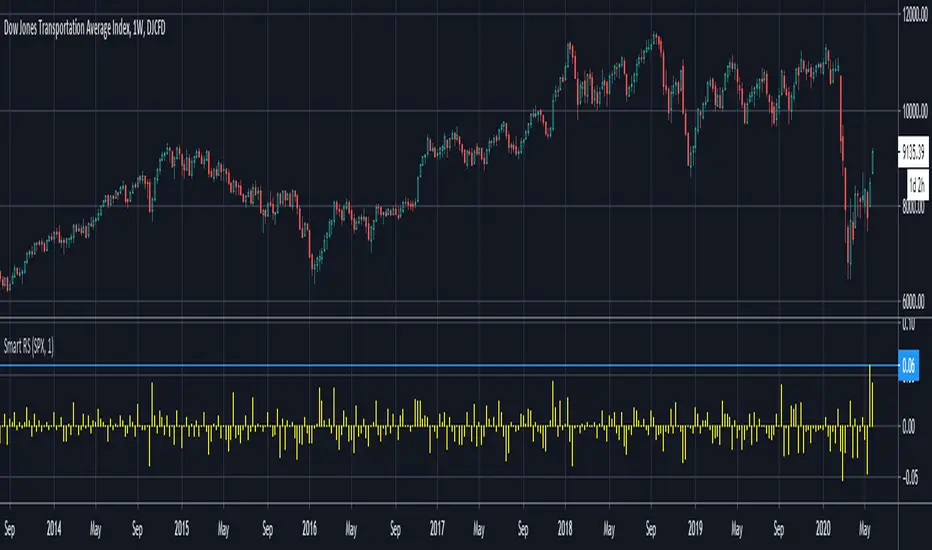
Smart Relative Strength Can Remove False SignalsRelative strength is one of the most useful indicators in the market, highlighting when stocks and sectors are outperforming or underperforming a broader index.
Traditional RS compares the percentage change of one symbol over a given time frame and subtracts the percentage change of the S&P 500 over the same period.
This is handy, but it can produce false signals at times of volatility. For example, when the broader market is crashing, certain sectors may “outperform” simply by falling less than the S&P 500.
Smart Relative Strength addresses this shortcoming by requiring that the symbol’s absolute AND relative returns both be positive. Otherwise a zero is returned.
This was useful last week on the Dow Jones Transportation Average . Using simple relative strength, it had its best one-week performance against the S&P 500 since October 2008. This was obviously a false signal because October 2008 was a time that everything else was crashing.
Smart Relative Strength showed that, excluding periods of overall decline, DJT had its best week since January 2008.
Note: This chart uses a 1-period interval, while the code defaults to 21 periods.
KINSKI Buy-Sell Signal"KINSKI Buy-Sell Signal" is an Average True Range (ATR) based trailing stop indicator.
In this version, you can change the ATR calculation method using the settings. The default method is hlc3. The HLC stands for High, Low, Close and the /3 divides the result by 3 to give you the average.
The indicator calculates the buy and sell signals using HLC3, Simple Moving Average ( SMA ) and the Exponential Moving Average ( EMA ) as soon as they cross. This indicator is useful with time intervals starting at 15m.
Have fun with it and be careful when buying and selling!
Example Chart:

MACD with divergence signalsIts an MACD indicator which highlights places where macd and signal line cross and hidden divergence ocures.
Logic behind it is to check if we have hidden divergence when crossing of that two lines and if above EMA200 (signal for BUY - green) or if below EMA200 (signal for SELL - red).
You can change lenght of EMA but i think 200 is a simpliest trend indicator.
BoilerRoomColdCaller - 3Commas Grid Bot SignalThis is very similar to 3Commas' grid bot, the range is from the previous 7 days' lowest low decreased by 3% to the previous 7 days' highest high increased by 3%, you can also adjust if you want 7 days' highest/lowest close price as your range or highest high and lowest low as your range. 10 buys and 10 sells within the range, the unit price would be (high-low)/19.
The buy signals and the sell signals will be triggered if:
- The previous close is below one specific green line (buy line), and the current close is above that specific green line, or
- The previous close is above one specific green line (buy line), and the current close is below that specific green line
Thus, whether the price is dropping below these lines or rising above these lines, a buy or sell signal will be triggered when they cross green or red lines. Your entry price will be the next open price after this candle's close reaches the lines.
Big thanks to @glaz, who helped me a lot with this script. Please give a like button and share if you like this script. Let me know if you have questions, thanks guys.

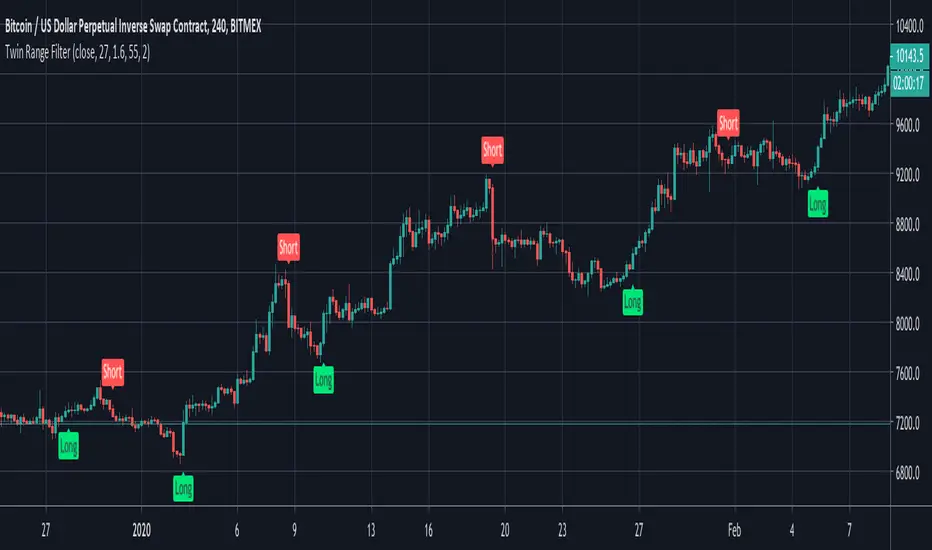
Twin Range FilterAn experiment to combine two range filters and plot the average of both to smooth out the signals.
This works significantly better than the typical ATR set-up, but there's still too much noise here to set and forget with bots. Use it as the basis of your own system with additional filtering on top.
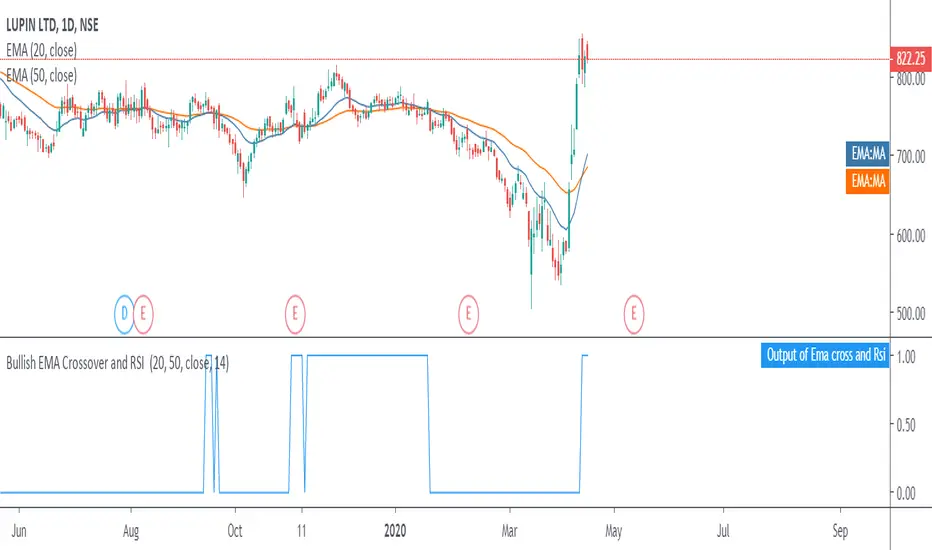
Moving Average Exponential crossover with bullish RSI signalsWhen the market is giving the signals for bullish trend, which shows the shorter period exponential(20) moving average crossing the longer period moving average(50), with a strength shown in the market i.e. RSI greater than 40.
So when all these conditions are met a buy signal is generated in output (Output of Ema cross and Rsi) having value as 1.
So a trader can enter into a long position when the value is 1 and exits a stock when value is 0.
This script is not to be used for selling the stocks in downtrend
DEMA Strategy with MACDThe Double Exponential Moving Average (DEMA) indicator was introduced in January 1994 by Patrick G. Mulloy, in an article in the "Technical Analysis of Stocks & Commodities" magazine: "Smoothing Data with Faster Moving Averages"
It attempts to remove the inherent lag associated to Moving Averages by placing more weight on recent values. The name suggests this is achieved by applying a double exponential smoothing which is not the case. The name double comes from the fact that the value of an EMA (Exponential Moving Average) is doubled. To keep it in line with the actual data and to remove the lag the value "EMA of EMA" is subtracted from the previously doubled ema.
DEMA is a very responsive system. A lot of signals can be generated only when trading with DEMA. In this strategy, I combined Dema buy-sell signals with MACD indicator. When you activate MACD confirmation from settings; When DEMA comes to long situation, the MACD histogram is checked to be positive.

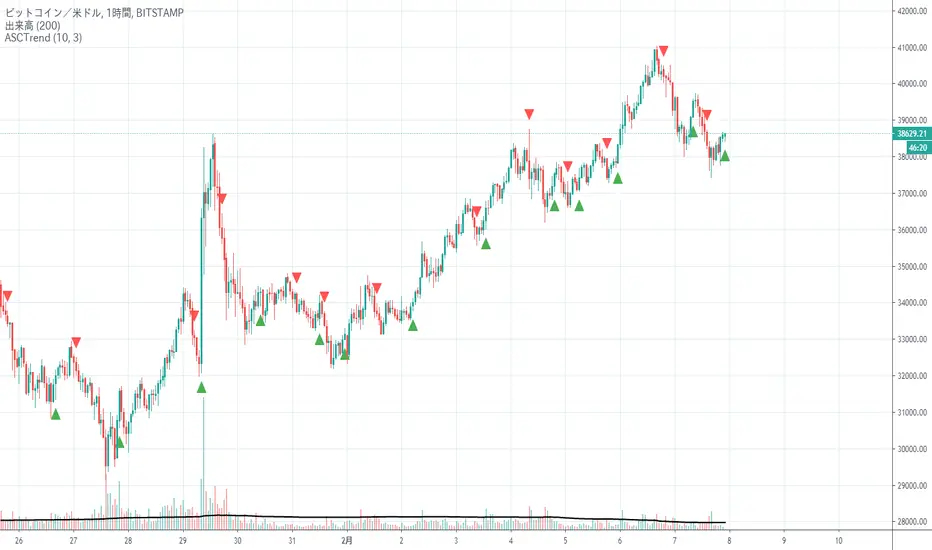
ASCTrendThis is a signal type inge displayed on the candlestick.
Very famous in the world, ASCTrend is one of the oldest signal type indicators, and it seems that the base was completed around MT3, the predecessor of MT4.
I ported it because it was not in TradingView for some reason.
ローソク足上に表示されるシグナル型のインジです。
世界的に非常に有名で、ASCTrendはシグナル型のインジケーターの中でも歴史は古く、ベースはMT4の前身であるMT3の頃には出来上がっていたようです。
なぜかTradingViewにないので移植してみました。
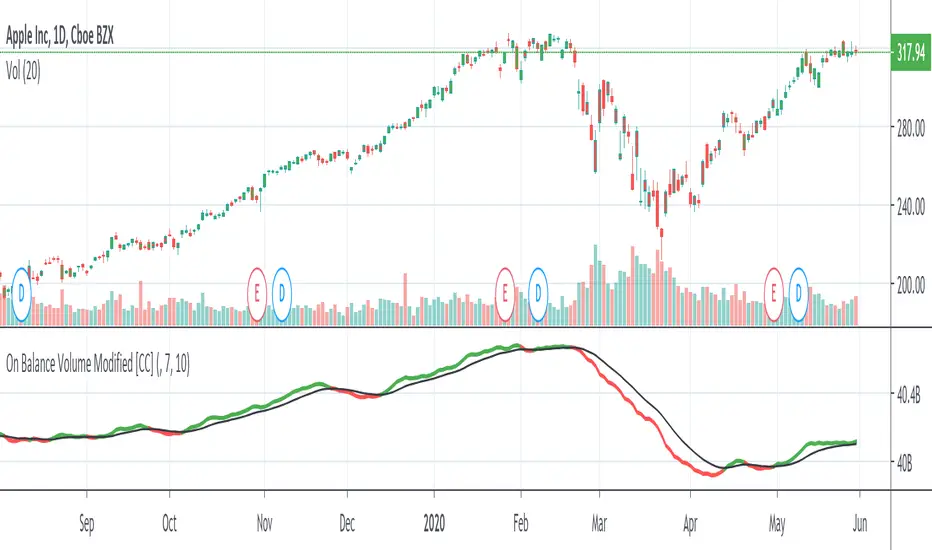
On Balance Volume ModifiedHere is a smoothed version of the classic OBV indicator with a signal line. You can use it to look for signal line crossovers and divergences. The signal line is a 10-day EMA of the OBVM line. Typically, the signal line can vary from 10 to 50.
This was just published by Vitali Apirine in the latest issue of Stocks & Commodities (April 2020) p22-25
Please let me know if you want me to publish any other indicators or if you have any questions!