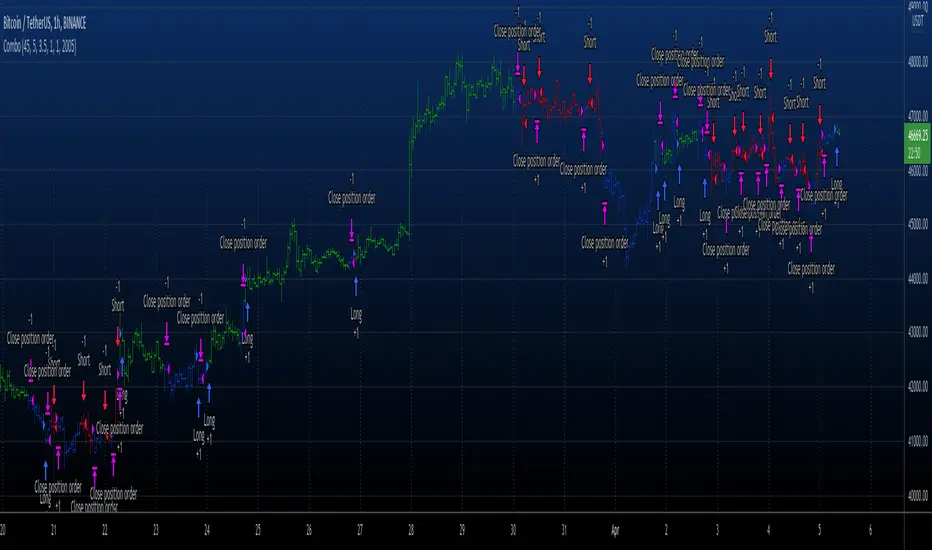
Template Signal IndicatorThis script is an example on how to create a custom indicator that produce start/end long/short deal signals based on configurable conditions from internal and external indicators.
This indicator can be used as an external indicator to other strategies like "Template Trailing Strategy" that will execute the deals and enter the desired positions based on the signals produced by this script.
Combining this script with the aforementioned strategy (or any other compatible) has the advantage that you can backrest the results of your custom deal conditions. Also additional functionality that is provided by the strategy can be utilized (e.g. Take Profit Targets, Trailing Stop Loss etc.).
In this particular example I combined the RSI and Stoch RSI indicators (internal) with the "Trend Explorer" indicator (external) so it produces buy and sell signals based on the logic I defined in the input tab of this indicator. To combine "indicators on indicators" you need Pro+ TV subscription.
The convention I use to communicate the signals is the following (2 -> enter long, 1 -> exit long, -2 -> enter short, -1 ->exit short). However, this convention is also configurable in the consumer/strategy script "Template Trailing Strategy" so make sure that both script "speak the same language" before procced.
"signal" için komut dosyalarını ara

Combo 2/20 EMA & Average True Range Reversed This is combo strategies for get a cumulative signal.
First strategy
This indicator plots 2/20 exponential moving average. For the Mov
Avg X 2/20 Indicator, the EMA bar will be painted when the Alert criteria is met.
Second strategy
Average True Range Trailing Stops Strategy, by Sylvain Vervoort
The related article is copyrighted material from Stocks & Commodities Jun 2009
Please, use it only for learning or paper trading. Do not for real trading.
WARNING:
- For purpose educate only
- This script to change bars colors.
Combo 2/20 EMA & ADXR This is combo strategies for get a cumulative signal.
First strategy
This indicator plots 2/20 exponential moving average. For the Mov
Avg X 2/20 Indicator, the EMA bar will be painted when the Alert criteria is met.
Second strategy
The Average Directional Movement Index Rating (ADXR) measures the strength
of the Average Directional Movement Index (ADX). It's calculated by taking
the average of the current ADX and the ADX from one time period before
(time periods can vary, but the most typical period used is 14 days).
Like the ADX, the ADXR ranges from values of 0 to 100 and reflects strengthening
and weakening trends. However, because it represents an average of ADX, values
don't fluctuate as dramatically and some analysts believe the indicator helps
better display trends in volatile markets.
WARNING:
- For purpose educate only
- This script to change bars colors.

Money Flow Index With Bullish & Bearish SignalsMONEY FLOW INDEX WITH BULLISH AND BEARISH SIGNALS
Money Flow Index shows whether money is coming into the market or going out of the market. This can be used to gauge market sentiment and whether people are buying or selling at the current price.
***HOW TO USE***
If the MFI line is green, it is above the 50 line and in a bullish trend.
If the MFI line is red, it is below the 50 line and in a bearish trend.
If the background color is green, Money Flow is in a bullish trend, holding above the 50 line.
If the background color is red, Money Flow is in a bearish trend, holding below the 50 line.
If the MFI is above the 75 level it indicates a possible top or overbought conditions.
If the MFI is below the 25 level it indicates a possible bottom or oversold conditions.
***BULLISH/BEARISH LABELS***
There is also a label on the right side that tells you whether the overall trend is bullish or bearish, if there is a possible bottom or top and if the current money flow index is going up or down. This table updates in real time and changes colors so you can get an easy, quick interpretation of the current money flow without having to look at the data so you can make faster decisions on whether to enter or exit a trade. The flashing from red to green or the opposite also grabs your attention so you know immediately if there is a change in trend. The table changes colors in sync with the MFI line and it's trends and bottom/top areas. Green means money is coming in. Red means money is going out. Blue means a neutral amount of money flow.
***MARKETS***
This indicator can be used as a signal on all markets, including stocks, crypto, futures and forex.
***TIMEFRAMES***
This Money Flow Index indicator can be used on all timeframes.
***TIPS***
Try using numerous indicators of ours on your chart so you can instantly see the bullish or bearish trend of multiple indicators in real time without having to analyze the data. Some of our favorites are our Auto Fibonacci, DMI, Momentum, Auto Support And Resistance and Volume Profile in combination with this Money Flow Index. They all have real time Bullish and Bearish labels as well so you can immediately understand each indicator's trend.

Alligator: Three signals confirmation with AlertsHello Trading Viewers,
The following is the William’s Alligator indicator with alerts indicating strong momentum, it can be used for scalping in lower time-frames or just riding the momentum in 1hr or 4hrs charts.
Input choices are:
1. Source of Data: Open, Low, High, Close, HL2, HLC3 and so on.
2. Simple and Exponential are the two choices of moving averages.
3. Lips, Teeth and Jaws input numbers are Fibonacci numbers with offsets from -4 to +4.
4. Up Momentum and Down Momentum signals will be plotted top and bottom of the charts respectively when conditions are met.
Idea used to confirm strong momentum
When (High + Low / 2) price is greater than Alligator’s Lips, Teeth, and Jaws, it is considered as a good time to go long; however, to strengthen the idea, the up-momentum condition needs to be approved three times consecutively. (Three consecutive candle bars should remain above Lips, Teeth, and Jaws to trigger an alert signal and plot Up- momentum shape on the charts)
The same idea with down-momentum, but the condition (High + Low / 2) price should be less than Alligator’s Lips, Teeth, and Jaws.
There is an alert set-up, once strong momentum is spotted it will send an alert once per bar close. You can relax and run an errand when the alert is not triggered.
Happy Trading!
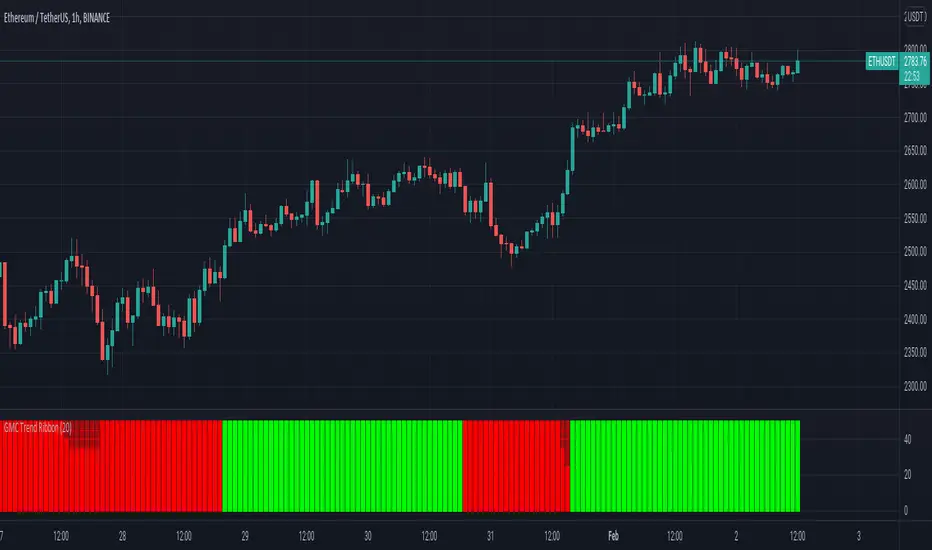
GMC Trend FilterAvoid Fake Signals, and identify the trend.
How it works ?
- it calculates main trend direction by using the length that is user-defined. so you can change it as you wish
- then it calculates trend direction for each 9 lower lengths. if you set the length = 20 then the lengths are 19, 18,...11
- and it checks if the trend directions that came from lower lengths is same or not with main trend direction.
- it changes the trend color of the ribbon.
BUY/SELL SIGNALS from LSMA/ALMA/HMAThis indicator uses the Least Squares Moving Average (LSMA) in tandem with the Arnaud Legoux Moving Average (ALMA) and Hull Moving Average (HMA) to generate buy-sell signals, represented by the light blue and orange crosses respectively.
The yellow lines produced by the indicator show periods of market uncertainty and possible reversal, and a modified, user-defined VWAP is given along with a 200 EMA. The point of this indicator was to create a smoother, more visually appealing moving-average, price action-based indicator when compared to the trend-step and simple moving average indicators available. This indicator uses a fast (25 period) LSMA coupled with a slower (50 period) HMA and ALMA in order to make signals both smooth and fast.
This indicator will work on all markets, except the modified VWAP will naturally not function if the volume is unpublished for that market. Use of this indicator will be very strong in trending markets, as the yellow line will spot possible reversals quite early, meaning the trader can be ready early for the buy/sell signal to appear. Use of this indicator in sideways market conditions will be limited, as it is for all moving average-based indicators, but the damage will be minimal as bad trades will be quickly realized by the indicator and the color will switch to yellow, this is possible because of the settings differences between the period lengths of the LSMA vs the ALMA + HMA.
Long Term Buy/Sell Signal by BonyThis script attempts to use Exponential Moving averages (short-term and long-term convergence) of different lengths in order to identify trade entries and exits for bullish & bearish trades. I would strongly recommend using this as a guide to enter or exit long-term swing trades on growth names such as Apple, Tesla, Microsoft to keep your emotions out of the trading. You use this script by entering a trade when it signals a green BUY signal with a UP arrow and exiting when it signals red. The general idea is that one is fast and one is slow-moving EMA and these indicate when to buy/sell when they crossover the overbought/sold lines.
Disclaimer:
This script is for educational purposes only. The market is always moving up or down, so always trade with caution and use your best judgment for every trade.

Creentrend Pressure SignalsThe hull moving average is my favorite moving average, as well as slower (55ma Bollinger Bands dev@(1.618)) is my favorite standard deviation indicator. Lets combine the two to evaluate overbought, oversold, and pressure.
Use for all time frames- I PREFER daily.
Bollinger band MA at 55
Hull ma at 55
The Hull is more reactive and faster than any band on the BB (both at 55)
When HULL closes BELOW LOWER BAND- it will print a buy signal, remember- over sold and overbought in VOLATILITY could be dangerous on low time frames, as swift moves typically have short term reversals but return to the main trend eventually, this is why i reccomend daily candles.
When PRICE closes ABOVE UPPER BOLLINGER BAND- it will print a green ^ signal under candle indicating upward pressure.
When HULL closes ABOVE UPPER BOLLINGER BAND- it will print a red resistance line. Complex tops happen a lot with bitcoin so take a 1-5% stop above it if shorting.
Supertrend But Only Buy Signals
Supertrend but only greens
use only i f u like greens
red means price go down i dont like price down i hate red
i want green price go up
please only use for buy green signal. this is a financial tool only for greens

Auto Fib Golden Pocket Band - Strategy with Buy Signalsthis strategy is based on the Indicator "Auto Fib Golden Pocket Band - "Autofib Moving Average"
it's the same as the indicator but with:
- the strategy tester included
- several entry Signal filter
- Dynamic SL

Wavy Tunnel + Trend ATR Buy Sell Signal by PaRnWavy Tunnel + Trend ATR Buy Sell Signal by PaRn
Originality by PaRn
First Combination of Wavy Tunnel + Trend ATR Buy Sell Signal by PaRn
"Buy Sell Signal" is base on Volatility Stop 20, Multiplier 2.5
"Trend Signal" is based on EMA crossover between EMA12(Close) and EMA26(Close)
Take Profit Line is EMA15(Default)
Wavy line Base on EMA34(high,close,low)
Tunnel line Base on EMA144(close),EMA169(close)
Green Candle Bar = "Uptrend"
Red Candle Bar = "Downtrend"
Buy when "Buy" Signal present
Follow Trend till the end of the trend : "Sell" Signal present
Buy More (Optional) = Green Arrow present on Uptrend
How to use Wavy Tunnel + Trend ATR Buy Sell Signal by PaRn
- Wavy Tunnel + Trend Signal can be used in any timeline from 5 Minutes to Weeks
- Price above both Wavy & Tunnel = "Uptrend"
- Green Candle Bar = Uptrend
- Buy when "Buy" Signal present
- Buy More (Optional) = Green Arrow present on Uptrend
- Hold your possition and Follow Trend till the end of the trend : "Sell" Signal present, It's time to sell all position
NOT RECOMMEND TO USE ON SIDEWAY MARKET

Moving Avarage Percentage difference bands It creates a buy and sell signal according to the up and down percentage differences of fast and slow moving averages. Green band breaks are buy and red band breaks are sell signals difference there is a threshold value for optimization, high values generate more signals, but the risk of these signals increases..
hızlı ve yavaş hareketli ortalamaların yüzdesel farklarının aşağıya ve yukarıya kırılımlarına göre alım ve satım sinyali oluşturur yeşil bant kırılımları al kırmızı bant kırılımları sat sinyalidir optimizasyon için eşik değeri eklenmiştir yüksek değerler daha fazla sinyal almanıza sebep olur ama riskli sinyal sayısı artar düşük değerler daha az sinyal almanızı sağlar ama riskli sinyal sayısıda azalır.
3GBH - Simple HMA'sIncluded in this indicator:
- 3x HMA w/ cloud
(Slow/Fast HMA)
(Signal HMA)
-----
User-friendly.
You can change all the inputs, they are labelled for ease-of-use.
You can toggle On/Off any or all of the options.

RSI Signals by HBRELATIVE STRENGTH INDEX (RSI)
This is a tool that is widely used
Especially for Overbought and Oversold systems, but I have made some changes in this indicator,
How to use it...!
I have set it as the default setting
- RSI Length: 7
- Overbought: 70
- Oversold: 30
What is unique about this tool?
we can see 3 conditions:
1) RSI Overbought / Oversold with Bullish Engulfing / Bearish Engulfing
2) RSI Overbought / Oversold with Hammer and Shooting Star
3) RSI Overbought / Oversold with 2 Bullish Bars / 2 Bearish Bars
4) RSI Overbought / Oversold with All Patterns at the same time
When the RSI reaches its Oversold line, the code will wait for Bullish Engulfing pattren , when oversold and Bullish engulfing matched, This indicator will generate a buy signal when the condition is met,
and same as for Bear market, When the RSI reaches its Overbought line, the code will wait for Bearish Engulfing pattren , This indicator will generate a sell/exit signal when the condition is met,
2nd condition is that a Hammer candle will be waited for when RSI touches the Overbought line, for Bullish Move
and Shooting Star candle will be waited for when RSI touches the Overbought line, for Bullish Move, for Bearish Move
3rd Condition is also the same as Condition 1 and Condition 2,
When the RSI reaches its Oversold line, the code will wait for 2 Bullish Bars , when oversold and 2 Bullish Bars matched then this indicator will generate a buy signal, and same as for Bear market,
When the RSI reaches its Overbought line, the code will wait for 2 Bearish Bars , when overbought and 2 Bearish Bars matched then this indicator will generate a Sell signal,
4th Condition is that we can use All Conditions at the same time,
- Bullish Engulfing / Bearish Engulfing
- Hammer and Shooting Star
- 2 Bullish Bars / 2 Bearish Bars

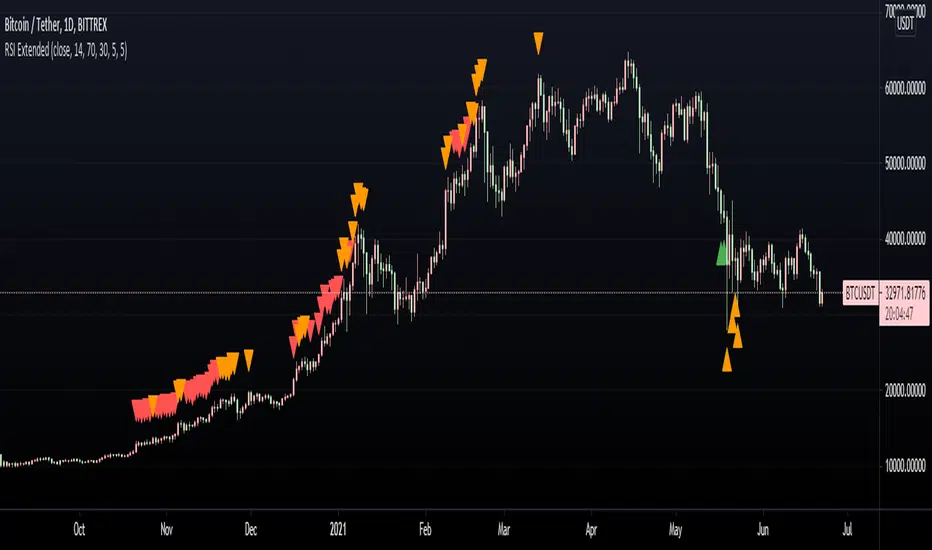
RSI ExtendedThis script is intended to print signals on the main price chart and send alerts when the RSI is overbought or oversold.
You can customize the source of the signal (open, close, etc), as well as oversold/overbought levels, and RSI length.
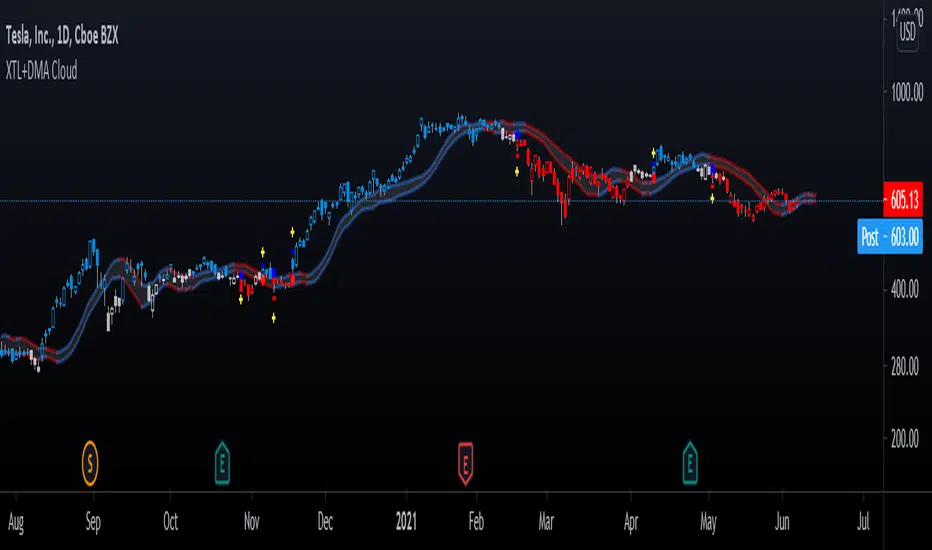
Advanced GET: Tom Joseph's XTL, DMA Cloud & Breakout SignalsThe Expert Trend Locator ( XTL ) was developed by Tom Joseph to identify major trends, similar to elliott wave 3 type swings.
Blue bars are bullish and indicate a potential upwards impulse.
Red bars are bearish and indicate a potential downwards impulse.
White bars indicate no trend is detected at the moment.
Added to the indicator is the recommended use to enter a position, as explained by Tom Joseph in his book Applying Technical Analysis:
Once a blue or red bar appears, the indicator signals an entry level, a stop loss level and two target levels (2nd is optional).
The levels can be shown until a new signal emerges or just above/below the breakout bar.
Finally, a cloud formed by two displaced moving averages (DMA) is included, which allow the trend to continue its momentum. During an uptrend the lower moving average could serve as a trailing stop, and during a downtrend the upper moving average could serve as the trailing stop.
Enjoy!
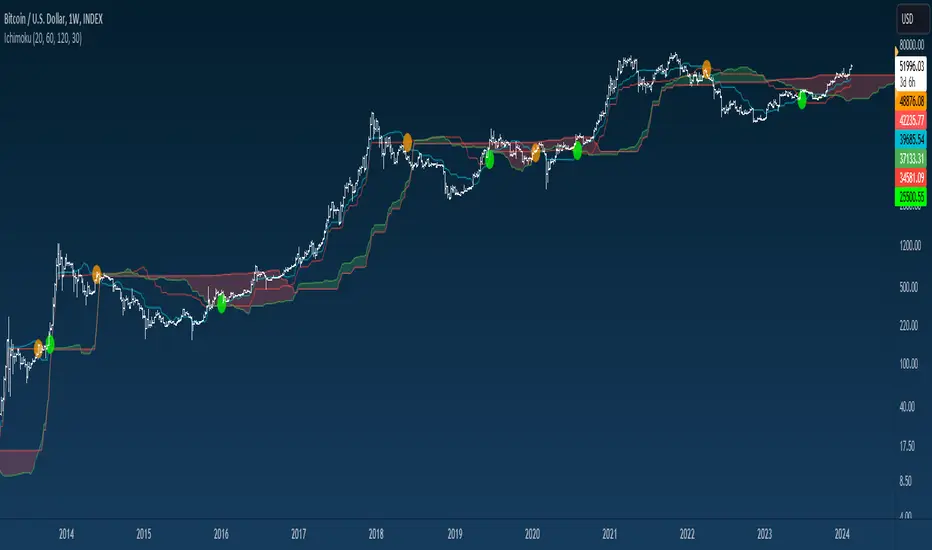
Ichimoku Buy & Sell SignalsIchimoku cloud with color coded circles to signal the cross of Tenkan and Kijun.
Three EMA and Stochastic RSI Signals with TP and SL AlertsThis is kind of similar to one of my other scripts but I figured people might be looking for this one in a simple wrapped up package. It takes 3 EMAs, a 50, 14 and an 8 and the trade signals come from crossovers of the Stochastic RSI lines and conditions that marry up with the EMAs lining up in an uptrend or downtrend condition. I used the TP and SL lines from one of my other scripts so you can see where the winners and losers are. Includes alerts so they can be used with webhooks to automate however you wish. I have added signal confirmation with Weiss Wave Volume on side with trend. Stop and TP Levels are configurable in the settings as well as the periods for the ATR used in these calculations.

Fibodex TrapFibodex Trap indicator
this indicator designed by the Fibodex team
you will receive dump and bump singles buy using this indicator
also, you will receive buy and sell signals
indeed by using our indicator you won't need many technical analyses
The accuracy of the indicator with the correct settings is estimated to be more than 70%
also, we are trying to improve it to make it more accurate
notice that this indicator should be used as a secondary tool
By using this indicator, you also accept the risk of using it.
--------------------------------------------------------------------------------------------------------------------------------------------------------------------------------------------------------------------------------------------------------------------------------------------------------
اندیکاتور تله توسط مجموعه فیبودکس ایده پردازی و کد نویسی شده است.
شما با این اندیکاتور قادر خواهید بود تا سیگنال های پامپ و دامپ و همچنین خرید و فروش را دریافت نمایید.
دقت اندیکاتور با تنظیمات صحیح بیش از 70 درصد تخمین زده شده است که مجموعه فیبودکس در جهت بهبود و افزایش دقت آن تلاش خواهد کرد.
به یاد داشته باشید که از این اندیکاتور به عنوان کمکی و دریافت تاییده کمک بگیرید .
شما با استفاده از این اندیکاتور ریسک استفاده از آن را هم می پذیرید

T3 Gold Sniper [RickAtw]Gold Sniper based on support and resistance looks for a sniper entry for trades. Used together with EMA
Key signal
Buy ------> Green Line
Sell ------> Red Line
Functional
The system was made for gold and everything is tuned for it.
I am a professional investor and I test each system for how long. If the system makes an income, it gets to my page. Use it for gold, cryptocurrencies and pairs AUD/USD GBP/USD
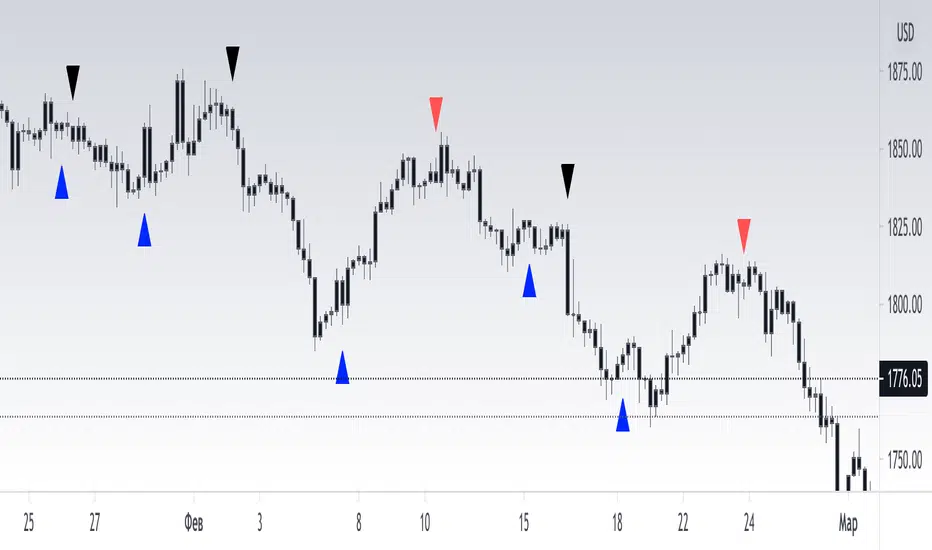
[RickAtw] T2 Trend Signal GOLDTrend gold signal Ema strategy
The system finds the best entries for a trade. Use in gold, all numbers have been customized for it.
Functional
T2 trend gold is the second version of my trading system. Be sure to check out the first part! This system gives a signal earlier.
Key signals
Buy -----> Blue triangle to buy
Sell -----> Red triangle to sell
Remarks
I personally tested this system on my own trading and it helps me find entries for deals. The main thing is, if consolidation has begun, turn off the system, because the trading range is small at this moment, use oscillators
Thanks to everyone who supports me. Good luck to you friends