均线趋势过滤器 (MA_trend Signal/Noise Filter)双语简介
中文:
这款指标是一个基于“信噪比”思想的终极趋势过滤器。它通过比较快速和慢速EMA均线之间的差值(即信号)与ATR(平均真实波幅,代表噪音)来判断市场趋势。只有当信号的强度超过噪音的指定倍数时,才会确认趋势的有效性。该指标可帮助交易者过滤掉噪音,精确捕捉强势趋势,避免误操作。
English:
This indicator is the Ultimate Trend Filter based on the Signal-to-Noise ratio concept. It compares the difference between the fast and slow EMA (Signal) to the ATR (Noise) to determine market trends. A trend is confirmed only when the signal strength exceeds the noise by a specified multiplier. This indicator helps traders filter out noise and accurately capture strong trends, avoiding false signals.
"signal" için komut dosyalarını ara

Stacey Burke Signal Day LTE“Previously published as ‘Day Zero Fakeout Detector MTF’”
Stacey Burke Signal Day LTE
Automatic detection of Day Zero, Inside Days, and Outside Days for Stacey Burke’s intraday playbook
🔎 Stacey Burke’s Signal Days
This indicator highlights the key daily patterns that often lead to high-probability intraday setups in Stacey Burke’s methodology:
1️⃣ Day Zero
The reset days within a 3-day cycle (e.g. breakout → continuation → exhaustion/reversal).
Can mark the beginning of a new directional phase.
Trades back inside the prior range after a Peak Formation High (PFH) or Peak Formation Low (PFL).
Bias: Look for measured parabolic session moves. When combined with trend following indicators, these signal days can be very powerful.
2️⃣ Inside Day
A day where the entire range is contained within the prior day’s range.
Signals consolidation and energy build-up.
Often leads to explosive breakouts in the next session.
Bias: Trade breakouts of the inside day’s high/low or breakout reversal in the session at key timings in the direction of higher timeframe bias. When combined with trend following indicators, these signal days can be very powerful.
3️⃣ Outside Day (Engulfing Day)
`
A day where the range is larger than the prior day’s range, engulfing both high and low.
Marks trapped traders and fakeouts on both sides.
Often precedes strong continuations or sharp reversals from outside of the ranges.
Bias: Align trades with the true continuation move. When combined with trend following indicators, these signal days can be very powerful.
📌 How They Work Together
Day Zero → Signals the new cycle after PFH/PFL.
Inside Day → Signals compression → expect breakout setups.
Outside Day → Signals exhaustion/fakeouts → expect reversals or continuations.
Together, they give traders a clear daily roadmap for where liquidity sits and when to expect the highest-probability setups.
✅ Example in Practice
Market rallies for 3 days → PFH forms → Day Zero short bias.
Next day prints an Inside Day → watch for breakout continuation short, and breakout reversals.
Later, an Outside Day traps both longs and shorts → the following session offers a clean intraday reversal or continuation trade in line with the underlying MTF trend/bias.
⚙️ Features of This Indicator
Automatic detection of Day Zero, Inside Days, and Outside Days
Multi-Timeframe (MTF) support for cycle alignment
Visual markers for PFH/PFL and consolidation zones
Measured move projections for breakout targets
👉 Stacey Burke Signal Day LTE gives traders just a few of the most important signal days — Day Zero, Inside Day, and Outside Day — to structure their intraday trades around fake outs, breakouts, and reversals within the daily cycles of the week. (This is work in progress: Next up, FRD/FGD's, 3-day cycle detecting, 3DLs, 3DSs).

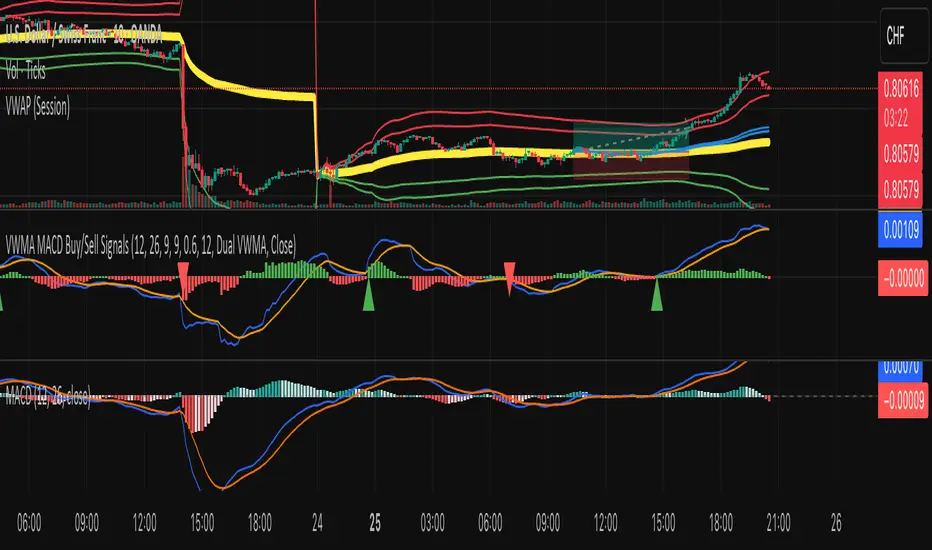
VWMA MACD Amanita Buy/Sell Signals VWMA MACD Amanita Buy/Sell Signals – Volume-Weighted Momentum Indicator
A twist on the classic MACD: this indicator uses Volume Weighted Moving Averages (VWMA) instead of EMAs, giving more weight to price moves backed by higher volume.
Features:
VWMA-based MACD line & signal line
Histogram highlights bullish/bearish momentum
Color-coded for easy visualization
Quick Guide:
MACD above Signal → bullish
MACD below Signal → bearish
Rising histogram → strengthening trend
Falling histogram → weakening trend
Perfect for traders who want momentum confirmed by volume.
Lowest Low Breakout Signal w/ Target
### **Script Description**
This TradingView Pine Script indicator identifies breakout entry opportunities after a new **lowest low** is formed within a user-defined lookback period. It is designed for traders who want to catch reversals or breakouts from extreme lows with clearly defined targets.
**Key Features:**
* **Lowest Low Detection**: The script monitors price action for a candle that forms a new lowest low within the specified lookback period.
* **Breakout Entry Signal**: Once a breakout occurs (price closes above the high of the lowest-low candle), an **up arrow** is plotted below the entry bar.
* **Target Calculation**: Calculates **Target 1** as 50% retracement of the distance between the latest swing high and the lowest low.
* **Dynamic Table Display**: Shows real-time **Entry Price** and **Target 1** values in a table fixed on the chart (top-right corner), updating with each signal.
* **Alerts**: Sends alerts when a breakout entry signal occurs, making it easy to automate notifications.
* **Clean Visualization**: Removes clutter by eliminating extra labels and lines, using only a simple arrow and table for clarity.
**Use Case:**
Ideal for breakout traders, swing traders, and those who follow retracement-based profit targets. The indicator helps identify early entries after significant lows and provides a clear first target level.

DTLLC Time & PriceDTLLC Time and Price with Signals
This indicator is built for traders who understand ICT concepts and want a structured, visual way to align time-based price action with key market levels. By combining customizable trading windows, breakout logic, and daily reference points, it helps you identify high-probability trade opportunities while filtering out market noise.
Key Features
1. Dual Custom Time Ranges (Kill Zones)
Set two independent time ranges per day (start/end hour and minute).
Each range identifies the highest high and lowest low within its window.
Built-in breakout detection generates buy/sell signals when price moves beyond these levels.
2. Volatility Filtering
Adjustable volatility threshold based on True Range relative to ATR.
Filters out low-quality signals during choppy, low-volatility conditions.
3. ATR-Based Stop Loss
Custom ATR length and stop-loss multiplier settings.
Automatically plots ATR-based stop levels for triggered trades.
4. Daily Key Levels
Plots Previous Day High, Previous Day Low, and Midnight Open continuously on the chart.
Useful for spotting breakout and reversal opportunities in line with ICT market structure concepts.
5. Liquidity & Engulfing Candle Highlights
Highlights potential liquidity grab zones (yellow candles) when significant highs/lows are set within your lookback period.
Detects bullish (green) and bearish (red) engulfing patterns for added confluence.
6. Visual & Signal Tools
Buy/Sell signals plotted directly on chart (separate colors for Range 1 and Range 2). Continuous plotting of reference levels to maintain market context throughout the session.
Example Use Case:
A common ICT-inspired reversal setup:
Wait for price to sweep the Previous Day’s High or Low during your chosen time range.
Look for a buy or sell signal with volatility confirmation.
Manage risk using the ATR-based stop-loss plot.
Disclaimer: This script is for educational purposes only and is not financial advice. Trade responsibly and always test strategies before applying them in live markets.

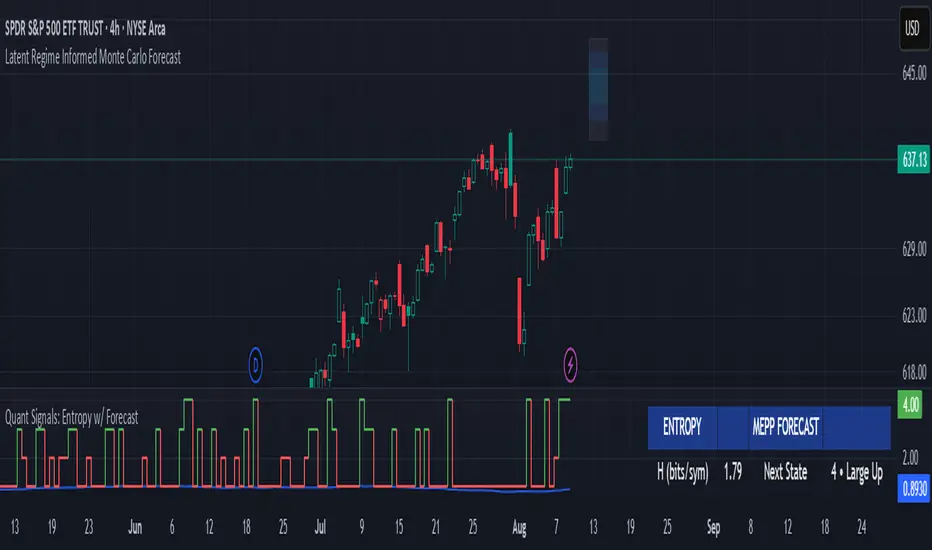
Quant Signals: Entropy w/ ForecastThis is the first of many quantitative signals I plan to create for TV users.
Most technical analysis (TA) tools—like moving averages, oscillators, or chart patterns—are heuristic: they’re based on visually identifiable shapes, threshold crossovers, or empirically chosen rules. These methods rarely quantify the information content or structural complexity of market data. By quantifying market predictability before making a forecast, this method filters out noise and focuses your trading only during statistically favorable conditions—something traditional TA cannot objectively measure.
This MEPP-based approach is quantitative and model-free:
It comes from information theory and measures Shannon entropy rate to assess how predictable the market is at any moment.
Instead of interpreting price formations, it uses a data-compression algorithm (Lempel–Ziv) to capture hidden structure in the sequence of returns.
Forecasts are generated using a principle from statistical physics (Maximum Entropy Production), not historical chart patterns.
In short, this method measures the market's predictability BEFORE deciding a directional forecast is worth trusting. This tool is to inform TA traders on the market's current regime, whether it is smooth and predictable or it is volatile and turbulent.
Technical Introduction:
In information theory, Shannon entropy measures the uncertainty (or information content) in a sequence of data. For markets, the entropy rate captures how much new information price returns generate over time:
Low entropy rate → price changes are more structured and predictable.
High entropy rate → price changes are more random and unpredictable.
By discretizing recent returns into quartile-based states, this indicator:
Calculates the normalized entropy rate as a regime filter.
Uses MEPP to forecast the next state that maximizes entropy production.
Displays both the regime status (predictable vs chaotic) and the forecast bias (bullish/bearish) in a dashboard.
Measurements & How to Use Them
TLDR: HIGH ENTROPY -> information generation/market shift -> Don't trust forecast/strategy
1. H (bits/sym)
Shannon entropy rate of the last μ discrete returns, in bits per symbol (0–2).
Lower → more predictable; higher → more random.
Use as a raw measure of market structure.
2. H_max (log₂Ω)
Theoretical maximum entropy for Ω states. Here Ω = 4 → H_max = 2.0 bits.
Reference value for normalization.
3. Entropy (norm)
H / H_max, scaled between 0 and 1.
< 0.5–0.6 → predictable regime; > 0.6 → chaotic regime.
Main regime filter — forecasts are more reliable when below your threshold.
4. Regime
Label based on Entropy (norm) vs your entThresh.
LOW (predictable) = higher odds forecast will be correct.
HIGH (chaotic) = forecasts less reliable.
5. Next State (MEPP Forecast)
Discrete return state (1–4) predicted to occur next, chosen to maximize entropy production:
Large Down (strong bearish)
Small Down (mild bearish)
Small Up (mild bullish)
Large Up (strong bullish)
Use as your bias direction.
6. Bias
Simplified label from the Next State:
States 1–2 = Bearish bias (red)
States 3–4 = Bullish bias (green)
Align strategy direction with bias only in LOW regime.
EMA Pullback Entry SignalsEMA Pullback Entry Signals is a tool designed to help traders identify trend continuation opportunities by detecting price pullbacks toward a slow EMA (Exponential Moving Average) during trending conditions.
This indicator combines moving average crossovers, price interaction with EMAs, and optional filtering to improve the timing and quality of trend entries.
Core Features:
Golden Cross / Death Cross Detection
Golden Cross: Fast EMA crossing above Slow EMA
Death Cross: Fast EMA crossing below Slow EMA
Optional X-shaped markers for crossover visualization
Pullback Signal on Slow EMA
Green triangle: Price crosses up through the slow EMA during a bullish trend
Red triangle: Price crosses down through the slow EMA during a bearish trend
Designed to capture continuation entries after a trend pullback
Optional Fast EMA Signals
Green arrow: Price crosses above fast EMA in a bull trend
Red arrow: Price crosses below fast EMA in a bear trend
Helps confirm minor retracements or short-term momentum shifts
Sideways Market Filter
Suppresses signals when the fast and slow EMAs are too close
Prevents entries during low-trend or choppy price action
Cooldown Timer
Enforces a minimum bar interval between signals to reduce overtrading
Helps avoid multiple entries from clustered signals
Custom Alerts
Alerts available for all signal types
Include ticker and timeframe in each alert message
Configurable Settings:
Fast and slow EMA lengths1
Toggle individual signal types (pullbacks, fast EMA crosses, crossovers)
Enable/disable cooldown logic and set bar duration
Sideways market detection sensitivity (EMA proximity threshold)
Primary Use Case
This script is most useful for trend-following traders seeking to enter pullbacks after a trend is established. When the price retraces to the slow EMA and then resumes in the trend direction, it can offer high-quality continuation setups. Works well across timeframes and markets.

HHT Signal Analyzer (Refined)HHT Signal Analyzer
The HHT Signal Analyzer provides a real-time, smoothed approximation of the Hilbert-Huang Transform (HHT), designed to reveal adaptive cycles and phase changes in price action. It emulates Intrinsic Mode Functions (IMFs) using a double exponential moving average (EMA) filter to extract short-term oscillatory signals from price.
This indicator is helpful for identifying subtle shifts in market behavior, such as when a trend is transitioning or weakening, and is especially effective when paired with trend-based tools like GRJMOM.
How it works:
Applies a double EMA to the price (EMA of EMA)
Calculates the difference between the fast and slow EMA to emulate IMF behavior
Amplifies the signal for clear visual feedback
Highlights cycle slope changes with background coloring (green = rising, red = falling)
Use Cases:
Use slope direction to detect early phase shifts in the market
Combine with trend indicators to confirm or fade moves
Helps visualize when the market is entering a cycle crest or trough
Best for:
Traders looking to capture short-term reversals, cycle timing, or divergence with smooth and adaptive signals
Can be used on any timeframe

Ayman Entry Signal – Ultimate PRO (Scalping Gold Settings)1. Overview
This indicator is a professional gold scalping tool built for TradingView using Pine Script v6.
It combines multiple price action and technical filters to generate high-probability Buy/Sell signals with built-in trade management features (TP1, TP2, SL, Break Even, Partial Close, Stats tracking).
It is optimized for XAUUSD but can be applied to other assets with proper setting adjustments.
2. Key Features
Multi-Condition Trade Signals – EMA trend, Break of Structure, Order Blocks, FVG, Liquidity Sweeps, Pin Bars, Higher Timeframe confirmation, Trend Cloud, SMA Cross, and ADX.
Full Trade Management – Auto-calculates lot size, SL, TP1, TP2, Break Even, Partial Close.
Dynamic Chart Drawing – Entry lines, SL/TP lines, trade boxes, and real-time PnL.
Statistics Panel – Tracks wins, losses, breakeven trades, and total PnL over selected dates.
Customizable Filters – All filters can be turned ON/OFF to match your strategy.
3. Main Inputs & Settings
Account Settings
Capital ($) – Total trading capital.
Risk Percentage (%) – Risk per trade.
TP to SL Ratio – Risk-to-reward ratio.
Value Per Point ($) – Value per pip/point for lot size calculation.
SL Buffer – Extra points added to SL to avoid stop hunts.
Take Profit Settings
TP1 % of Full Target – Fraction of TP1 compared to TP2.
Move SL to Entry after TP1? – Activates Break Even after TP1.
Break Even Buffer – Extra points when moving SL to BE.
Take Partial Close at TP1 – Option to close half at TP1.
Signal Filters
ATR Period – For SL/TP calculation buffer.
EMA Trend – Uses EMA 9/21 crossover for trend.
Break of Structure (BoS) – Requires structure break confirmation.
Order Block (OB) – Validates trades within OB zones.
Fair Value Gap (FVG) – Confirms trades inside FVGs.
Liquidity Sweep – Checks if liquidity zones are swept.
Pin Bar Confirmation – Uses candlestick patterns for extra confirmation.
Pin Bar Body Ratio – Controls strictness of Pin Bar filter.
Higher Timeframe Filters (HTF)
HTF EMA Confirmation – Confirms lower timeframe trades with higher timeframe trend.
HTF BoS – Confirms with higher timeframe structure break.
HTF Timeframe – Selects higher timeframe.
Advanced Filters
SuperTrend Filter – Confirms trades based on SuperTrend.
ADX Filter – Filters out low volatility periods.
SMA Cross Filter – Uses SMA 8/9 cross as filter.
Trend Cloud Filter – Uses EMA 50/200 as a cloud trend filter.
4. How It Works
Buy Signal Conditions
EMA 9 > EMA 21 (trend bullish)
Optional filters (BoS, OB, FVG, Liquidity Sweep, Pin Bar, HTF confirmations, ADX, SMA Cross, Trend Cloud) must pass if enabled.
When all active filters pass → Buy signal triggers.
Sell Signal Conditions
EMA 9 < EMA 21 (trend bearish)
Same filtering process but for bearish conditions.
When all active filters pass → Sell signal triggers.
5. Trade Execution & Management
When a signal triggers:
Lot size is auto-calculated based on risk % and SL distance.
SL is placed beyond recent swing high/low + ATR buffer.
TP1 and TP2 are calculated from the SL using the reward-to-risk ratio.
Break Even: If enabled, SL moves to entry price after TP1 is hit.
Partial Close: If enabled, half of the position closes at TP1.
Trade Exit: Full exit at TP2, SL hit, or partial close at TP1.
6. Chart Display
Entry Line – Shows entry price.
SL Line – Red dashed line at stop loss level.
TP1 Line – Lime dashed line for TP1.
TP2 Line – Green dashed line for TP2.
PnL Labels – Displays real-time profit/loss in $.
Trade Box – Visual area showing trade range.
Pin Bar Shapes – Optional, marks Pin Bars.
7. Statistics Panel
Stats Header – Shows “Stats”.
Total Trades
Wins
Losses
Breakeven Trades
Total PnL
Can be reset or filtered by date.
8. How to Use
Load the Indicator in TradingView.
Select Gold (XAUUSD) on your preferred scalping timeframe (1m, 5m, 15m).
Adjust settings:
Use default gold scalping settings for quick start.
Enable/disable filters according to your style.
Wait for a Buy/Sell alert.
Confirm visually that all desired conditions align.
Place trade with calculated lot size, SL, and TP levels shown on chart.
Let trade run – the indicator manages Break Even & Partial Close if enabled.
9. Recommended Timeframes
Scalping: 1m, 5m, 15m
Day Trading: 15m, 30m, 1H
Swing: 4H, Daily (adjust settings accordingly)

RSI Custom ADX VWAP Swing SignalsRSI Custom ADX VWAP Swing Signals
This Pine Script indicator is designed for the NASDAQ 1-minute timeframe (or any timeframe you use) and combines several technical analysis tools:
RSI (Relative Strength Index): Measures momentum, indicating overbought and oversold conditions.
Custom ADX (Average Directional Index): Quantifies the strength of a trend, regardless of direction.
VWAP (Volume-Weighted Average Price): Represents the average price weighted by volume, indicating central price tendency.
Swing High/Low Detection: Identifies recent high and low points to detect breakout signals.
How it works:
RSI Calculation:
Uses a length of 14 (or your input) to assess whether market momentum is overbought (>60) or oversold (<30).
Custom ADX Calculation:
Computes plusDM and minusDM based on recent high/low price changes.
Smooths these using Wilder’s method (ta.rma) to obtain directional movement.
Derives the ADX value (sig), representing the trend strength.
VWAP Calculation:
Uses the typical price (hlc3) to compute the VWAP, a key level indicating average trading price weighted by

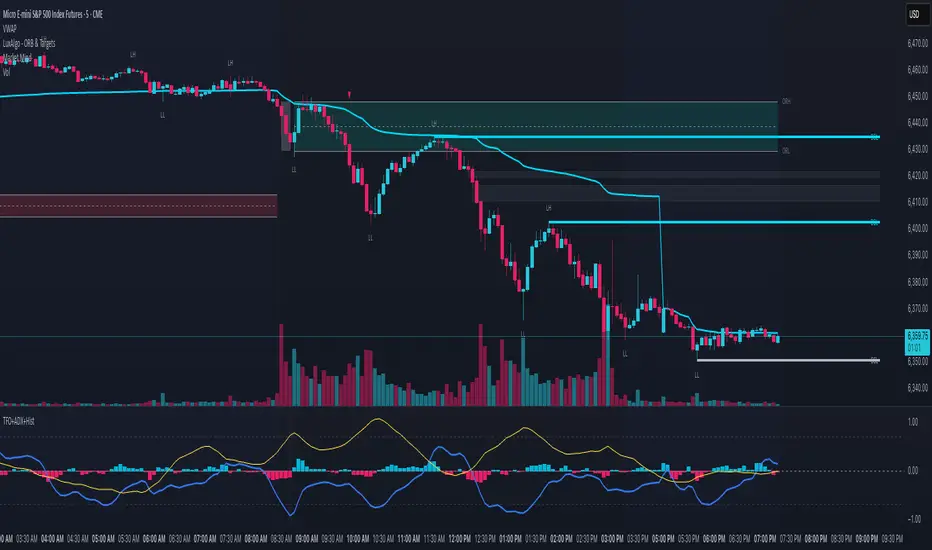
TFO + ADX with Histogram & SignalTrend Flow Oscillator (TFO + ADX) – Histogram + Signal
This version of the original TFO+ADX introduces a MACD-style histogram and signal line overlay for clearer momentum and trend visualization.
The Trend Flow Oscillator (TFO+ADX) blends two powerful volume-based tools — the Money Flow Index (MFI) and Chaikin Money Flow (CMF) — along with a normalized Average Directional Index (ADX). The result is a comprehensive momentum and trend strength tool that offers a more precise read on when markets are gaining or losing conviction.
⸻
How It Works
1.Money Flow Index (MFI)
• Measures volume-weighted buying/selling pressure using price and volume.
• Scaled between –1 and +1 for visual clarity.
2.Chaikin Money Flow (CMF)
• Evaluates volume distribution over time — institutional buying (accumulation) or selling (distribution).
• Also scaled between –1 and +1.
3.TFO Composite Line
• Combines MFI and CMF into a single flow reading.
• A signal line (EMA) tracks the trend of this flow.
• A histogram plots the difference between the TFO and its signal, giving clear signals on shifts in momentum.
4.Normalized ADX Overlay
• Shows trend strength on the same scale (–1 to +1).
• ADX > 0 indicates strong trending conditions.
• ADX < 0 signals weak or consolidating conditions.
⸻
Visual Interpretation
1. Histogram Bars
• Green: TFO is above the signal line → bullish momentum accelerating
• Red: TFO is below the signal line → bearish momentum building
• Bar height represents the strength of the momentum shift
2. Signal Line
• Tracks the smoothed trend of the TFO composite
• Histogram crossing above or below zero reflects momentum crossover and can act as entry or exit signals
3. TFO Raw Line (Optional)
• Still available for reference alongside the histogram
• Shows the unsmoothed blended money flow direction (MFI + CMF)
4. Extreme Zones
• Background shading appears when TFO exceeds ±1.0
• Helps highlight areas of stretched or unsustainable momentum, useful for spotting potential reversals or exhaustion
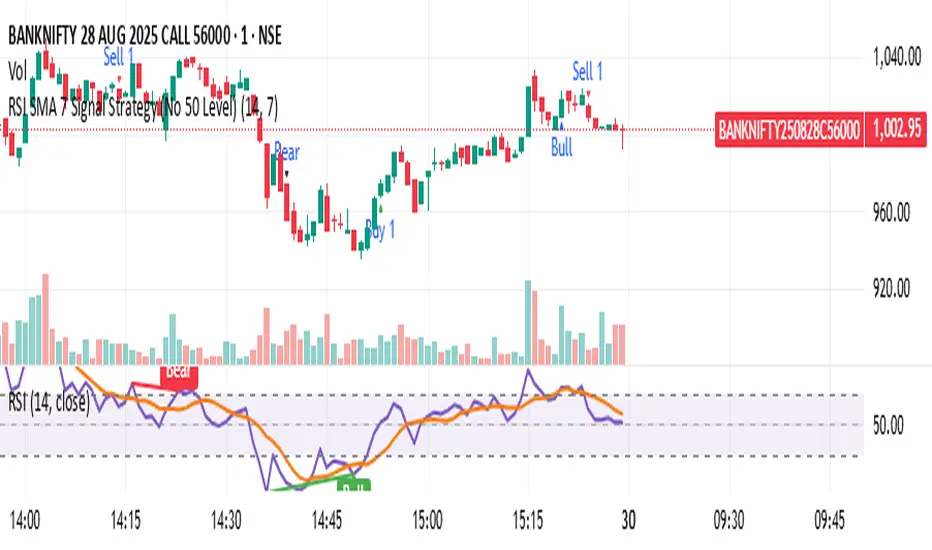
RSI SMA 7 Signal Strategy (No 50 Level)Script uses SMA 7 Perio and 14 Period RSI
If SMA crosses 40 RSI level from below consider it a buy zone or buy signal, if SMA crosses from below 60 RSI level, then super bullish, IF SMA crosses 60 RSI level from above its a profit taking time and Sell zone, if SMA crosses 40 level from above then super bearish sell signal.
MJBFX VWAP WITH SIGNALSThe MJBFX VWAP Channel is a custom-built volume-weighted average price indicator designed around the MJBFX trading methodology.
This tool tracks multiple rolling VWAPs anchored to a user-defined timeframe (default: 1H), then calculates percentile levels (Max, Upper, Median, Lower, Min) to create a dynamic channel. These levels act as key support and resistance zones that adapt to market conditions.
🔶 Features:
Adjustable anchor period and VWAP count (up to 500 VWAPs)
Percentile-based VWAP levels (Max, Upper, Median, Lower, Min)
Customisable colours, widths, and line styles
Optional gradient channel fills
Anchor period highlights for session awareness
MJBFX Branded Signals:
🟠 Buy – Triggered when price crosses above the lower VWAP (MJBFX Orange)
⚪ Sell – Triggered when price crosses below the upper VWAP (MJBFX Grey)
Built-in alert conditions for automated trade notifications
🔶 How to Use:
The VWAP channel provides a dynamic structure for intraday trading.
Buy opportunities often occur when price sweeps below the lower band and reclaims it.
Sell opportunities often occur when price sweeps above the upper band and rejects.
Use in confluence with market structure, session timing, and your trading plan (e.g., MJB-FX Asian Sweep strategy).

Twin Range Filter – Buy/Sell SignalsThe Twin Range Filter is a trend-following indicator that combines two adaptive volatility filters to identify potential market reversals and trend continuations. It uses two configurable smoothing periods (fast and slow) to calculate a dynamic range around price, filtering out market noise and highlighting meaningful shifts in direction.
This indicator plots BUY and SELL signals based on price action in relation to the range filter, as well as internal trend conditions.
✅ How It Works:
Long Signal (BUY) is triggered when:
Price is above the filtered range (showing strength), and
Short-term upward momentum is confirmed.
Short Signal (SELL) is triggered when:
Price is below the filtered range (showing weakness), and
Short-term downward momentum is confirmed.
The signals are highlighted using green "Long" and red "Short" labels on the chart.
Background colors reinforce the current directional bias.
🔔 Alerts:
Long Signal – A new BUY condition has been detected.
Short Signal – A new SELL condition has been detected.
📌 Use Cases:
Entry timing for swing or intraday trades
Trend confirmation filter
Signal generator in automated strategies (when paired with a strategy script)
Day‑trade Long/Short Signalsday trade Long\Short signals idskator
Displays EMA 5, 8, and 13 to track the trend.
Signals LONG when EMA5 crosses above EMA8 and the MACD line is above the signal line.
Signals SHORT when EMA5 crosses below EMA8 and the MACD line is below the signal line.

Reversal Signal avec TICK + RSIThis indicator is a potential reversal indicator for SCALPING, don't use it for swing. It's base on TICK and on an overbrought/oversold condition of the RSI. You can play with the setting, typicaly I like my TICK to be over reacting an 800/-800 and my rsi over 20 and 80, but it give not enough signal. So I set the TICK signal at 651/-651 and the RSI at 25/75. This indicator is made for SP500 and Nasdaq, so SPY/QQQ/SPX/ES/NQ should work well. It's the first version of it, so maybe I'll add so more data to it to increase signal and lower false one. For now I've test it on live market yet(26/7/25).
The RSI is Fast(5 period), I like to use it on the 1 or 5 min chart.
Please not that it only work during 9h30am to 4pm EST.(Because of the TICK)
Feel free to try and even comment. Don't be harsh on me, it's my first try!
(Sorry for my 'english' it's not my first language)
FAUCON
Volume Breakout SignalsScript by Hanssome
The Volume Breakout Signals indicator is a trading tool designed to identify potential entry points by pinpointing high-momentum price breakouts on your main chart. It operates on a simple but powerful principle: a true breakout should be supported by a significant increase in trading volume.
The indicator plots two primary visual elements on your price chart:
Pivot Highs and Lows: These are marked with green and red circles and represent the most recent significant swing points in the price. They act as dynamic support and resistance levels, and the script watches for the price to break past them.
BUY and SELL Labels: These signals appear directly on the chart to indicate a potential trading opportunity.
A signal is only generated when two specific conditions are met simultaneously:
Price Breakout: A BUY signal requires the price to cross decisively above the most recent pivot high. A SELL signal requires the price to cross below the most recent pivot low.
Volume Confirmation: This price breakout must be accompanied by a recent spike in trading volume. This confirmation suggests strong momentum and conviction behind the move, increasing the probability of a successful breakout.
All the parameters, such as the sensitivity of the pivot points and the definition of a volume spike, can be adjusted in the indicator's settings to fit your specific trading style and the asset you are viewing.
Floor and Roof Indicator with SignalsFloor and Roof Indicator with Trading Signals
A comprehensive support and resistance indicator that identifies premium and discount zones with automated signal generation.
Key Features:
Dynamic Support/Resistance Zones: Calculates floor (support) and roof (resistance) levels using price action and volatility
Premium/Discount Zone Identification: Highlights areas where price may find resistance or support
Customizable Signal Frequency: Control how often signals are displayed (every Nth occurrence)
Visual Signal Table: Optional table showing the last 5 long and short signal prices
Multiple Timeframe Compatibility: Works across all timeframes
Technical Details:
Uses ATR-based calculations for dynamic zone width adjustment
Combines Bollinger Bands with highest/lowest price analysis
Smoothing options for cleaner signal generation
Fully customizable colors and display options
How to Use:
Floor Zones (Blue): Potential support areas where long positions may be considered
Roof Zones (Pink): Potential resistance areas where short positions may be considered
Signal Crosses: Visual markers when price interacts with key levels
Signal Table: Track recent signal prices for analysis
Settings:
Length: Period for calculations (default: 200)
Smooth: Smoothing factor for cleaner signals
Zone Width: Adjust the thickness of support/resistance zones
Signal Frequency: Control signal display frequency
Visual Options: Customize colors and table position
Alerts Available:
Long signal alerts when price touches discount zones
Short signal alerts when price reaches premium zones
Educational Purpose: This indicator is designed to help traders identify potential support and resistance areas. Always combine with proper risk management and additional analysis.
This description focuses on the technical aspects and educational value while avoiding any language that could be interpreted as financial advice or guaranteed profits.

Intraday BUY/SELL & AUTO SL (5-min timeframe only) by chaitu50c)Intraday BUY/SELL & AUTO SL (5-min timeframe only) by chaitu50c
This indicator provides intraday traders with BUY/SELL reversal signals and automated SL (Stoploss) tracking, based on a 3-candle reversal block logic — designed to work exclusively on the 5-min timeframe.
Key Features:
• 3-Candle Reversal Logic — Signals are generated when a defined 3-candle reversal pattern is detected (body-close breakout).
• Current Session Only — All signals and SL lines are valid only for the current session and automatically reset at session start.
• BUY/SELL Signal Labels — Visual ▲ and ▼ labels mark valid reversal signals on the chart.
• Dynamic Auto SL Lines — Plots dashed SL lines based on the reversal block's low/high.
• SL HIT Tracking — If SL is broken, the line stops extending and a ‘SL HIT’ label is displayed at the midpoint of the SL line.
• Adjustable Visual Settings — Customize signal label size, SL line width, colors, and more.
• Clean & Lightweight — Optimized for intraday use without cluttering the chart.
How to Use:
You can trade this indicator in two ways:
1. Direct Signal Entry — Take a BUY or SELL trade when a valid ▲/▼ reversal signal forms.
2. SL HIT Re-entry — If an existing SL line is broken and ‘SL HIT’ appears, you can optionally take an opposite side trade in the direction of the SL HIT.
Example:
A BUY signal is generated and an SL line is plotted below.
If price breaks the SL (SL HIT appears), you may consider entering a SELL trade at that point — as it indicates weakness.
Important Notes:
• Works only on 5-min timeframe — Set your chart to 5-min for correct behavior.
• Designed for intraday trading — all signals and SL levels reset at session start.
• Does not carry signals between sessions.
• SL lines and HIT labels provide a clear and simple visual aid for trade management.
---

Volatility-Adjusted Momentum Score (VAMS) [QuantAlgo]🟢 Overview
The Volatility-Adjusted Momentum Score (VAMS) measures price momentum relative to current volatility conditions, creating a normalized indicator that identifies significant directional moves while filtering out market noise. It divides annualized momentum by annualized volatility to produce scores that remain comparable across different market environments and asset classes.
The indicator displays a smoothed VAMS Z-Score line with adaptive standard deviation bands and an information table showing real-time metrics. This dual-purpose design enables traders and investors to identify strong trend continuation signals when momentum persistently exceeds normal levels, while also spotting potential mean reversion opportunities when readings reach statistical extremes.
🟢 How It Works
The indicator calculates annualized momentum using a simple moving average of logarithmic returns over a specified period, then measures annualized volatility through the standard deviation of those same returns over a longer timeframe. The raw VAMS score divides momentum by volatility, creating a risk-adjusted measure where high volatility reduces scores and low volatility amplifies them.
This raw VAMS value undergoes Z-Score normalization using rolling statistical parameters, converting absolute readings into standardized deviations that show how current conditions compare to recent history. The normalized Z-Score receives exponential moving average smoothing to create the final VAMS line, reducing false signals while preserving sensitivity to meaningful momentum changes.
The visualization includes dynamically calculated standard deviation bands that adjust to recent VAMS behavior, creating statistical reference zones. The information table provides real-time numerical values for VAMS Z-Score, underlying momentum percentages, and current volatility readings with trend indicators.
🟢 How to Use
1. VAMS Z-Score Bands and Signal Interpretation
Above Mean Line: Momentum exceeds historical averages adjusted for volatility, indicating bullish conditions suitable for trend following
Below Mean Line: Momentum falls below statistical norms, suggesting bearish conditions or downward pressure
Mean Line Crossovers: Primary transition signals between bullish and bearish momentum regimes
1 Standard Deviation Breaks: Strong momentum conditions indicating statistically significant directional moves worth following
2 Standard Deviation Extremes: Rare momentum readings that often signal either powerful breakouts or exhaustion points
2. Information Table and Market Context
Z-Score Values: Current VAMS reading displayed in standard deviations (σ), showing how far momentum deviates from its statistical norm
Momentum Percentage: Underlying annualized momentum displayed as percentage return, quantifying the directional strength
Volatility Context: Current annualized volatility levels help interpret whether VAMS readings occur in high or low volatility environments
Trend Indicators: Directional arrows and change values provide immediate feedback on momentum shifts and market transitions
3. Strategy Applications and Alert System
Trend Following: Use sustained readings beyond the mean line and 1σ band penetrations for directional trades, especially when VAMS maintains position in upper or lower statistical zones
Mean Reversion: Focus on 2σ extreme readings for contrarian opportunities, particularly effective in sideways markets where momentum tends to revert to statistical norms
Alert Notifications: Built-in alerts for mean crossovers (regime changes), 1σ breaks (strong signals), and 2σ touches (extreme conditions) help monitor multiple instruments for both continuation and reversal setups

Adaptive Signal Oscillator (ASO)📘 Adaptive Signal Oscillator (ASO)
A fully dynamic, self-calibrating oscillator that adapts to any asset or timeframe by optimizing for real-time signal stability and volatility structure — without relying on static parameters or hardcoded thresholds.
🔍 Overview
The Adaptive Signal Oscillator (ASO) is a next-generation technical analysis tool designed to provide context-aware long/short signals across crypto, equities, or forex markets. Unlike traditional oscillators (RSI, Stochastics, MACD), ASO requires no manual tuning of lookback periods or overbought/oversold zones — it self-optimizes based on current market behavior.
🧠 How It Works
✅ 1. Dynamic Lookback Optimization
ASO evaluates a range of lookback lengths between user-defined minLen and maxLen. For each length, it calculates the standard deviation of returns and finds the one with the least volatility change (i.e., the most stable structure). This length is dynamically assigned as bestLen, recalculated on every bar.
✅ 2. Multi-Layer Signal Composition
Four independent signal layers are computed using bestLen:
RSI Layer: Measures relative price strength via a custom dynamic RSI.
Z-Score Layer: Standardized deviation of price from its mean.
Volatility Layer: Standard deviation of log or percent returns.
Price Position Layer: Current price percentile within the lookback window.
Each of these layers is transformed into a percentile score scaled to the range .
✅ 3. Volatility-Based Weighting
The standard deviation (volatility) of each signal layer is computed. Less volatile layers are weighted more heavily, ensuring the final composite signal prioritizes stable, consistent inputs.
Weights are normalized and combined to form a composite score, representing a dynamically blended, noise-weighted signal across the four layers.
✅ 4. Optional Adaptive Smoothing
A boolean toggle lets users apply smoothing to the final score. The smoothing window scales proportionally to bestLen, preserving adaptiveness even during trend transitions.
✅ 5. Percentile-Based Thresholding
Rather than using arbitrary fixed thresholds, ASO converts the composite score into a ranked percentile. Long/short signals are then generated based on user-defined percentile bands, adapting naturally to each asset’s behavior.
📈 Interpreting ASO
Score > Threshold → Strong long signal (highlighted in aqua).
Score < Threshold → Strong short signal (highlighted in fuchsia).
Crossing h_thresh (e.g., 0) → Neutral-to-bias change; useful for early trend cues.
The background and label update in real time to reflect the current regime and bestLen.
⚙️ Inputs
minLen, maxLen, step: Define the search range for optimal lookback length.
retMethod: Choose between log or percent return calculations.
threshHigh, threshLow: Define signal zones using percentiles.
smooth: Enable dynamic score smoothing.
h_thresh: Midline crossover zone for directional context.
⚠️ Disclaimer
This tool is designed for exploratory and educational purposes only. It does not offer financial advice or trading recommendations. Past performance is not indicative of future results.
Always consult a licensed financial advisor before making investment decisions.
4-EMA Signals + MTF Analysis4-EMA Signals + MTF Analysis Indicator: User Guide
This indicator is designed for active traders; from scalpers / intra-day traders to swing-traders who simply want an easy to understand, simple, but yet comprehensive and easy-to-understand indicator with a quick overview of initial market momentum and overall market direction to assist the trader in their initial trading.
The main feature of this indicator is that It overlays four exponential moving averages (EMAs), and provides a dashboard of real-time trend signals for both buy and sell (long/short) scenarios.
Settings Overview
MA Period Setup
Custom: Set your own EMA periods.
Conservative, Aggressive, Fibonacci: Quickly apply preset EMA period combinations for different trading styles.
EMA Periods (Custom Setup)
Fast EMA: Shortest EMA, reacts quickly to price (default 7).
Medium-Short EMA: Intermediate speed (default 25).
Medium-Long EMA: Slower, filters out more noise (default 70).
Slow EMA: Longest-term trend (default 200).
(These settings can be adjusted to suit your individual needs)
Main Indicator Features
Four EMAs : Plotted in distinct colors (green, yellow, orange, red) for quick trend recognition - this can be altered in colour to your personal preferences.
Buy/Sell Signals : Triangles appear below/above bars when EMA crossovers occur, optionally filtered by volume - the volume filter when applied greatly reduces the influx of signals, only giving high-quality signals!
Trading Sessions + Backgrounds : A trading session feature has been added: (London, New York, Asia, Sydney) with the choice of a background to indicate each global trading session.
Volume Overlay : Volume bars and a blue volume moving average line for context.
Dashboard Table (Top Right):
Market Direction: Shows the overall EMA alignment (bullish, bearish, weak, consolidating).
The initial trend on the 5m, 15m, 1H, and 4H time-frame to give a quick snapshot of overall trend direction.
How to Use
Trend Identification :
-- Use the EMA alignment and dashboard table to quickly see if the market is bullish, bearish, or consolidating.
EMA Set-up
-- Adjust the EMA settings to your specific requirements, the signals will alter depending on the volatility of the instrument your trading.
Signal Confirmation :
-- ''Buy'' signals simply appear when the faster EMAs cross above slower EMAs in and ''Sell'' signals simply appear when they cross below.
Volume Context :
--Use the volume moving average and the optional volume filter to avoid signals during low-activity periods.
No Repainting :
-- All signals and dashboard readings are calculated using only confirmed, closed bars. What you see in real time is exactly what will appear in your back-test — no repainting or look-ahead bias.
Alerts / Notifications
Now for the fun part:
1. Enable Buy/Sell Signal Alerts: Get notifications when buy or sell signals occur.
2. For Alerts to function correctly, set the ''condition'' to the indicator itself.
3. Select ''EMA Bearish Cross'' or ''EMA Bullish Cross'' depending whether you want alerts for either buy/sell signals - Or one can simply set alerts for both scenarios.
4. For ''Interval'' set to ''Same as chart'' - So, the time-frame which you'd like to trade on.
5. For ''Trigger'' set to ''Once Per Bar Close''.
6. Save.
7. Wait for a signal to occur!
NOTE: Before placing a trade, it's often best to also assess the market conditions at that time also - and not rely solely on the signals, the signals are to assist, and it's often occurred a signal has shown, but a pull-back occurs, and a FVG in discount holds -- it's this FVG holding, accompanied by volume, that's the real entry, possibly.
Tip: For the cleanest results, use the indicator during the most active sessions and always check multi-time-frame trend alignment before entering trades. Good Luck! :)

Adaptive MACD Deluxe [AlgoAlpha]OVERVIEW
This script is an advanced rework of the classic MACD indicator, designed to be more adaptive, visually informative, and customizable. It enhances the original MACD formula using a dynamic feedback loop and a correlation-based weighting system that adjusts in real-time based on how deterministic recent price action is. The signal line is flexible, offering several smoothing types including Heiken Ashi, while the histogram is color-coded with gradients to help users visually identify momentum shifts. It also includes optional normalization by volatility, allowing MACD values to be interpreted as relative percentage moves, making the indicator more consistent across different assets and timeframes.
CONCEPTS
This version of MACD introduces a deterministic weight based on R-squared correlation with time, which modulates how fast or slow the MACD adapts to price changes. Higher correlation means smoother, slower MACD responses, and low correlation leads to quicker reaction. The momentum calculation blends traditional EMA math with feedback and damping components to create a smoother, less noisy series. Heiken Ashi is optionally used for signal smoothing to better visualize short-term trend bias. When normalization is enabled, the MACD is scaled by an EMA of the high-low range, converting it into a bounded, volatility-relative indicator. This makes extreme readings more meaningful across markets.
FEATURES
The script offers six distinct options for signal line smoothing: EMA, SMA, SMMA (RMA), WMA, VWMA, and a custom Heiken Ashi mode based on the MACD series. Each option provides a different response speed and smoothing behavior, allowing traders to match the indicator’s behavior to their strategy—whether it's faster reaction or reduced noise.
Normalization is another key feature. When enabled, MACD values are scaled by a volatility proxy, converting the indicator into a relative percentage. This helps standardize the MACD across different assets and timeframes, making overbought and oversold readings more consistent and easier to interpret.
Threshold zones can be customized using upper and lower boundaries, with inner zones for early warnings. These zones are highlighted on the chart with subtle background fills and directional arrows when MACD enters or exits key levels. This makes it easier to spot strong or weak reversals at a glance.
Lastly, the script includes multiple built-in alerts. Users can set alerts for MACD crossovers, histogram flips above or below zero, and MACD entries into strong or weak reversal zones. This allows for hands-free monitoring and quick decision-making without staring at the chart.
USAGE
To use this script, choose your preferred signal smoothing type, enable normalization if you want MACD values relative to volatility, and adjust the threshold zones to fit your asset or timeframe. Use the colored histogram to detect changes in momentum strength—brighter colors indicate rising strength, while faded colors imply weakening. Heiken Ashi mode smooths out noise and provides clearer signals, especially useful in choppy conditions. Use alert conditions for crossover and reversal detection, or monitor the arrow markers for entries into potential exhaustion zones. This setup works well for trend following, momentum trading, and reversal spotting across all market types.
