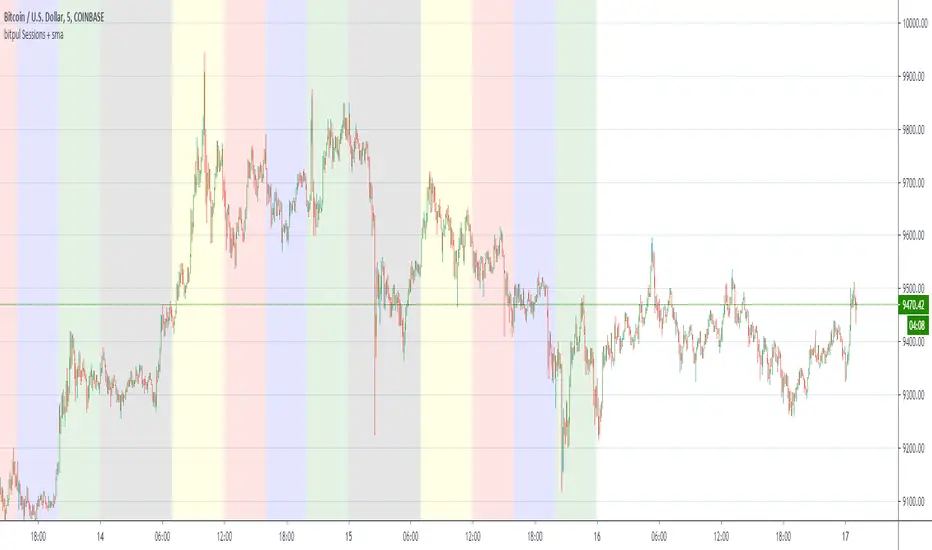
bitpul Sessions + sma [MHMK]Background colors that show open-close of the major market sessions ( Tokyo, London, joint time, New York, free time). I added two sma to get more confirmation for the reversal - You can hide smasPine Script® göstergesimhmk tarafından128
Forex Sessions AustralianThis just shows the market sessions, based on UTC+11 timezonePine Script® göstergesimiRRo500 tarafından61
Sessions w/ Day ToggleSessions script with ability to toggle which days sessions are shown.Pine Script® göstergesiBitcoinJesus-Not-Roger-Ver tarafından11108
Sum and Subtract Hours and Minutes to Sessions SampleThis indicators it's a programming sample of how to sum and subtract hours and minutes to sessions on TradingviewPine Script® göstergesijatubio tarafından1137
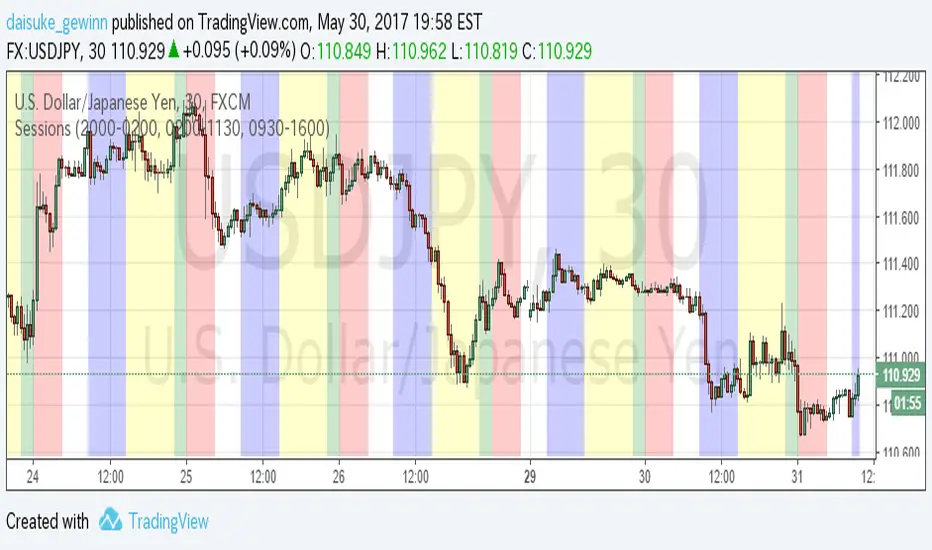
Time Sessions for FXCMThis indicator show Japan, EU and USA sessions for Currency. The default parameters setting for FXCM summer time.(UTC-4) 英語の意味があっているか自信がないため、日本語でも書いておきます。 Trading Viewの通貨チャートで日本時間、EU時間、アメリカ時間を表示するインジケータです。 夏時間の自動判別などは入れていません。デフォルト設定はFXCMのUTC-4に合わせています。 もっと汎用的に作りたかったのですが、すごく面倒な感じになってしまったので、まずシンプルに 作成しました。Pine Script® göstergesidaisuke_gewinn tarafından 1.1 K
Timezone Sessions IndicatorBasic timezones and sessions indicator I have mine collapsed down to a minimum height and it serves only to indicate the time in a more visual way.Pine Script® göstergesiUnknownUnicorn468659 tarafından22941
Forex Trading Sessions with Daylight Savings TimeV1 - Max WarrenDifferent version of the CM one but everything is configurable and easy to manage. Daylight savings may also be toggled, I cannot automatically toggle it yet but hopefully with a pine update I will be able to. It had the four main sessions but version two could possibly have all of them as optional toggles Hope it is usefulPine Script® göstergesiUnknownUnicorn187266 tarafından361
Sessions and High/Low/andrewSessions and High/Low/andrew this indictors covers all the session high and low including frankfurt Pine Script® göstergesiravsl tarafından21
Sessions for UK time (GMT)Sessions for UK time corresponding with IC Markets Time ZonePine Script® göstergesiroryj42 tarafından3354
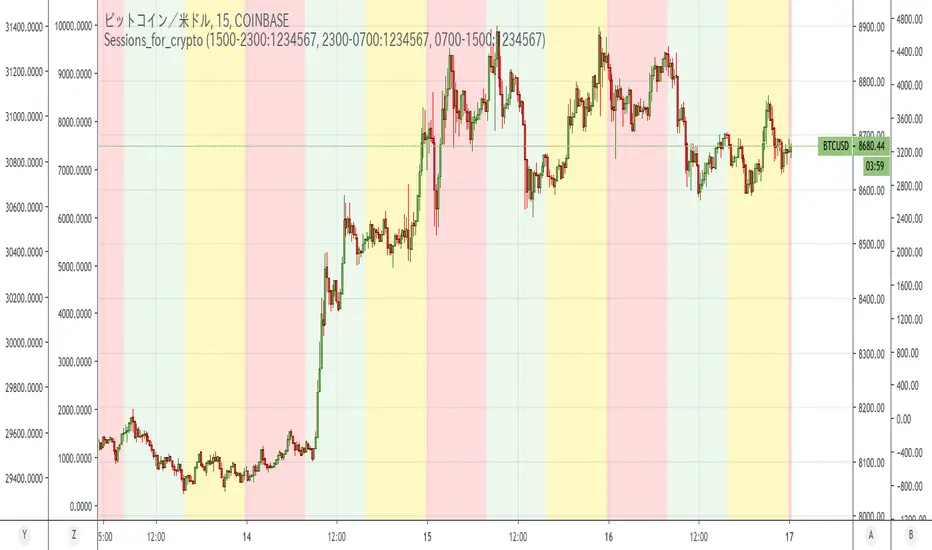
Sessions_for_cryptoCoinCollege's article found that between September 1, 2019 and January 15, 2020, Bitcoin price movements tended to be the most driven by US time. Japan time was the least active. This is similar to forex. In the article, it was defined as follows: NY time: 00:00 to 8:00 (NYK時間) Tokyo time: 8: 00-16: 00 (TKY時間) London time: 16:00 to 00:00 (LDN時間) This indicator colors the time zone according to its definition. Reference: Consideration on the time zone and day of the week when the Bitcoin market is easy to move (September 2019-January 2020) Original title: ビットコイン相場が動き易い時間帯と曜日についての考察(2019年9月〜2020年1月) ======================================================================== コインカレッジさんの記事で「米国時間が一番Bitcoin動くよね」という調査結果が出ていました。 なのですが、時間帯を色分けしてくれる丁度よいインジがなかったので作りました。Pine Script® göstergesimono_i_love tarafından22121
SessionsThis is an advanced level sessions indicator. Not so much an indicator, more of an auto way of plotting levels rather than drawing levels by hand every day. It maps out the London and New York Sessions. It also maps out the closing time and price for future reference. Daily high and low of the past few days are laid out. Each setting can be turned on and off in the settings if you don't require that session info. The time settings are setup according to NY time. It should work straight without any modifications. If you are a price action trader using sessions, this indicator will help you track price movement between sessions and give you possible support and resistance levels based on the previous session close. This indicator does require allot of sessions based trading knowledge but if you understand it, it can be of major use to you. Best used on GBP and USD currency pairs Best timeframes 5Min - 1Hour Best trading style would be day tradingPine Script® göstergesiFnM_Capital tarafından77426
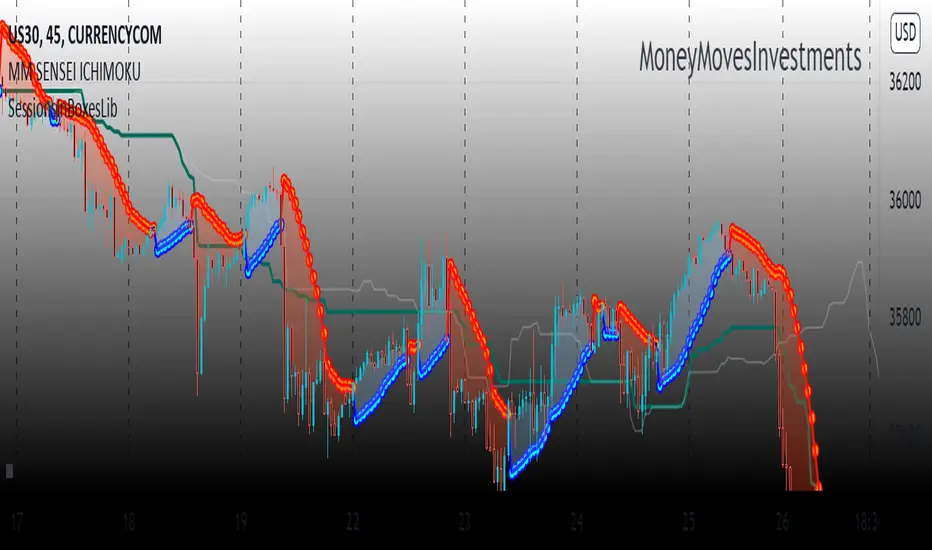
SessionsInBoxesLibLibrary "SessionsInBoxesLib" Provides functions calculating the all-time high/low of values. get_positions() draw() Pine Script® kütüphanesiAvventuriero tarafındanGüncellendi 3326
SessionsBuilt to display useful time sessions, mostly Frankfort and NY. It also display the Asian range and fractal bars. All three sub indicators are toggable separatly. Works best for french trades as it's how it's been coded for. If you want adapt it to your timezone, edit the "Fuseau horaire" option to match yours. I intend to add another big indicator to make a cool package in the future. I will soon try to make everything editable so you can chose what you can display (dont ask for when) This is a full vibe coded script, feel free to fork it and edit it to your convenience as long as you credit me and share me yours so we can see what can be improved. Enjoy :)Pine Script® göstergesiNotche tarafındanGüncellendi 4
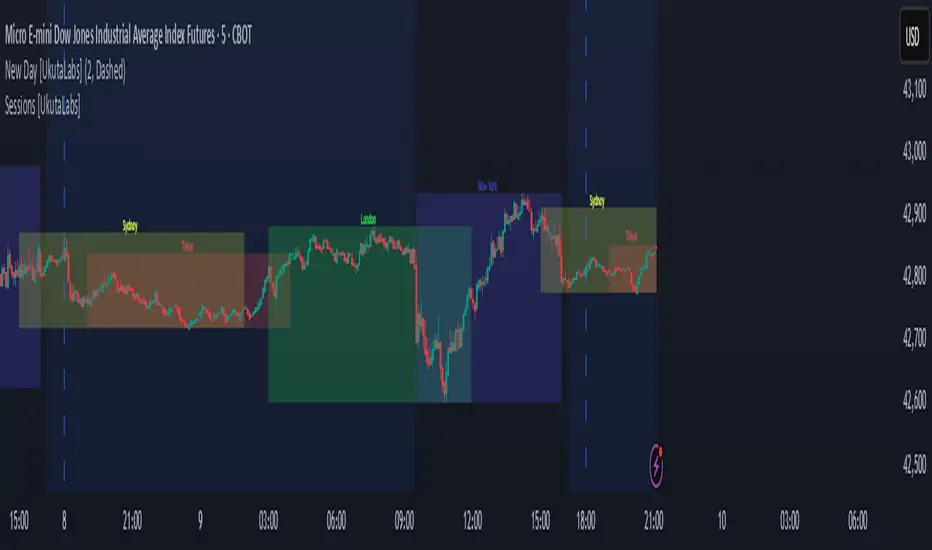
Sessions [UkutaLabs]█ OVERVIEW Sessions is a trading toolkit that displays the different trading sessions on your chart during a trading day. By default, Sessions displays the four standard trading sessions; New York, Tokyo, London, and Sydney. Each of the four sessions can be toggled, and the Sessions indicator is completely customizable, allowing users to define their own sessions to be generated by the script. The aim of this script is to improve the trading experience of users by automatically displaying information about each default or custom session to the user. █ USAGE This script will automatically detect and label different market sessions. By default, the script will identify the four standard trading sessions, but each of these can be toggled off in the settings. However, users are not limited to these four trading sessions and have the ability to define their own sessions to be identified by the script. When a session begins, the script will automatically start outlining the market data of that session, including the high and low of the period that is represented by the session. If the market is within two or more sessions at the same time, then each session will be treated individually and will overlap with each other. The sessions will be identified as a colored box surrounding the market data of the period that it represents, and a label will be displayed above the box to identify the session that it represents. The label, color and period of each session is completely customizable. The user can also adjust all sessions at once to account for timezones in the settings. █ SETTINGS Session 1 • Session 1: Determines whether or not this session will be drawn by the script. • A string field to determine the name of the session that will be displayed above the session range. • Two time fields representing the start and finish of the session. • A color field to determine the color of the range and label. Session 2 • Session 2: Determines whether or not this session will be drawn by the script. • A string field to determine the name of the session that will be displayed above the session range. • Two time fields representing the start and finish of the session. • A color field to determine the color of the range and label. Session 3 • Session 3: Determines whether or not this session will be drawn by the script. • A string field to determine the name of the session that will be displayed above the session range. • Two time fields representing the start and finish of the session. • A color field to determine the color of the range and label. Session 4 • Session 4: Determines whether or not this session will be drawn by the script. • A string field to determine the name of the session that will be displayed above the session range. • Two time fields representing the start and finish of the session. • A color field to determine the color of the range and label. Time Zones • UTC +/-: Determines the offset of each session. Enter - before the number to represent a negative offset. Pine Script® göstergesiUkutaLabs tarafındanGüncellendi 1169
Sessions Highs/LowsThis indicator plots the High and Low of the three main trading sessions: Asia (20:00–03:00) – green lines London (03:00–08:00) – blue lines New York (08:00–13:00) – red lines Features: Levels update in real time during each session. When a new session starts, the previous lines are deleted – only the latest active sessions remain visible. Default session times are set to Asia (20:00–03:00), London (03:00–08:00), and New York (08:00–13:00), but you can adjust them to your own custom hours in the settings. Colors can also be customized. Use cases: Quickly visualize session ranges. Track session highs/lows for breakouts, fakeouts, and reactions around liquidity zones. Pine Script® göstergesikondrix15 tarafından84
SessionsKZ by RocaKillzone Sessions By Roca Daily Sessions Asia, London, NY. Also NYMOPine Script® göstergesiRocaBlanca tarafından11
Sessions [Plug&Play]This indicator automatically highlights the three major FX trading sessions—Asia, London, and New York—on your chart and, at the close of each session, draws right-extended horizontal rays at that session’s high and low. It’s designed to help you visually identify when price is trading within each session’s range and to quickly see where the highest and lowest prices occurred before the next major session begins. Key Features: Session Boxes Draws a semi-transparent box around each session’s timeframe (Asia, London, New York) based on your local UTC offset. Each box dynamically expands in real time: as new candles form during the session, the box’s top and bottom edges update to match the highest high and lowest low seen so far in that session. When the session ends, the box remains on your chart, anchored to the exact candles that formed its boundaries. High/Low Rays As soon as a session closes (e.g., London session ends at 17:00 UTC+0 by default), two horizontal rays are drawn at that session’s final high and low. These rays are “pinned” to the exact candles where the high/low occurred, so they stay in place when you scroll or zoom. Each ray extends indefinitely to the right, providing a clear reference of the key supply/demand levels created during that session. Session Labels Optionally places a small “London,” “New York,” or “Asia” label at the top edge of each completed session’s box. Labels are horizontally centered within the session’s box and use a contrasting, easy-to-read font color. Customizable Appearance Show/Hide Each Session: Toggle display of London, New York, and Asia sessions separately. Time Ranges: By default, London is 08:00–17:00 (UTC), New York is 13:00–22:00 (UTC), and Asia is 00:00–07:00 (UTC). You can override each session’s start/end times using the “Time Range” picker. Color & Opacity: Assign custom colors to each session. Choose a global “Dark,” “Medium,” or “Light” opacity preset to adjust box fill transparency and border shading. Show/Hide Labels & Outlines: Turn the text labels and the box borders on or off independently. UTC Offset Support If your local broker feed or price data is not in UTC, simply adjust the “UTC Offset (+/–)” input. The indicator will recalculate session start/end times relative to your chosen offset. How to Use: Add the Indicator: Open TradingView’s Pine Editor, paste in this script, and click “Add to Chart.” By default, you’ll see three translucent boxes appear once each session begins (Asia, London, New York). Watch in Real Time: As soon as a session starts, its box will appear anchored to the first candle. The top and bottom of the box expand if new extremes occur. When the session closes, the final box remains visible and two horizontal rays mark that session’s high and low. Analyze Key Levels: Use the high- and low-level rays to gauge session liquidity zones—areas where stop orders, breakouts, or reversals often occur. For example, if London’s high is significantly above current price, it may act as resistance in the New York session. Customize to Your Needs: Toggle specific sessions on/off (e.g., if you only care about London and New York). Change each session’s color to match your chart theme. Adjust the “UTC Offset” so sessions align with your local time. Disable labels or box borders if you prefer a cleaner look. Inputs Overview: Show London/New York/Asia Session (bool): Show or hide each session’s box and its high/low rays. Time Range (session): Defines the start/end of each session in “HHMM–HHMM” (24h) format. Colour (color): Custom color for each session’s box fill, border, and high/low rays. Show Session Labels (bool): Toggle the “London,” “New York,” “Asia” text that appears at the top of each completed box. Show Range Outline (bool): Toggle the box border (if off, only a translucent fill is drawn). Opacity Preset (Dark/Medium/Light): Controls transparency of box fill and border. UTC Offset (+/–) (int): Adjusts session times for different time zones (e.g., +1 for UTC+1). Why It’s Useful: Quickly Identify Session Activity: Visually distinguish when each major trading session is active, then compare price action across sessions. Pinpoint High/Low Liquidity Levels: Drawn rays highlight where the market hit its extremes—critical zones for stop orders or breakout entries. Multi-Timeframe Context: By seeing historical session boxes and rays, you can locate recurring supply/demand areas, overlap zones, or session re-tests. Fully Automated Workflow: Once added to your chart, the script does all the work of tracking session boundaries and drawing high/low lines—no manual box or line drawing necessary. Example Use Cases: London Breakout Traders: See where London’s high/low formed, then wait for price to revisit those levels during the New York session. Range Breakout Strategies: If price consolidates inside the London box, use the boxed extremes as immediate targets for breakout entries. Intraday Liquidity Swings: During quieter hours, watch Asia’s high/low to identify potential support/resistance before London’s opening. Overlap Zones: Compare London’s range with Asia’s range to find areas of confluence—high-probability reversal or continuation zones.Pine Script® göstergesiTBWS_Algo tarafındanGüncellendi 79
Sessions [LuxAlgo & TrendRiderIO]Visualize and track trading sessions with customizable ranges, VWAP bands, and high/low levels. Enhanced version of LuxAlgo's Sessions indicator. Track up to 3 customizable trading sessions (NY, London, Tokyo) with session range boxes, session-specific anchored VWAP with standard deviation bands, and high/low extension lines for the last 3 completed sessions. Includes peak hours visualization, session overlap highlighting, and breach alerts with direction indication. Perfect for identifying key support/resistance levels, analyzing session strength, finding entry/exit points, and breakout trading. License: CC BY-NC-SA 4.0 | Based on work by @LuxAlgo, enhanced by TrendRiderIO.Pine Script® göstergesiTrendRiderIO tarafındanGüncellendi 1120
Sessions By petranThis indicator highlights the key trading sessions on the chart: Asian, Frankfurt, London, and New York. It helps traders visually track when each session begins and ends, making it easier to analyze price action, volume, and volatility during specific times of the day. Key features: Customizable session start and end times Up to 4 major sessions highlighted Best used on intraday timeframes (1-minute to 1-hour) Clean, minimal design with adjustable colors and transparency No repainting – reliable for both live trading and backtesting Ideal for intraday traders and anyone who wants to better understand market dynamics during different trading sessions.Pine Script® göstergesipetran001 tarafından71
Sessions 13-Zones ValentijnJelteA simple indicator to display multiple sessions within sessions. For example, you can divide the New York session into different time slots of 3 hours, 1 hour, and 30 minutes, or whatever you need for your analysis.Pine Script® göstergesiValentijnJelte tarafından14
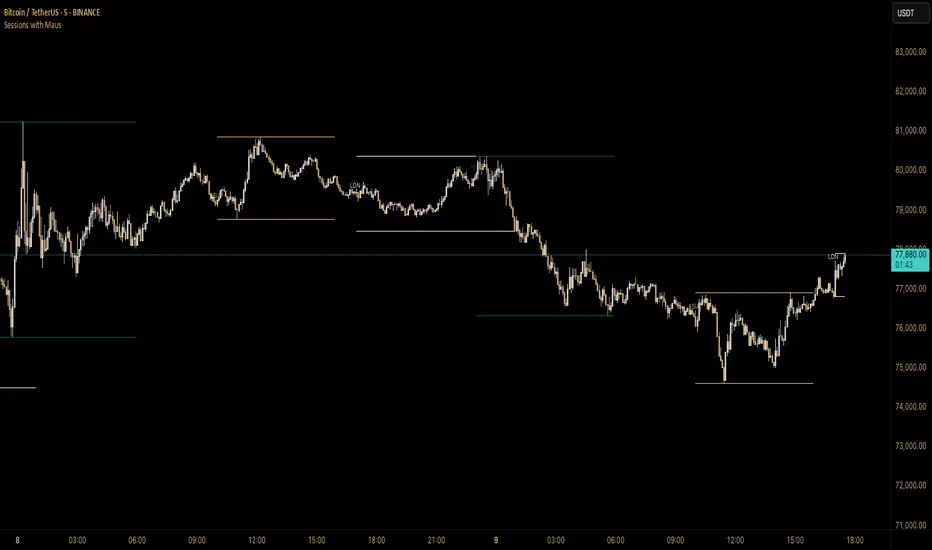
Sessions with Mausa session high/low tracker that draws flat, horizontal lines for Asia, London, and New York trading sessions. It updates those levels in real time during each session, locks them in once the session ends, and keeps them on the chart for context. At a glance, you always know: Where each session’s highs and lows were set Which session produced them (ASIA, LDN, NY labels float cleanly above the highs) When price is approaching or reacting to prior session levels 🔹 Use Cases: • Key Levels – See where Asia, London, or NY set boundaries, and watch how price respects or rejects them • Breakout Zones – Monitor when price breaks above/below session highs/lows • Session Structure – Know instantly if a move happened during London or NY without squinting at the clock • Backtesting – Keep historic session levels on the chart for reference — nothing gets deleted • Confluence – Align these levels with support/resistance, fibs, or liquidity zones Simple, visual, no distractions — just session structure at a glance.Pine Script® göstergesiMausIncognito tarafından16
Sessions [ARCHI]Trading Session Highlighter Overview Sessions highlights the four major forex trading sessions directly on your chart with colored boxes: **Sydney**, **Asia (Tokyo)**, **London**, and **New York**. Instantly see which session is active, where the high/low of each session was, and how sessions overlap. 🔑 Key Features 📦 **Session Boxes** — Each session is drawn as a transparent box spanning the session's high-to-low range. The box updates in real time as new highs and lows are printed. 🏷️ **Centered Labels** — Session names are displayed at the top-center of each box for quick identification. 🌍 **4 Major Sessions** — Sydney (Yellow), Asia/Tokyo (Blue), London (Green), New York (Red). All times are based on UTC. ☀️ **DST / Summer Mode** — One-click toggle to adjust session times for Daylight Saving Time. When enabled, Sydney, London and New York sessions shift by 1 hour. Asia (Tokyo) is unaffected as Japan does not observe DST. 🎨 **Fully Customizable Colors** — Adjust box background and border colors independently for each session. 📈 How to Use Session Context - Know **which session you're trading in** — different sessions have different volatility and liquidity profiles. - **Asia** tends to range, **London** tends to trend, **New York** brings the most volatility. Session High/Low as Support & Resistance - The **high and low of each session** often act as intraday support and resistance levels. - A break of the **Asia session high/low** during London open is a classic setup. Overlap Zones - The **London–New York overlap** (13:00–16:30 UTC) is the highest volume period in forex. - Look for the biggest moves and best setups during overlaps. Kill Zones - Use session boxes to identify **kill zones** — the first 1–2 hours of London and New York where institutional order flow is heaviest. ## ⚙️ Settings | Parameter | Default | Description | |-----------|---------|-------------| | Summer Mode (DST) | Off | Shifts session times by -1 hour for DST | | Sydney Box | Yellow (90% transparent) | Sydney session background color | | Sydney Border | Yellow (60% transparent) | Sydney session border color | | Asia Box | Blue (90% transparent) | Asia session background color | | Asia Border | Blue (60% transparent) | Asia session border color | | London Box | Green (90% transparent) | London session background color | | London Border | Green (60% transparent) | London session border color | | NY Box | Red (90% transparent) | NY session background color | | NY Border | Red (60% transparent) | NY session border color | 🕐 Default Session Times (UTC, Winter) | Session | Start | Duration | End | |---------|-------|----------|-----| | Sydney | 23:00 | 1h | 00:00 | | Asia (Tokyo) | 00:00 | 9h | 09:00 | | London | 08:00 | 8.5h | 16:30 | | New York | 13:00 | 9h | 22:00 | 💡 Tips 1. Works best on **M5 – H1** timeframes for clear intraday session visualization. 2. On **higher timeframes** (H4+), boxes may overlap significantly — consider using on intraday charts only. 3. Combine with VWAP, volume profile, or order flow tools for confluence-based entries at session boundaries. 4. The **London open** and **New York open** are statistically the best times for breakout trades.Pine Script® göstergesitamerlanmma94 tarafından6