VWAP Wave System ToolkitGENERAL OVERVIEW:
The VWAP Wave System Toolkit is an all-in-one trading indicator based on rules from Auction Market Theory. The indicator is built around Volume-Weighted Average Prices (VWAP), Initial Balance (IB) levels, session/composite volume profiles, low-volume zones, optional candle coloring, trade checklists, dashboard readings, and a watermark.
This indicator was developed by Flux Charts in collaboration with Chris Drysdale (Trader Drysdale), author of the best-selling book VWAP Wave System.
What’s the purpose of this indicator?
The VWAP Wave System Toolkit helps traders see where market value is forming, shifting, or being rejected across different timeframes. It’s built on the ideas of Auction Market Theory, which views the market as a continuous auction between buyers and sellers searching for fair value. The indicator combines VWAPs, Initial Balance levels, and volume profiles into one system that shows how price interacts with value throughout the day, week, and month. By combining short-term and higher-timeframe data, it helps traders understand when the market is balanced and when it’s starting to discover new price areas.
What’s the theory behind this indicator?
This indicator is built on Auction Market Theory, introduced by J. Peter Steidlmayer. The theory says that markets operate as continuous auctions, constantly seeking a fair price where buyers and sellers agree on value. When price stays within a narrow range and volume builds up, the market is balanced around a value area. When price moves away from that area, the market enters price discovery, searching for a new zone of balance. VWAPs represent an evolving measure of value, while Volume Profiles and Initial Balance visualize how the auction developed during each session. Low Volume Zones often show where the market moved too quickly to trade efficiently, making them potential areas of interest for future reactions. By combining these elements, the indicator provides a picture of how the market is auctioning and where value may shift next.
VWAP WAVE SYSTEM TOOLKIT FEATURES:
The VWAP Wave System Toolkit indicator includes 7 main features:
Initial Balance Levels
Multi-Timeframe VWAPs
Session Volume Profile
Composite Volume Profile
Low Volume Zones
Checklist
Watermark
Initial Balance Levels:
🔹What is the Initial Balance?
The Initial Balance (IB) is defined by the high and low prices that form within a specific time window. Typically, this time window is the first hour after the regular day trading session starts (09:30 - 10:30 AM EST).
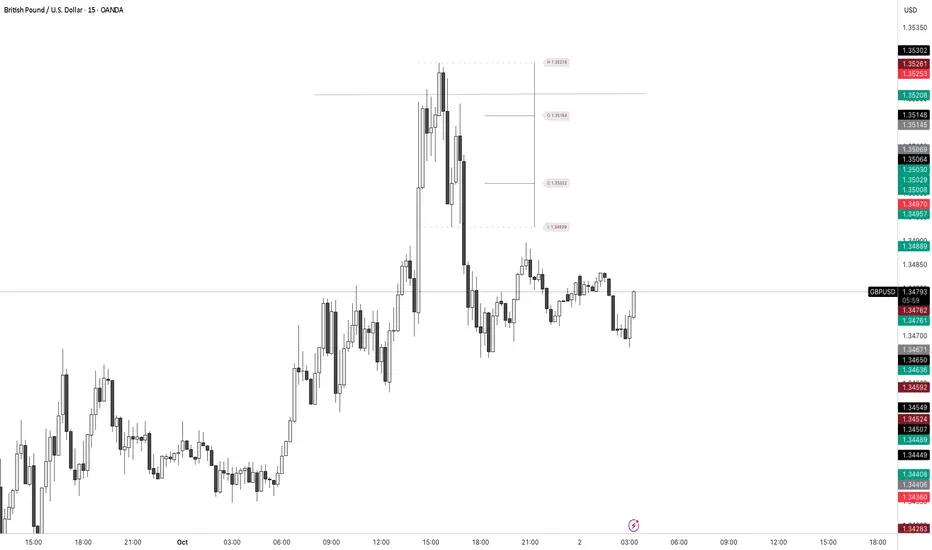
The high and low formed during this window create the foundation for the day’s price structure. From these two points, the indicator automatically calculates several key reference levels that show how far price has extended beyond the initial range or where it may still be balanced. Understanding how these levels are derived and how to interpret them is essential to using the Initial Balance effectively.
🔹How Initial Balance Levels are calculated:
Once the IB window closes, the indicator plots a full set of reference levels derived from the IB range. These levels are:
IB High
IB Low
IB Midpoint
x2 High / x2 Low
x2 Midpoints (x1.5 High/Low)
x3 High / x3 Low
x3 Midpoints (x2.5 High/Low)
🔹IB High & IB Low
The IB High is the highest price reached during the IB session window, and the IB Low is the lowest price reached.
🔹IB Midpoint
The IB Midpoint is the average of the IB High and IB Low.
🔹x2 High & x2 Low
The x2 levels are calculated by projecting one full IB Range above and below the Initial Balance. The IB Range is the distance between the IB High and IB Low.
🔹x2 High Midpoint & x2 Low Midpoint
The x2 High Midpoint (x1.5 High) is the average of the IB High and x2 High. The x2 Low Midpoint (x1.5 Low) is the average of the IB Low and x2 Low.
🔹x3 High & x3 Low
The x3 High/Low levels are calculated by projecting two full IB Range above and below the Initial Balance.
🔹x3 High Midpoint & x3 Low Midpoint
The x3 High Midpoint (x2.5 High) is the average of the x2 High and x3 High. The x3 Low Midpoint (x2.5 Low) is the average of the x2 Low and x3 Low.
🔹Breaks & Retests:
For every Initial Balance level, the indicator automatically tracks when price retests or breaks through them.
A Break occurs when a candle closes above or below an IB level. When this happens, the indicator plots a small blue triangle.
A Retest occurs when price approaches and touches an IB Level, and then reverses in the opposite direction. When this happens, the indicator plots a small green or red triangle.
Green Triangle: Bullish Retest - Price comes down to a level, touches it, and continues up.
Red Triangle: Bearish Retest - Price comes up to a level, touches it, and continues down.
Both breaks and retests are plotted directly on the chart for every toggled IB level. Once detected, they remain fixed and are not repainted.
Other Settings:
🔹Shade IB Range
When enabled, this setting fills the area between the IB High and IB Low (IB Range). The fill helps visually separate the Initial Balance range from the rest of the session, making it easier to identify when price is trading inside or outside of the IB. The color and opacity can also be adjusted through the settings.
🔹Apply One Color
When this setting is enabled, all toggled IB levels use the same color instead of the user’s inputted colors.
🔹Levels Labels
When enabled, text labels that identify each IB level (for example, “IB High,” “x2 High,” or “x2.5 Low”) appear next to each level.
🔹Price Labels
When enabled, the indicator displays the real-time price value of each IB level directly on the chart. These labels update automatically as price changes or when the levels shift due to recalculation from a new session.
🔹Extend Levels Right
When enabled, all toggled IB Levels will be extended infinitely to the right of the chart.
🔹Align Text Right
This setting aligns all level and price labels to the right edge of the plotted line. When disabled, text labels will be aligned to the left edge of each level.
Multi-Timeframe VWAPs:
🔹Why does this indicator include VWAPs?
This indicator includes VWAPs because they show where the most trading activity has occurred within each timeframe, helping identify the market’s fair value area. According to Auction Market Theory, price moves between periods of balance and imbalance as buyers and sellers seek fair value. VWAPs represent those balance points where the majority of trading has taken place. By plotting the Intraday, Weekly, and Monthly VWAPs, the indicator shows how value shifts across different timeframes and whether the market is balanced or moving toward a new area of value.
🔹Intraday VWAP
The Intraday VWAP measures the average traded price for the current trading session and resets each day at market open. It shows where most of the session’s trading has taken place, acting as a real-time fair value line. When price trades near the Intraday VWAP, the market is considered balanced. When price moves far above or below it, the market is exploring new value areas.
🔹Candle Coloring:
The Intraday VWAP candle coloring highlights how far price is trading from the session’s average value using the first and second standard deviation bands as visual reference zones. This feature helps users see whether price is balanced around fair value or expanding into an overextended area.
When candle coloring is enabled, each candle’s color changes based on where it closes relative to the two standard deviation bands surrounding the Intraday VWAP. The first band represents one standard deviation (1.0 STD) and the second represents one and a half standard deviations (1.5 STD).
If a candle closes above the upper 1.5 standard deviation band, it is colored a brighter green, showing strong movement above fair value. Candles closing between the upper 1.0 and 1.5 standard deviation bands are a lighter green, showing moderate strength. If a candle closes below the lower 1.5 standard deviation band, it is colored a brighter red, showing strong movement below fair value. Candles closing between the lower 1.0 and 1.5 standard deviation bands are a lighter red, showing moderate weakness. Candles that close within the ±1.0 standard deviation range remain their normal color, showing that price is balanced near the session’s average.
Both the VWAP line and its bands can be customized in the Intraday VWAP settings. Users can adjust the VWAP line color, band colors, and fill transparency. The candle colors can also be modified. The band sizes (1.0 STD and 1.5 STD by default) can be changed through their input multipliers, allowing users to control the sensitivity of the zones.
Please Note: This candle coloring applies only to the Intraday VWAP
🔹Weekly VWAP
The Weekly VWAP measures the average traded price across the current trading week and resets at the start of each new week. It reflects the fair value area that has developed over multiple trading days, providing a broader view of market balance compared to the Intraday VWAP. When price stays close to the Weekly VWAP, it indicates that the week’s trading activity is balanced. When price consistently trades above or below it, the market is moving away from that balance and forming value in a new area.
Standard Deviation Bands:
The Weekly VWAP includes optional standard deviation bands. Users can toggle 1x and 1.5x STD bands. Users can also adjust the multipliers.
Customization:
All colors for the Weekly VWAP and its standard deviation bands can be changed in the indicator’s settings. Users can adjust the VWAP line color, band colors, and fill transparency.
🔹Monthly VWAP
The Monthly VWAP measures the average traded price for the current month and resets on the first trading day of each new month. It provides the broadest view of value within this indicator, showing where the majority of trading has occurred during the current month. When price remains near the Monthly VWAP, it reflects long-term balance.
Standard Deviation Bands:
The Monthly VWAP includes optional 1x and 1.5x standard deviation bands that can be enabled or disabled. In the settings, users can adjust the standard deviation multipliers.
Customization:
The Monthly VWAP line, band colors, and fill transparency can all be modified in the indicator’s settings.
🔹VWAP Dashboard
The VWAP Dashboard provides a quick real-time overview of how price is positioned relative to the Intraday, Weekly, and Monthly VWAPs. It is displayed directly on the chart and updates automatically with each new candle.
The dashboard is divided into five labeled sections:
Intraday
Weekly
Monthly
Weekly STD
Monthly STD
Intraday, Weekly, and Monthly Sections:
These three sections show whether price is currently trading Above or Below each VWAP.
If price is above a VWAP, that section displays “Bullish”
If price is below a VWAP, that section displays “Bearish”
Weekly STD and Monthly STD:
These sections display whether price is currently inside or outside the standard deviation bands of the Weekly and Monthly VWAPs.
When price is trading within the ±1.0 standard deviation zone, the dashboard output is “Balanced Market”
When price is above the upper standard deviation, price is extending up beyond the week’s or month’s fair value, and the dashboard output is “Bullish Price Discovery”
When price is below the lower standard deviation, price is extending down beyond the week’s or month’s fair value, and the dashboard output is “Bearish Price Discovery”
🔹What is a Balanced Market
A balanced market occurs when price is trading within the ±1.0 standard deviation range of a VWAP. This shows that buyers and sellers are in general agreement on value, and trading activity is taking place around the fair value area. In this state, price tends to rotate around the VWAP rather than trend strongly away from it. Balance reflects stability in the auction process, where neither side is dominant and value is being built at current prices.
🔹What is Bullish Price Discovery
Bullish Price Discovery occurs when price trades above the upper standard deviation of a VWAP. This indicates that buyers are accepting higher prices and that value may be shifting upward. In terms of Auction Market Theory, the market is moving away from balance as it searches for a new fair value area above the prior range.
🔹What is Bearish Price Discovery
Bearish Price Discovery occurs when price trades below the lower standard deviation of a VWAP. This shows that sellers are accepting lower prices and that value may be developing beneath the prior area of balance. The market is moving out of equilibrium as participants test lower prices to find new fair value.
Session Volume Profile:
🔹Why this feature is included:
The Session Volume Profile is included to show where trading activity occurred within each session. It visually represents the volume traded at each price, helping to identify where market participants considered value to be. This ties directly to Auction Market Theory, which views markets as auctions seeking balance between buyers and sellers. The profile highlights those balance areas and shows where volume thins out, helping distinguish between value areas and areas of rejection.
🔹How is the Session Volume Profile calculated and displayed:
At the start of each selected session window, the indicator creates a new volume profile and tracks every bar in that session. For each candle, it saves the high, low, open, close, volume, and time. When the HD (High Definition) setting is enabled, and your chart is between the 1-minute and 30-minute timeframes (recommended), the indicator requests lower-timeframe data and feeds the profile with 1-minute candlesticks for more detail. The running session high and low define the vertical bounds of the volume profile. That span is split into a fixed number of rows. Each row represents a price slice. For every bar and every price row, the indicator checks whether the bar’s high-low range touches that row. If it does, it adds part of the bar’s volume to that row. The allocation uses a step-to-bar-size ratio, so that narrow bars do not overload a tall row and tall bars contribute proportionally across all rows they cross. If the bar closes above its open, that row’s “up” volume bucket is incremented. If it closes below its open, the “down” bucket is incremented. After all bars are processed, the row with the highest total becomes the Point of Control (POC). Starting from that row, the indicator expands upward and downward, adding adjacent rows until the cumulative total reaches your Value Area percentage. The upper boundary is Value Area High (VAH), and the lower boundary is Value Area Low (VAL).
For rendering, each price row becomes a horizontal box drawn from the session start time to a length proportional to that row’s volume versus the session’s maximum row volume. If you choose “Up / Down” volume, the row is split into two adjoining boxes that show the up and down portions. If you choose “Total,” a single box is drawn to the total length. If you choose “Delta,” the length reflects the absolute difference between up and down. The POC is drawn as a line across the row midpoint. VAH and VAL are drawn at the exact prices of the top and bottom value rows. While a session is open the profile keeps updating as new bars form. When the session ends, the script fixes its start and end and stops changing that profile. To avoid any issues with drawing limits, the indicator only renders the two most recent session volume profiles.
Settings:
🔹Enabled
Turns the Session Volume Profile on or off. When disabled, no session profiles, lines, or volume boxes are displayed.
🔹HD
Stands for High Definition. When enabled, the indicator requests data from the 1-minute timeframe to build a smoother, more detailed volume profile. This produces finer row distribution and more accurate POC, VAH, and VAL positioning, especially on higher chart timeframes.
🔹POC Line
Toggles the visibility of the Point of Control line. The POC represents the price level with the highest traded volume in the session. It’s drawn horizontally across the chart at that price, and its color can be customized in settings.
🔹VAH
Controls the display of the Value Area High line. The VAH is the top boundary of the range that contains the specified percentage of total traded volume (default 70%). It marks where volume starts to thin out above fair value. Users can turn it on or off and customize its color.
🔹VAL
Controls the display of the Value Area Low line. The VAL is the lower boundary of the value area and marks where volume thins out below fair value. Its visibility and color can also be customized.
🔹Session
This setting allows users to define the start and end time of the trading session used to calculate the session volume profile. Only bars within this time window are included in the volume profile. When a session ends, the volume profile locks, and a new one begins automatically when the next session begins based on the user’s input.
🔹Volume
Controls how the histogram rows are displayed:
Up/Down: Splits each price row into two parts: one for bullish candles (Up volume) and one for bearish candles (Down volume). This helps visualize buying versus selling pressure at each price.
Total: Combines both Up and Down volume into a single-colored bar for each price level. Since direction isn’t separated, this view focuses purely on where trading activity was concentrated, regardless of which side was in control. A tall bar means strong participation and interest at that price.
Delta: Displays the difference between up and down volume (Up/Down) for each row, highlighting which side controlled that price area.
🔹Value Area Volume
The Value Area Volume setting defines how much of the total session volume is considered the “value area.” By default, it’s 70%, meaning the indicator finds the price range where 70% of all trading took place during that session. This area is where buyers and sellers agreed the most on price, also known as the fair value zone.
If you increase the percentage (for example, to 80%), the value area becomes wider and includes more of the session’s trading range. Lowering it (for example, to 60%) makes it narrower, focusing only on the prices with the heaviest activity.
🔹Row Size
The Row Size controls how detailed the volume profile looks. It decides how many price levels (rows) the profile is divided into. Smaller values make the profile smoother and easier to read but less precise. Larger values add more detail and show exactly where volume clustered, but they can make the profile look denser.
The maximum value is 450 rows, and the minimum value is 5 rows. Higher values (especially above 200) can make the volume profile appear more detailed but may also cause performance issues or partial rendering on TradingView charts due to the platform’s drawing object limits. For most users, values between 50–150 give a good balance between clarity and performance.
25 Rows vs. 200 Rows:
Composite Volume Profile:
The Composite Volume Profile shows how volume is distributed across a larger selected range instead of just one session. It helps traders see where the most trading activity has taken place over multiple days. This gives a picture of long-term balance areas and important price zones that have repeatedly attracted buyers and sellers.
The Composite Profile uses the same base logic and visual settings as the Session Volume Profile, including POC Line, VAH, VAL, Volume Type, Value Area Volume, Row Size, and Colors. Any customization applied to those settings also affects the Composite Profile, ensuring a consistent appearance across both features.
🔹Session Count Setting:
This setting controls how many past sessions are merged into one composite volume profile. For example, if the Session Count is set to 5, and each session represents one trading day, the profile combines data from the last 5 trading days. A “session” refers to the time window defined in the Session Volume Profile settings.
🔹How is the Composite Volume Profile used?
In Auction Market Theory, markets move through phases of balance and imbalance as traders agree on value before moving to explore new ones. The Composite Volume Profile shows where that long-term balance has formed. Large, wide areas on the profile indicate zones where multiple sessions agreed on value. Thin areas show prices that were quickly rejected, where less time and volume were traded. Combining short-term session profiles into a composite helps identify when the market is holding near established value or entering new price discovery, confirming transitions between balance and price discovery.
Low Volume Zones:
🔹What are Low Volume Zones?
Low Volume Zones (LVZs) are price areas where trading activity was minimal compared to surrounding levels. On a volume profile, they appear as thin “valleys” between two high-volume “peaks.” These valleys show where the market moved too quickly for significant two-way trade to occur. In Auction Market Theory, they represent inefficient areas, meaning the market didn’t find fair value, so price either skipped through or rejected those levels.
🔹How are Low Volume Zones found?
The indicator identifies Low Volume Zones (LVZs) directly from Session Volume Profiles (SVPs) by analyzing the shape of its volume distribution. Each SVP is built from a series of horizontal rows, where each row represents the total traded volume within a narrow price range. The longer the row, the higher the trading activity at that price.
The indicator first locates the two largest high-volume peaks on the profile. These peaks represent the strongest areas of market activity. Once these two main peaks are found, the indicator looks on both sides of each peak for the lowest-volume row in the surrounding area. Those small-volume dips define the boundaries of the Low Volume Zones.
Each high-volume peak can therefore generate two LVZs (one above and one below it), resulting in a maximum of four Low Volume Zones per volume profile. If two LVZs overlap or share the same price range, they are automatically merged into a single larger zone, which may reduce the total count to three or fewer.
🔹How are Low Volume Zones used?
Low Volume Zones (LVZs) mark areas where the market previously traded with little participation. In Auction Market Theory, these zones represent inefficient price areas where buyers and sellers failed to agree on value. When price returns to an LVZ, it may act as an area where price tends to react differently due to lower previous trading activity. If the market still sees that area as unfair, price will reject it and reverse quickly. If the market now accepts that price level, volume builds and price moves through it smoothly as the auction seeks new balance. Traders use LVZs to identify where price may react sharply or move quickly through thin areas. When price approaches a zone from above or below, it signals potential rejection or continuation.
🔹LVZ Breaks and Retests
The indicator automatically tracks how price interacts with every detected LVZ.
A Break occurs when price fully moves through the entire LVZ and closes past it. When this happens, the indicator plots a small blue triangle.
A Retest occurs when price touches an LVZ and reverses away, showing rejection. When price comes down to a level, taps it, and continues up, it’s considered a bullish retest, and a small green triangle is plotted. When price comes up to a level, taps it, and continues down, it’s considered a bearish retest, and a small red triangle is plotted.
🔹LVZ Settings
Enabled:
Toggles LVZ detection and visualization on or off.
Realtime:
Allows LVZs to form dynamically as the current session develops, updating live as volume builds or thins out. When disabled, zones only appear once the session closes.
Please note: When this setting is enabled, zones may update or shift while the current session is still forming. Because the Session Volume Profile is continuously recalculating with new data, both the volume distribution and detected zones can change until the session closes.
Row Pivot Length:
Controls how far above and below each price row the indicator looks when identifying the highest and lowest volume points that define each Low Volume Zone. Larger values make the indicator compare a wider range of rows, while smaller values keep the analysis closer to each row’s immediate area.
Last SVPs:
Defines how many recent Session Volume Profiles are used for LVZs. For example, setting it to 3 limits LVZ detection to the last three sessions only.
Retests and Breaks:
Enables or disables the display of the retest and break markers described above.
Checklist:
The Checklist is a manual on-chart dashboard that allows traders to keep track of specific market conditions before entering a trade. Each checklist item can be toggled on or off in the indicator’s settings. When enabled, a checkmark emoji appears next to that item on the dashboard. When disabled, an X emoji appears next to that item.
This feature is designed to help traders visually confirm important steps in their process, such as reviewing trend direction, VWAP alignment, or session context. The checklist can also be repositioned anywhere on the chart using the “Location” setting for better visibility and layout preference.
Watermark:
The Watermark feature displays key chart information directly in the background, including the current ticker symbol, selected timeframe, and date. The watermark’s size, color, and transparency can be adjusted in the settings.
UNIQUENESS:
The VWAP Wave System Toolkit is unique because it brings every part of Auction Market Theory to the chart. It shows how value builds and shifts by combining Initial Balance levels, multi-timeframe VWAPs, and volume profiles. The indicator automatically marks low-volume zones where the market moved too quickly, highlights breaks and retests, and tracks how price interacts with fair value across sessions, weeks, and months. Every feature works together to give a simple view of balance, imbalance, and value development as the auction unfolds.
"session" için komut dosyalarını ara

OHLC Session ProjectorOHLC Session Projector
Clean, session-aware OHLC levels — projected to a right-side rail for instant context.
Define up to four intraday sessions (chart timezone). While a session is live, the indicator draws a right-offset rail with O/H/L/C ticks and tiny labels, keeping price candles uncluttered. When the session closes, values freeze and the entire block (rail + ticks + labels, and optionally the box) is projected to the right by a user-set distance for crystal-clear levels.
Why traders use it
Fast read of intraday structure. See each session’s opening print, the true extremes, and settlement at a glance.
Clarity during the session. Live rail shifts to the right so bars stay clean.
Consistent post-session levels. Projected rails mark where reactions tend to happen next session.
Key features
Sessions: Up to 4 custom time ranges (uses chart timezone).
Right-rail projector:
Vertical rail spanning session H↔L
Ticks: O/C (solid), H/L (dashed)
Labels: O/H/L/C with optional price, offset to the right
Live Clean Mode: Shift the live rail by N bars to the right (configurable).
Session Box (optional): With separate live vs final styling (fade while live, solid when closed).
Projection: After session close, freeze values and project rail + ticks + labels + box to the right by extendBars.
Styling controls: Colors, widths, tick lengths, label offset.
No repainting of closed values: H/L/O/C are finalized at session end. (During the session, H/L/C update in real time—as expected.)
How it works
While in session, the script tracks O/H/L/C, draws a right-offset rail and ticks, and updates labels live.
On session close, values are frozen and the whole rail block is repositioned to the projected location.
Accumulation → Manipulation → Distribution (AMD
The graphic shows a common intraday sequence across sessions:
Accumulation blue : price ranges and builds liquidity.
Manipulation red : a quick sweep/false break as sessions hand off.
Distribution green : the real directional move that follows.
How the OHLC Session Projector helps
Projects each session’s Open/High/Low/Close to a clean right-side rail, so you can see when manipulation sweeps prior O/H/L and where distribution is likely to run.
Freezes levels at session close and carries them forward as targets (retests of Open, runs to High/Low).
“Live Clean” keeps rails offset during the session, letting you track AMD without clutter while price is developing.
Credits & disclaimer
Built for educational purposes. Not financial advice. Trade responsibly.
ZenAlgo - SessionsZenAlgo - Sessions is a robust TradingView indicator designed to analyze and visualize global trading sessions (Asian, European, and US). By combining session-specific price levels, volume and delta tracking, and historical performance metrics, it delivers actionable insights for session-based trading strategies, simplifying decision-making in dynamic markets.
Features
Session Highlighting: Distinguishes trading sessions with customizable colors for easy identification.
Session Levels: Dynamically calculates and projects five key levels (0%, 25%, 50%, 75%, 100%) to identify support and resistance zones.
Volume and Delta Tracking: Tracks session-specific total volume, inflows, outflows, and delta to assess market sentiment.
Interactive Performance Table: Summarizes recent session metrics, including win/loss percentages, volume, and delta, enabling trend analysis.
Historical Analysis: Retains session performance data for up to 100 sessions, providing insights into long-term trends.
Dynamic Range Projection: Extends session levels into subsequent sessions, maintaining market context.
Customizable Time Zones: Adapts session tracking to any trading environment.
Added Value: Why Is This Indicator Original/Why Shall You Pay for This Indicator?
1. Synergy Between Indicators
Session Levels: Highlight key market zones that guide entry/exit points.
Volume and Delta Metrics: Clarify price action at these levels by identifying buyer/seller dominance.
Performance Metrics: Aggregate historical session data, helping traders identify recurring patterns, sentiment shifts, and session-specific tendencies.
Together, these features amplify one another, creating actionable insights that exceed the value of standalone tools.
2. Comparison to Freely Available Indicators
Traditional indicators like Bollinger Bands, RSI, or Moving Averages operate on broad price action trends. ZenAlgo - Sessions focuses on session-specific patterns, volume dynamics, and real-time updates, delivering more context-specific insights.
By consolidating multiple functionalities into one tool, it eliminates the need for multiple separate indicators, streamlining analysis.
3. Why Pay for This Indicator?
Comprehensive Insights: Delivers session-specific metrics unavailable in standalone tools.
Real-Time Updates: Ensures metrics and levels reflect the latest market movements.
Seamless Integration: Combines price action, volume, and historical performance into a single, intuitive interface.
How It Works
1. Session Detection
Defines sessions for Asia, Europe, and the US based on fixed opening and closing times. Time zones ensure compatibility with global markets, excluding weekends and holidays for relevance.
2. Price Levels
Calculates five levels (0%, 25%, 50%, 75%, 100%) based on session high and low, projecting these into subsequent sessions for continued analysis.
3. Volume and Delta Metrics
Tracks session volume, separating inflows and outflows based on price movements.
Calculates delta to gauge net buying/selling activity.
4. Performance Metrics
Tracks win/loss rates and percentage changes across sessions.
Stores session metrics (volume, delta, win/loss) for up to 100 sessions.
5. Dynamic Visualization
Continuously updates session levels and metrics in real time for actionable insights.
Usage Examples
Support/Resistance Levels: Use session levels, especially the 50% midline, as potential pivot points for trades.
Breakout Analysis: Monitor price action beyond session highs or lows to confirm breakouts.
Volume Trends: Compare session volumes to identify high-activity periods.
Delta Shifts: Assess delta changes to determine market sentiment at key levels.
Session Comparison: Identify which session drives significant activity using the performance table.
Multi-Session Strategies: Plan trades based on extended session levels to anticipate reactions at previously tested zones.
Settings
Asia Session Color: Adjust the highlight color for the Asian session.
Europe Session Color: Customize the color for the European session.
US Session Color: Define the color for the US session.
Time Zone: Set the time zone for session tracking.
Line Transparency: Adjust session line opacity.
Number of Sessions for Total Count: Define how many sessions to analyze in the performance table.
Important Notes
This indicator is a technical analysis tool and does not guarantee trading success. Use it alongside other indicators and fundamental analysis for a comprehensive trading strategy.
Combine with Other Tools: Use complementary indicators such as RSI, Bollinger Bands, or ATR to filter out unreliable signals and improve accuracy.
Known Weaknesses and Mitigation Strategies
1. Extreme Volatility
Issue: During sudden, significant price movements (e.g., news-driven events), session levels and delta metrics may become less reliable as the market temporarily disregards historical patterns.
Mitigation: Combine ZenAlgo - Sessions with volatility indicators like ATR (Average True Range) or a news alert system to adjust expectations during these periods.
2. Low Liquidity Periods
Issue: During holidays or outside peak trading hours, session metrics may misrepresent actual market activity due to reduced participant involvement.
Mitigation: Focus on sessions with higher activity (e.g., overlapping US and European sessions) to ensure more accurate insights.
3. Non-Standard Trading Hours
Issue: Market-specific differences, such as extended hours or daylight saving adjustments, can misalign session boundaries.
Mitigation: Verify session times align with your market and adjust settings accordingly.
4. Historical Data Dependencies
Issue: Historical metrics rely on consistent session patterns; deviations (e.g., extended or shortened sessions) can impact trend accuracy.
Mitigation: Regularly review and interpret historical data alongside real-time metrics to ensure alignment.

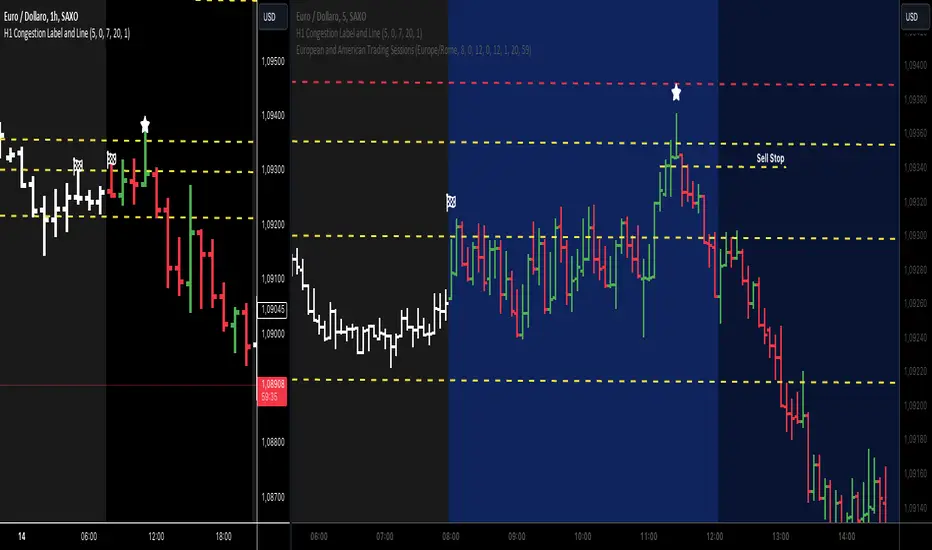
European and American Trading Sessions (Blue)The European and American trading sessions, in particular, are known for their volatility and volume, making them key periods for traders to watch.
This Pine Script indicator, "European and American Trading Sessions," helps traders visually distinguish these sessions directly on their charts by shading the background during active hours. We use this indicator in combination with the one that highlights the nighttime phases in white.
Here's a breakdown of how the indicator works:
Key Features of the Script:
Timezone Configuration:
The script allows users to select a timezone from a predefined list that includes UTC, London, Rome, New York, and Tokyo. This flexibility ensures that the session times are accurately displayed regardless of the server or local time of the user.
European Session Parameters:
Users can set the start and end times for the European session. By default, the session runs from 08:00 to 12:00, but the input options make it customizable down to the minute. The European session is highlighted with a light blue background (36% opacity) to avoid overwhelming the chart while still providing a clear visual cue.
American Session Parameters:
Similar to the European session, the American session can be customized. The default times are set from 12:01 to 20:59. This session is highlighted in a slightly darker blue (80% opacity), providing a distinct visual difference from the European session.
Session Timing Calculation:
The script calculates the start and end times for each session based on the selected timezone. It uses the timestamp() function to account for year, month, day, hour, and minute, ensuring that session timings are accurately applied to each day’s trading activity.
Background Highlighting:
Once the session times are defined, the script checks if the current chart time (time) falls within the European or American trading session. If the condition is true, the corresponding background color is applied, visually highlighting the active session directly on the chart. This feature makes it easy to identify when the European or American markets are in play.
Benefits for Traders:
Clear Session Visibility: The color-coded background makes it effortless for traders to identify when key trading sessions are active without needing to constantly check the clock.
Customizable to Your Needs:
With full control over the start and end times for both sessions, traders can adapt the indicator to fit their specific trading hours or preferences.
Timezone Flexibility:
No matter where you're trading from, the ability to set the timezone ensures that the sessions are displayed correctly according to your local time.
Explanation of the Code:
Timezone Selection:
Allows the user to select a timezone from predefined options such as Europe/Rome, America/New_York, etc. This timezone will be used to calculate session start and end times.
Session Timing Inputs:
The script takes user inputs for the start and end times of the European and American trading sessions. These inputs include the hour and minute for both sessions.
Colors:
The color of the European session is set to a blue shade with 36% opacity.
The American session is also colored blue but with a higher opacity of 80%.
Timestamp Calculation:
The timestamp() function converts the input hours and minutes into a time value, accounting for the selected timezone.
Session Conditions:
The script checks if the current time (time) falls within the European or American session. If true, it applies the respective background color for that session. This approach creates clear visual highlights on the chart, marking the active hours of the European and American trading sessions based on user inputs.
ICT ASIA & DTCC Session Range |MC|This indicator plots the ASIA & DTCC Range on the Chart
(Credits go to the Inner Circle Trader ICT)
💎 Features 💎
💎 Session-based range calculation with timezone-safe session detection
💎 Supported sessions:
🔸 ASIA Session (configurable time window)
🔸 DTCC Session (configurable time window) (default: 8-8:45pm NY EST/EDT Time)
(plots a second DTCC Box at: 2-2:45pm NY EST/EDT Time)
💎 Automatic High / Low range tracking per session
💎 Optional Close-to-Close range calculation (candle body based)
💎 Session range visualization:
🔸 High & Low horizontal levels
🔸 Session box (range area)
💎 Optional ASIA Range standard deviation projections:
🔸 Configurable number of extensions above and below the range
🔸 Optional midlines (0.5 extensions)
💎 Market-adaptive range values:
🔸 Forex → Pips
🔸 Indices / Commodities → Points
🔸 Crypto → Ticks
💎 On-chart range table with session values
💎 Customizable colors, line styles, and visibility options
💎 History control:
🔸 Limit displayed objects to the last X sessions
🔸 Automatic cleanup of old boxes and lines to prevent clutter
💎 Session Times (Default):
🔸 ASIA Session: user-defined (commonly Asian market hours)
🔸 DTCC Session: user-defined (aligned with DTCC delivery window)
🔸 All sessions are calculated using a user-selectable timezone
💎 Technical Notes:
🔸 Objects (boxes and lines) are finalized once per session to ensure stability
🔸 No repainting after session close
🔸 Compatible with intraday timeframes
🔸 Designed to minimize redraw issues during chart scrolling or zooming
💎 Changelog (Initial Release):
🔸 Initial release with ASIA and DTCC session range detection
🔸 Added session boxes, High/Low levels, and projection lines
🔸 Added adaptive range unit calculation (Pips / Points / Ticks)
🔸 Added configurable session history limit
🔸 Improved object lifecycle management for stable chart behavior
🔹 Warning: Do not trade based on this indicator alone. Always use it in combination with other
analysis and risk management techniques.
Happy Trading!

RCV Essentials════════════════════════════════════════════
RCV ESSENTIALS - MULTI-TIMEFRAME & SESSION ANALYSIS TOOL
════════════════════════════════════════════
📊 WHAT THIS INDICATOR DOES
This professional-grade indicator combines two powerful analysis modules:
1. TRADING SESSION TRACKER - Visualizes high/low ranges for major global market sessions (NY Open, London Open, Asian Session, etc.)
2. MULTI-TIMEFRAME CANDLE DISPLAY - Shows up to 8 higher timeframes simultaneously on your chart (15m, 30m, 1H, 4H, 1D, 1W, 1M, 3M)
════════════════════════════════════════════
🎯 KEY FEATURES
════════════════════════════════════════════
TRADING SESSIONS MODULE:
✓ Track up to 6 custom trading sessions simultaneously
✓ Real-time high/low range detection during active sessions
✓ Pre-configured for NYO (7-9am), LNO (2-3am), Asian Session (4:30pm-12am)
✓ 60+ global timezone options
✓ Customizable colors, labels, and transparency
✓ Daily divider lines (optional Sunday skip for traditional markets)
✓ Only displays on ≤30m timeframes for optimal clarity
MULTI-TIMEFRAME CANDLES MODULE:
✓ Display 1-8 higher timeframes with up to 10 candles each
✓ Real-time candle updates (non-repainting)
✓ Fully customizable colors (separate bullish/bearish for body/border/wick)
✓ Adjustable candle width, spacing, and positioning
✓ Smart label system (top/bottom/both, aligned or follow candles)
✓ Automatic timeframe validation (only shows TFs higher than chart)
✓ Memory-optimized with automatic cleanup
════════════════════════════════════════════
🔧 HOW IT WORKS
════════════════════════════════════════════
TECHNICAL IMPLEMENTATION:
Session Tracking Algorithm:
• Detects session start/end using time() function with timezone support
• Continuously monitors and updates high/low during active session
• Finalizes range when session ends using var persistence
• Draws boxes using real-time bar_index positioning
• Maintains session ranges across multiple days for reference
Multi-Timeframe System:
• Uses ta.change(time()) detection to identify new MTF candle formation
• Constructs candles using custom Type definitions (Candle, CandleSet, Config)
• Stores OHLC data in arrays with automatic size management
• Renders using box objects (bodies) and line objects (wicks)
• Updates current candle every tick; historical candles remain static
• Calculates dynamic positioning based on user settings (offset, spacing, width)
Object-Oriented Architecture:
• Custom Type "Candle" - Stores OHLC values, timestamps, visual elements
• Custom Type "CandleSet" - Manages arrays of candles + settings per timeframe
• Custom Type "Config" - Centralizes all display configuration
• Efficient memory management via unshift() for new candles, pop() for old
Performance Optimizations:
• var declarations minimize recalculation overhead
• Conditional execution (sessions only on short timeframes)
• Maximum display limits prevent excessive object creation
• Timeframe validation at barstate.isfirst reduces redundant checks
════════════════════════════════════════════
📈 HOW TO USE
════════════════════════════════════════════
SETUP:
1. Add indicator to chart (works best on 1m-30m timeframes)
2. Open Settings → "Trading Sessions" group
- Enable desired sessions (NYO, LNO, AS, or custom)
- Select your timezone from 60+ options
- Adjust colors and transparency
3. Open Settings → "Multi-TF Candles" group
- Enable timeframes (TF1-TF8)
- Configure each timeframe and display count
- Customize colors and layout
READING THE CHART:
• Session boxes show high/low ranges during active sessions
• MTF candles display to the right of current price
• Labels identify each timeframe (15m, 1H, 4H, etc.)
• Real-time updates on the most recent MTF candle
TRADING APPLICATIONS:
Session Breakout Strategy:
→ Identify session high/low (e.g., Asian session 16:30-00:00)
→ Wait for break above/below range
→ Confirm with higher timeframe candle close
→ Enter in breakout direction, stop at opposite side of range
Multi-Timeframe Confirmation:
→ Spot setup on primary chart (e.g., 5m)
→ Verify 15m, 1H, 4H candles align with trade direction
→ Only take trades where higher TFs confirm
→ Exit when higher TF candles show reversal
Combined Session + MTF:
→ Asian session establishes range overnight
→ London Open breaks Asian high
→ Confirm with bullish 15m + 1H candles
→ Enter long with stop below Asian high
════════════════════════════════════════════
🎨 ORIGINALITY & INNOVATION
════════════════════════════════════════════
What makes this indicator original:
1. INTEGRATED DUAL-MODULE DESIGN
Unlike separate session or MTF indicators, this combines both in a single performance-optimized script, enabling powerful correlation analysis between session behavior and timeframe structure.
2. ADVANCED RENDERING SYSTEM
Uses custom Pine Script v5 Types with dynamic box/line object management instead of basic plot functions. This enables:
• Precise visual control over positioning and spacing
• Real-time updates without repainting
• Efficient memory handling via automatic cleanup
• Support for 8 simultaneous timeframes with independent settings
3. INTELLIGENT SESSION TRACKING
The algorithm continuously recalculates ranges bar-by-bar during active sessions, then preserves the final range. This differs from static zone indicators that simply draw fixed boxes at predefined levels.
4. MODULAR ARCHITECTURE
Custom Type definitions (Candle, CandleSet, Config) create extensible, maintainable code structure while supporting complex multi-timeframe operations with minimal performance impact.
5. PROFESSIONAL FLEXIBILITY
Extensive customization: 6 configurable sessions, 8 timeframe slots, 60+ timezones, granular color/sizing/spacing controls, multiple label positioning modes—adaptable to any market or trading style.
6. SMART VISUAL DESIGN
Automatic timeframe validation, dynamic label alignment options, and intelligent spacing calculations ensure clarity even with multiple timeframes displayed simultaneously.
════════════════════════════════════════════
⚙️ CONFIGURATION OPTIONS
════════════════════════════════════════════
TRADING SESSIONS:
• Session 1-6: On/Off toggles
• Time Ranges: Custom start-end times
• Labels: Custom text for each session
• Colors: Individual color per session
• Timezone: 60+ options (Americas, Europe, Asia, Pacific, Africa)
• Range Transparency: 0-100%
• Outline: Optional border
• Label Display: Show/hide session names
• Daily Divider: Dotted lines at day changes
• Skip Sunday: For traditional markets vs 24/7 crypto
MULTI-TF CANDLES:
• Timeframes 1-8: Enable/disable individually
• Timeframe Selection: Any TF (seconds to months)
• Display Count: 1-10 candles per timeframe
• Bullish Colors: Body/Border/Wick (independent)
• Bearish Colors: Body/Border/Wick (independent)
• Candle Width: 1-10+ bars
• Right Margin: 0-200+ bars from edge
• TF Spacing: Gap between timeframe groups
• Label Color: Any color
• Label Size: Tiny/Small/Normal/Large/Huge
• Label Position: Top/Bottom/Both
• Label Alignment: Follow Candles or Align
════════════════════════════════════════════
📋 TECHNICAL SPECIFICATIONS
════════════════════════════════════════════
• Pine Script Version: v5
• Chart Overlay: True
• Max Boxes: 500
• Max Lines: 500
• Max Labels: 500
• Max Bars Back: 5000
• Update Frequency: Real-time (every tick)
• Timeframe Compatibility: Chart TF must be lower than selected MTFs
• Session Display: Activates only on ≤30 minute timeframes
• Memory Management: Automatic cleanup via array operations

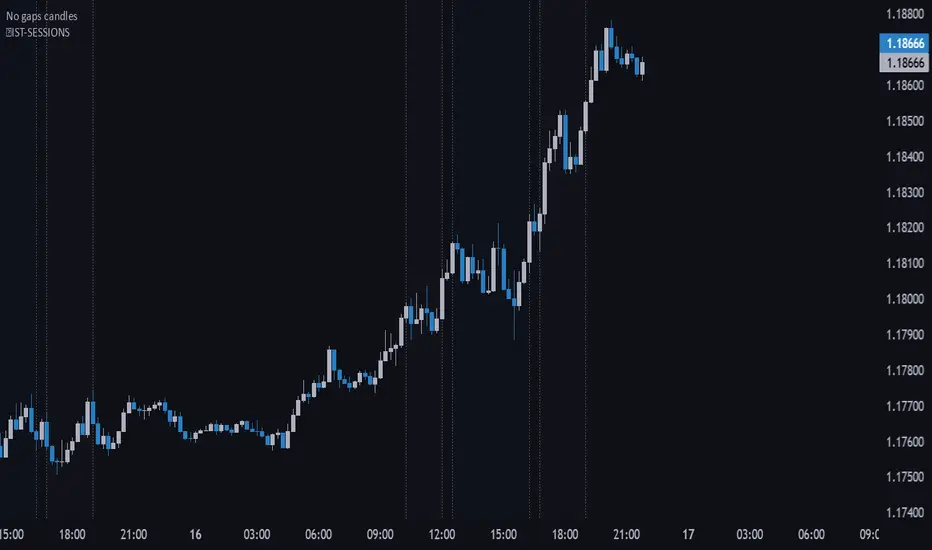
🔵IST-SESSIONS📌 IST-SESSIONS – TradingView Indicator
The IST-SESSIONS indicator clearly marks all major trading sessions throughout the day according to your specified schedule, helping traders visualize market activity and plan intraday strategies. It highlights session times and breaks for optimal clarity:
Morning Session: 10:15 – 12:00
Midday Break: 12:00 – 12:30
Day Session: 12:30 – 16:15
Afternoon Break: 16:15 – 16:45
Evening Session: 16:45 – 19:00
Evening Break: 19:00 – 20:00
Night Session: 20:00 – 23:00
✔️ Visualizes multiple trading sessions and breaks
✔️ Helps traders track market activity during specific hours
✔️ Perfect for intraday strategies and session-based analysis
✔️ Makes planning entries and exits easier across different market phases
How to use:
Apply the indicator to your chart.
Sessions and breaks are automatically highlighted according to the schedule.
Use the visual cues to optimize your trading strategy for each session.
DAYE Session Levels QUARTERLY THEORY– M15, H1, H4📊 Indicator: Previous Session Max/Min Close Levels
🔍 Overview
This indicator displays the highest and lowest closing prices from the previous session across three key timeframes (H1, H4, M15). It is inspired by the Daye Quarterly Theory, which divides time into cyclical quartiles. These levels act as potential support/resistance zones where price often reacts.
🧠 Theoretical Foundations
Daye Quarterly Theory – Time-Based Market Structure
Monthly cycle : divided into 4 weeks, with the True Open on the second Monday (Q2).
Weekly cycle : divided into 4 days (Mon–Thu), with the True Open on Tuesday (Q2).
Daily cycle : divided into 4 sessions of 6 hours each, based on New York time:
-Q1: Asia (6 PM – 12 AM NY)
-Q2: London (12 AM – 6 AM NY) → True Daily Open
-Q3: New York (6 AM – 12 PM NY)
-Q4: PM Session (12 PM – 6 PM NY)
The indicator uses this time-based logic to calculate significant levels based on strong closes in previous sessions.
⚙️ Indicator Functions
✅ 1. Historical Levels (default mode)
Displays persistent horizontal lines at the high/low close of the previous session:
- H1: last 25 candles (1 day)
-H4: last 31 candles (1 week)
-M15: last 25 candles (6-hour session)
These levels are always visible and are drawn as thin black lines, helping traders recognize historically significant price zones.
🆕 2. Current Session Levels (optional)
When enabled, this mode shows the same previous-session high/low close only during the current session.
The levels:
-start exactly at the candle where the max/min close was registered in the previous session;
-extend up to the end of the current session;
-are automatically reset at the beginning of each new session.
These dynamic levels help monitor how price behaves around recent key zones in real time.
🧰 Custom Settings
The indicator includes two toggles:
-Show Historical Levels – enables/disables persistent previous-session levels.
-Show Current Session Levels – enables/disables live levels that appear only during the current session.
You can use either one or both simultaneously.
🧠 Ideal Use Cases
This tool is perfect for traders who:
-work with intraday or swing trading strategies;
-rely on support/resistance, market structure, or liquidity zones;
-want to identify where reversals, continuations, or breakouts are most likely;
-follow time-based cycles for confluence in execution.
📌 Final Thoughts
A simple yet powerful indicator that blends temporal cycles with price behavior, allowing traders to stay aligned with meaningful levels as markets evolve. Designed to provide clarity, structure, and precision for both discretionary and systematic trading.

ICT Silver Bullet [LuxAlgo]The ICT Silver Bullet indicator is inspired from the lectures of "The Inner Circle Trader" (ICT) and highlights the Silver Bullet (SB) window which is a specific 1-hour interval where a Fair Value Gap (FVG) pattern can be formed.
When a FVG is formed during the Silver Bullet window, Support & Resistance lines will be drawn at the end of the SB session.
There are 3 different Silver Bullet windows (New York local time):
The London Open Silver Bullet (3 AM — 4 AM ~ 03:00 — 04:00)
The AM Session Silver Bullet (10 AM — 11 AM ~ 10:00 — 11:00)
The PM Session Silver Bullet (2 PM — 3 PM ~ 14:00 — 15:00)
🔶 USAGE
The ICT Silver Bullet indicator aims to provide users a comprehensive display as similar as possible to how anyone would manually draw the concept on their charts.
It's important to use anything below the 15-minute timeframe to ensure proper setups can display. In this section, we are purely using the 3-minute timeframe.
In the image below, we can see a bullish setup whereas a FVG was successfully retested during the Silver Bullet session. This was then followed by a move upwards to liquidity as our target.
Alternatively, you can also see below a bearish setup utilizing the ICT Silver Bullet indicator outlined.
At this moment, the indicator has removed all other FVGs within the Silver Bullet session & has confirmed this FVG as the retested one.
There is also a support level marked below to be used as a liquidity target as per the ICT Silver Bullet concept suggests.
In the below chart we can see 4 separate consecutive examples of bullish & bearish setups on the 3-minute chart.
🔶 CONCEPTS
This technique can visualize potential support/resistance lines, which can be used as targets.
The script contains 2 main components:
• forming of a Fair Value Gap (FVG)
• drawing support/resistance (S/R) lines
🔹 Forming of FVG
1 basic principle: when a FVG at the end of the SB session is not retraced, it will be made invisible.
Dependable on the settings, different FVG's will be shown.
• 'All FVG': all FVG's are shown, regardless the trend
• 'Only FVG's in the same direction of trend': Only FVG's are shown that are similar to the trend at that moment (trend can be visualized by enabling ' Show ' -> ' Trend ')
-> only bearish FVG when the trend is bearish vs. bullish FVG when trend is bullish
• 'strict': Besides being similar to the trend, only FVG's are shown when the closing price at the end of the SB session is:
– below the top of the FVG box (bearish FVG)
– above bottom of the FVG box (bullish FVG)
• 'super-strict': Besides being similar to the trend, only FVG's are shown when the FVG box is NOT broken
in the opposite direction AND the closing price at the end of the SB session is:
– below bottom of the FVG box (bearish FVG)
– above the top of the FVG box (bullish FVG)
' Super-Strict ' mode resembles ICT lectures the most.
🔹 Drawing support/resistance lines
When the SB session has ended, the script draws potential support/resistance lines, again, dependable on the settings.
• Previous session (any): S/R lines are fetched between current and previous session.
For example, when current session is ' AM SB Session (10 AM — 11 AM) ', then previous session is
' London Open SB (3 AM — 4 AM) ', S/R lines between these 2 sessions alone will be included.
• Previous session (similar): S/R lines are fetched between current and previous - similar - session.
For example, when current session is ' London Open SB (3 AM — 4 AM)' , only S/R lines between
current session and previous ' London Open SB (3 AM — 4 AM) ' session are included.
When a new session starts, S/R lines will be removed, except when enabling ' Keep lines (only in strict mode) '
This is not possible in ' All FVG ' or ' Only FVG's in the same direction of trend ' mode, since the chart would be cluttered.
Note that in ' All FVG ' or ' Only FVG's in the same direction of trend ' mode, both, Support/Resistance lines will be shown,
while in Strict/Super-Strict mode:
• only Support lines will be shown if a bearish FVG appears
• only Resistance lines if a bullish FVG is shown
The lines will still be drawn the the end of the SB session, when a valid FVG appears,
but the S/R lines will remain visible and keep being updated until price reaches that line.
This publication contains a "Minimum Trade Framework (mTFW)", which represents the best-case expected price delivery, this is not your actual trade entry - exit range.
• 40 ticks for index futures or indices
• 15 pips for Forex pairs.
When on ' Strict/Super-Strict ' mode, only S/R lines will be shown which are:
• higher than the lowest FVG bottom + mTFW, in a bullish scenario
• lower than the highest FVG bottom - mTFW, in a bearish scenario
When on ' All FVG/Only FVG's in the same direction of trend ' mode, or on non-Forex/Futures/Indices symbols, S/R needs to be higher/lower than SB session high/low.
🔶 SETTINGS
(Check CONCEPTS for deeper insights and explanation)
🔹 Swing settings (left): Sets the length, which will set the lookback period/sensitivity of the Zigzag patterns (which directs the trend)
🔹 Silver Bullet Session; Show SB session: show lines and labels of SB session
Labels can be disabled separately in the ' Style ' section, color is set at the ' Inputs ' section.
🔹 FVG
– Mode
• All FVG
• Only FVG's in the same direction of trend
• Strict
• Super-Strict
– Colors
– Extend: extend till last bar of SB session
🔹 Targets – support/resistance lines
– Previous session (any): S/R lines fetched between current and previous SB session
– Previous session (similar): S/R lines fetched between current and previous similar SB session
– Colors
– Keep lines (only in strict mode)
🔹 Show
– MSS ~ Session: Show Market Structure Shift , only when this happens during a SB session
– Trend: Show trend (Zigzag, colored ~ trend)

Outside Candle Session Breakout [CHE]Outside Candle Session Breakout
Session - anchored HTF levels for clear market-structure and precise breakout context
Summary
This indicator is a relevant market-structure tool. It anchors the session to the first higher-timeframe bar, then activates only when the second bar forms an outside condition. Price frequently reacts around these anchors, which provides precise breakout context and a clear overview on both lower and higher timeframes. Robustness comes from close-based validation, an adaptive volatility and tick buffer, first-touch enforcement, optional retest, one-signal-per-session, cooldown, and an optional trend filter.
Pine version: v6. Overlay: true.
Motivation: Why this design?
Short-term breakout tools often trigger during noise, duplicate within the same session, or drift when volatility shifts. The core idea is to gate signals behind a meaningful structure event: a first-bar anchor and a subsequent outside bar on the session timeframe. This narrows attention to structurally important breaks while adaptive buffering and debouncing reduce false or mid-run triggers.
What’s different vs. standard approaches?
Baseline: Simple high-low breaks or fixed buffers without session context.
Architecture: Session-anchored first-bar high/low; outside-bar gate; close-based confirmation with an adaptive ATR and tick buffer; first-touch enforcement; optional retest window; one-signal-per-session and cooldown; optional EMA trend and slope filter; higher-timeframe aggregation with lookahead disabled; themeable visuals and a range fill between levels.
Practical effect: Cleaner timing at structurally relevant levels, fewer redundant or late triggers, and better multi-timeframe situational awareness.
How it works (technical)
The chart timeframe is mapped to an analysis timeframe and a session timeframe.
The first session bar defines the anchor high and low. The setup becomes active only after the next bar forms an outside range relative to that first bar.
While active, the script tracks these anchors and checks for a breakout beyond a buffered threshold, using closing prices or wicks by preference.
The buffer scales with volatility and is limited by a minimum tick floor. First-touch enforcement avoids mid-run confirmations.
Optional retest requires a pullback to the raw anchor followed by a new close beyond the buffered level within a user window.
Optional trend gating uses an EMA on the analysis timeframe, including an optional slope requirement and price-location check.
Higher-timeframe data is requested with lookahead disabled. Values can update during a forming higher-timeframe bar; waiting and confirmation mitigate timing shifts.
Parameter Guide
Enable Long / Enable Short — Direction toggles. Default: true / true. Reduces unwanted side.
Wait Candles — Minimum bars after outside confirmation before entries. Default: five. More waiting increases stability.
Close-based Breakout — Confirm on candle close beyond buffer. Default: true. For wick sensitivity, disable.
ATR Buffer — Enables adaptive volatility buffer. Default: true.
ATR Multiplier — Buffer scaling. Default: zero point two. Increase to reduce noise.
Ticks Buffer — Minimum buffer in ticks. Default: two. Protects in quiet markets.
Cooldown Bars — Blocks new signals after a trigger. Default: three.
One Signal per Session — Prevents duplicates within a session. Default: true.
Require Retest — Pullback to raw anchor before confirming. Default: false.
Retest Window — Bars allowed for retest completion. Default: five.
HTF Trend Filter — EMA-based gating. Default: false.
EMA Length — EMA period. Default: two hundred.
Slope — Require EMA slope direction. Default: true.
Price Above/Below EMA — Require price location relative to EMA. Default: true.
Show Levels / Highlight Session / Show Signals — Visual controls. Default: true.
Color Theme — “Blue-Green” (default), “Monochrome”, “Earth Tones”, “Classic”, “Dark”.
Time Period Box — Visibility, size, position, and colors for the info box. (Optional)
Reading & Interpretation
The two level lines represent the session’s first-bar high and low. The filled band illustrates the active session range.
“OUT” marks that the outside condition is confirmed and the setup is live.
“LONG” or “SHORT” appears only when the breakout clears buffer, debounce, and optional gates.
Background tint indicates sessions where the setup is valid.
Alerts fire on confirmed long or short breakout events.
Practical Workflows & Combinations
Trend-following: Keep close-based validation, ATR buffer near the default, one-signal-per-session enabled; add EMA trend and slope for directional bias.
Retest confirmation: Enable retest with a short window to prioritize cleaner continuation after a pullback.
Lower-timeframe scalping: Reduce waiting and cooldown slightly; keep a small tick buffer to filter micro-whips.
Swing and position context: Increase ATR multiplier and waiting; maintain once-per-session to limit duplicates.
Timeframe Tiers and Trader Profiles
The script adapts its internal mapping based on the chart timeframe:
Under fifteen minutes → Analysis: one minute; Session: sixty minutes. Useful for scalpers and high-frequency intraday reads.
Between fifteen and under sixty minutes → Analysis: fifteen minutes; Session: one day. Suits day traders who need intraday alignment to the daily session.
Between sixty minutes and under one day → Analysis: sixty minutes; Session: one week. Serves intraday-to-swing transitions and end-of-day planning.
Between one day and under one week → Analysis: two hundred forty minutes; Session: two weeks. Fits swing traders who monitor multi-day structure.
Between one week and under thirty days → Analysis: one day; Session: three months. Supports position traders seeking quarterly context.
Thirty days and above → Analysis: one day; Session: twelve months. Provides a broad annual anchor for macro context.
These tiers are designed to keep anchors meaningful across regimes while preserving responsiveness appropriate to the trader profile.
Behavior, Constraints & Performance
Signals can be validated on closed bars through close-based logic; enabling this reduces intrabar flicker.
Higher-timeframe values may evolve during a forming bar; waiting parameters and the outside-bar gate reduce, but do not remove, this effect.
Resource footprint is light; the script uses standard indicators and a single higher-timeframe request per stream.
Known limits: rare setups during very quiet periods, sensitivity to gaps, and reduced reliability on illiquid symbols.
Sensible Defaults & Quick Tuning
Start with close-based validation on, ATR buffer on with a multiplier near zero point two, tick buffer two, cooldown three, once-per-session on.
Too many flips: increase the ATR multiplier and cooldown; consider enabling the EMA filter and slope.
Too sluggish: reduce the ATR multiplier and waiting; disable retest.
Choppy conditions: keep close-based validation, increase tick buffer, shorten the retest window.
What this indicator is—and isn’t
This is a visualization and signal layer for session-anchored breakouts with stability gates. It is not a complete trading system, risk framework, or predictive engine. Combine it with structured analysis, position sizing, and disciplined risk controls.
Disclaimer
The content provided, including all code and materials, is strictly for educational and informational purposes only. It is not intended as, and should not be interpreted as, financial advice, a recommendation to buy or sell any financial instrument, or an offer of any financial product or service. All strategies, tools, and examples discussed are provided for illustrative purposes to demonstrate coding techniques and the functionality of Pine Script within a trading context.
Any results from strategies or tools provided are hypothetical, and past performance is not indicative of future results. Trading and investing involve high risk, including the potential loss of principal, and may not be suitable for all individuals. Before making any trading decisions, please consult with a qualified financial professional to understand the risks involved.
By using this script, you acknowledge and agree that any trading decisions are made solely at your discretion and risk.
Do not use this indicator on Heikin-Ashi, Renko, Kagi, Point-and-Figure, or Range charts, as these chart types can produce unrealistic results for signal markers and alerts.
Best regards and happy trading
Chervolino

Asian, UK & NY SessionTimes and Day Highs and LowsWhat It Does
The Asian, UK & NY Sessions indicator automatically identifies and highlights the three major global trading sessions on your chart.
For each session, it:
Detects session time in its local timezone.
Tracks the session’s highest and lowest prices.
Plots colored horizontal lines to show those levels throughout the trading day.
Optionally shades each session’s background in its signature color for instant visual context:
🟡 Asian Session: Yellow background
🔴 London Session: Red background
🔵 New York Session: Blue background
This helps traders see how price reacts within and between sessions — spotting overlaps, liquidity zones, and daily ranges.
⚙️ Inputs and Variables
Input Description
Extend lines until next session start (extendLines) Extends each session’s high/low lines forward until the next session begins.
Show prices in scale column (showScaleValues) Controls whether the price labels for session highs/lows appear on the chart’s right-hand price scale.
Show All Session Highs & Lows (showAllHighsLows) Master switch — turn this off to hide all session lines instantly, keeping the chart clean.
Show Session Backgrounds (showBackgrounds) Turns all background shading on or off. When off, all session colors disappear.
Background Opacity (bgOpacityAll) Adjusts the transparency for all session backgrounds (0 = solid, 100 = fully transparent).
🎨 Visual Color Scheme
Session Background High/Low Line
Asian Yellow Green
London Red Red
New York Blue Blue
Each color has a consistent role — making it easy to distinguish sessions even in replay or live view.
Price Tracking:
For each session, the indicator resets High and Low when the new session starts, then updates them as bars print.
Display Control:
If lines or backgrounds are disabled via settings, they’re completely hidden (no clutter, no partial transparency).
💡 How Traders Use It
Identify daily ranges in each global session.
Compare volatility between markets.
Align entries or exits with session transitions.
Observe how price respects previous session highs/lows.

RTH/ETH Session RangesSimple script that adds a table to the bottom left of the chart - shows the high and low of the Full Session with range, and shows the high and low of the RTH/USA session with same calculations.
This simple script enhances your charting experience by adding a comprehensive table to the bottom left corner of your trading chart. The table is designed to provide key market data at a glance, specifically focusing on the high and low metrics for different trading sessions. Here's a breakdown of what the script offers:
Features of the Script
Full Session Data:
High: The highest price point reached during the entire trading session.
Low: The lowest price point reached during the entire trading session.
Range: The difference between the high and low prices, providing insight into the session's volatility.
RTH/USA Session Data (Regular Trading Hours):
High: The highest price point reached during the RTH, typically reflecting the most active part of the trading day.
Low: The lowest price point reached during the RTH.
Range: The difference between the high and low prices during the RTH, indicating the session's intraday volatility.
How to Use the Script for Trading
Identify Key Levels:
Use the high and low points to identify significant support and resistance levels. These levels can guide your entry and exit points, helping you make informed trading decisions.
Gauge Market Volatility:
The range values for both the Full Session and RTH provide a quick snapshot of market volatility. Higher ranges suggest more significant price movements, which can inform your risk management strategies and position sizing.
Compare Sessions:
By comparing the Full Session data with the RTH data, you can identify differences in price behavior between the broader market hours and the more active trading periods. This comparison can help in understanding market dynamics and planning trades accordingly.
Unique Aspects of the Script
Ease of Access: The table's placement in the bottom left corner ensures that it is always visible without obstructing the main chart view, allowing for quick reference without disrupting your analysis.
Comprehensive Insights: By covering both the Full Session and RTH, the script provides a holistic view of the market, catering to traders who focus on different timeframes.
Customization Potential: Although simple, the script can be customized further to include additional metrics or visual tweaks to better suit individual trading strategies.
Practical Example
Imagine you're trading a particular stock and want to decide on a potential breakout strategy. By using this script, you can quickly identify the high of the Full Session as a potential breakout point. If the price approaches this level during the RTH, you can prepare to enter a trade with the confidence that this level has previously acted as a significant resistance. Conversely, knowing the low of the RTH can help you set stop-loss orders to manage risk effectively.

QuantumPips Session Trend StructureQuantumPips Session Trend Structure is an indicator built to help you read session structure and spot higher-quality breakout → retest opportunities when trend and momentum conditions agree.
It does three main things:
Maps sessions (Asia / London / New York) with live High/Low boxes
Adds trend direction using EMA bias (50/200 + optional slope)
Prints BUY/SELL labels only after a clean breakout + retest sequence, optionally filtered by volume, range expansion (ATR), and candle body strength
Educational tool only — not financial advice. Always manage risk.
What you’ll see on the chart
Session boxes (structure)
The indicator draws a box for each session and updates the session High/Low while the session is active.
Default settings (Timezone Europe/London):
Asia: 00:00–09:00
London: 08:00–17:00
New York: 13:00–22:00
Optional: vertical dotted lines at session starts.
EMA bias (direction)
Two EMAs are plotted:
EMA Fast (50)
EMA Slow (200)
Bias is:
Bullish: EMA50 above EMA200 (and optionally EMA50 rising)
Bearish: EMA50 below EMA200 (and optionally EMA50 falling)
This is designed to reduce counter-trend signals.
The core idea (simple)
Each major session often reacts to the previous session’s range.
This script uses that concept by selecting a reference range:
During London, reference = Asia High/Low
During New York, reference = London High/Low
During Asia (optional), reference = New York High/Low
The panel shows Ref Range, which is just:
Ref Range = Reference High − Reference Low
Signal logic: Breakout → Retest (with confluence)
A signal is only considered when you are inside a session you enabled (Asia/London/NY toggles).
BUY (Long)
Trend bias is Bullish
Price closes above the reference High (breakout)
Price returns to retest near the broken High (ATR tolerance)
Optional: retest candle must close back up (confirm-close)
Optional confirmations pass (volume / expansion / body)
SELL (Short)
Trend bias is Bearish
Price closes below the reference Low (breakout)
Price returns to retest near the broken Low (ATR tolerance)
Optional: retest candle must close back down (confirm-close)
Optional confirmations pass (volume / expansion / body)
This approach is meant to avoid “first-touch” entries and focus on structured moves.
Filters (optional, but useful)
Volume Spike Filter
Requires elevated participation:
volume ≥ SMA(volume) × multiplier
(Volume varies by market/data feed; use discretion on symbols where volume is not meaningful.)
Range Expansion Filter (ATR)
Requires a candle with enough “energy” to avoid weak breakouts:
(high − low) ≥ ATR × range multiplier
Strong Body Filter (optional)
Filters wick-heavy candles around key levels:
body % of candle range ≥ threshold
Side Panel (Top Right) — how to read it
Session
Shows the active session: Asia / London / New York / Off
EMA Bias
Shows: Bullish / Bearish / Neutral
Ref Range
Shows the size of the reference session range being used for the current session:
London uses Asia range
NY uses London range
Asia (optional) uses NY range
Volume
Shows status of the volume filter:
High = passes
Normal = fails
Off = filter disabled
Expansion
Shows status of the ATR expansion filter:
Yes = passes
No = fails
Off = filter disabled
Body
Shows status of the strong-body filter:
Yes = passes
No = fails
Off = filter disabled
Confluence Example
Recommended starting settings
If you want fewer, higher-quality setups:
Enable London + New York
Keep EMA bias ON
Volume filter ON (1.2–1.5×)
Expansion ON (0.8–1.0× ATR)
Body filter optional (0.55–0.70)
Confirm-close ON
If you want more signals:
Lower volume multiplier (1.1–1.2×)
Lower expansion (0.6–0.8× ATR)
Body filter OFF
Best timeframes (TF) to use
Best overall: 5m, 15m, 30m
Best Pairs for Sessions: EURUSD, GBPUSD, GBPJPY, USDJPY, XAUUSD

Trading Sessions with weekendsTrading Sessions UTC with weekends
Description:
Trading Sessions UTC is an indicator for visualizing the main global trading sessions on your chart with boxes and labels, allowing you to quickly understand market timing. The indicator displays Tokyo, London, and New York sessions.
Features:
- Supports any intraday timeframe (1H, 15m, 5m).
- All session times are in UTC, ensuring accuracy for global market analysis.
- Session boxes show the high and low prices within each session.
- Session labels are centered above the boxes and do not overlap the chart.
- Weekends are ignored – sessions are not displayed on Saturday and Sunday.
- Customizable box and label colors for each session.
Benefits:
- Quickly evaluate market activity during major sessions.
- Easily plan trading strategies during active market periods.
- Visually separate sessions to avoid confusion across time zones.
Inputs:
- Session time in UTC (Tokyo, London, New York).
- Box color for each session.
- Label color for each session.
Note:
This indicator is designed for intraday timeframes only. It will not display sessions correctly on daily or higher timeframes.

Indices ALN SessionsIndices ALN Sessions - Pattern Analysis with Historical Probabilities
Overview
This indicator analyzes overnight trading patterns across Asia, London, and New York sessions for major index futures (NQ, ES, YM), providing real-time probability analysis based on 15 years of historical data (2010-2025).
Pattern Detection Methodology
The indicator detects four distinct overnight patterns by comparing session high/low relationships:
1. London Engulfs Asia
Condition: London High > Asia High AND London Low < Asia Low
Interpretation: London session completely engulfed the Asia range
2. Asia Engulfs London
Condition: Asia High > London High AND Asia Low < London Low
Interpretation: London session remained within Asia's range
3. London Partial Up
Condition: London High > Asia High AND London Low ≥ Asia Low
Interpretation: London broke Asia high but not its low
4. London Partial Down
Condition: London Low < Asia Low AND London High ≤ Asia High
Interpretation: London broke Asia low but not the high
Probability Calculation
Probabilities are derived from historical analysis of 1-minute price data spanning 2010-2025 across all three indices. The system tracks:
Primary Targets: Most likely level to be taken during NY session based on pattern
Secondary Targets: Second most likely level
Asia Targets: Probability of reaching untouched Asia levels (for partial patterns)
Engulfment Probability: Likelihood of NY session taking all four levels
Day-of-Week Specificity
Each pattern has unique probability profiles for Monday through Friday, as market behavior varies significantly by day. The indicator automatically selects the appropriate probability set based on the current trading day.
Conditional Probability Logic
The indicator dynamically adjusts probabilities as levels are taken during the NY session:
When the Primary target is taken first → Shows conditional probability for Secondary target
When Secondary is taken before Primary → Adjusts Primary probability based on historical sequences
Real-time tracking shows which levels have been hit with checkmark confirmations
How Probabilities Were Derived
Data was collected from 15 years of 1-minute futures data for NQ, ES, and YM. For each trading day:
Asia session high/low recorded (8:00 PM - 2:00 AM EST)
London session high/low recorded (2:00 AM - 8:00 AM EST)
Pattern type classified
NY session behavior tracked (8:00 AM - 4:00 PM EST)
Level breaks recorded with sequence order
Statistical frequencies calculated by pattern, day, and instrument
Sample sizes vary but typically include 200-500+ occurrences per pattern/day combination over the 15-year period.
Visual Components
Session Boxes: Color-coded rectangles showing Asia (Yellow), London (Blue), and NY (Red) sessions with their high/low ranges.
Pivot Lines: Horizontal lines marking session highs and lows that extend until broken or until the drawing cutoff time.
Pattern Labels: Automatic labeling at NY open identifying which of the four patterns has formed.
Probability Table: Real-time table showing:
Current pattern type
Instrument type (NQ/ES/YM) and day of week
Sample size (when using dynamic stats)
Primary, Secondary, and Asia target probabilities
Engulfment probability
Live confirmations as levels are taken
Color Coding:
Green background: 70%+ probability
Lime: 50-70% probability
Orange: 30-50% probability
Red: Confirmed (level taken)
Settings & Inputs
Historical Stats
Instrument Type: Select NQ, ES, or YM (each has unique probability data)
Use Dynamic Stats: Toggle between historical probabilities and live collection mode
Sessions:
Customizable session times (default: Asia 8PM-2AM, London 2AM-8AM, NY 8AM-4PM EST)
Session box transparency and colors
Toggle session boxes and text on/off
Pivots:
Show/hide pivot lines and labels
Extend pivots until mitigated or past mitigation
Alert when pivots are broken
Midpoint display option
Probabilities:
Show/hide probability table
Table position and size customization
Pattern label display toggle
Opening Prices:
Optional horizontal lines at key times (midnight,18:00, 09:30, etc.)
How to Use:
Apply to 5-minute chart of NQ, ES, or YM futures
Select your instrument in settings to match the chart
Wait for NY session open - Pattern will be identified and probabilities displayed
Monitor the probability table - Primary targets show highest probability levels
Watch for confirmations - Checkmarks appear as levels are taken
Note conditional updates - Probabilities adjust based on which level breaks first
Trading Applications:
Directional bias: High probability targets suggest likely NY session movement
Level awareness: Know which session highs/lows are most likely to be tested
Risk management: Lower probability scenarios may warrant tighter stops
Sequence planning: Conditional probabilities help anticipate multi-level moves
What Makes This Different:
Unlike standard session indicators that only display ranges, this tool:
Classifies specific overnight pattern formations:
Provides quantified probabilities based on extensive historical analysis
Updates in real-time with conditional logic as the session develops
Distinguishes between different indices (NQ/ES/YM) and days of week
Tracks level-break sequences, not just final outcomes
Notes:
Probabilities are based on historical frequencies and do not guarantee future results
Best used on 1, 5, and 15-minute timeframes for optimal session visualization
Works on continuous futures contracts or /NQ, /ES, /YM symbols

ATR Trend Switch (ATR > k*ATR_SMA) - Overlay + Session Windows🔧 Core Logic
ATR Source: Multi-timeframe ATR (default 1H while trading 5m/15m).
Threshold Rule:
TREND = ATR > (ATR_SMA × k)
NORMAL = otherwise
Sessions: Only evaluates during London (02:00–07:00 ET) and New York (07:00–11:30 ET) by default.
Smoothing: ATR compared against its SMA (default 10-period).
k Multiplier: Controls sensitivity (default 1.20).
🖥️ Visuals
✅ TREND: Green label (or green background if enabled).
⚪ NORMAL: Gray label.
⏸️ OUT OF SESSION: Dim label, so you don’t force trades off-hours.
📊 Optional panel shows ATR, ATR_SMA, and Threshold values in real time.
📊 Dashboard + Overlay Combo
Use this overlay on your chart TF for tactical entries.
Pair with an ATR Dashboard (pane) on a higher TF (like 1H) for the strategic backdrop.
Overlay TREND + Dashboard TREND → High conviction trending environment.
Overlay TREND but Dashboard NORMAL → Fragile breakout, trade smaller or pass.
Both NORMAL → Chop/range → stick to 1:1.4 BE rules.
⚖️ Trading Playbook Integration
NORMAL Mode (ATR below threshold)
50% partial at 1R.
BE @ 1:1.4.
Runner capped at 2R.
TREND Mode (ATR above threshold)
50% partial at 1R.
BE @ 1:1.6.
Remainder trails ATR ×1.5.
Reserve ~15% of trend trades as no-partials for fat-tail home runs (4R–6R+).
🔔 Alerts
ATR Trend ON (in session) → “ATR > Threshold → Switch to TREND BE (1:1.6).”
ATR Trend OFF (in session) → “ATR ≤ Threshold → Switch to NORMAL BE (1:1.4).”
Perfect for getting pinged the moment volatility regime flips.
📌 Tips
k = 1.20 → balanced (default).
k = 1.10–1.15 → more TREND calls (sensitive).
k = 1.30+ → only strongest trends count.
Run it with overlay ON chart TF for execution, and dashboard on HTF for context.
Best used during active London/NY sessions.
✅ This isn’t a signal generator. It’s a regime filter + risk manager.
It keeps you from chasing chop and helps you mechanically switch BE rules without hesitation.
⚡ Pro tip: Combine with a Trend Continuation HUD, Elliott Wave Convergence overlay, or a Bollinger+RSI/MFI reversal scanner for a full tactical playbook.

DR/IDR Candles [LuxAlgo]This indicator displays defining ranges (DR) and implied defining ranges (IDR) constructed from two user set sessions (RDR/ODR) as graphical candles on the chart. The script introduces additional graphical elements to the original DR/IDR concept and as such can be thought as a graphical method in addition to a technical indicator.
Additionally, this script can display various Fibonacci retracements from the constructed DR/IDR if enabled within the settings.
Settings
Regular Session: Enable/disable regular session's DR/IDR alongside setting the session time. By default, 09:30 - 10:30 am.
Overnight Session: Enable/disable overnight session's DR/IDR alongside setting the session time. By default, 03:00 - 04:00 am.
UTC Offset: UTC offset for the time zone, by default -5 (EST)
Retracements
Reverse: Inverts source range upper/lower value for constructing the retracements.
From: Source range used to construct the retracements, by default DR is used.
By default, the 0.5 retracement (average line) is displayed.
Usage
The used sessions are highlighted by a gray background. DRs are highlighted by dashed lines while IDRs are highlighted by solid ones. The maximum/minimum price between each user set session is highlighted by solid wicks.
The color of the DRs/IDRs/wicks are determined by the price position relative to the DR; if price is above the DR maximum, then a blue color is used. If price is below, then an orange color is used, and if price is within the DR range, then a gray color is used.
Additionally, the area of the DR range is used to highlight the number of time price is located within the DR, with a longer background highlighting a higher number of occurrences. This can help highlight if the DR levels were potentially useful as support/resistance.
When price is outside the IDR range, the area between the price and IDR is highlighted, in blue if price is above the IDR, and orange if it is under.
The original author of the DR/IDR concept describes 3 rules using the price position relative to the DR/IDR levels:
1.) If price on the 5-minute timeframe closes above the DR high after 10:30 AM or 04:00 AM then the DR low will likely be the low of the trading session.
2.) If price on the 5-minute timeframe closes below the DR low after 10:30 AM or 04:00 AM then the DR high will likely be the high of the trading session.
3.) If price closes above the IDR high after 10:30 AM or 04:00 AM it is an early indication that the low of the DR will be the low of the day and vice versa.
We can see that the above rules are cases of conditional probabilities.
There is no significant data supporting or regarding any statistical probability of the above rules to be true, which are more than uncertain given the stochastic nature of prices. The lack of precision of these rules is also a concern (time zone dependance, applicable markets, etc...).
Credits
Credits to trader TheMas7er who originally created the DR/IDR concept in November of 2022. This script was derived from his proposed session times & rules for trading.

TBL Session Highs&LowsBL Session Highs&Lows is a versatile intraday tool that highlights key price levels within up to 11 configurable trading sessions. It displays session highs, lows, and optional open levels, with customizable lines, labels, and boxes — perfect for tracking price behavior across sessions like Asia, London, and New York.
🔧 Key Features
🧩 Up to 11 fully customizable sessions
📍 High, Low, and Open lines with adjustable color, style, and width
🧱 Optional boxes showing session range, dynamically colored based on price movement
🏷️ Session labels for visual orientation
🔁 Extendable lines to project levels beyond the session
🌐 Custom time zone support for each session
🎨 Fully customizable visuals for clear chart integration
📈 Designed for:
Intraday session tracking (e.g., Asia, London, NY)
Session-based strategies (breakouts, reversals, liquidity zones)
Open-level reference (e.g., NY open)
Visual separation of trading periods
Example Scenarios:
🟦 "Asia" session: 18:00–00:00 GMT-4 with full box and lines
🟩 "London" session: 00:00–06:00 with high/low lines only
🟥 Segmented NY sessions (Q1–Q4) for fine-grained intraday tracking
✅ Tip: Enable only the sessions you need to keep your chart clean and focused.
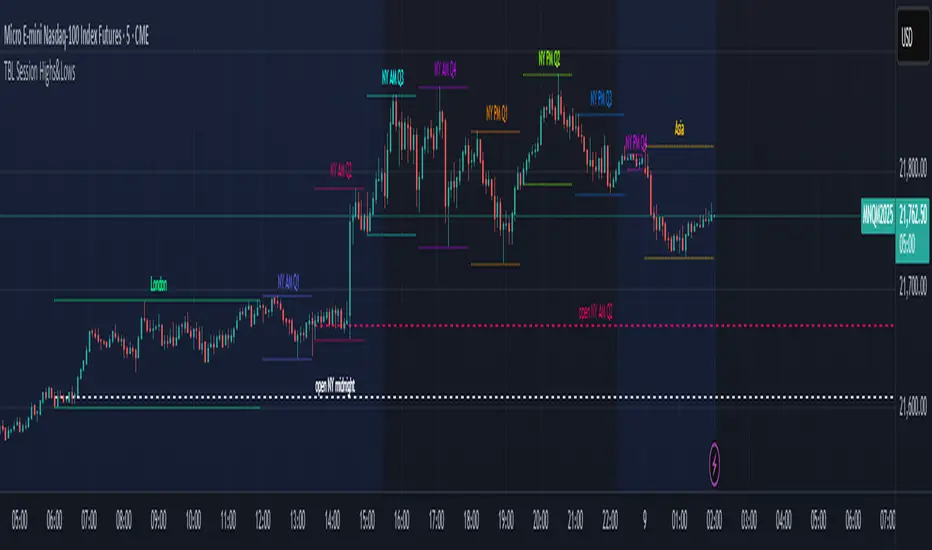
[killerbee] MTF RetracementKey Features
Multi-Timeframe (MTF) Analysis: Plot the high, low, and open from up to four user-defined higher timeframes. This allows you to see the bigger picture and identify key levels that institutional traders are watching.
Dynamic Support & Resistance: Lines are drawn at these key MTF levels and extend until price breaks through them, providing a clean and dynamic view of support and resistance.
Session Highlighting: Automatically draw boxes and high/low lines for the Asia, London, and RTH (Regular Trading Hours) sessions. This helps you understand the context of price action throughout the trading day.
Customizable Opening Price Lines: Pinpoint significant opening prices with dedicated lines for events like the "Midnight Open," "8:30 Open," and "9:30 Open."
"NQ STATS TABLE": A powerful statistical table that provides real-time insights:
Break/Hit Confirmation: Instantly see when a key MTF high/low has been broken or when an opening price has been retraced to.
9 AM Directional Bias: A bullish or bearish bias based on the close of the 9 AM (New York time) hourly candle.
Historical Probabilities: The table displays historical probabilities for price to either break a previous high/low or retrace to the open, based on the current hour of the trading session.
Extensive Customization: Nearly every visual aspect of the indicator can be customized to your preference, including colors, line styles, visibility of each component, and the position of the stats table.
How to Use
Identify Key Levels: The lines from the higher timeframes (HTF1, HTF2, etc.) represent significant support and resistance. Pay close attention to these levels as price approaches them.
Look for Breaks and Retracements:
When a high or low line is broken, the line will stop extending. This can signal a shift in market structure and a potential continuation in the direction of the break.
The "Open Line" for each timeframe represents the opening price. When the line stops extending, it means price has retraced back to that open, a common occurrence in the market.
Utilize the Sessions:
The Asia, London, and RTH boxes help you frame your trading day. The highs and lows of these sessions are often critical levels of support and resistance.
Breakouts from these session ranges can lead to strong directional moves.
Leverage the STATS TABLE:
Use the "Break" and "Hit" columns to quickly confirm when key levels have been breached or revisited.
The "Direction" row gives you a quick sentiment reading based on the 9 AM candle.
The "Trades Back %" and "High/Low Forms" provide a statistical edge by showing you the historical likelihood of certain price behaviors based on the time of day. This can help you decide whether to play for a breakout or a retracement.
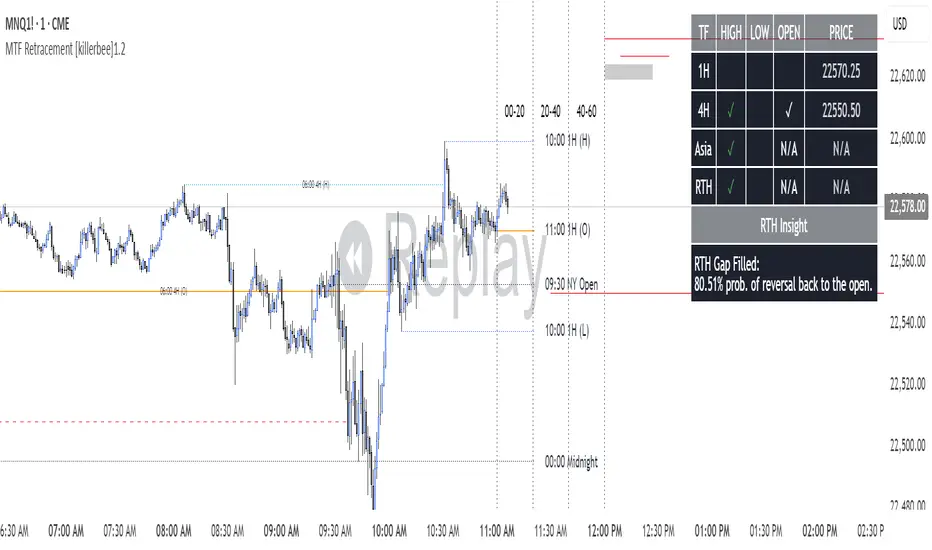
Trading Sessions Background ColorTrading Sessions Background Color
This indicator provides a visual representation of the major trading sessions — Asia, London, and USA — by applying distinct background colors to the chart. It allows traders to easily identify active market hours and session overlaps.
Features:
Customizable Sessions: Users can modify time ranges, and colors according to their preferences.
Predefined Major Trading Sessions: The indicator includes Asia, London, and USA sessions by default.
Time Zone Adjustment: A configurable UTC offset ensures accurate session display.
Clear Visual Differentiation: Background colors indicate when each session is active.
Usage Instructions:
Apply the indicator to a TradingView chart.
Adjust session settings and time zone offset as needed.
The chart background will update dynamically to reflect the active trading session.

Main Market Opener Breakout [RH]Based on my observations while analyzing the crypto and forex charts, particularly BTCUSDT and EURUSD, I have noticed that the prices exhibit significant movements during most stock market sessions, particularly during New York main market session.
With the aim of capturing these moves, I embarked on extensive research. Through this research, I discovered that by considering the very first "15m" or "30m" candle of the main market trading session and marking that first candle's high and low points, we can create potential trigger points.
A break above the high point indicates a bullish signal, while a break below the low point suggests a bearish signal. To further refine our analysis and filter out some noise, we can incorporate the Average True Range (ATR) value of that candle.
Candle time is very important here. We will mark the candle when the actual trading begins in New York stock exchange. The trading hours for the New York Stock Exchange (NYSE) typically begin at 9:30 AM and end at 4:00 PM Eastern Time (ET), Monday through Friday. This is known as the "NYSE Regular Trading Session." However, it's important to note that there are also pre-market and after-hours trading sessions that occur outside of these core hours. We will not consider these pre and after-hours.
Example:
First break-above and break-below is marked automatically and alerts are also available for first breaks.
Example:
I have also added the option to add the, London Stock Exchange Main Market and Tokyo Stock Exchange Regular Trading Session. You can add those sessions also and test with different symbols.
Stocks symbols from different stock exchanges just mark the very first candle of the day(main market trading session).
Alerts are available.

Correlation HeatMap [TradingFinder] Sessions Data Science Stats🔵 Introduction
n financial markets, correlation describes the statistical relationship between the price movements of two assets and how they interact over time. It plays a key role in both trading and investing by helping analyze asset behavior, manage portfolio risk, and understand intermarket dynamics. The Correlation Heatmap is a visual tool that shows how the correlation between multiple assets and a central reference asset (the Main Symbol) changes over time.
It supports four market types forex, stocks, crypto, and a custom mode making it adaptable to different trading environments. The heatmap uses a color-coded grid where warmer tones represent stronger negative correlations and cooler tones indicate stronger positive ones. This intuitive color system allows traders to quickly identify when assets move together or diverge, offering real-time insights that go beyond traditional correlation tables.
🟣 How to Interpret the Heatmap Visually ?
Each cell represents the correlation between the main symbol and one compared asset at a specific time.
Warm colors (e.g. red, orange) suggest strong negative correlation as one asset rises, the other tends to fall.
Cool colors (e.g. blue, green) suggest strong positive correlation both assets tend to move in the same direction.
Lighter shades indicate weaker correlations, while darker shades indicate stronger correlations.
The heatmap updates over time, allowing users to detect changes in correlation during market events or trading sessions.
One of the standout features of this indicator is its ability to overlay global market sessions such as Tokyo, London, New York, or major equity opens directly onto the heatmap timeline. This alignment lets traders observe how correlation structures respond to real-world session changes. For example, they can spot when assets shift from being inversely correlated to moving together as a new session opens, potentially signaling new momentum or macro flow. The customizable symbol setup (including up to 20 compared assets) makes it ideal not only for forex and crypto traders but also for multi-asset and sector-based stock analysis.
🟣 Use Cases and Advantages
Analyze sector rotation in equities by tracking correlation to major indices like SPX or DJI.
Monitor altcoin behavior relative to Bitcoin to find early entry opportunities in crypto markets.
Detect changes in currency alignment with DXY across trading sessions in forex.
Identify correlation breakdowns during market volatility, signaling possible new trends.
Use correlation shifts as confirmation for trade setups or to hedge multi-asset exposure
🔵 How to Use
Correlation is one of the core concepts in financial analysis and allows traders to understand how assets behave in relation to one another. The Correlation Heatmap extends this idea by going beyond a simple number or static matrix. Instead, it presents a dynamic visual map of how correlations shift over time.
In this indicator, a Main Symbol is selected as the reference point for analysis. In standard modes such as forex, stocks, or crypto, the symbol currently shown on the main chart is automatically used as the main symbol. This allows users to begin correlation analysis right away without adjusting any settings.
The horizontal axis of the heatmap shows time, while the vertical axis lists the selected assets. Each cell on the heatmap shows the correlation between that asset and the main symbol at a given moment.
This approach is especially useful for intermarket analysis. In forex, for example, tracking how currency pairs like OANDA:EURUSD EURUSD, FX:GBPUSD GBPUSD, and PEPPERSTONE:AUDUSD AUDUSD correlate with TVC:DXY DXY can give insight into broader capital flow.
If these pairs start showing increasing positive correlation with DXY say, shifting from blue to light green it could signal the start of a new phase or reversal. Conversely, if negative correlation fades gradually, it may suggest weakening relationships and more independent or volatile movement.
In the crypto market, watching how altcoins correlate with Bitcoin can help identify ideal entry points in secondary assets. In the stock market, analyzing how companies within the same sector move in relation to a major index like SP:SPX SPX or DJ:DJI DJI is also a highly effective technique for both technical and fundamental analysts.
This indicator not only visualizes correlation but also displays major market sessions. When enabled, this feature helps traders observe how correlation behavior changes at the start of each session, whether it's Tokyo, London, New York, or the opening of stock exchanges. Many key shifts, breakouts, or reversals tend to happen around these times, and the heatmap makes them easy to spot.
Another important feature is the market selection mode. Users can switch between forex, crypto, stocks, or custom markets and see correlation behavior specific to each one. In custom mode, users can manually select any combination of symbols for more advanced or personalized analysis. This makes the heatmap valuable not only for forex traders but also for stock traders, crypto analysts, and multi-asset strategists.
Finally, the heatmap's color-coded design helps users make sense of the data quickly. Warm colors such as red and orange reflect stronger negative correlations, while cool colors like blue and green represent stronger positive relationships. This simplicity and clarity make the tool accessible to both beginners and experienced traders.
🔵 Settings
Correlation Period: Allows you to set how many historical bars are used for calculating correlation. A higher number means a smoother, slower-moving heatmap, while a lower number makes it more responsive to recent changes.
Select Market: Lets you choose between Forex, Stock, Crypto, or Custom. In the first three options, the chart’s active symbol is automatically used as the Main Symbol. In Custom mode, you can manually define the Main Symbol and up to 20 Compared Symbols.
Show Open Session: Enables the display of major trading sessions such as Tokyo, London, New York, or equity market opening hours directly on the timeline. This helps you connect correlation shifts with real-world market activity.
Market Mode: Lets you select whether the displayed sessions relate to the forex or stock market.
🔵 Conclusion
The Correlation Heatmap is a robust and flexible tool for analyzing the relationship between assets across different markets. By tracking how correlations change in real time, traders can better identify alignment or divergence between symbols and gain valuable insights into market structure.
Support for multiple asset classes, session overlays, and intuitive visual cues make this one of the most effective tools for intermarket analysis.
Whether you’re looking to manage portfolio risk, validate entry points, or simply understand capital flow across markets, this heatmap provides a clear and actionable perspective that you can rely on.

Last 10 Sessions: High, Low, Pivot, GapLast 10 Sessions: High, Low, Pivot, Gap
This indicator highlights the most important price levels from the last 10 completed trading sessions to help intraday and swing traders quickly spot potential support, resistance, and price reaction zones.
Key Features:
Previous Highs and Lows : Visualize the high and low from each of the past 10 sessions. These are the most commonly tested breakout and reversal points for day trading.
Session Pivots: The classic pivot formula ((High + Low + Close) / 3) for each of the last 10 sessions, often acting as a market “equilibrium” or intraday magnet.
Gaps: Displays the difference between each day’s open and the previous session’s close (“gap”), showing sentiment shifts and possible gap fill targets.
Clean, Faded Visuals: All lines and labels are subtly faded so your chart remains clear and uncluttered, with each level labeled by how many sessions ago it occurred.
Full Customization: Instantly toggle any level type (High, Low, Pivot, Gap) ON/OFF in settings, extend lines to the right, and adjust their forward length.
Bulletproof Logic: Never throws runtime errors. Lines and labels only display when valid data is present.
How to Use:
Use recent highs/lows for breakout, breakdown, or mean reversion trades.
Spot where multiple levels from past sessions cluster together for high-probability reversal or breakout areas.
Watch pivots for intraday bias, and gaps for sentiment and possible fill plays.
Perfect for all intraday timeframes.
If you want a powerful yet minimal map of where price is most likely to react, this indicator is for you!
Developed by
