Major Session Highs/LowsThis indicator creates horizontal lines at major session high/lows (US, London, and Asian). The script updates the lines automatically, on session close.
For instance, when viewing during the US session, after the London overlap, horizontal lines will be displayed at the following levels.
The high/low of the most recent London session.
The high/low of the most recent Asian session.
The high/low of the last full US session, i.e. the session of the day prior.
When the current US session closes, the US levels automatically update.
"session" için komut dosyalarını ara

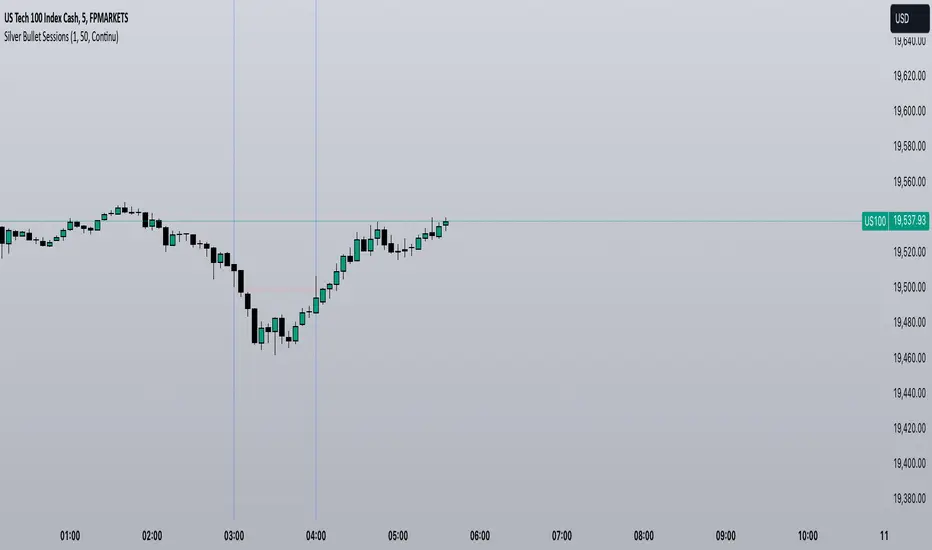
Silver Bullet SessionsThe Silver Bullet Sessions indicator is a specialized timing tool designed to highlight key market sessions throughout the trading day. By marking specific hours with vertical lines, it helps traders identify potentially significant market moments that often coincide with increased volatility and trading opportunities.
This indicator plots vertical lines at six strategic times during the trading day: 3:00 AM, 4:00 AM, 10:00 AM, 11:00 AM, 2:00 PM, and 3:00 PM. These times are carefully selected to correspond with important market events and session overlaps in the global trading cycle. The early morning hours (3-4 AM) often capture significant Asian market movements and the European market opening. The mid-morning period (10-11 AM) typically corresponds with peak European trading hours and the pre-US market dynamics. The afternoon times (2-3 PM) coincide with key US market activities and the European market close.
The indicator is implemented using Pine Script version 6, ensuring compatibility with the latest TradingView platform features. It employs a clean, efficient coding structure that minimizes resource usage while maintaining reliable performance. The vertical lines are rendered in blue for clear visibility against any chart background, and their width is optimized for easy identification without obscuring price action.
Traders can use these visual markers to:
Plan their entries and exits around these key time periods
Anticipate potential market volatility
Structure their trading sessions around these significant market hours
Identify session-based trading patterns
Enhanced London Session SMC SetupEnhanced London Session SMC Setup Indicator
This Pine Script-based indicator is designed for traders focusing on the London trading session, leveraging smart money concepts (SMC) to identify potential trading opportunities in the GBP/USD currency pair. The script uses multiple techniques such as Order Block Detection, Imbalance (Fair Value Gap) Analysis, Change of Character (CHoCH) detection, and Fibonacci retracement levels to aid in market structure analysis, providing a well-rounded approach to trade setups.
Features:
London Session Highlight:
The indicator visually marks the London trading session (from 08:00 AM to 04:00 PM UTC) on the chart using a blue background, signaling when the high-volume, high-impulse moves tend to occur, helping traders focus their analysis on this key session.
Order Block Detection:
Identifies significant impulse moves that may form order blocks (supply and demand zones). Order blocks are areas where institutions have executed large orders, often leading to price reversals or continuation. The indicator plots the high and low of these order blocks, providing key levels to monitor for potential entries.
Imbalance (Fair Value Gap) Detection:
Detects and highlights price imbalances or fair value gaps (FVG) where the market has moved too quickly, creating a gap in price action. These areas are often revisited by price, offering potential trade opportunities. The upper and lower bounds of the imbalance are visually marked for easy reference.
Change of Character (CHoCH) Detection:
This feature identifies potential trend reversals by detecting significant changes in market character. When the price action shifts from bullish to bearish or vice versa, a CHoCH signal is triggered, and the corresponding level is marked on the chart. This can help traders catch trend reversals at key levels.
Fibonacci Retracement Levels:
The script calculates and plots the key Fibonacci retracement levels (0.618 and 0.786 by default) based on the highest and lowest points over a user-defined swing lookback period. These levels are commonly used by traders to identify potential pullback zones where price may reverse or find support/resistance.
Directional Bias Based on Market Structure:
The indicator provides a market structure analysis by comparing the current highs and lows to the previous periods' highs and lows. This helps in identifying whether the market is in a bullish or bearish state, providing a clear directional bias for trade setups.
Alerts:
The indicator comes with built-in alert conditions to notify the trader when an order block, imbalance, CHoCH, or other significant price action event is detected, ensuring timely action can be taken.
Ideal Usage:
Timeframe: Suitable for intraday trading, particularly focusing on the London session (08:00 AM to 04:00 PM UTC).
Currency Pair: Specifically designed for GBP/USD but can be adapted to other pairs with similar market behavior.
Trading Strategy: Best used in conjunction with a price action strategy, focusing on the key levels identified (order blocks, FVG, CHoCH) and using Fibonacci retracement levels for precision entries.
Target Audience: Ideal for traders who follow smart money concepts (SMC) and are looking for a structured approach to identify high-probability setups during the London session.

10 Minute Futures Session Open RangeInspired by SamRecio's 30sec OR script.
The 10 minute Opening Range (OR) dynamically identifies and visualizes the opening range of a trading session within the first 10 minutes after the market opens at 9:30 AM EST, concluding at 4:00 PM EST, reflecting the typical trading hours for U.S. stock exchanges. This indicator is particularly useful for strategies that rely on the initial market momentum and direction established during the early moments of the trading session.
Upon activation, the indicator calculates the highest (orHigh) and lowest (orLow) price levels reached during the first 10 minutes of the trading session, marking these levels with green (for the high) and red (for the low) lines directly on the chart overlay. Additionally, it computes and plots a midpoint (midPoint) between these high and low levels, displayed as a blue line, offering a visual reference for the median of the opening range.
The calculations are reset daily to ensure the indicator accurately reflects the opening range for each new trading session. By doing so, it avoids carrying over data from previous days, maintaining relevance and precision for day traders and those utilizing short-term trading strategies. The indicator also incorporates timezone adjustments to align with the America/New_York timezone, ensuring that the opening range is accurately captured regardless of the user's local timezone.
This tool is invaluable for traders looking to capitalize on breakout or reversion strategies around the opening range, providing clear visual cues for significant price levels established at the start of the trading session. By focusing on the first 10 minutes of trading, it caters to a specific segment of the market that believes the initial movements can set the tone for the rest of the day's trading activity.
IU Break of any session StrategyHow this script works:
1. This script is an intraday trading strategy script which buy and sell on the bases of user-defined intraday session range breakout and gives alert(if the alert is set) message too when the new position is open.
2. It calculate the session as per the user inputs or user defined custom session.
3. The script stores the highest and lowest value of the whole session.
4. It take a long position on the first break and close above the highest value.
5. It take a short position on the break and close below the lowest value.
6. The script takes one position in one day.
7. The stop loss for this script is the previous low(if long) or high(if short).
8. Take profit is 1:2 and it's adjustable.
9. This script work on every kind of market.
How The Useful For The User :
1. User can backtest any session range breakout he wants to trade.
2. User can get alert when the new position is open.
3. User can change the Risk to Reward in order to find the best Risk to Reward.
4. User can see the highest and lowest value of the session with respect to analyzing his trading objective.
5. This strategy script highlights which session range breakout performs best and which performs worst.

Stock Data Table█ OVERVIEW
This is a table that shows some information about stocks. It is divided into four sections:
1) Correlation
2) Shares
3) Daily Data
4) Extended Session Data
The table is completely modular, which means you can add or remove each element from the settings menu, and it will automatically rearrange its spaces.
It is also highly customizable, to the extent that you can change almost any color, remove or change titles, invert section rows, and much more.
1) Correlation
The script checks if the stock is listed on NASDAQ, and if so, uses the QQQ (Nasdaq-100 ETF) as the reference index in the first cell; otherwise, it uses the SPY (S&P 500 ETF). The length of the correlation is shown in the second cell. The table then displays the correlation between the reference index and the other index, and the correlation between the reference index and the stock.
To make it easier to interpret the correlation values, each row's last cell is color-coded with a gradient to highlight the type of correlation, and the direction of the gradient can be customized.
The correlation coefficient is a statistical measure that quantifies the strength and direction of the relationship between two variables, indicating how changes in one variable are associated with changes in the other variable, so it can be used to identify patterns and trends.
If you are interested in correlation, I suggest taking a look at my dedicated indicator:
2) Shares
This feature provides you with quick access to key information about shares and market capitalization.
On one row, you can view the total shares outstanding and the market capitalization for the fiscal year or the quarterly year. The total shares outstanding represents the total number of shares of the stock that have been issued and are currently outstanding, regardless of whether they are held by insiders or public investors. The market capitalization is a widely used measure of the company's value as determined by the stock market, calculated by multiplying its current stock price with the total number of outstanding shares.
The other row shows the float, which is the number of shares of a company that are available for public trading, and the corresponding free-float market cap, calculated by multiplying the company's current stock price with the float. Because Pine Script does not allow retrieving information about quarterly year float, you can view the float and the free-float market cap of the fiscal year only. The data can be displayed at all times or only when the difference between the total shares outstanding and the float is significant enough to result in a difference between the market cap and free-float market cap.
The classification for market cap and free-float market cap is set in this way:
Mega Cap: $200 billion or more
Large Cap: between $10 billion and $200 billion
Mid Cap: between $2 billion and $10 billion
Small Cap: between $300 million and $2 billion
Micro Cap: less than $300 million
Penny Stocks: less than $5 (customizable)
Comparing the free-float market cap to the market cap can provide insights into the liquidity of a stock. In fact, if the float is relatively small compared to the total shares outstanding, it may be more difficult to find buyers or sellers, which could lead to increased volatility. On the other hand, a larger float indicates that the stock is more liquid and may be easier to trade, potentially resulting in lower volatility. However, market conditions can change quickly and significantly, especially for intraday traders, and the free-float can also change as insiders or other large shareholders buy or sell shares. Therefore, comparing the data of the fiscal year with that of the quarterly year may not provide the most up-to-date and accurate information for making trading decisions. This limitation can be mitigated by combining those data with other indicators and tools, such as technical analysis or news events, to gain a better understand of the stock's performance and potential trading opportunities.
3) Daily Data
This section is available on daily charts only due to the lack of accuracy of real-time daily data on other time frames. Here, you can view the Average Daily Volume (ADV) over a preferred time range (20 days by default), and the Daily Change, which represents the percentage difference between the closing price on two consecutive trading days.
ADV is useful in measuring the stock's volatility, as it provides an indication of how much trading activity there is in it. Generally speaking, stocks with higher trading volume tend to be less volatile than stocks with lower trading volume. High trading volume means there are more buyers and sellers actively trading the stock, which makes it easier for investors to buy and sell shares at fair prices. This increased liquidity can help to stabilize the stock price, reducing the potential for large swings in either direction. On the other hand, stocks with lower trading volume may experience greater volatility, as there are fewer buyers and sellers actively trading the stock. This can result in larger price swings, as it may be more difficult for investors to buy or sell shares at fair prices.
The daily percentage change can provide an indication of the stock's volatility, with larger values indicating greater volatility and risk. It can also be compared to that of a benchmark such an index or other stocks in the same sector, helping to determine whether the stock is outperforming or underperforming relative to them.
4) Extended Session Data
The fourth section is available on intraday charts only. This section provides two pieces of information: the Extended Session Change and the Pre-Market Volume.
The Extended Session Change indicates the percentage difference between the previous day's closing price and the latest price in the extended session. This gives you the extent and the direction of the price gap that occurred during extended trading hours.
The Pre-Market Volume shows the sum of all shares traded during the pre-market session. This can be helpful in understanding how much interest the stock gained before the market opened.
By default, the two rows will be visible at all times. They will stop updating after the end of their respective time range, and resume updating when it starts again. However, you can choose to automatically hide them outside of their time ranges.
Both the extended session and pre-market time ranges can be customized. Please note that if you select time ranges outside of the regular market session (as set by default), you must enable the extended session to view the corresponding rows.
█ GENERAL NOTES
• Total Shares Outstanding, Float, Average Daily Volume and Pre-Market Volume cells use a customizable color system based on two thresholds, to help you quickly identify whether the value is "too low/acceptable/too high" or "too low/not enough high/acceptable".
• If you cannot see certain data, that simply means it is not available.

BTMM R.NOODLEThis script aims to encompass the style of Traders Reality, Steve M (BTTM), and Stacey Burke (youtube)
yesterday and last wk high and low
Custom watermark with examples (good for fullscreen multicharts)
can set it to show the year and week x of year
Colored candles for ays of week.
The theory behind these colors are that monday and tuesday set your initial balance for the week . having color seperation helps identify the balance
mon-tues = initial balance :green
wed +thu : blue
friday: red
Session boxes and daily initial balance
displays the asian and european trading session as one
displays the ny session first 3 hrs
how to combine sessions, weekly ib, daily ib, and sessions
will add pip lines 00/.50 increments at a later date

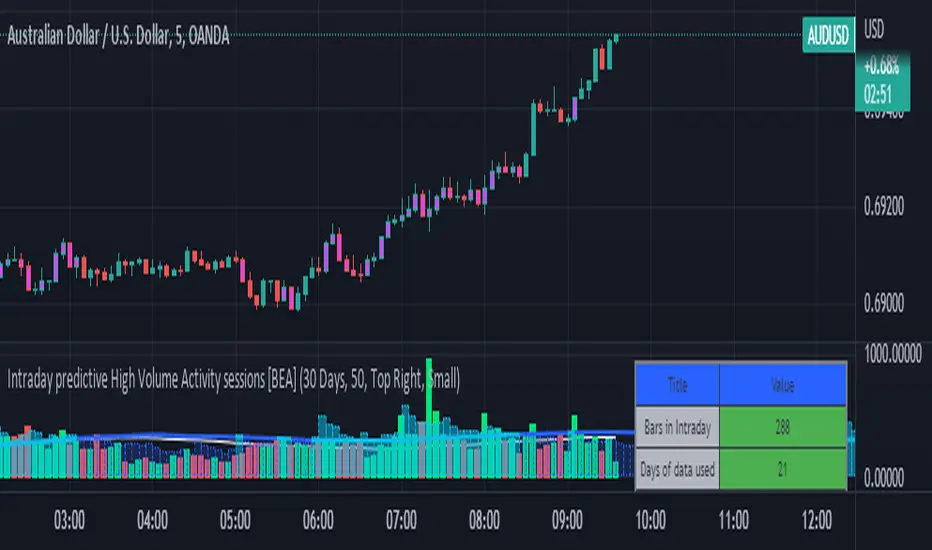
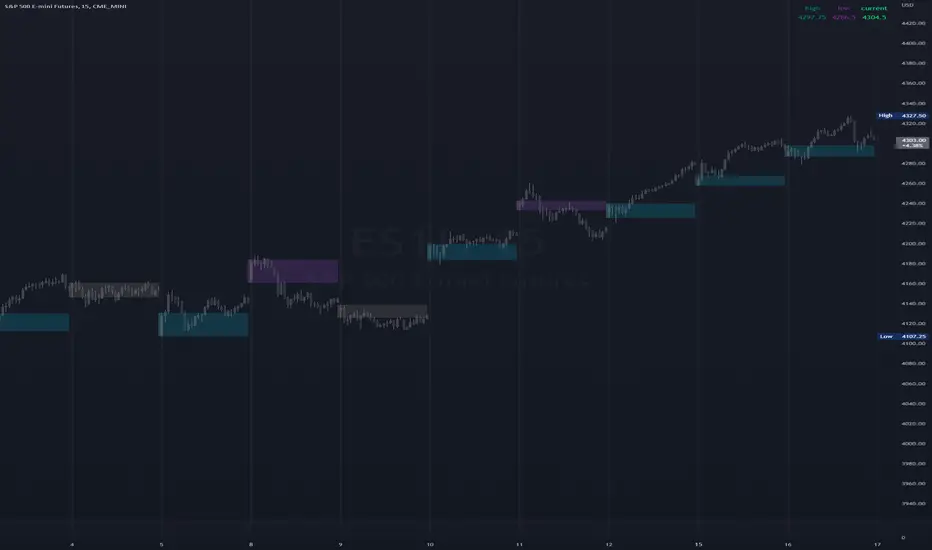
Intraday predictive High Volume Activity sessions [BEA]Idea:
This indicator is designed to know the high traded volume sessions in advance before the day starts.
The predictive volume bars will be plotted in advance once a new trading session starts.
Logic Used:
The basic idea is to store each bar volume / Volume MA data for the selected time. So, the first bar of each data is stored for all selected historical days.
Once the data is stored, I am taking average of each bar data for the selected Historical days.
How to Use:
This gives me an idea of the volume behavior throughout the days based on historical data. So I decide my time of trading for that specific times sessions where the traded volume activity is high.
The bars which are more than the Moving average ( Highlighted Volume bars plotted in future ) is the time session to focus.
Designed only for intraday timeframes.
Here in the image, you can see the session in advance for high traded volume activity.
Try it test it , let me know if it can be improved further.
Have a happy trading.
DISCLAIMER
Any and all liability for risks resulting from investment transactions or other asset dispositions carried out by the user based on information received or a market analysis is expressly excluded by me.
All the information made available here is generally provided to serve as an example only, without obligation and without specific recommendations for action. It does not constitute and cannot replace investment advice. We therefore recommend that you contact your personal financial advisor before carrying out specific transactions and investments.
Do your own research, this is not a financial advice.
AltSessionHello World
It’s no secret that trading sessions play a massive role in market movement and liquidity. We can clearly see in the image about how important identifying international trading hours are for a trader.
The Asian session starts around 1am GMT and often has a bearish bias through this session lasting for a few hours, after which Frankfurt and London traders start to come online and can often reverse the Asian sentiment.
The London session is the best session to trade traditionally starting around 7am GMT before the American traders come online and reverse market once again.
We have designed this indicator to help identify different trading hours easily with a background shade on the chart and also high/lows of the training session, as these levels can often be revisited.
We hope you find this indicator useful and please feel free to drop a comment if you have any updates you wish to be made or any future indicator script ideas, thank you.

Advanced Forex SessionsEssential for ALL Forex Day Traders!
Don't waste your time trading Forex Sessions with little to no volume or volatility!
The Advanced Forex Sessions tool will search through all 4 sessions, tally up the total volume and ticks moved, and show you which session has the most movement.
It will show you the two best sessions on chart and optionally color the background too.
Configure the position & size of the Infographic table as well as custom Forex Session times and colors.

Bollinger BandWidth (Session-Adjusted)Description
This indicator is a session-adjusted version of Bollinger BandWidth (BBW), specifically designed for instruments with limited trading hours, such as European stock indices (e.g., FTSE MIB, DAX, CAC, which trades from 09:00 to 17:30 CET — 8.5 hours) or individual stocks.
Standard Bollinger BandWidth on intraday charts can be distorted because calculations include non-trading periods (flat prices overnight), leading to inaccurate volatility readings.This script dynamically adjusts the Bollinger Bands calculation to approximate daily periods based on the actual trading session length, ensuring the BBW reflects true market volatility during active hours.
Key Features
Session-Adjusted Bollinger Bands:
The lookback period (default 20 days) is converted into an equivalent number of intraday candles based on your chart's timeframe and the session duration. This makes the indicator suitable for intraday timeframes (e.g., 5min, 15min, 1H) on limited-session assets.
Bollinger BandWidth (BBW) as Percentage:
Plots (Upper Band - Lower Band) / Middle Band * 100, a relative measure of volatility (higher values = wider bands = higher volatility).
Dynamic Expansion and Contraction Levels:
Red line: Highest BBW over the selected expansion lookback period (default 25 days) — highlights peak volatility levels.
Green line: Lowest BBW over the selected contraction lookback period (default 25 days) — highlights extreme squeezes (low volatility).
Fully customizable inputs for session hours, BB parameters, and dynamic level periods.
How It Works
Session Adjustment: Input session duration (default 8.5 hours).
The script calculates approximate candles per trading day for your current chart timeframe.
Bollinger Bands are computed using length * candlesPerDay bars, simulating a true multi-day calculation within intraday data.
BBW Calculation:
Basis: Simple Moving Average (SMA).
Deviation: Multiplier × Standard Deviation.
BBW = (2 × Deviation / Basis) × 100.
Dynamic Lines:
Expansion line uses the same session-adjusted period for highest BBW.
Contraction line uses the lowest BBW.
Usage and Trading Ideas
Bollinger BandWidth is a powerful volatility indicator popularized by John Bollinger. Low BBW values indicate band contraction ("Squeeze") — periods of low volatility often followed by strong breakouts. High BBW values indicate expansion — trending or volatile phases that may exhaust and lead to consolidation.
Squeeze Setup:
Watch for BBW dropping toward or below the dynamic low (green) line. This signals potential impending volatility expansion and breakout opportunities.
Expansion Confirmation:
BBW rising above the dynamic high (red) line suggests strong volatility — useful for trend-following or avoiding counter-trend trades.
Combine with price action (e.g., break of support/resistance), volume, or momentum indicators (RSI, MACD) for directional bias.
Ideal for intraday or swing trading on European indices, stocks, or other limited-session instruments where standard BBW would be misleading.
This adjustment makes the indicator more accurate on lower timeframes compared to built-in versions, providing cleaner volatility signals aligned with real trading sessions.
Enjoy the script — feedback welcome!

XAUUSD Session Move Stats (Last 14 Days)This indicator analyzes Gold (XAUUSD) session behavior over the last 14 days and calculates how price typically moves during the Asia, London, and New York sessions.
For each session, it shows:
Average Max Up (%) – how far price moves up from session open
Average Max Down (%) – how far price moves down from session open
Average Net Close (%) – where price typically finishes relative to the session open
The data is calculated session-by-session and displayed in a table, helping traders understand session bias, volatility tendencies, and directional behavior.
Best used on intraday timeframes for session-based analysis and contextual trade planning (signals only, no automated trades).

ICT Asian & London Range + First Presented FVGIndicator: ICT Sessions + First Presented FVG
What it does: This tool automates the markup of key ICT (Inner Circle Trader) timeframes and entry signals. It allows you to trade on higher timeframes (like the 5m or 15m) while the script automatically "looks inside" the 1-minute chart to find specific setups for you.
Key Features:
Session Ranges (Asian & London)
Automatically highlights the Asian Session (8 PM - Midnight NY) and London Open (2 AM - 5 AM NY).
Draws a shaded box for the session's High and Low.
New: Extends the High and Low lines to 4:00 PM NY (end of the trading day) so you can use them as liquidity targets.
The "First Presented" FVG (Sniper Logic)
It detects the very first Fair Value Gap (FVG) that forms on the 1-minute chart immediately after a session starts.
It draws this 1-minute gap on your current chart, regardless of what timeframe you are viewing.
The FVG box automatically extends to the end of the trading day (4 PM NY), showing you where price might return to "mitigate" or react later in the day.

Average Daily Session Range PRO [Capitalize Labs]Average Daily Session Range PRO
The Average Daily Session Range PRO (ADSR PRO) is a professional-grade analytical tool designed to quantify and visualize the probabilistic range behavior of intraday sessions.
It calculates directional range statistics using historical session data to show how far price typically moves up or down from the session open.
This helps traders understand session volatility profiles, range asymmetry, and probabilistic extensions relative to prior performance.
Key Features
Asymmetric Range Modeling: Separately tracks average upside and downside excursions from each session open, revealing directional bias and volatility imbalance.
Probability Engine Modes: Choose between Rolling Window (fixed-length lookback) and Exponential Decay (weighted historical memory) to control how recent or historic data influences probabilities.
Session-Aware Statistics: Calculates values independently for each defined session, allowing region-specific insights (e.g., Tokyo, London, New York).
Dynamic Range Table: Displays key metrics such as average up/down ticks, expected range extensions, and percentage probabilities.
Adaptive Display: Works across timeframes and instruments, automatically aligning with user-defined session start and end times.
Visual Clarity: Includes clean range markers and labels optimized for both backtesting and live-chart analysis.
Intended Use
ADSR PRO is a statistical reference indicator.
It does not generate buy/sell signals or predictive forecasts.
Its purpose is to help users observe historical session behavior and volatility tendencies to support their own discretionary analysis.
Credits
Developed by Capitalize Labs, specialists in quantitative and discretionary market research tools.
Risk Warning
This material is educational research only and does not constitute financial advice, investment recommendation, or a solicitation to buy or sell any instrument.
Foreign exchange and CFDs are complex, leveraged products that carry a high risk of rapid losses; leverage amplifies both gains and losses, and you should not trade with funds you cannot afford to lose.
Market conditions can change without notice, and news or illiquidity may cause gaps and slippage; stop-loss orders are not guaranteed.
The analysis presented does not take into account your objectives, financial situation, or risk tolerance.
Before acting, assess suitability in light of your circumstances and consider seeking advice from a licensed professional.
Past performance and back-tested or hypothetical scenarios are not reliable indicators of future results, and no outcome or level mentioned here is assured.
You are solely responsible for all trading decisions, including position sizing and risk management.
No external links, promotions, or contact details are provided, in line with TradingView House Rules.

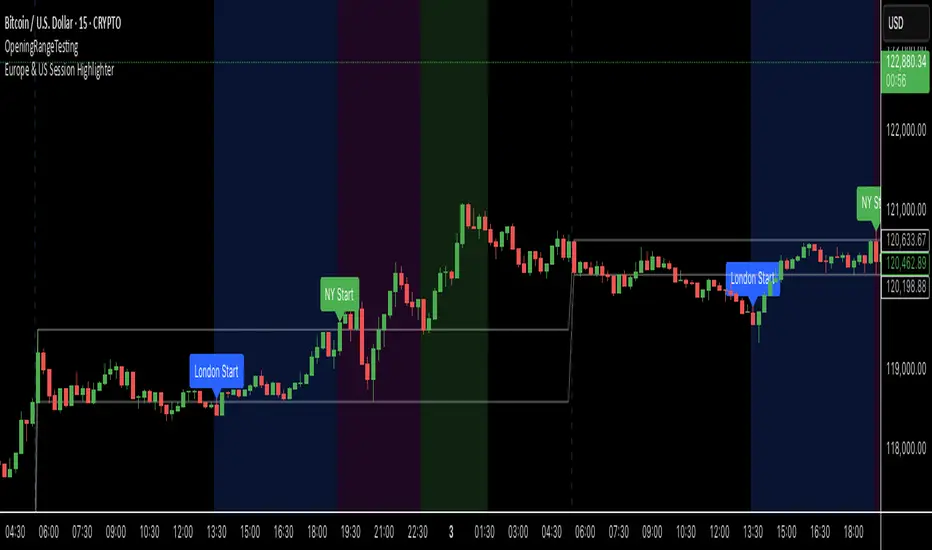
Europe & US Session Highlighter
Bitcoin trading volumes peak during the Europe-US session overlap (13:30–17:00 UTC), driven by institutional activity and market news. This indicator helps traders:
- Focus on high-liquidity periods for better trade execution.
- Avoid low-volume, high-volatility periods outside major sessions.
- Plan entries and exits during Bitcoin’s most active hours.
How to Use:
- Apply the indicator to any Bitcoin intraday chart (e.g., 1M, 5M, 15M).
- Look for blue (London), green (NY), or purple (overlap) backgrounds to identify active sessions.
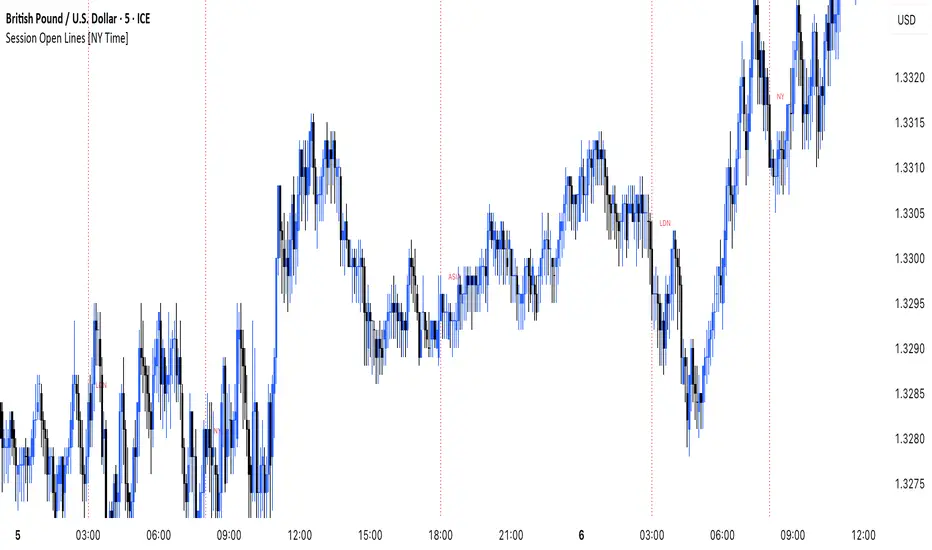
MANI SESSIONSOANDA:GBPUSD This indicator marks the opening times of the three main trading sessions — Asia, London, and New York — using vertical red dotted lines on the chart.
Each session is labeled with a minimal tag (“ASIA”, “LDN”, “NY”) displayed directly on the line for clean and unobtrusive reference.
All session times are based on the New York time zone and adjust automatically for each new day.
This tool helps intraday traders quickly identify session shifts, plan entries around high-volume hours, and stay locked into session-based strategy.
OANDA:GBPUSD
DM Support / Resistance (USA Session)This indicator is specifically designed for use on the 4-hour time frame and helps traders identify key support and resistance levels during the USA trading session (9:30 AM to 4:00 PM Eastern Time). The indicator calculates important price levels to assist in making well-informed entry and exit decisions, particularly for those focusing on swing trades or longer-term intraday strategies. It also includes a feature to skip setups when relevant fundamental news is scheduled, ensuring you avoid trading during periods of high volatility.
Key Features:
Support and Resistance Levels (S1 & R1):
The indicator calculates and displays Support 1 (S1) and Resistance 1 (R1) levels, which act as key barriers for price action and help traders spot potential reversal or breakout zones on the chart.
Pivot Point (PP):
The Pivot Point (PP) is calculated as the average of the previous period's high, low, and close. It serves as a central reference point for market direction, allowing traders to evaluate whether the market is in a bullish or bearish trend.
Market Bias:
The Bias is shown as a histogram that helps traders assess the strength of the market trend. A positive bias suggests bullish sentiment, while a negative bias signals bearish conditions. This can be used to confirm the overall trend direction.
4-Hour Time Frame:
The indicator is optimized for the 4-hour time frame, making it suitable for traders looking for swing trades or those who wish to capture longer-term trends within the USA session. The key support, resistance, and pivot levels are recalculated dynamically to reflect price action over 4-hour periods.
Dynamic Plotting and Alerts:
Support and resistance levels are drawn as dashed horizontal lines, updating in real-time to reflect the most current market data during the USA session. Alerts can be set for significant price movements crossing these levels.
Stop-Loss Strategy Based on 15-Minute Time Frame:
A unique feature of this indicator is its stop-loss strategy, which uses 15-minute time frame support and resistance levels. When a long or short entry is triggered on the 4-hour chart, traders should place their stop-loss according to the relevant 15-minute support or resistance level.
If the price closes above the 15-minute support for a long entry, or closes below the 15-minute resistance for a short entry, it signals the need to exit or adjust your position based on these levels.
Fundamental News Filter:
To avoid unnecessary risk, the indicator incorporates a fundamental news filter. If there is relevant news scheduled during the USA session, such as high-impact economic data or central bank announcements, the indicator will skip the setup for that period. This prevents traders from entering positions during times of elevated volatility caused by news events, which could result in unpredictable price movements.
How to Use:
Long Entry: When the Bias is positive and the price breaks above Support 1 (S1), this signals a potential bullish move. Consider entering a long position at this point.
Stop-Loss Strategy: Set your stop-loss at the respective 15-minute support level. If the price closes below this level, it could signal a reversal, prompting you to exit the trade.
Short Entry: When the Bias is negative and the price breaks below Resistance 1 (R1), this signals a potential bearish move. Enter a short position at this point.
Stop-Loss Strategy: Set your stop-loss at the respective 15-minute resistance level. If the price closes above this level, exit the short trade as it could indicate a bullish reversal.
Pivot Point (PP): The Pivot Point serves as a reference level to gauge potential price reversals. A move above the PP suggests a bullish bias, while trading below the PP suggests a bearish outlook.
Bias Histogram: The Bias Histogram helps confirm trend direction. A positive bias confirms long positions, while a negative bias reinforces short trades.
Avoid Trading During High-Impact News: If there is significant economic news or fundamental events scheduled during the USA session, the indicator will automatically skip any potential setup. This feature ensures you avoid entering trades that might be affected by unexpected news-driven volatility, keeping your trading strategy safer and more reliable.
Why Use This Indicator:
The 4-hour time frame is ideal for traders who prefer swing trading or those looking to capture longer-term trends in a structured manner. This indicator provides crucial insights into market direction, support/resistance levels, and potential entry/exit points.
The stop-loss management based on the 15-minute support and resistance levels helps traders protect their positions from sudden price reversals, ensuring more precise risk management.
The fundamental news filter is particularly useful for avoidance of high-risk periods. By skipping setups during high-impact news events, traders can avoid entering trades when price volatility could be unpredictable.
Overall, this indicator is a powerful tool for traders who want to make data-driven decisions based on technical analysis while ensuring that their positions are managed responsibly and avoiding news-driven risk.

Kviateq - Session Opening RangesThis indicator plots the opening range for each of the market sessions.
Users can chose the length of the opening range, as well as change the time for each of the sessions.
This script is based on opening range breakout strategies, which entail taking a long/short depending on which way the price breaks out.
To trade it, we wait for the session opening range to print, and then we enter upon a candle close.
It's meant to be used on lower timeframes, ideally one hour or lower.
It can be used by itself, but it works even better in combination with other indicators, like moving averages.
Enjoy
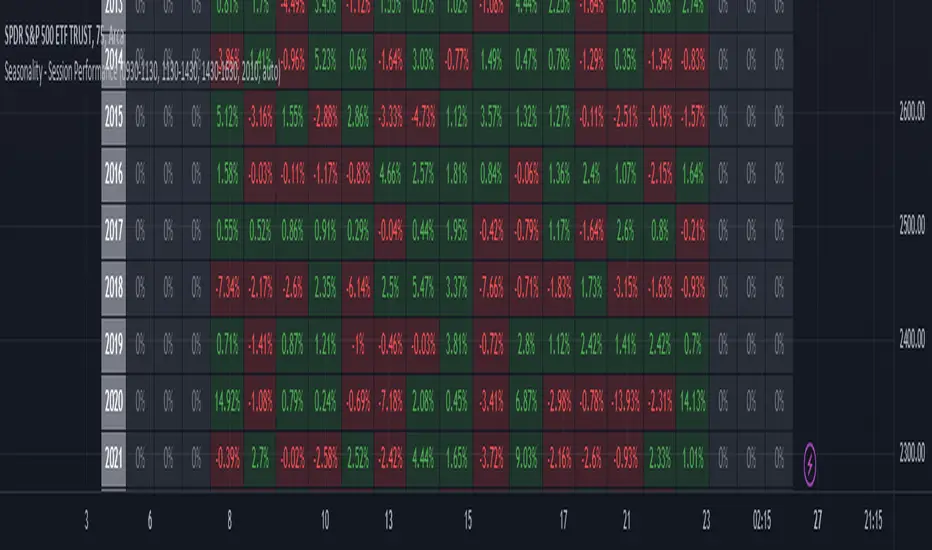
Seasonality - Session Performance - Morning Afternoon EveningUse this indicator on Intraday Timeframe. Higher the timeframe, more the data
This script calculates the performance of an instrument for different sessions.
Session inputs can be updated to study performance of
- Morning vs Afternoon vs Evening
- Pre-Market vs Market vs Post-Market (provided the data feed supports pre and post market)
- Overnight vs Intraday
Three session inputs are provided to tweak the session range
Performance is calculated as session close / session open - 1
Session timeframes can be set for various countries. Make sure the session timeframe aligns with the Candle open/close for the timeframe you choose. Some examples below
US Markets: 0930-1130 1130-1430 1430-1630 Timeframe 1 hour
India Markets: 0915-1030 1030-1415 1415-15:30 Timeframe 75min
High & Low Of Custom SessionThis script boxes a custom session and sets the box at the high and low of the session and draws that box to the next session.
Box color is determined by price in relation to the box position. Box color is set at the start of the next session. This allows
user to lookback at multiple box sets to see how each day closed in relation to the session highlighted.
I have written this for backtesting purposes and intend to expand it to use with volume analysis and gradient color to change the box color based on how many times price tests
the box.
Market Profile with Past SessionsThis script plots market profiles that show the amount of time price has remained at a particular level during past sessions, often referred to as "time price opportunity".
TV user @LonesomeTheBlue created the original Market Profile indicator on which this script is based. This version makes minor changes to the automatic timeframes, and to show historic market profiles and points of control.
The market profile drawing begins at the START of the relevant session being profiled and extends to the right. There is a checkbox in the options that will plot the market profile at the END of the relevant session, if desired.
If you want to view the market profiles for shorter or longer sessions, use the drop down menu to take the Higher Time Frame setting off "Auto", and instead select a specific time interval that is HIGHER than the timeframe your chart is showing.
The market profile and points of control can be used to identify areas likely to serve as potential support or resistance, as well areas where price is likely to retest when it is ranging.

Multi-Session Volume Profile Suite [MarkitTick]💡 This indicator provides a sophisticated, institutional-grade Volume Profile analysis suite that renders multiple temporal profiles simultaneously. It is designed for traders utilizing Auction Market Theory who require a holistic view of where value is being established across Daily, Weekly, and Monthly timeframes, alongside custom intraday sessions. By bypassing standard built-in functions in favor of a custom array-based calculation engine, this tool offers granular control over Value Area logic, Point of Control (POC) migration, and multi-timeframe confluence detection.
✨ Originality and Utility
Standard Volume Profile tools often limit traders to a single timeframe or the visible range of the chart. This creates a fragmented view of the market, where a trader might see the daily value but miss the context of the weekly or monthly auction.
This script solves that problem by layering three distinct higher-timeframe profiles (Daily, Weekly, Monthly) plus three customizable intraday session profiles onto a single chart.
● Key Differentiators
Confluence Detection Engine: The script mathematically calculates when the Points of Control (POC) of different timeframes overlap (e.g., Daily POC inside Weekly POC). It explicitly highlights these high-probability zones with specific labels (e.g., "TRIPLE CONFLUENCE"), automating the search for key support/resistance levels.
POC Migration Tracking: Unlike static profiles, this tool tracks the "Shift" of the POC. It visualizes whether value is migrating higher (▲), lower (▼), or remaining neutral (=) compared to the previous period, providing immediate insight into the trend's acceptance.
Synthetic Chart Protection: The script includes logic to detect and prevent usage on non-standard chart types like Heikin Ashi or Renko, ensuring that the volume data processed is accurate and not subject to the repainting often found in synthetic OHLC variations.
🔬 Methodology and Concepts
The core engine relies on a custom implementation of the Volume Profile formula using dynamic arrays. It does not simply pull pre-calculated data but processes the tick volume of the underlying asset relative to price action.
• Volumetric Binning
The script divides the price range of a specific period (e.g., a Day) into a user-defined number of "rows" (bins). As price trades within a specific bin, the corresponding volume is accumulated.
Point of Control (POC): The bin with the highest accumulated volume is identified as the POC. This represents the "Fair Value" or the mode of the distribution for that period.
Value Area (VA): The script calculates the total volume of the profile and then identifies the range surrounding the POC that contains a specific percentage (default 70%) of that volume. It uses a dual-scanning algorithm that expands upwards or downwards from the POC based on which adjacent row has higher volume, mimicking the auction process of testing prices.
• Exact-Anchor Pivots
Simultaneously, the script tracks "Exact-Anchor" pivots. Unlike standard pivots that settle at the close, these track the absolute High and Low of the period (Daily/Weekly/Monthly) in real-time and extend them until a new period begins.
🎨 Visual Guide
The indicator uses a color-coded hierarchy to distinguish between timeframes. Understanding this visual language is critical for interpreting the data.
● Profile Hierarchy (Default Theme)
Daily Profile (Yellow/Gold): Represents the immediate, short-term auction.
Solid Line: Daily POC.
Dotted Line: Daily Value Area High (VAH) and Low (VAL).
Weekly Profile (Blue): Represents the intermediate auction. A solid Blue line indicates the Weekly POC.
Monthly Profile (Purple): Represents the macro auction. A solid Purple line indicates the Monthly POC.
● Labels and Symbols
Right-Side Labels: At the end of profile lines, text labels display the exact price of the POC.
Shift Arrows (▲ / ▼): Located inside the POC label, these arrows indicate the direction the POC has moved relative to the previous period's POC. An Up arrow (▲) suggests buyers are accepting higher prices.
Confluence Labels: If enabled, a text box appears near price action stating "POC CONFLUENCE" or "TRIPLE CONFLUENCE" when the POCs of different timeframes align within a tight margin.
Block Symbol (⬛): A small block icon may appear above bars to denote the center of a specific session's time window.
● Pivot Lines
Orange Lines: Previous Daily High (PDH) and Low (PDL).
Green Dashed Lines: Previous Weekly High (PWH) and Low (PWL).
Red Dotted Lines: Previous Monthly High (PMH) and Low (PML).
White Dashed Line: New York Midnight Open price (if enabled).
📖 How to Use
This suite is designed for "Contextual Trading." It answers the question: Where are we relative to value?
• Trend Acceptance
Observe the Shift Arrows on the POC labels. In a healthy uptrend, you should see a sequence of Daily and Weekly profiles with (▲) arrows, indicating that the market is validating higher prices as fair value. If price rises but the POC remains lower or shifts down, it may indicate a "weak high" or a potential reversal (divergence between price and value).
• Support and Resistance
The POC lines act as high-probability support and resistance. Price returning to a Weekly (Blue) or Monthly (Purple) POC often results in a reaction, as these are areas of significant historical agreement between buyers and sellers.
• The Confluence Play
Pay special attention when the "Confluence" label appears. When a Daily POC aligns with a Weekly or Monthly POC, that specific price level possesses reinforced structural importance. A rejection from such a level is a strong signal; a breakout through such a level often leads to an explosive move as value transitions rapidly.
⚙️ Inputs and Settings
The script is highly customizable via the settings menu.
● General Settings
Row Resolution: Determines the granularity of the profile. Higher numbers (e.g., 100) create smoother, more detailed profiles but use more calculation resources.
Value Area %: Default is 70.0, representing the standard deviation of value.
Show POC Shift: Toggles the (▲/▼) comparison logic.
● Profile Scope
Show Daily/Weekly/Monthly: Checkboxes to individually enable or disable specific timeframe profiles.
Session Lookback: Controls how many historical days/weeks the profiles are kept on the chart.
● Pivots (PDH/PMH/NYM)
Show Pivots: Enables the High/Low lines for previous periods.
Show NY Midnight: Specifically toggles the opening price of the New York session (00:00 EST).
● Alerts
Approach Distance: Sets the sensitivity (in ticks) for alerts when price nears a key POC level.
🔍 Deconstruction of the Underlying Scientific and Academic Framework
This indicator is grounded in Auction Market Theory (AMT) and statistical distribution analysis.
• The Market as a Mechanism
AMT postulates that the primary purpose of the market is to facilitate trade. Price advertises opportunity, while Time regulates the opportunity. Volume is the validation of that price. When the market spends significant time and transacts significant volume at a specific level, it establishes "Value."
• Gaussian Distribution and Central Limit Theorem
A Volume Profile is essentially a histogram of volume over price, often resembling a Gaussian (Normal) Distribution or "Bell Curve" when the market is balanced.
POC (Mode): The peak of the curve. Mathematically, this is the mode of the dataset—the price occurring with the highest frequency (volume).
Value Area (Standard Deviation): In a normal distribution, approximately 68.2% of data points fall within one standard deviation of the mean. This script defaults to a 70% Value Area to approximate this statistical boundary. Prices outside this area are considered statistically significant anomalies or "imbalanced."
• Confluence and Probability
The "Confluence" feature leverages the intersection of independent datasets. If the mode (POC) of a short-term distribution (Daily) aligns with the mode of a long-term distribution (Weekly), the probability of that price representing "True Value" increases exponentially. This aligns with statistical principles where overlapping data clusters suggest a stronger underlying signal amidst market noise.
⚠️ Disclaimer
All provided scripts and indicators are strictly for educational exploration and must not be interpreted as financial advice or a recommendation to execute trades. I expressly disclaim all liability for any financial losses or damages that may result, directly or indirectly, from the reliance on or application of these tools. Market participation carries inherent risk where past performance never guarantees future returns, leaving all investment decisions and due diligence solely at your own discretion.

Saptx Trading Time Ranges v2Saptx – Trading Time Ranges is a session-based market timing indicator designed for traders who focus on specific intraday trading windows rather than constant screen time.
The indicator highlights predefined key trading times using vertical ranges and reference lines, allowing traders to quickly identify when to actively look for trade setups during live trading, backtesting, or TradingView Replay Mode.
Unlike many session indicators, this tool is specifically engineered to work reliably in Replay Mode without auto-scale or zoom distortions.
Once a trading window has ended, its range automatically freezes to the true High and Low of that session, providing clean and stable historical reference levels.
────────────────────
CORE FEATURES
────────────────────
• Session-based trading time ranges
• Automatic High & Low range detection
• Ranges freeze after the session window ends
• Clean and non-intrusive chart visuals
• Replay and backtesting optimized logic
• No auto-scale or zoom distortion issues
────────────────────
SESSION WINDOWS
────────────────────
• Frankfurt Open
• London Open
• MMM1
• MMM2
• New York Open
• New York Trap
• Market Closing
────────────────────
BACKTEST & REPLAY
────────────────────
• Displays previous, current, and next trading day
• Fast navigation to key trading windows in Replay Mode
• Designed for efficient historical trade review
• Stable behavior while scrolling and zooming the chart
────────────────────
CUSTOMIZATION
────────────────────
• Adjustable UTC offset (Winter / Summer time support)
• Custom colors and transparency for ranges and lines
• Clean session labels with optional visibility
• Optional next-session countdown timer
────────────────────
IMPORTANT NOTE
────────────────────
This indicator does NOT generate trade signals.
It is a visual timing and structural tool intended to support discretionary and session-based trading strategies.
────────────────────
RECOMMENDED MARKETS & TIMEFRAMES
────────────────────
• Forex (EUR/USD, GBP/USD, DXY, etc.)
• Intraday timeframes (M5, M15, H1)
