Seasonality Calculator Custom Date Range AnalysisThe Seasonality Calculator lets you manually test any seasonal window by choosing a start day/month and end day/month, and then evaluating how that exact period performed historically.
For the selected date range, the script looks back over past years and calculates:
Average return
Hit rate (win rate)
Winning years vs. total years
The results are displayed in a compact on-chart table showing:
Entry date & exit date (calendar days)
Pattern length
Average return & hit rate
Win/trade count
Optionally, the indicator can also draw highlighted boxes for each year of the chosen seasonal window, so you can visually inspect how that specific date range behaved in the past.
You can:
Choose the exact start and end dates (day & month),
Set how many years of history to include,
And filter by simple regimes such as US election cycle years.
All calculations are based on daily data, and the math is consistent with the Seasonality Screener: if you take a pattern from the Screener and enter the same dates into this Calculator, you will get the same historical statistics.
Use this tool to experiment with custom seasonal ideas and to fine-tune windows you discover with the Screener, always in combination with your own analysis and risk management.
"screener" için komut dosyalarını ara

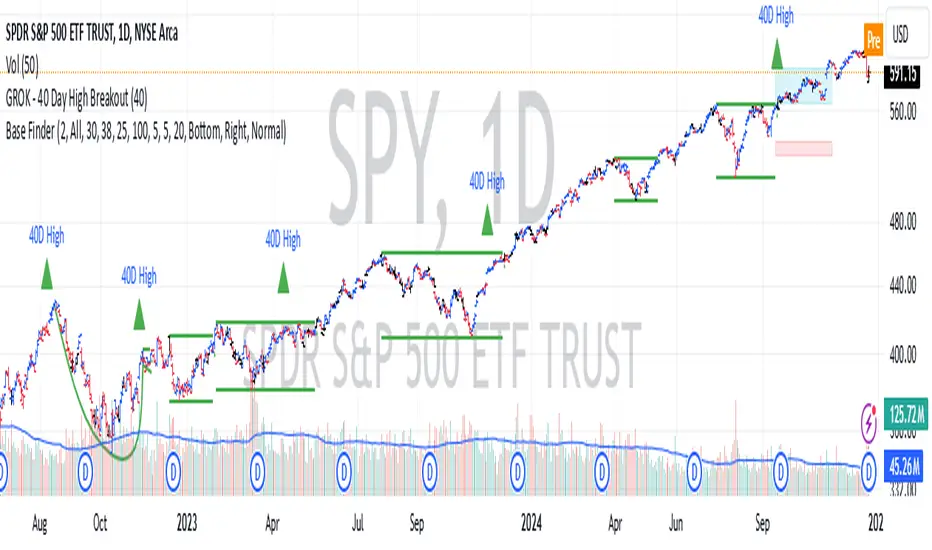
GROK - 40 Day High BreakoutTitle: GROK - Customizable High Breakout Detector
To scan base breakout with Pine Screener
Description:
This Pine Script indicator identifies high breakout patterns based on a user-defined lookback period. By default, it checks for a breakout of the 40-day high, but the period can be adjusted to suit your trading strategy. Key features include:
Custom Lookback Period: Easily modify the number of days for high breakout detection. Lookback period is length of base you want to scan using pine screener.
Visual Alerts: Displays a green triangle above the price bar when a breakout is detected.
Alert Conditions: Built-in alert notifications for automated breakout detection.
Screener Compatibility: Plots breakout signals as a histogram for screener use.
This script is ideal for traders looking to identify strong breakout patterns and incorporate them into their strategies.
How to Use:
Adjust the lookback period in the settings to match your desired breakout criteria.
Add alerts for automated notifications when a breakout is detected.
Use the visual markers and histogram to analyze breakout patterns on your chart.
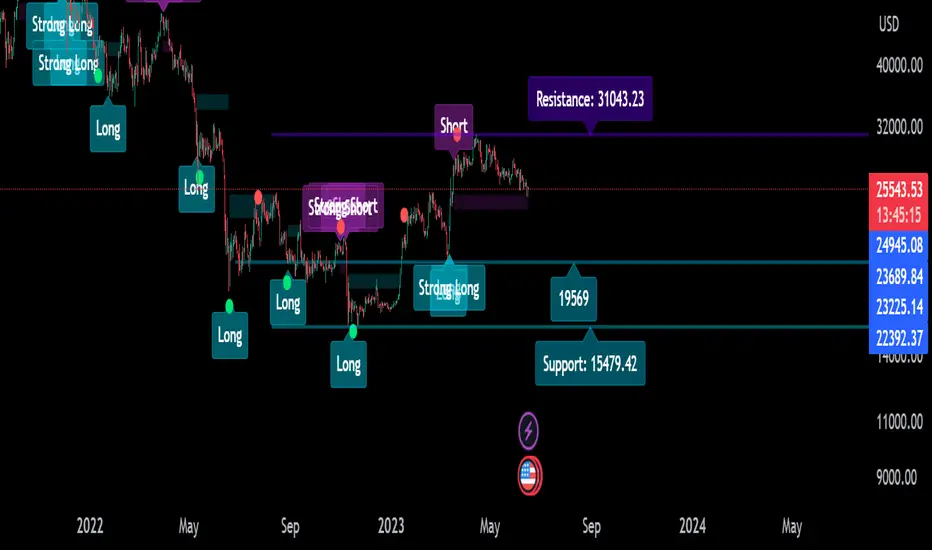
Quantum TrendQuantum Trend indicator is our new tool to trade on futures and spot markets in the world of cryptocurrency.
This indicator uses some advanced techniques to determine price reversals and filter them out with other indicators, such as oscillators ( Stochastic RSI and etc. ) and trend-based indicators ( such as EMA and others ), but even after filtering signals with these tools Quantum Trend indicator then applies our own private algorithm, based on our modified z-score mertic, which reduces lag drastically and helps find good entries faster.
What algo is behind the signals?
For finding new entries we used RSI- and stochastic-based oscillators, which help us determine potential price reversal movements. When new entry is found, we filter it through our own stochastic RSI filter (takes stoch RSI's pivot points into account to find better entries; pivot points left and right bars are hard coded into the indicator) with our private indicators, based on close-to-close volatility filter methods, to understand whether or not entry valid enough. Why stochastic RSI? Because it is much less messy than most of other existing oscillators (by our own opinion and experience).
That was first filtering stage, now comes the second .
In the second phase we filter out signals even more with our own modified-standard-deviation-based indicators ( not Bollinger Bands! ) to determine whether or not price went above or below 2 sigma channel, which would mean that current price's movement is extremely rare (because for going above 2 sigma or below -2 sigma there is only 5% chance (classic Gaussian distribution)) and the reversal will probably happen soon.
If signal passed all two phases of filtering, it will be showed on the chart.
Over all, this indicator uses our own private indicators, based on some core concepts, which we described above ( classic Gaussian distribution for choosing signals with nice reversal moments , close-to-close volatility for understanding if market is volatile enough to make a good move , modified z-score metric for reducing lag and finding entries faster , own stoch RSI filter with pivot points for reducing lag and finding good reversal moments and etc. )
That's for idea reveal, now let's dive into the settings!
Indicator settings
Main Algo Settings — group of settings of the core algorithm, that forms signals.
Signal Length * — determines how many bars from the past should be taken to make a signal.
Signal Factor * — determines the threshold for signal quality.
* — the more this parameter is, the less signals you will get, but they will be more high-quality.
Signals to Show — determines which type of signals will be displayed on the chart:
Classic — Long/Short signals;
Strong — Strong Long/Short signals;
All — Classic + Strong signals;
Signal Colours — group of settings for customizing signals' colours.
Long — colour for Long signals
Short — colour for Short signals
Strong Long — colour for Strong Long signals
Strong Short — colour for Strong Short signals
Filter for Strong Signals — group of settings for strong signals.
Use Strong Signals? — enabling/disabling strong signals on the chart;
Apply this filter to Strong Signals? — enabling/disabling filter for strong signals. When disabled, strong signals won't be filtered and there will be a lot more signals on the chart, but with less quallity.
Fast Period * — number of bars for 1st group of candles to form a signal;
Slow Period * — number of bars for 2nd group of candles to form a signal ( we need these two groups to align short-term with long-term trend );
Additional Filter Period * — period for filter indicator, which cuts out bad strong signals;
Additional Filter Smoother Period * — period for filter indicator's smoother, which makes additionally smoothes signals to filter out bad ones;
Filter's source — price souce for the filter ( open, close, hl2 and etc. ).
* — the more this parameter is, the less signals you will get, but they will be more high-quality.
2nd Filter — group of settings for the 2nd filter, which cuts out bad signals from Main Algo.
Enable 2nd Filter? — enabling/disabling 2nd filter. When diasbled, there wiull be a lot more signals on the chart, but with less quality;
2nd Filter Length — period for the indicator, which is embedded in 2nd filter. Based on improved RSI;
OverBought Lvl — level, which indicates that asset is probably overbought ;
OverSold Lvl — level, which indicates that asset is probably oversold ;
TP/SL Settings — Take-Profit/Stop-Loss settings
Use TP? — Show take profits on the chart
TP Mode — Take Profit mode (either zone or 3 levels (drawn on the chart))
Take-Profit 1, 2, 3 Factor — Multiplier/factor for the 1st, 2nd, 3rd take-profits accrodingly . Determines the width of the take profits/zone (the higher the factor, the further the take profits are located from the entry point)
SL Factor — Multiplier/factor for the stop loss (line on the chart; not displayed if the take profit mode is set to zone)
Whales Screener — screener, that shows where whales buy (green zones) and sell (red zones).
Use Whales Screener? — enabling/disabling whales screener.
Support & Resistance Settings — group of settings for support and resistance lines.
Support Color — Support color;
Resistance Color — Resistance color;
S/R Strength — Strength of support and resistance lines. The greater it is, the more reliable the S/R lines will be;
Line Style — style of each S/R line ( solid, dotted, dashed );
Zone Width, % — Zone width in percentage of the price fro the last 250 bars;
Extend S/R Lines — Extend the S/R lines to the right and left.
What timeframes to use?
This indicator was built to work on any timeframe, but our practice shows that it works best on higher timeframes such 30 minutes and more, but you should find by yourself which timeframe suits you best.
What markets can this indicator be applied to?
This indicator is market-indifferent, which means that you can use this indicator on any possible market.
How should I use this indicator?
Quantum Trend indicator can be a useful tool for finding entries and confirming signals from your own trading system, as it is built with multiple signal filter layers, which drastically reduce amount of bad signals. Also it is better to use other indicators to confirm signals, produced by Quantum Trend, because this way you will get even more high-quality signals.
Does it repaint?
No, this indicator doesn't repaint.
IMPORTANT, PLEASE READ!
This is indicator is not a Holy Grail of trading and we DON'T promote it as such in any possible way. As any possible indicator, Quantum Trend uses price data of the past, which CAN NOT guarantee perfect price predicitions of the future!
Hope this indicator will help you make a much better trading decisions!
Momentum Day Trading ToolkitMomentum Day Trading Toolkit
Complete User Guide
Table of Contents
Overview
Quick Start
The Dashboard
Module 1: 5 Pillars Screener
Module 2: Gap & Go
Module 3: Bull Flag / Flat Top
Module 4: Float Rotation
Module 5: R2G / G2R
Module 6: Micro Pullback
Signal Reference
Quality Score
Settings Guide
Alerts Setup
Trading Workflows
Troubleshooting
Overview
The Momentum Day Trading Toolkit combines 6 powerful indicators into one unified system for day trading momentum stocks.
ModulePurpose① 5 PillarsConfirms stock is "in play"② Gap & GoPre-market levels & gap analysis③ Bull Flag / Flat TopClassic breakout patterns④ Float RotationMeasures true interest level⑤ R2G / G2RTracks prior close crosses⑥ Micro PullbackPrecision continuation entries
All modules work together - the dashboard shows you everything at a glance, and you can enable/disable any module you don't need.
Quick Start
Step 1: Add to Chart
Add the indicator to any stock chart
Recommended timeframes: 1-minute, 5-minute, or 15-minute
Step 2: Check the Dashboard (Top Right)
Look for:
Status = Current state (Scanning, Entry Signal, etc.)
Quality Score = Setup rating out of 10
Green checkmarks (✓) = Criteria passing
Step 3: Watch for Entry Signals
Triangles, circles, diamonds below bars = Entry signals
Arrows = R2G/G2R crosses
Step 4: Set Alerts
Right-click chart → Add Alert
Select "Momentum Day Trading Toolkit"
Choose your alert condition
The Dashboard
The dashboard in the top-right corner gives you instant analysis:
┌─────────────────────────────┐
│ MOMENTUM TOOLKIT │
├─────────────────────────────┤
│ Status │ 🎯 ENTRY SIGNAL │
│ Day │ 🟢 GREEN │
│ Gap │ +8.5% 🔥 │
│ RVol │ 3.2x ✓ │
│ Rotation │ 1.45x 🔥 │
│ Float │ 5.2M 🔥 │
│ Change │ +12.3% ✓ │
│ Pattern │ BULL FLAG! │
│ EMA 9/20 │ Above Both ✓ │
│ VWAP │ Above ✓ │
│ Prior Cl │ 5.91 │
│ PM High │ 9.11 ✓ │
│ Price │ 9.46 ✓ │
└─────────────────────────────┘
Dashboard Row Reference
RowWhat It ShowsGood ValuesStatusCurrent state🎯 ENTRY SIGNALDayGreen/Red vs prior close🟢 GREENGapGap % from prior close🔥 (5%+) or 🔥🔥 (10%+)RVolRelative volume✓ (2x+) or ✓✓ (5x+)RotationFloat rotation🔥 (1x) or 🔥🔥 (2x+)FloatFloat in millions🔥 (<5M) or Low (<10M)ChangeDaily % change✓ (meets minimum)PatternPattern statusBREAKOUT!EMA 9/20Trend positionAbove Both ✓VWAPVWAP positionAbove ✓Prior CloseKey R2G levelReference pricePM HighPre-market high✓ = Above itPriceCurrent price✓ = In range
Status Messages
StatusMeaningActionScanning...Looking for setupsWait✅ ALL PILLARSStock qualifiesWatch for pattern⏳ PATTERN FORMINGSetup developingGet ready🎯 ENTRY SIGNALSignal triggeredExecute trade
Module 1: 5 Pillars Screener
What It Does
Confirms the stock meets basic criteria to be worth trading.
The 5 Pillars
PillarDefaultWhy It MattersRelative Volume2x+ (5x for "strong")Confirms unusual interestDaily Change5%+Stock is movingPrice Range$1-$20Sweet spot for momentumFloat Size<20M sharesLower float = bigger moves
Visual Indicator
Green background appears when ALL pillars pass
Dashboard Shows
Individual pillar status with ✓ checkmarks
Quality score includes pillar factors
Settings
SettingDefaultDescriptionMin RVol2.0xMinimum relative volumeStrong RVol5.0xVolume for full qualificationMin Change5%Minimum daily moveMin Price$1Minimum stock priceMax Price$20Maximum stock priceMax Float20MMaximum float size
Module 2: Gap & Go
What It Does
Analyzes pre-market gaps and displays key price levels.
Key Levels Displayed
LevelColorDescriptionPrior CloseOrangeYesterday's close - THE key levelPM HighGreenPre-market high - breakout levelPM LowRedPre-market low - support
Gap Classification
Gap SizeRatingMeaning5-9.9%🔥 QualifyingWorth watching10%+🔥🔥 StrongHigh priority
Entry Signal
Small green triangle = PM High Breakout
How to Trade
Stock gaps up in pre-market
Wait for market open
Look for break above PM High
Enter on breakout with stop below PM Low
Settings
SettingDefaultDescriptionMin Gap %5%Qualifying gap thresholdStrong Gap %10%Strong gap thresholdShow PM LevelsONDisplay PM high/low lines
Module 3: Bull Flag / Flat Top
What It Does
Detects classic continuation patterns and signals breakouts.
Bull Flag Pattern
▲ BREAKOUT (Entry Signal)
│
┌────┴────┐
│ Pullback │ ← 2-5 red candles
│ (flag) │ Max 50% retrace
└─────────┘
│
┌────┴────┐
│ Pole │ ← 3+ green candles
│ (move) │ Strong momentum
└─────────┘
Flat Top Pattern
═══════════════ Resistance (2+ touches)
│
▲ BREAKOUT above resistance
Entry Signals
SignalShapeColorPatternBull Flag Breakout▲ TriangleLimeFlag breaks upFlat Top Breakout◆ DiamondAquaResistance breaks
How to Trade Bull Flag
See 3+ green candles (the pole)
Price pulls back 2-5 red candles
Pullback stays above 50% of move
Enter on break above pullback high
Stop below pullback low
Settings
SettingDefaultDescriptionMin Pole Candles3Green candles neededMax Pullback5Max red candles allowedMax Retrace50%Max pullback depthFT Touches2Resistance touches neededFT Lookback10Bars to check for resistance
Module 4: Float Rotation
What It Does
Tracks how many times the entire float has traded hands today.
The Formula
Rotation = Cumulative Day Volume ÷ Float
Rotation Levels
RotationEmojiMeaning0.5x—Half float traded1.0x🔥FULL rotation - significant!2.0x🔥🔥Double rotation - extreme3.0x+🔥🔥🔥Triple rotation - rare event
Why It Matters
High rotation = Extreme interest
Everyone who owns shares has likely traded
Often precedes explosive moves
Shows "real" demand beyond just volume
Dashboard Shows
Current rotation level
Fire emojis for milestones
Settings
SettingDefaultDescriptionFloat SourceAutoAuto-detect or manualManual Float10MIf auto fails, use thisAlert Level1.0xAlert when rotation hits this
Module 5: R2G / G2R
What It Does
Tracks when price crosses the prior day's close - a key psychological level.
Red to Green (R2G) 🟢
Prior Close ─────────────────
↗ CROSS TO GREEN
↗
(opened red)
Stock opened below prior close (red)
Crosses above prior close (green)
BULLISH signal
Green to Red (G2R) 🔴
(opened green)
↘
↘ CROSS TO RED
Prior Close ─────────────────
Stock opened above prior close (green)
Crosses below prior close (red)
BEARISH signal
Entry Signals
SignalShapeColorMeaningR2G↑ ArrowLimeCrossed to greenG2R↓ ArrowRedCrossed to red
Why R2G Matters
Bears who shorted get squeezed
Creates FOMO buying
Prior close becomes support
Momentum often continues
Dashboard Shows
Current day status (🟢 GREEN / 🔴 RED)
Whether R2G or G2R occurred (R2G ✓ or G2R ✓)
Settings
SettingDefaultDescriptionRequire Opposite OpenONR2G needs red openShow Prior CloseONDisplay the line
Module 6: Micro Pullback
What It Does
Finds precision entries on brief 1-3 candle pullbacks after strong moves.
The Pattern
▲ ENTRY (break pullback high)
│
┌──┴───┐
│ 1-3 │ ← Micro pullback (brief!)
│ red │ Stop = low of this
└──────┘
│
┌──┴───┐
│ 3+ │ ← Strong move
│green │ Momentum building
└──────┘
Why Micro Pullbacks Work
Tight stop = Pullback low is close
Momentum intact = Only paused briefly
Early entry = Catch continuation early
Clear trigger = Break of pullback high
Entry Signal
SignalShapeColorMicro Pullback Entry● CircleYellow
How to Trade
See 3+ green candles (strong move)
1-3 red candles (brief pause)
Pullback stays above 50% retrace
Enter when green candle breaks pullback high
Stop at pullback low
Settings
SettingDefaultDescriptionMin Green Candles3Candles before pullbackMax Pullback3Max red candlesMax Retrace50%Max pullback depth
Signal Reference
All Entry Signals (Below Bar)
ShapeColorSignalModule▲ Large TriangleLimeBull Flag BreakoutPatterns◆ DiamondAquaFlat Top BreakoutPatterns● CircleYellowMicro Pullback EntryMicro PB▲ Small TriangleGreenPM High BreakoutGap & Go↑ ArrowLimeRed to GreenR2G/G2R
Warning Signals (Above Bar)
ShapeColorSignalModule↓ ArrowRedGreen to RedR2G/G2R
Optional Forming Signals (Disabled by Default)
ShapeColorSignal🚩 FlagFaded LimeBull Flag Forming● CircleFaded YellowMicro PB Forming
Enable "Show 'Forming' Markers" in settings to see these
Quality Score
The quality score (0-10) rates the overall setup strength.
Scoring Breakdown
FactorPointsRVol 5x++2RVol 2x++1Daily change 5%++1Low float (<20M)+1Strong gap (10%+)+2Qualifying gap (5%+)+1Rotation 1x++2Rotation 0.5x++1Above EMA 20+1
Score Interpretation
ScoreGradeAction8-10A+Best setups - full position6-7AGood setups - standard size4-5BAverage - reduced size0-3CWeak - skip or paper trade
Settings Guide
Module Toggles
Turn each module ON/OFF:
SettingDefaultDescription① 5 Pillars ScreenerONStock qualification② Gap & Go AnalysisONGap & level analysis③ Bull Flag / Flat TopONPattern detection④ Float RotationONRotation tracking⑤ R2G / G2R TrackerONPrior close crosses⑥ Micro PullbackONPullback entries
Visual Settings
SettingDefaultDescriptionShow DashboardONDisplay info tableTable SizeNormalSmall/Normal/LargeShow Entry SignalsONDisplay entry shapesShow 'Forming' MarkersOFFShow pattern formingShow Key LevelsONPrior close, PM levelsShow EMA 9/20ONTrend EMAsShow VWAPONVWAP line
Recommended Presets
Minimal (Clean Chart)
Show Dashboard: ON
Show Entry Signals: ON
Show 'Forming' Markers: OFF
Show Key Levels: OFF
Show EMA: OFF
Show VWAP: OFF
Standard (Balanced)
All defaults
Full Analysis
All settings ON
Alerts Setup
Available Alerts
AlertTriggerAny Bullish EntryAny entry signal firesBull Flag BreakoutBull flag breaks outFlat Top BreakoutFlat top breaks outMicro Pullback EntryMicro PB triggersPM High BreakoutBreaks above PM highRed to GreenR2G crossGreen to RedG2R crossFloat RotationHits rotation level5 Pillars PassAll pillars qualifyPattern FormingPattern starts formingHigh Quality EntryEntry with score 7+/10
How to Set Alerts
Right-click on chart
Select "Add Alert"
Condition: "Momentum Day Trading Toolkit"
Select alert type from dropdown
Set expiration and notifications
Click "Create"
Recommended Alerts
For Active Trading:
Any Bullish Entry
High Quality Entry
For Watchlist Monitoring:
5 Pillars Pass
Float Rotation
Trading Workflows
Workflow 1: Full Qualification
Step 1: 5 PILLARS
└─→ Wait for "✅ ALL PILLARS" status
Step 2: CHECK SETUP
└─→ Quality score 6+?
└─→ Above EMA and VWAP?
Step 3: WAIT FOR ENTRY
└─→ Bull Flag, Flat Top, or Micro PB signal
Step 4: EXECUTE
└─→ Enter on signal
└─→ Stop below pattern low
└─→ Target 2:1 minimum
Workflow 2: Gap & Go
Step 1: PRE-MARKET
└─→ Stock gaps 5%+ (shows in Gap row)
Step 2: MARKET OPEN
└─→ Note PM High level (green line)
Step 3: WAIT FOR BREAK
└─→ PM High Breakout signal (small triangle)
Step 4: CONFIRM
└─→ R2G if opened red (double confirmation)
└─→ RVol 2x+
Step 5: EXECUTE
└─→ Enter on PM High break
└─→ Stop below PM Low
Workflow 3: Micro Pullback Scalp
Step 1: FIND MOMENTUM
└─→ Stock moving, 3+ green candles
Step 2: WAIT FOR PAUSE
└─→ 1-3 red candles (brief pullback)
Step 3: ENTRY
└─→ Yellow circle signal appears
Step 4: QUICK TRADE
└─→ Enter at signal
└─→ Tight stop at pullback low
└─→ Quick target (1:1 to 2:1)
Troubleshooting
Q: Lines are moving/jumping on real-time chart?
A: This was fixed in latest version. Make sure you have the newest code. Lines now lock in place at market open.
Q: Too many signals, chart is cluttered?
A:
Turn off "Show 'Forming' Markers"
Disable modules you don't need
Use "Minimal" visual preset
Q: No signals appearing?
A:
Check if "Show Entry Signals" is ON
Make sure relevant module is enabled
Stock may not meet pattern criteria
Q: Dashboard shows wrong float?
A:
TradingView float data isn't available for all stocks
Switch Float Source to "Manual"
Enter correct float in millions
Q: PM High/Low not showing?
A:
Only appears during market hours
Needs pre-market data to calculate
Check if "Show Key Levels" is ON
Q: Quality score seems wrong?
A:
Score updates in real-time
Check individual factors in dashboard
RVol and rotation change throughout day
Q: Alert not triggering?
A:
Make sure alert is set on correct symbol
Check alert hasn't expired
Verify condition is set correctly
Quick Reference Card
Entry Signals
▲ Lime Triangle = Bull Flag Breakout
◆ Aqua Diamond = Flat Top Breakout
● Yellow Circle = Micro Pullback
▲ Green Triangle = PM High Break
↑ Lime Arrow = R2G (bullish)
↓ Red Arrow = G2R (bearish)
Dashboard Quick Read
🎯 = Entry signal active
✅ = All pillars pass
🟢 = Day is green
🔥 = Strong (gap/rotation)
✓ = Criteria met
✗ = Criteria failed
Quality Score
8-10 = A+ (Best)
6-7 = A (Good)
4-5 = B (Average)
0-3 = C (Weak)
Key Levels
Orange Line = Prior Close (R2G level)
Green Line = PM High (breakout level)
Red Line = PM Low (support)
Purple Line = VWAP
Yellow/Orange = EMA 9/20
Happy Trading! 🎯📈
For questions or issues, use TradingView's comment section on the indicator page.

ICT Levels Breach Scanner (12M Timeframe)Detects and scans for breaches of key Inner Circle Trader (ICT) concepts on the yearly (12M) chart: Swing Lows (3-bar wick pivots), Rejection Blocks (3-bar body pivots), Fair Value Gaps (3-bar inefficiencies), and Volume Imbalances (bullish body gaps ≥0.15%, unmitigated).
Features:
Tracks active levels with arrays for real-time breach detection (price low below any level triggers alert).
Visuals: Blue solid lines (Swing Lows), orange dashed (Rejection Blocks), purple dotted (FVGs), green boxes (VIs)—all extending right.
Red triangle + bgcolor alert on breach bar; built-in alertcondition for notifications.
Optimized for Pine Screener: Filter stocks (e.g., US exchanges) showing symbols where price has traded below these levels on the latest 12M bar.
Usage: Apply to a 12M chart for viz, or add to Screener > Pine tab for multi-symbol scans. Customize gap % or add bearish variants via inputs. Ideal for spotting potential support in long-term trends.
ICT-inspired; test on liquid stocks like AAPL/TSLA. Not financial advice.

Session-Conditioned Regime ATRWhy this exists
Classic ATR is great—until the open. The first few bars often inherit overnight gaps and 24-hour noise that have nothing to do with the intraday regime you actually trade. That inflates early ATR, scrambles thresholds, and invites hyper-recency bias (“today is crazy!”) when it’s just the open being the open.
This tool was built to:
Separate session reality from 24h noise. Measure volatility only inside your defined session (e.g., NYSE 09:30–16:00 ET).
Judge candles against the current regime, not the last 2–3 bars. A rolling statistic from the last N completed sessions defines what “typical” means right now.
Label “large” and “small” objectively. Bars are colored only when True Range meaningfully departs from the session regime—no gut feel, no open-bar distortion (gap inclusion optional).
Overview
Purpose: objectively identify unusually big or small candles within the active trading session, compared to the recent session regime.
Use cases: volatility filters, entry/exit confirmation, session bias detection, adaptive sizing.
This indicator replaces generic ATR with a session-conditioned, regime-aware measure. It colors candles only when their True Range (TR) is abnormally large/small versus the last N completed sessions of the same session window.
How it works
Session gating: Only bars inside the selected session are evaluated (presets for NYSE, CME RTH, FX NY; custom supported).
Per-bar TR: TR = max(high, prevRef) − min(low, prevRef).
prevRef is the prior close for in-session bars.
First bar of the session can include the overnight gap (optional; default off).
Regime statistic: For any bar in session k, aggregate all in-session TRs from the previous N completed sessions (k−N … k−1), then compute Median (default) or Mean.
Today’s anchor: Running statistic from today’s session start → current bar (for context and the on-chart ratio).
Color logic:
Big if TR ≥ bigMult × RegimeStat
Small if TR ≤ smallMult × RegimeStat
Colored states: big bull, big bear, small bull, small bear.
Non-triggering bars retain the chart’s native colors.
Panel (top-right by default)
Regime ATR (Nd): session-conditioned statistic over the past N completed sessions.
Today ATR (anchored): running statistic for the current session.
Ratio (Today/Regime): intraday volatility vs regime.
Sample size n: number of bars used in the regime calculation.
Inputs
Session Preset: NYSE (09:30–16:00 ET), CME RTH (08:30–15:00 CT), FX NY (08:00–17:00 ET), Custom (session + IANA timezone).
Regime Window: number of completed sessions (default 5).
Statistic: Median (robust) or Mean.
Include Open Gap: include overnight gap in the first in-session bar’s TR (default off).
Big/Small thresholds: multipliers relative to RegimeStat (defaults: Big=1.5×, Small=0.67×).
Colors: four independent colors for big/small × bull/bear.
Panel position & text size.
Hidden outputs: expose RegimeStat, TodayStat, Ratio, and Z-score to other scripts.
Alerts
RegimeATR: BIG bar — triggers when a bar meets the “Big” condition.
RegimeATR: SMALL bar — triggers when a bar meets the “Small” condition.
Hidden outputs (for strategies/screeners)
RegimeATR_stat, TodayATR_stat, Today_vs_Regime_Ratio, BarTR_Zscore.
Notes & limitations
No look-ahead: calculations only use information available up to that bar. Historical colors reflect what would have been known then.
Warm-up: colors begin once there are at least N completed sessions; before that, regime is undefined by design.
Changing inputs (session window, multipliers, median/mean, gap toggle) recomputes the full series using the same rolling regime logic per bar.
Designed for standard candles. Styling respects existing chart colors when no condition triggers.
Practical tips
For a broader or tighter notion of “unusual,” adjust Big/Small multipliers.
Prefer Median in markets prone to outliers; use Mean if you want Z-score alignment with the panel’s regime mean/std.
Use the Ratio readout to spot compression/expansion days quickly (e.g., <0.7× = compressed session, >1.3× = expanded).
Roadmap
More session presets:
24h continuous (crypto, index CFDs).
23h/Globex futures (CME ETH with a 60-minute maintenance break).
Regional equities (LSE, Xetra, TSE), Asia/Europe/NY overlaps for FX.
Half-day/holiday templates and dynamic calendars.
Multi-regime comparison: track multiple overlapping regimes (e.g., RTH vs ETH for futures) and show separate stats/ratios.
Robust stats options: trimmed mean, MAD/Huber alternatives; optional percentile thresholds instead of fixed multipliers.
Subpanel visuals: rolling TodayATR and Ratio plots; optional Z-score ribbon.
Screener/strategy hooks: export boolean series for BIG/SMALL, plus a lightweight strategy template for backtesting entries/exits conditioned on regime volatility.
Performance/QOL: per-symbol presets, smarter warm-up, and finer control over sample caps for ultra-low TF charts.
Changelog
v0.9b (Beta)
Session presets (NYSE/CME RTH/FX NY/Custom) with timezone handling.
Panel enhancements: ratio + sample size n.
Four-state bar coloring (big/small × bull/bear).
Alerts for BIG/SMALL bars.
Hidden Z-score stream for downstream use.
Gap-in-TR toggle for the first in-session bar.
Disclaimer
For educational purposes only. Not investment advice. Validate thresholds and session settings across symbols/timeframes before live use.

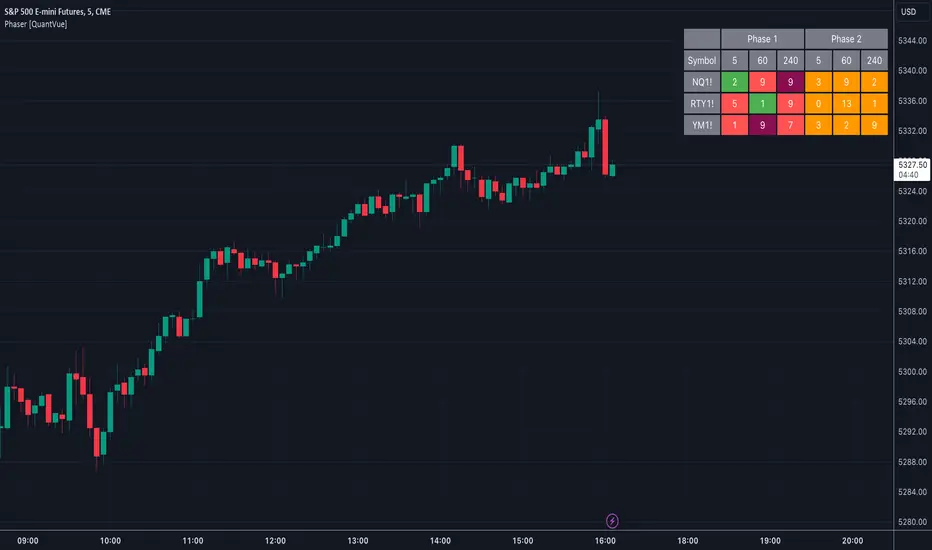
Phaser [QuantVue]The Phaser indicator is a tool to help identify inflection points by looking at price relative to past prices across multiple timeframes and assets.
Phase 1 looks for the price to be higher or lower than the closing price of the bar 4 bars earlier and is complete when 9 consecutive bars meet this criterion.
A completed Phase 1 is considered perfect when the highs (bearish) or lows (bullish) have been exceeded from bars 6 and 7 of the phase.
A bullish setup requires 9 consecutive closes less than the close 4 bars earlier.
A bearish setup requires 9 consecutive closes greater than the close 4 bars earlier.
Phase 2 begins once Phase 1 has been completed. Phase 2 compares the current price to the high or low of two bars earlier.
Unlike Phase 1, Phase 2 does not require the count to be consecutive.
Phase 2 is considered complete when 13 candles have met the criteria.
An important aspect to Phase 2 is the relationship between bar 13 and bar 8.
To ensure the end of Phase 2 is in line with the existing trend, the high or low of bar 13 is compared to the close of bar 8.
A bullish imperfect 13 occurs when the current price is less than the low of 2 bars earlier, but the current low is greater than the close of bar 8 in Phase 2.
A bearish imperfect 13 occurs when the current price is greater than the high of 2 bars earlier, but the current high is less than the close of bar 8 in Phase 2.
Phase 2 does not need to go until it is complete. A Phase 2 can be canceled if the price closes above or below the highest or lowest price from Phase 1.
Settings
3 Tickers
3 Timeframes
Show Phase 1
Show Phase 2
User-selected colors
Ultimate Fundamental FortressScript Overview
This script provides a comprehensive Fundamental Health Scorecard for stocks, calculating a normalized score out of 100 based on key financial metrics fetched from TradingView's fundamental data. It displays the results in an elegant table with customizable colors, a dynamic plot for visualization, and a scorecard label for quick insights. The scorecard helps users assess a stock's value, profitability, and financial strength at a glance.
Purpose
The primary goal is to simplify fundamental analysis by aggregating essential ratios into a single, easy-to-interpret score. Inspired by value investing principles (e.g., low P/E and P/B for undervalued stocks, high ROE for efficiency), it empowers traders and investors to identify strong fundamentals quickly. It's especially useful for screening undervalued opportunities or comparing stocks within sectors.
Principles
Metrics Selection: Focuses on core fundamentals: Price-to-Book (P/B), Price-to-Earnings (P/E), Return on Equity (ROE), Debt-to-Equity (D/E), Free Cash Flow (FCF normalized by market cap), EBITDA (normalized by market cap), and Net Profit Margin. These are chosen for their balance of valuation, profitability, and risk assessment.
Scoring Philosophy: Each metric is scored based on thresholds (e.g., low ratios for valuation metrics indicate better value). If manual sector averages are provided, scoring becomes relative (e.g., stock P/B below sector average gets higher points), reducing subjectivity and adapting to industry norms. Without averages, absolute thresholds apply.
Normalization: Scores are summed and scaled to 100, ignoring missing data to ensure robustness. This allows fair comparison across stocks with varying data availability.
Customization: Users can adjust thresholds, colors, and sector averages for personalized analysis, making it flexible for different markets or strategies.
Calculation Methodology
Data Fetching: Uses request.financial() to pull quarterly (FQ) or trailing twelve months (TTM) data for metrics like BVPS, EPS, ROE, etc.
Ratio Computations:
P/B = Close Price / BVPS
P/E = Close Price / EPS
ROE = Directly fetched
D/E = Total Liabilities / Equity
Net Margin = Net Income / Revenue
Normalized FCF = FCF / Market Cap (as percentage)
Normalized EBITDA = EBITDA / Market Cap (as percentage)
Scoring:
For each metric, compare to thresholds or relative to sector averages (if provided >0).
Example for P/B: If relative (sector avg >0), stock P/B < avg * high factor → 15 pts; < avg * med factor → 10 pts; etc.
For ROE/Net Margin (higher is better): Reverse logic (stock > avg / factor).
FCF/EBITDA: Always absolute (normalized thresholds).
Minimum score per metric: 2-5 pts if poor.
Total Score: Sum valid scores, divide by max possible for those metrics, multiply by 100.
Output: Table shows components, values, scores, and sector avgs.
Plot visualizes score with color-coding.
Label categorizes (e.g., "Buffett Approved" for 85+).
User Inputs and Benefits
Thresholds (Absolute/Relative Factors): Customize scoring rules (e.g., change P/E low threshold from 10 to 12).
Benefit: Adapt to personal strategy or market conditions – e.g., stricter for growth stocks.
Manual Sector Averages: Enter averages (e.g., sector P/B = 2.5).
Benefit: Makes scoring industry-specific, reducing bias (e.g., tech's high P/E normal, banking's low ROE risky). If not entered (≤0), falls back to absolute for simplicity.
Color Customizations: Adjust table colors (header, scores).
Benefit: Personalize visuals for dark/light themes, improving readability and user experience.
Normalized FCF/EBITDA Thresholds: Set as % of market cap. Benefit: Size-independent comparison – small caps won't be disadvantaged.
Usage Notes Add to chart via Indicators menu.
Data relies on TradingView fundamentals – may be limited for some exchanges (e.g., BIST, international). Use manual averages for accuracy.
For screener: High request count (10) may exceed limits; use reduced version if needed.
Not financial advice – always verify with external sources.
Feedback welcome – let's improve together!

RSI(14) CrossUp >= 60 📈 RSI14 CrossUp ≥ 60 (Daily, Live) + BB Width Screener
Author: Rayan Selim / Torpedo Labs
Version: 1.0
Category: Momentum + Volatility Visualization
🧠 Overview
This indicator combines RSI-based momentum confirmation with Bollinger Band Width (BBW) expansion tracking — designed for traders who want to visually and quantitatively detect daily strength shifts and volatility expansions across multiple symbols.
It highlights candles when the daily RSI(14) crosses above 60, signaling bullish continuation, and displays daily Bollinger Band Width data to assess volatility expansion or contraction.
You can also use the built-in Screener plots as custom columns in TradingView’s Watchlist or Stock Screener for quick scanning of multiple symbols.
⚙️ Core Features
✅ Daily RSI(14) Cross-Up Highlight
Automatically colors candles when RSI crosses above 60 (updates live, no need to wait for daily close).
✅ Bollinger Band Width (BBW) Display
Shows BBW values for the highlighted and previous candles.
✅ Dynamic Label Coloring
Expanding BBW → Green label, Contracting → Red label (toggleable).
✅ Grouped Input Panels
Organized configuration panels for clarity:
Graphic / Highlight
BBW Labels (Global / Green / Red / Fonts)
Screener Outputs
✅ Screener-Compatible Output Plots
Adds hidden plots for Watchlist columns:
RSI Prev (D)
RSI Today (D)
BBW Prev (D)
BBW Today (D)
CrossUp≥60 (0/1)
BBW Expanding (0/1)
✅ Live & Non-Repainting
Uses lookahead_on for live RSI updates while maintaining daily context.
📊 Use Case Examples
Detect momentum confirmation (RSI crossing 60) with simultaneous volatility expansion.
Screen for tickers where daily BBW is widening while RSI shows strength.
Build Watchlist columns to sort stocks by RSI conditions and BBW expansion.
Identify early breakout conditions during accumulation phases.
⚡ Technical Notes
All calculations use daily data, even on lower timeframes.
RSI cross-up events include the current (in-progress) daily candle.
Screener columns are hidden by default but can be toggled visible for debugging.
The indicator is non-repainting, as it reads daily RSI and BBW in real time.
📢 Alerts
Built-in alert for “RSI(14) Crossed Above 60 (Live)” so you never miss a setup.

Liquidity Sweep Scanner [TradingFinder]🔵 Introduction
Recognizing how liquidity develops and how price reacts at key structural levels is critical for spotting precise, low-risk trade entries. The Liquidity Sweep Scanner is an advanced tool built to track market activity in real time, pinpoint liquidity sweeps, define reaction zones, and identify confirmation candles across multiple instruments and timeframes.
Key Advantages :
Detects high-probability reversal points with precision.
Combines liquidity analysis, market structure, and candle confirmation.
Works seamlessly across multiple symbols and timeframes.
This screener can scan a broad watchlist or analyze every timeframe of a single asset to find optimal reversal zones. It starts by identifying a clear swing point either a swing high or swing low and marking a reaction zone between that point and the candle’s highest or lowest open/close value.
If price revisits the zone, performs a liquidity grab, and forms an indecision candle such as a doji or narrow-bodied bar that closes inside the zone, this may indicate rejection of the level and a failed breakout attempt. Based on the surrounding market context, the screener then flags a potential bullish or bearish reversal and generates the appropriate Long or Short signal.
By focusing on precise entry timing, institutional order flow alignment, and filtering out false breakouts, the Liquidity Sweep Scanner zeroes in on the market areas where liquidity engineering, reversal potential, and inefficiency overlap. This makes it an indispensable tool for price action traders who rely on clear, high-quality setups without the distraction of market noise.
🔵 How to Use
The Liquidity Sweep Scanner continuously evaluates market structure, issuing alerts when a potential reversal setup emerges. It merges liquidity behavior, swing point analysis, and candle confirmation within predefined reaction zones.
To illustrate, imagine price forms a swing high or low, then later returns to that level. If it sweeps the prior extreme and produces a qualifying candle inside the reaction zone, the tool signals a possible reversal.
🟣 Long Setup
For a bullish scenario, the screener first spots a valid swing low a level often packed with sell-side liquidity. From there, it defines a reaction zone stretching from the swing low to the candle’s lowest open/close point.
If price retests this area with a wick dipping below the swing low but then closes back inside the zone, it signals absorption of selling pressure and rejection of further downside. The screener then awaits a confirmation candle commonly a doji or small-bodied bar closing inside the zone. Once these conditions align, a Long signal is logged and, if alerts are active, the trader receives a notification.
🟣 Short Setup
For bearish opportunities, the process begins by locating a valid swing high typically an area dense with buy-side liquidity. The reaction zone is drawn from the swing high to the candle’s highest open/close value.
When price retests this zone, sweeps above the swing high, and fails to close higher, it suggests a bull trap and waning upward momentum. The screener then requires a confirmation candle often a doji or rejection bar that closes back within the zone before confirming a Short signal.
These bearish setups help traders pinpoint likely institutional sell zones, offering a clear view of where price may reverse following a liquidity event.
🔵 Settings
🟣 Logical settings
Liquidity Swing period : You can set the swing detection period.
Market Structure Period :You can set the Pivot Period to determine the detection direction.
Max Swing Back Method : It is in two modes "All" and "Custom". If it is in "All" mode, it will check all swings, and if it is in "Custom" mode, it will check the swings to the extent you determine.
Max Swing Back : You can set the number of swings that will go back for checking.
Maximum Distance Between Swing and Signal : The maximum number of candles allowed between the swing point and the potential signal. The default value is 50, ensuring that only recent and relevant price reactions are considered valid.
🟣 Display Settings
Table on Chart : Allows users to choose the position of the signal dashboard either directly on the chart or below it, depending on their layout preference.
Number of Symbols : Enables users to control how many symbols are displayed in the screener table, from 10 to 20, adjustable in increments of 2 symbols for flexible screening depth.
Table Mode : This setting offers two layout styles for the signal table :
Basic : Mode displays symbols in a single column, using more vertical space.
Extended : Mode arranges symbols in pairs side-by-side, optimizing screen space with a more compact view.
Table Size : Lets you adjust the table’s visual size with options such as: auto, tiny, small, normal, large, huge.
Table Position : Sets the screen location of the table. Choose from 9 possible positions, combining vertical (top, middle, bottom) and horizontal (left, center, right) alignments.
🟣 Symbol Settings
Each of the 10 symbol slots comes with a full set of customizable parameters :
Symbol : Define or select the asset (e.g., XAUUSD, BTCUSD, EURUSD, etc.).
Timeframe : Set your desired timeframe for each symbol (e.g., 15, 60, 240, 1D).
🟣 Alert Settings
Alert : Enables alerts for LSS.
Message Frequency : Determines the frequency of alerts. Options include 'All' (every function call), 'Once Per Bar' (first call within the bar), and 'Once Per Bar Close' (final script execution of the real-time bar). Default is 'Once per Bar'.
Show Alert Time by Time Zone : Configures the time zone for alert messages. Default is 'UTC'.
🔵 Conclusion
The Liquidity Sweep Scanner equips traders with a precise, structured method for spotting high-probability reversals by merging liquidity sweeps, reaction zone mapping, and candle confirmation.
It not only filters out market noise but also highlights price areas where inefficiency and reversal potential align. Beyond identifying clean entry points, the tool includes a market direction detection feature allowing traders to quickly determine the prevailing trend and align their trades accordingly.
With adjustable settings such as the Pivot Period for fine-tuning detection direction, it adapts to various trading styles and timeframes, making it a powerful and versatile addition to any trader’s strategy.
Ücretli komut dosyası

Ryan Bot Signals ProRyan EMA Trend Screener Pro — Smart Auto Signals + TP/SL Engine + MTF Dashboard
Ryan EMA Trend Screener Pro is an advanced trading system that combines
✔ EMA Ribbon Trend Confirmation
✔ Auto BUY/SELL Signals
✔ ATR-based TP & SL engine
✔ Multi-Timeframe Trend Dashboard
✔ Real-Time Screener
into one clean, powerful tool.
Key Features
🔹 Smart EMA Crossover Signals
Automatically detects momentum shifts using fast vs slow EMA cloud.
🔹 Auto TP/SL System
– Up to 4 Take-Profit levels
– ATR-based dynamic Stop Loss
– Entry, SL & TP lines with labels
– Trade zones highlighted using boxes
🔹 MTF Trend Dashboard
Trend status from 5m, 15m, 30m, 1h, Daily
Shows combined trend strength (Bullish / Bearish).
🔹 Built-in Screener
Scan multiple symbols directly on your chart.
Displays trend direction & recent signals.
🔹 Fully Customizable
Modify EMA lengths, ATR settings, TP count, dashboard position & screener layout.
How to Use
Follow BUY/SELL labels created by EMA2/EMA8 crossover.
Use TP/SL lines to plan exits.
Check dashboard to confirm higher-timeframe trend.
Optional: add your favourite chart structure (S/R, Fibs, Liquidity).
Disclaimer
This tool does not guarantee profits. Use proper risk management.

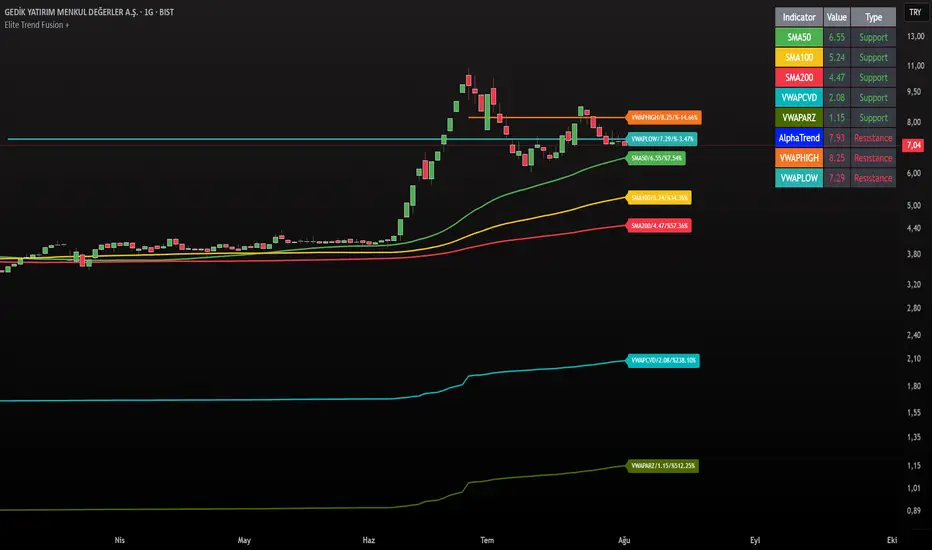
Elite Trend FusionThis indicator combines multiple technical analysis tools to assist traders in identifying trends, support/resistance levels, and potential trading opportunities. Developed by @IQ-TRADER with contributions to the Alpha Section by @KivancOzbilgic, this script overlays the following components on your chart:
EMA1: A customizable Exponential Moving Average for short-term trend analysis.
SMA Cluster (50, 100, 200): Simple Moving Averages on daily timeframes to identify long-term trends and key support/resistance zones.
Anchored VWAP x2 (VWAPCVD & VWAPARZ): Two Volume Weighted Average Price lines anchored to user-defined dates, providing insights into price levels relative to volume from specific points in time.
AlphaTrend: A custom trend-following indicator based on ATR and MFI, helping to gauge market direction and volatility.
Usage InstructionsInstallation:
Copy and paste the script into the Pine Script editor on TradingView, then add it to your chart.
Customization:Adjust the periods for EMA, SMA50, SMA100, and SMA200 under the "Inputs" tab.
Set the anchor dates for VWAPCVD and VWAPARZ to analyze specific historical periods.
Enable or disable individual components (EMA1, SMA50, SMA100, SMA200, VWAPCVD, VWAPARZ, AlphaTrend) and toggle labels via the settings.
Customize colors and line thickness to suit your preferences.
Modify the AlphaTrend multiplier and period for tailored sensitivity.
Interpretation:
Use the EMA1 for short-term momentum and crossovers with SMAs.
Monitor SMA crossovers (e.g., SMA50 crossing SMA200) for trend changes.
The Anchored VWAPs act as dynamic support/resistance levels based on the selected anchor dates.
AlphaTrend provides a visual guide for trend direction; use it alongside other indicators for confirmation.
Labels on the last bar show the current value and percentage distance from the price for each enabled indicator.
Pine Screener Module Usage:
Add this indicator to the Pine Screener to filter stocks, forex pairs, or other instruments based on the calculated distances (in percentage) between the close price and SMA50, SMA100, SMA200, VWAPCVD, and VWAPARZ.
In the Screener, use the "SMA50 Distance (%)", "SMA100 Distance (%)", "SMA200 Distance (%)", "VWAPCVD Distance (%)", and "VWAPARZ Distance (%)" columns to identify overbought/oversold conditions or potential reversal points.
Example filters: Set conditions like "SMA50 Distance (%) > 5" to find stocks trading significantly above the 50-day SMA, or "VWAPCVD Distance (%) < -2" to spot assets below the anchored VWAP, indicating potential support levels.
Combine multiple conditions (e.g., SMA50 Distance (%) > 5 AND AlphaTrend > previous AlphaTrend) to refine your scan for bullish trends.
Note: Ensure the indicator is applied to the chart or screener with the desired timeframe for accurate results.
Notes
This is an overlay indicator, meaning it plots directly on the price chart.
The script uses daily SMA calculations for consistency across timeframes.
Labels appear only on the last bar and are customizable.
This tool is for educational and informational purposes only. Trading involves risks, and it is recommended to consult a financial advisor before making decisions.
The script is credited to @IQ-TRADER with acknowledgment to @KivancOzbilgic for the Alpha Section contribution, adhering to intellectual property guidelines.
No Financial Advice: The description explicitly states that the indicator is for educational use and not financial advice, complying with TradingView's policy against promoting trading signals as guarantees.
Clear Usage: Step-by-step instructions are provided to ensure users can apply the indicator effectively, including screener usage.
No External Links or Promotions: No external links or promotional content is included, aligning with platform rules.
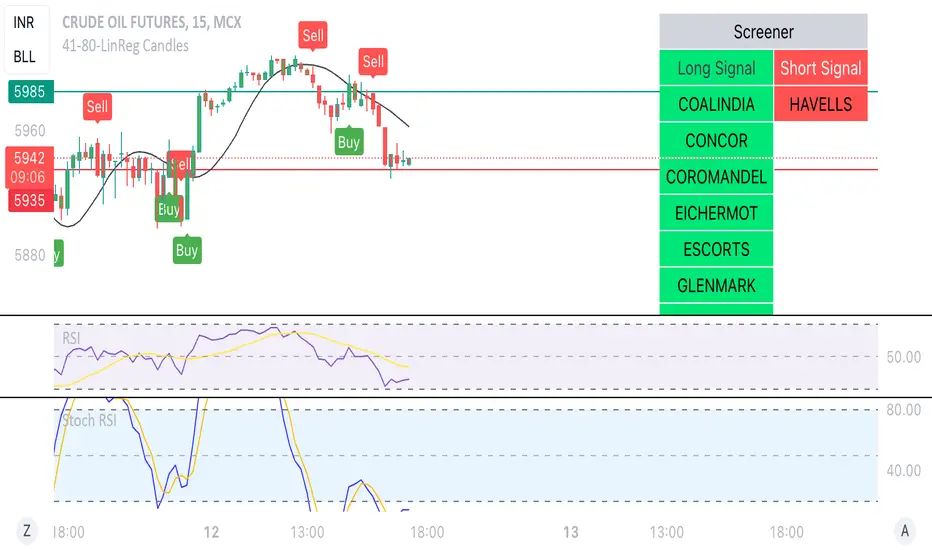
Linear Reg CandlesThe provided Pine Script is a TradingView script for creating a technical analysis indicator called "Humble LinReg Candles." This script includes features such as linear regression for open, high, low, and close prices, signal smoothing with simple or exponential moving averages, and a trailing stop based on Average True Range (ATR). Additionally, the script contains a screener section to display signals for a list of specified symbols.
Here is a breakdown of the script:
Indicator Settings:
It defines various input parameters such as signal smoothing length, linear regression settings, and options for using simple moving averages.
Linear regression is applied to open, high, low, and close prices based on user-defined settings.
ATR Trailing Stop:
It calculates the Average True Range (ATR) and uses it to determine a trailing stop for buy and sell signals.
Signals are generated based on whether the close price is above or below the ATR trailing stop.
Plotting:
The script plots the calculated signal on the chart using the plot function.
Buy and Sell Conditions:
Buy and sell conditions are defined based on the relationship between the close price and the ATR trailing stop.
Plot shapes and bar colors are used to visually represent buy and sell signals on the chart.
Alerts:
Alerts are triggered when buy or sell conditions are met.
Screener Section:
The script defines a screener section to display a watchlist of symbols with long and short signals.
The watchlist includes a set of predefined symbols with corresponding long and short signals.
Table Theme Settings:
The script allows customization of the table theme, including background color, frame color, and text color.
The size and location of the table on the chart can also be customized.
Screener Function:
A function getSignal is defined to determine long and short signals for each symbol in the watchlist.
The getSym function is used to extract the symbol name from the symbol string.
Dashboard Creation:
The script creates a table (dashboard) to display long and short signals for the symbols in the watchlist.
The table includes headers for "Long Signal" and "Short Signal" and lists the symbols with corresponding signals.
Overall, the script combines technical analysis indicators and a screener to help traders identify potential buy and sell signals for a set of specified symbols.
Pro Trading Art - Top N Candle's Gainers/Losers(1-40)Top Gainer/Loser Screener.
Explanation :
With the help of this indicator you can filter top Gainer or Loser in comparison with previous selected range. Suppose you select 5 period inside input tab then this indicator will filter top gainer or losers in 5 days.
Input Parameter:
Timeframe: You can change timeframe of chart. Default timeframe is same as chart.
Period: To select range of candle. Default 5. Means how much price changed in previous 5 candle.
Top : Dropdown option to select top Gainer or Losers
Table Location: Where you want to place your table.
Watchlist Group: You can create watchlist for screener.

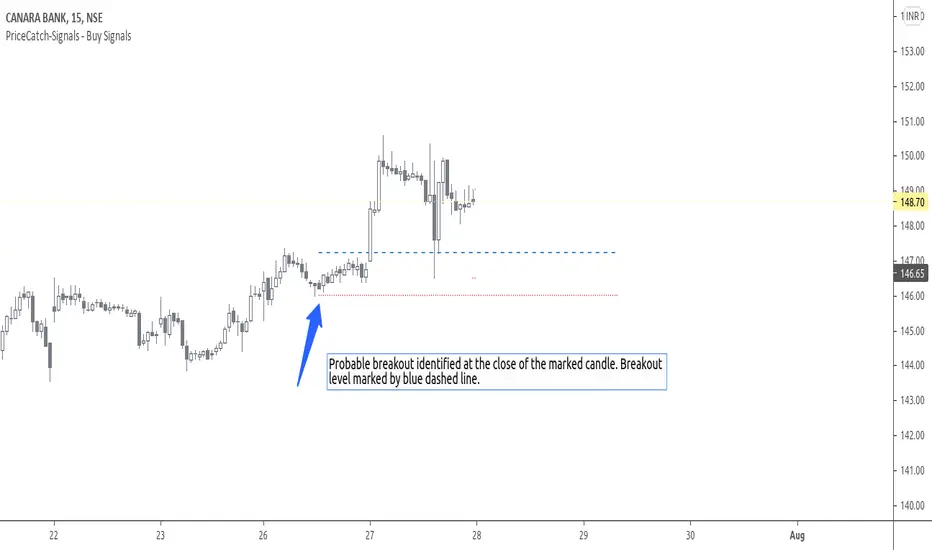
PriceCatch-Signals - Buy SignalsHi,
TradingView Community.
Here is a script that identifies and marks two different buy levels on the chart. It works on all asset classes - equities, forex, crypto.
Probable Breakout Buy Level
Stop-Reverse Buy Level
The bottom images are self-explanatory.
PROBABLE BREAKOUT BUY LEVEL EXAMPLE:
STOP-REVERSE BUY LEVEL EXAMPLE:
IDENTIFICATION OF LEVELS:
The Blue Dotted line represents Probable Breakout Buy Level and the Blue Dashed Line Stop-Reverse Buy Level. The corresponding Red Dotted line below each level should be your initial stop loss price point.
PLAYING SAFE
After taking the trade, to play safe, I follow this method that once the Low of the price goes above the Buy Level, I usually shift the stop loss to buy price to protect against any sudden reversal. For me protecting capital is important. As usual with price action, longer time-frames produce more reliable signals.
NOTE - PRIOR TO USING THIS SCRIPT:
The script uses Heikin-Ashi Candles data to identify the levels. You may use this script in addition to your other indicators or in isolation. Please remember that the script is shared with absolutely no assurances and warranties whatsoever and as a responsible trader, please satisfy yourselves thoroughly and use it only if you are satisfied it works for you. Remember, you are 100% responsible for your actions. If you understand and accept that, you may use the script. The script does not identify any short signals.
ADDITIONAL NOTE:
I shall also be releasing Screener scripts that scan the following markets for the above two conditions or signals thereby helping traders spot opportunities at the right time by making the task of finding right stocks a breeze.
NASDAQ Stocks Screener (Can screen a total number of 160 stocks. 40 stocks at a time)
UK LSE Stocks Screener (Can screen a total number of 90 stocks. 30 stocks at a time)
Euronext Paris Stocks Screener (Can screen a total number of 50 stocks. 25 stocks at a time) - in development.
Singapore Stocks Screener is in development
Other International exchanges will be added based on response from users.
SOME MORE CHARTS:
QUERIES/FEEDBACK
Please PM me.
Regards to all and wish everyone all the best with trading.
PriceCatch-Signals - Buy SignalHi,
TradingView Community.
Here is a script that identifies and marks two different buy levels on the chart. It works on all asset classes - equities, forex, crypto.
Probable Breakout Buy Level
Stop-Reverse Buy Level
The bottom images are self-explanatory.
PROBABLE BREAKOUT BUY LEVEL EXAMPLE:
STOP-REVERSE BUY LEVEL EXAMPLE:
IDENTIFICATION OF LEVELS:
The Blue Dotted line represents Probable Breakout Buy Level and the Blue Dashed Line Stop-Reverse Buy Level. The corresponding Red Dotted line below each level should be your initial stop loss price point.
PLAYING SAFE
After taking the trade, to play safe, I follow this method that once the Low of the price goes above the Buy Level, I usually shift the stop loss to buy price to protect against any sudden reversal. For me protecting capital is important. As usual with price action, longer time-frames produce more reliable signals.
NOTE - PRIOR TO USING THIS SCRIPT:
The script uses Heikin-Ashi Candles data to identify the levels. You may use this script in addition to your other indicators or in isolation. Please remember that the script is shared with absolutely no assurances and warranties whatsoever and as a responsible trader, please satisfy yourselves thoroughly and use it only if you are satisfied it works for you. Remember, you are 100% responsible for your actions. If you understand and accept that, you may use the script. The script does not identify any short signals.
ADDITIONAL NOTE:
I shall also be releasing Screener scripts that scan the following markets for the above two conditions or signals thereby helping traders spot opportunities at the right time by making the task of finding right stocks a breeze.
NASDAQ Stocks Screener (Can screen a total number of 160 stocks. 40 stocks at a time)
UK LSE Stocks Screener (Can screen a total number of 90 stocks. 30 stocks at a time)
Euronext Paris Stocks Screener (Can screen a total number of 50 stocks. 25 stocks at a time) - in development.
Singapore Stocks Screener is in development
Other International exchanges will be added based on response from users.
SOME MORE CHARTS:
QUERIES/FEEDBACK
Please PM me.
Regards to all and wish everyone all the best with trading.

PriceCatch-SignalsHi,
TradingView Community.
Here is a script that identifies and marks two different buy levels on the chart. It works on all asset classes - equities, forex, crypto.
Probable Breakout Buy Level
Stop-Reverse Buy Level
The bottom images are self-explanatory.
PROBABLE BREAKOUT BUY LEVEL EXAMPLE:
STOP-REVERSE BUY LEVEL EXAMPLE:
IDENTIFICATION OF LEVELS:
The Blue Dotted line represents Probable Breakout Buy Level and the Blue Dashed Line Stop-Reverse Buy Level. The corresponding Red Dotted line below each level should be your initial stop loss price point.
PLAYING SAFE
After taking the trade, to play safe, I follow this method that once the Low of the price goes above the Buy Level, I usually shift the stop loss to buy price to protect against any sudden reversal. For me protecting capital is important. As usual with price action, longer time-frames produce more reliable signals.
NOTE - PRIOR TO USING THIS SCRIPT:
The script uses Heikin-Ashi Candles data to identify the levels. You may use this script in addition to your other indicators or in isolation. Please remember that the script is shared with absolutely no assurances and warranties whatsoever and as a responsible trader, please satisfy yourselves thoroughly and use it only if you are satisfied it works for you. Remember, you are 100% responsible for your actions. If you understand and accept that, you may use the script. The script does not identify any short signals.
ADDITIONAL NOTE:
I shall also be releasing Screener scripts that scan the following markets for the above two conditions or signals thereby helping traders spot opportunities at the right time by making the task of finding right stocks a breeze.
NASDAQ Stocks Screener (Can screen a total number of 160 stocks. 40 stocks at a time)
UK LSE Stocks Screener (Can screen a total number of 90 stocks. 30 stocks at a time)
Euronext Paris Stocks Screener (Can screen a total number of 50 stocks. 25 stocks at a time) - in development.
Singapore Stocks Screener is in development
Other International exchanges will be added based on response from users.
SOME MORE CHARTS:
QUERIES/FEEDBACK
Please PM me.
Regards to all and wish everyone all the best with trading.

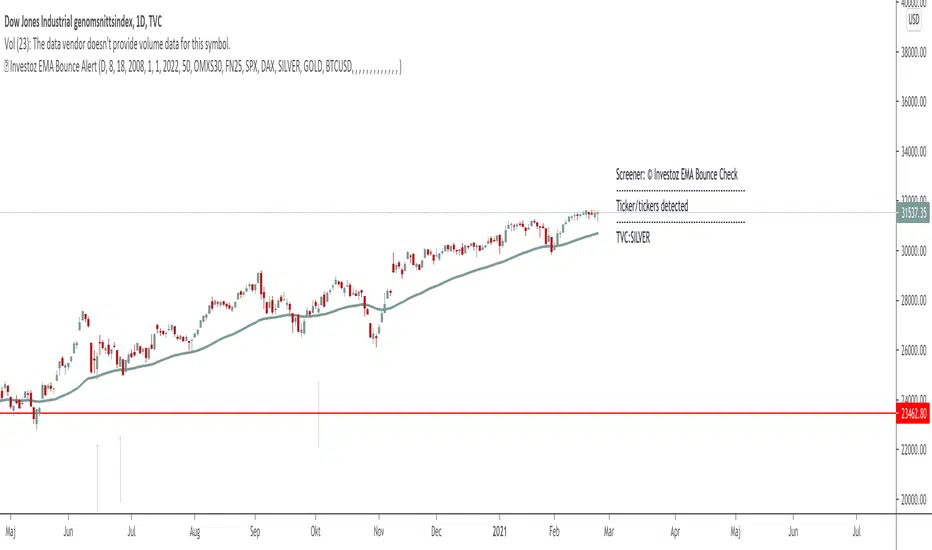
TheBlackFish EMA bounce alertAbout
This indicator is an EMA indicator with a built-in screener.
20 different ticker symbols are included in the screener. These ticker symbols must be replaced manually. All ticker symbols are from the Stockholm Stock Exchange, Large Cap.
How it works
The lowest price of a bar should be less than EMA and yesterday's closing greater than EMA.
If no conditions are found, there will be no ticker symbols in the box.
If the conditions are met, the ticker symbol / symbols are displayed in the black text box. The information in the box disappears after each new bar.
The default setting is set to EMA 50, but you can select which EMA value you want in its settings.
Change ticker
If you want to change the ticker symbol, do not forget to change both in "Check tickers" and in "Labels content".
Enjoy!
Supply and Demand Scanner Toolkit [TradingFinder]🔵 Introduction
The analytical system presented here is built upon a deep quantitative foundation designed to capture the dynamic behavior of supply and demand in live markets. At its core, it calculates continuously adaptive zones where institutional liquidity, volatility shifts, and momentum transitions converge. These zones are derived from a combination of a regression-based moving average, a long-period ATR, and Fibonacci expansion ratios, all working together to model real-time volatility, price momentum, and the underlying market imbalance.
In practice, this means that at any given moment, five primary bands and seven variable analytical zones are generated around price, representing different market states ranging from extreme overbought to extreme oversold.
Each band reacts dynamically to price volatility, recalibrating with every new candle, which allows the system to mirror the true, constantly changing structure of supply and demand. Every movement between these zones reflects a transition in the strength and dominance of buyers and sellers, a process referred to as volatility-driven price state transitions.
Traditional analytical models often rely on fixed or static indicators that cannot keep up with the rapid microstructural changes in modern markets. This system instead uses regression and smoothing logic to adapt on the fly. By combining a regression moving average with a smoothed moving average, the model calculates real-time trend direction, momentum flow, and trend strength.
When the regression average rises above the smoothed one, the system classifies the trend as bullish; when it falls below, bearish. This dual-layer structure not only helps confirm direction but also enables the automatic detection of critical structural shifts such as Break of Structure (BoS), Change of Character (CHoCH), and directional reversals.
Both the current trend (Live Trend) and projected future trend (Vision Trend) are calculated simultaneously across all available timeframes. This dual analysis allows traders to identify structural changes earlier and to recognize whether a trend is gaining or losing momentum.
In most conventional moving-average-based frameworks, trading signals are delayed because these models react to price rather than anticipate it. As a result, many buy or sell signals appear after the real move has already begun, leading to entries that contradict the current trend. This system eliminates that lag by employing a mean reversion trading model. Instead of waiting for crossovers, it observes how far price deviates from its statistical mean and reacts when that deviation begins to shrink, the moment when equilibrium forces reemerge.
This approach produces non-lagging, data-driven signals that appear at the exact moment price begins to revert toward balance. At the same time, traders can visually assess the market’s condition by observing the spacing, compression, or expansion of the dynamic bands, which represent volatility shifts and trend energy. Through this interaction, the trader can quickly gauge whether a trend is strengthening, losing power, or preparing for a reversal. In other words, the model provides both quantitative precision and intuitive visualization.
A unique visual element in this system is how candles are displayed during transitional states. When Live Trend and Vision Trend contradict each other, for instance, when the current trend is bullish but the projected trend turns bearish, candle bodies automatically appear as hollow.
These hollow candles act as visual alerts for zones of uncertainty or equilibrium between buyers and sellers, often preceding trend reversals, liquidity sweeps, or volatility compression phases. Traders quickly learn to interpret hollow candles as signals to pause, observe, or prepare for potential shifts rather than to act impulsively.
Signal generation in this model occurs when price reverts from extreme zones back toward neutrality. When price exits the strong overbought or strong oversold zones and reenters a milder area, the system produces a reversal signal that aligns with real-time market dynamics. To refine accuracy, these signals are confirmed through several filters, including momentum verification, volatility behavior, and smart money validation. This multi-layered signal logic significantly reduces false entries, helping traders avoid overreactions to temporary liquidity spikes and enhancing performance in volatility-driven markets.
On a broader level, the model supports full multi-timeframe analysis. It can analyze up to twenty symbols simultaneously, across multiple timeframes, to detect directional bias, correlation, and confluence. The result is a holistic map of market structure in real time, showing how each asset aligns or diverges from others and how lower timeframes fit into the macro trend. Variables such as Live Trend, Vision Trend, Directional Strength, and Zone Positioning combine to give a complete structural snapshot at any given moment.
Risk management is handled by an adaptive Trailing Stop Engine that continuously aligns with current volatility and price flow. It integrates pivot mapping with ATR-based calculations to dynamically adjust stop-loss levels as price evolves. The engine offers four adaptive modes, Grip, Flow, Drift, and Glide, each tailored to different levels of market volatility and trader risk tolerance. In visualization, the profit area between entry and stop-loss is shaded light green for long positions and light red for short positions. This design allows immediate recognition of active risk exposure and profit lock-in zones, all in real time.
Altogether, the combination of ATR Volatility Mapping, Fibonacci Band Calibration, Regression-Based Trend Engine, Dynamic Supply and Demand Equilibrium, Conflict Detection through Hollow Candles, Mean Reversion Signal Model, and Adaptive Trailing Stop forms a unified analytical system. It maps the market’s structure, identifies current and future trends, measures the real-time balance of buyers and sellers, and highlights optimal entry and exit points. The final result is higher analytical precision, improved risk control, and a clearer view of the true, data-defined market structure.
🔵 How to Use
Analyzing supply and demand in live financial markets is one of the most complex challenges traders face. Price rarely moves in a straight line; instead, it evolves through phases of expansion, compression, and redistribution. Many traders misinterpret these movements because the zones that appear strong or reactive at first glance often represent nothing more than temporary liquidity redistributions.
These areas, while visually convincing, may lose relevance quickly when volatility increases or when viewed from another timeframe. In high-volatility environments, traditional zone analysis becomes even more unreliable. Price may seem to respect a support or resistance level only to break through it a few candles later. This behavior creates false zones and misleading reversal points.
The key to filtering such movements lies in understanding the context, how volatility, momentum, and structural flow interact across different timeframes. A single timeframe can only tell part of the story. The market’s true structure emerges only when data is synchronized from macro to micro levels.
This is where multi-timeframe correlation becomes essential. Every timeframe offers a different lens through which supply and demand balance can be observed. For example, a trader might see a bullish setup on a 15-minute chart while the 4-hour chart is still showing a strong distribution phase. Without alignment between these layers, trades are easily positioned against the dominant liquidity flow. The model presented here solves this by processing all relevant timeframes simultaneously, allowing traders to see how short-term movements fit within higher-level structures.
Each market phase, whether accumulation, expansion, or reversion, carries a unique volatility fingerprint. The system tracks transitions in volatility regimes, momentum divergence, and structural breakouts to anticipate when a phase change is approaching. For instance, when volatility compresses and ATR readings narrow, it often signals an upcoming breakout or reversal. By monitoring these shifts in real time, the model helps the trader differentiate between liquidity grabs (temporary volatility spikes) and genuine structural changes.
Every supply-demand interaction within this system is adaptive rather than static. The zones continuously recalibrate based on live parameters such as price velocity, momentum distribution, and liquidity displacement. This adaptive structure ensures that the balance between buyers and sellers is represented accurately as market conditions evolve.
In practice, this allows the user to identify early signs of trend exhaustion, potential reversals, and continuation patterns long before traditional indicators would react.
In essence, successful supply and demand analysis requires moving beyond subjective interpretation toward data-driven decision-making.
Manual drawing of zones or relying solely on visual intuition can lead to inconsistent results, especially in fast-changing markets. By combining ATR-driven volatility mapping, mean reversion dynamics, and multi-timeframe alignment, this framework offers a clear, objective, and responsive model of how market forces actually operate. Each decision becomes grounded in measurable context, not assumptions.
The analytical interface is divided into two main sections : the visual chart framework and the scanner data table.
On the chart, five dynamic bands and seven analytical zones appear around price. These are calculated from ATR, regression moving average, and Fibonacci expansion ratios to define whether the market is overbought, oversold, or neutral. Each zone has distinct color coding, allowing traders to recognize the market state instantly without switching tools or indicators.
Price movement within these bands reveals more than just direction, it tells a story of volatility, liquidity flow, and market equilibrium. The upper zones typically indicate exhaustion of buying pressure, while lower zones highlight areas of overselling or potential recovery. The way price reacts near these boundaries can help determine whether a continuation or reversal is likely.
At the heart of the visualization are two layered trend components : Live Trend and Vision Trend.
The Live Trend shows the present market direction based on regression and smoothing logic, while the Vision Trend projects the probable future trajectory by analyzing slope deviation and momentum displacement. When these two align, the trader sees confirmation of market strength. When they diverge, candle bodies turn hollow, a simple yet powerful visual alert signaling hesitation, consolidation, or a possible turning point.
At the bottom of the interface, the Scanner Table organizes all analytical data into a structured display. Each row corresponds to a symbol and timeframe, showing the current Live Trend, Vision Trend, Directional Strength, Zone Position, and Signal Age. This table provides a real-time overview of all assets being tracked, showing which ones are trending, which are in reversal, and which are entering transition zones. By analyzing this table, traders can instantly identify correlation clusters, where multiple assets share the same trend direction, often a sign of broader market sentiment shifts.
The Scanner can simultaneously process multiple timeframes and up to twenty different assets, producing a panoramic market overview. This makes it easy to apply a top-down analytical workflow, starting with higher timeframe alignment, then drilling down into lower levels for execution. Instead of reacting to isolated signals, traders can see where confluence exists across structures and focus only on setups that align with overall market context.
The bands and their color coding make interpretation intuitive even for less experienced users. Darker shades correspond to extreme zones, typically where institutional orders are being absorbed or distributed, while lighter zones mark mild overbought or oversold conditions. When price transitions from an outer extreme zone into a milder region, a signal condition becomes active. At this point, traders can cross-check the event using momentum and volatility filters before acting.
The trailing stop section of the display adds another critical dimension to decision-making. It visualizes stop levels as continuously updating colored lines that follow price movement. These levels are calculated dynamically through pivot mapping and ATR-based sensitivity. The shaded area between the entry point and active stop loss (light green for buys, light red for sells) gives traders immediate insight into how much of the move is currently secured as profit and how much remains exposed. This simple visual cue transforms risk management from a static calculation into a living, responsive process.
All components of this analytical system are fully customizable. Users can adjust signal type, calculation periods, smoothing intensity, and band sensitivity to match their trading style. For example, a scalper might shorten ATR and MA periods to capture rapid fluctuations, while a swing trader might increase them for smoother and more stable readings. Because every element responds to live data, even small adjustments lead to meaningful changes in how the system behaves.
When combined with the scanner’s data table, these features enable a top-down analytical workflow, one where decisions are not made from isolated indicators but from a complete, multi-dimensional understanding of market structure. The result is a system that supports both reactive precision and proactive market awareness.
🟣 Long Signal
A long signal is generated when price begins to rebound from deeply oversold conditions. More precisely, when price enters the strong or extreme oversold zones and then returns into the mild oversold region, the system identifies the start of a mean reversion phase. This transition is not based on subjective interpretation but on mathematical deviation from equilibrium, meaning that selling pressure has been exhausted and liquidity begins to shift toward buyers.
Unlike delayed signals that depend on moving average crossovers or oscillators, this signal appears the moment price starts moving back toward balance. The model’s mean reversion logic detects when volatility contraction and momentum realignment coincide, producing a non-lagging entry condition.
In this situation, traders can visually confirm the setup by observing the spacing and curvature of the lower bands. When the lower volatility bands begin to flatten or curve upward while ATR readings stabilize, it indicates that the market is transitioning from distribution to accumulation.
The strength and quality of each long signal depend on the configuration of trend variables. When both Live Trend and Vision Trend are bullish, the probability of continuation is significantly higher. This alignment suggests that the market’s short-term momentum is supported by long-term structure. On the other hand, when the two trends contradict each other, which the chart highlights with hollow candles, it represents a temporary phase of indecision or conflicting forces.
In these moments, traders are encouraged to monitor volatility compression and observe whether the next few candles confirm a real breakout or revert back to range conditions.
Additional confirmation can be derived from observing the slope of the regression moving average and the magnitude of ATR fluctuations. A steeper upward slope combined with decreasing volatility indicates stronger bullish intent. In contrast, if ATR expands while price remains flat, it signals potential traps or fakeouts driven by short-term liquidity grabs.
Valid long signals often emerge near the end of volatility compression periods or immediately after liquidity sweeps around major lows. These are points where large players typically absorb remaining sell orders before initiating upward movement. Once the long condition triggers, the system automatically calculates the initial stop loss using a combination of recent pivots and ATR range. From that point, the Trailing Stop Engine dynamically adjusts as price rises, maintaining optimal distance from the entry point and locking in profits without restricting trade potential.
For educational context, consider a situation where the market has been trending downward for several sessions, and the ATR value begins to decline, showing that volatility is compressing. As price touches the lower extreme zone and reverses into the mild oversold region while Live Trend starts turning positive, this creates an ideal long condition. A new cycle of expansion often begins right after such compression, and the system captures that early shift automatically.
🟣 Short Signal
A short signal represents the opposite scenario, a point where buying momentum weakens after a strong rally, and price begins to revert downward toward equilibrium. When price exits the strong or extreme overbought zones and moves into the mild overbought region, the model detects the start of a bearish mean reversion phase.
Here too, the signal appears without delay, as it is based on the real-time relationship between price and its volatility boundaries rather than on indicator crossovers.
The system identifies these short conditions when upward momentum shows visible fatigue in the volatility bands. The upper bands start to flatten or turn downward while the regression slope begins to lose angle. This is often accompanied by rising ATR readings, showing an expansion in volatility that reflects distribution rather than continuation.
The quality of the short signal is strongly influenced by the interaction between the two trend layers. When both Live Trend and Vision Trend point downward, the likelihood of sustained bearish continuation increases dramatically. However, if they diverge, candle bodies turn hollow, clearly marking zones of conflict or hesitation. These phases often coincide with the end of a bullish impulse wave and the start of an early correction.
A practical example can illustrate this clearly. Imagine a market that has been trending upward for several days with expanding volatility. When price pushes into the extreme overbought zone and starts pulling back into the mild region, the system interprets it as the first sign of distribution. If at the same time the regression moving average flattens and ATR begins to rise, it strongly suggests that institutional participants are taking profit. The generated short signal allows the trader to position early in anticipation of the downward reversion that follows.
The initial stop loss for short trades is calculated above the most recent pivot high, ensuring logical protection based on the structural context. From there, the Trailing Stop Engine automatically tracks the price movement downward, tightening stops as volatility decreases or expanding them during sharp swings to avoid premature exits.
The engine’s dynamic nature makes it suitable for both aggressive scalpers and patient swing traders. Scalpers can set the trailing sensitivity to “Grip” mode for tighter control, while swing traders can use “Glide” mode to capture larger portions of the trend.
Most short signals form right after volatility expansion or liquidity grabs around major highs, classic exhaustion areas where momentum divergence becomes evident. The combination of visual cues (upper band curvature, hollow candles, ATR spikes) provides traders with multiple layers of confirmation before taking action.
In both long and short scenarios, this analytical system replaces emotional decision-making with structured interpretation. By translating volatility, momentum, and price positioning into clear contextual patterns, it empowers the trader to see where reversals are forming in real time rather than guessing after the move has started.
🔵 Setting
🟣 Logical Setting
Channel Period : The main channel period that defines the base moving average used to calculate the central line of the bands. Higher values create a smoother and longer-term structure, while lower values increase short-term sensitivity and faster reactions.
Channel Coefficient Period : The ATR period used to measure volatility for determining the channel width. Higher values provide greater channel stability and reduce reactions to short-term market noise.
Channel Coefficient : The ATR sensitivity factor that defines the distance of the bands from the central average. A higher coefficient widens the bands and increases the probability of detecting overbought or oversold conditions earlier.
Band Smooth Period : The smoothing period applied to the bands to filter minor price noise. Lower values produce quicker reactions to price changes, while higher values create smoother and more stable lines.
Trend Period : The period used in the regression moving average calculation to identify overall trend direction. Shorter values highlight faster trend shifts, while longer values emphasize broader market trends.
Trend Smooth Period : The smoothing period for the regression trend to reduce volatility and confirm the dominant market direction. This setting helps to better distinguish between corrective and continuation phases.
Signals Gap : The time interval between generated signals to prevent consecutive signal clustering. A higher value strengthens the temporal filter and produces more selective and refined signals.
Bars to Calculate : Defines the number of historical candles used in calculations. Limiting this value optimizes script performance and reduces processing load, especially when multiple symbols or timeframes are analyzed simultaneously. Higher values increase analytical depth by including more historical data, while lower values improve responsiveness and reduce potential lag during live chart updates.
Trailing Stop : Enables or disables the dynamic trailing stop engine. When active, the system automatically adjusts stop loss levels based on live volatility and price structure, maintaining alignment with market flow and trend direction.
Trailing Stop Level : Defines the operational mode of the trailing stop engine with four adaptive styles: Grip, Flow, Drift, and Glide. Grip offers tight stop management for scalping and high precision setups, while Glide allows wider flexibility for swing or long-term trades.
Trailing Stop Noise Filter : Applies an additional filtering layer that smooths minor fluctuations and prevents unnecessary stop adjustments caused by short-term market noise or micro volatility.
🟣 Display Settings
Show Trend on Candles : Displays the current trend direction directly on price candles by applying dynamic color coding. When Live Trend and Vision Trend align bullish, candles appear in green tones, while bearish alignment displays in red. If the two trends conflict, candle bodies turn hollow, marking a Trend Conflict Zone that signals potential indecision or upcoming reversal. This feature provides instant visual confirmation of market direction without the need for external indicators
Table on Chart : Allows users to choose whether the analytical table appears directly over the chart or positioned below it. This gives full control over screen layout based on personal workspace preference and chart design.
Number of Symbols : Controls how many symbols are displayed in the screener table, adjustable from 10 up to 20 in steps of 2. This flexibility helps balance between detailed screening and visual clarity on different screen sizes.
Table Mode : Defines how the screener table is visually arranged.
Basic Mode : Displays all symbols in a single column for vertical readability.
Extended Mode : Arranges symbols side by side in pairs to create a more compact and space-efficient layout.
Table Size : Adjusts the visual scaling of the table. Available options include auto, tiny, small, normal, large, and huge, allowing traders to optimize table visibility based on their screen resolution and preferred chart density.
Table Position : Determines the exact placement of the screener table within the chart interface. Users can select from nine available alignments combining top, middle, and bottom vertically with left, center, and right horizontally.
🟣 Symbol Settings
Each of the 10 available symbol slots includes a full range of adjustable parameters for personalized analysis.
Symbol : Defines or selects the asset to be tracked in the screener, such as XAUUSD, BTCUSD, or EURUSD. This enables multi-asset scanning across different markets including forex, commodities, indices, and crypto.
Timeframe : Sets the specific timeframe for analysis for each selected symbol. Examples include 15 minutes, 1 hour (60), 4 hours (240), or 1 day (1D). This flexibility ensures precise control over how each asset is monitored within the multi-timeframe structure.
🟣 Alert Settings
Alert : Enables alerts for AAS.
Message Frequency : Determines the frequency of alerts. Options include 'All' (every function call), 'Once Per Bar' (first call within the bar), and 'Once Per Bar Close' (final script execution of the real-time bar). Default is 'Once per Bar'.
Show Alert Time by Time Zone : Configures the time zone for alert messages. Default is 'UTC'.
🔵 Conclusion
Understanding financial markets requires more than indicators, it demands a framework that captures the interaction of price, volatility, and structure in real time. This analytical system achieves that by combining mean reversion logic, volatility mapping, and dynamic supply and demand modeling into an adaptive, data-driven environment. Its computational bands and trend layers visualize market intent, showing when momentum is strengthening, fading, or preparing to shift.
Each signal, derived from statistical equilibrium rather than delayed indicators, reflects the exact moment when the balance between buyers and sellers changes. Variables like Live Trend, Vision Trend, Directional Strength, and ATR-based Volatility Context help traders assess signal quality and alignment across multiple timeframes. The system blends automation with human interpretation, preserving macro-to-micro consistency and enabling confident entries, exits, and stop management through its adaptive Trailing Stop Engine.
Every component, from color-coded zones to hollow candles, forms part of a broader narrative that teaches traders to read the market’s language instead of reacting to it. Built on self-correcting analysis, the framework continuously recalibrates with live data. By transforming volatility, liquidity, and price behavior into structured insight, it empowers traders to move from reaction to prediction, a living ecosystem that evolves with both the market and the trader.
Ücretli komut dosyası

ROC | QuantumResearch🔍 QuantumResearch ROC Screener
The QuantumResearch ROC Screener is an advanced multi-asset momentum analyzer designed to track relative strength across up to 11 user-defined assets using Rate of Change (ROC). This tool helps traders identify outperformers, underperformers, and rotation opportunities in fast-moving markets.
🧠 How It Works
This screener systematically calculates the Rate of Change (ROC) for each selected asset using two perspectives:
Absolute ROC – Measures the momentum of each asset individually over the chosen lookback period.
Relative ROC Matrix – Compares each asset against every other asset (e.g., BTC vs ETH, ETH vs SOL, etc.) using pairwise ROC ratios.
These values are organized into a dynamic heatmap-style table, highlighting which assets exhibit the strongest directional moves and relative strength. The script also includes:
Averages across all relative pairs to rank each asset.
Color-coded visuals to identify bullish (green), bearish (red), and neutral (white) ROC values.
📊 Main Features
🔢 Up to 11 Assets: Choose any combination of crypto, forex, indices, or commodities.
💡 Pairwise Comparison Matrix: Visualizes each asset’s ROC vs every other asset.
📈 Momentum Ranking: Assets are sorted based on their total average ROC score.
🎨 Color-Coded Table: Makes it easy to spot high or low momentum tokens at a glance.
⚙️ Custom ROC Period: Choose the length of the momentum window.
🧩 Flexible Layout: Position the table anywhere on your screen and adjust font size.
✅ How to Use It
Select your favorite 11 assets (e.g., BTC, ETH, SOL, etc.).
Adjust the ROC length to capture short-term or medium-term momentum.
Spot top trending assets.
Identify reversals or breakouts.
Build rotational or relative strength strategies.
⚠️ Important Notes
Momentum is a powerful tool, but context matters — combine ROC readings with your broader strategy (trend, liquidity, valuation).
This screener is not predictive — it reflects past performance over a defined lookback window.
📉 Disclaimer
Past performance is not indicative of future results. This tool is designed to provide data-driven insight, not financial advice. Always conduct your own research and apply proper risk management.

Enhanced Buy/Sell Pressure, Volume, and Trend Bar analysisEnhanced Buy/Sell Pressure, Volume, and Trend Bar Analysis Indicator
Overview
This indicator is designed to help traders identify buy and sell pressure, volume changes, and overall trend direction in the market. It combines multiple concepts like price action, volume, and trend analysis, candlestick anaysis to provide a comprehensive view of market dynamics. The visual elements are intuitive, making it suitable for traders at different levels. This indicator works together with Enhanced Pressure MTF Screener which is a screener based of this indicator to make it easier to see Bullish/Bearish pressures and trend across multiple timeframes.
Image below: is the Enhanced Buy/Sell Pressure, Volume, and Trend Bar Analysis with the Enhanced Pressure MTF Screener indicator both active together.
Key Features
1.Buy/Sell Pressure Identification
Buy Pressure: Calculated based on price movement where the close price is higher than the opening price.
Sell Pressure: Calculated when the closing price is equal to or lower than the opening price.These pressures help you understand whether buyers or sellers are more dominant for each bar.
2.Volume Analysis
Normalized Volume: Volume data is normalized, making it easier to compare volume levels over different periods.
Volume Histogram: The volume is also presented as a histogram for easy visualization, showing whether the current volume is higher or lower compared to the average.
3.Simplified Coloring Option
You can choose to simplify the coloring of bars to reflect the dominant pressure: green for bullish pressure and red for bearish pressure. This makes it visually easier to identify who is in control. When simplified coloring is disabled, the bars' colors will represent the combined effect of buy and sell pressure.
4.Heikin-Ashi Candles for Pressure Calculation
The indicator includes an option to use Heikin-Ashi candles instead of traditional candles to calculate buy and sell pressure. Heikin-Ashi candles are known for smoothing out price action and providing a clearer trend representation.
5.Trend Background Coloring
This feature uses exponential moving averages (EMAs) to determine the trend:
Short-Term EMA vs. Long-Term EMA: When the short-term EMA is above the long-term EMA, the trend is considered bullish, and vice versa.
The background color changes based on the identified trend: green for an uptrend and red for a downtrend. This feature helps visualize the overall market direction at a glance.
6.Signals for Key Price Actions
The indicator plots various symbols to signal important price movements:
Bullish Close (▲): Indicates a strong upward movement where the close price crosses above the open.
Bearish Close (▼): Indicates a downward movement where the close price falls below the open.
Higher High (•): Highlights new highs compared to previous bars, useful for confirming an uptrend.
Lower Low (•): Highlights lower lows compared to previous bars, which can indicate a downtrend or bearish pressure.
Calculations Explained
1.Buy and Sell Pressure Calculation
The buy pressure is determined by the price range (high - low) if the closing price is above the opening price, indicating an increase in value.
The sell pressure is similarly calculated when the closing price is equal to or below the opening price.
The indicator uses the Average True Range (ATR) for normalization. Normalizing helps you compare pressure across different periods, regardless of market volatility.
2.Volume Normalization
Volume Normalization: To make volume comparable across different periods, the indicator normalizes it using the Simple Moving Average (SMA) of volume over a user-defined length.
Volume Histogram: The histogram provides a clear representation of volume changes compared to the average, making it easier to spot unusual activity that may indicate market shifts.
3.Combined Pressure Calculation
The indicator calculates a combined pressure value by subtracting sell pressure from buy pressure.
When combined pressure is positive, buying is dominant, and when negative, selling is dominant. This helps in visually understanding the ongoing momentum.
4.Trend Calculation
The indicator uses two EMAs to determine the trend:
Short-Term EMA (default 14-period) to capture recent price movements.
Long-Term EMA (default 50-period) to provide a broader trend perspective.
By comparing these EMAs on a higher timeframe, the indicator can identify whether the trend is up or down, making it easier for traders to align their trades with the larger market movement.
Inputs and Customization
The indicator provides several options for customization, allowing you to adjust it to your preferences:
SMA Length: Determines the lookback period for moving averages and volume normalization. A longer length provides more smoothing, whereas a shorter length makes the indicator more responsive.
Buy/Sell/Volume Colors: Customize the colors used to represent buying, selling, and volume to suit your preferences.
Heikin Ashi Option: Toggle between using Heikin Ashi or traditional OHLC (Open-High-Low-Close) candles for pressure calculations.
Trend Timeframe and EMA Periods: You can choose different timeframes and EMA periods for trend analysis to suit your trading strategy.
How to Use This Indicator
Identifying Market Momentum: Use the buy/sell pressure columns to see which side (buyers or sellers) is in control. Positive pressure combined with green color indicates strong buying, while red indicates selling.
Volume Confirmation: Check the volume area plot and histogram. High volume coupled with strong pressure is a sign of conviction, meaning the current move has backing from market participants.
Trend Identification: The trend background color helps identify the overall trend direction. Trade in the direction of the trend (e.g., take long positions during a green background).
Signal Indicators: The plotted symbols like "Bullish Close" and "Bearish Close" provide visual signals of key price actions, useful for timing entry or exit points.
Practical use Example
Scenario: The market is consolidating, and you see alternating green and red bars.
Action: Wait for a consistent sequence of green bars (buy pressure) along with a green background (uptrend) to consider going long, although you can go long without having a green background, the background adds confirmation layer.
Scenario: The market has several bearish closes (red ▼ symbols) accompanied by increasing volume.
Action: This could indicate strong selling pressure. If the background also turns red, it might be a good time to exit long positions or consider shorting.
Higher timeframe pressure and volume: Another way to use the indicator is to check buy/sell volume and pressure of the higher timeframe say weekly or daily or any timeframe you consider higher, once you’ve identified or feel confident in which direction the bar is going along with the full picture of trend, you can go to the lower timeframe and wait for it to sync with the higher timeframe to consider a long or a short. It is also easier to see when markets sync up by also applying the Enhanced Pressure MTF Screener which works in companion to this indicator.
Visual Cues and Interpretation
Combined Pressure Plot: The green and red column plot at the bottom of the chart represents the dominance between buying and selling. Tall green bars signify strong buying, while tall red bars indicate selling dominance.
Trend Background: Helps visualize the overall direction without manually drawing trend lines. When the background turns green, it generally indicates that the shorter-term moving average has crossed above the longer-term average—a sign of a bullish trend.
To Summarize shortly
The Enhanced Buy/Sell Pressure, Volume, and Trend Bar Analysis Indicator is an advanced but simple tool designed to help traders visually understand market dynamics. It combines different aspects of market analysis of candle pressure from buyers and sellers, volume confirmation, and trend identification into a single view, which can assist both new and experienced traders in making informed trading decisions.
This indicator:
Saves time by simplifying market analysis.
Provides clear visual cues for buy/sell pressure, volume, and trend.
Offers customizable settings to suit individual trading styles.
Always, I am happy to share my creations with you all for free. If you guys have cool ideas you would like to share, or suggestions for improvements the comment is below and I hope this overview gave an idea of how to use the indicator :D

MetaFOX DCA (ASAP-RSI-BB%B-TV)Welcome To ' MetaFOX DCA (ASAP-RSI-BB%B-TV) ' Indicator.
This is not a Buy/Sell signals indicator, this is an indicator to help you create your own strategy using a variety of technical analyzing options within the indicator settings with the ability to do DCA (Dollar Cost Average) with up to 100 safety orders.
It is important when backtesting to get a real results, but this is impossible, especially when the time frame is large, because we don't know the real price action inside each candle, as we don't know whether the price reached the high or low first. but what I can say is that I present to you a backtest results in the worst possible case, meaning that if the same chart is repeated during the next period and you traded for the same period and with the same settings, the real results will be either identical to the results in the indicator or better (not worst). There will be no other factors except the slippage in the price when executing orders in the real trading, So I created a feature for that to increase the accuracy rate of the results. For more information, read this description.
Below I will explain all the properties and settings of the indicator:
A) 'Buy Strategies' Section: Your choices of strategies to Start a new trade: (All the conditions works as (And) not (OR), You have to choose one at least and you can choose more than one).
- 'ASAP (New Candle)': Start a trade as soon as possible at the opening of a new candle after exiting the previous trade.
- 'RSI': Using RSI as a technical analysis condition to start a trade.
- 'BB %B': Using BB %B as a technical analysis condition to start a trade.
- 'TV': Using tradingview crypto screener as a technical analysis condition to start a trade.
B) 'Exit Strategies' Section: Your choices of strategies to Exit the trades: (All the conditions works as (And) not (OR), You can choose more than one, But if you don't want to use any of them you have to activate the 'Use TP:' at least).
- 'ASAP (New Candle)': Exit a trade as soon as possible at the opening of a new candle after opening the previous trade.
- 'RSI': Using RSI as a technical analysis condition to exit a trade.
- 'BB %B': Using BB %B as a technical analysis condition to exit a trade.
- 'TV': Using tradingview crypto screener as a technical analysis condition to exit a trade.
C) 'Main Settings' Section:
- 'Trading Fees %': The Exchange trading fees in percentage (trading Commission).
- 'Entry Price Slippage %': Since real trading differs from backtest calculations, while in backtest results are calculated based on the open price of the candle, but in real trading there is a slippage from the open price of the candle resulting from the supply and demand in the real time trading, so this feature is to determine the slippage Which you think it is appropriate, then the entry prices of the trades will calculated higher than the open price of the start candle by the percentage of slippage that you set. If you don't want to calculate any slippage, just set it to zero, but I don't recommend that if you want the most realistic results.
Note: If (open price + slippage) is higher than the high of the candle then don't worry, I've kept this in consideration.
- 'Use SL': Activate to use stop loss percentage.
- 'SL %': Stop loss percentage.
- 'SL settings options box':
'SL From Base Price': Calculate the SL from the base order price (from the trade first entry price).
'SL From Avg. Price': Calculate the SL from the average price in case you use safety orders.
'SL From Last SO.': Calculate the SL from the last (lowest) safety order deviation.
ex: If you choose 'SL From Avg. Price' and SL% is 5, then the SL will be lower than the average price by 5% (in this case your SL will be dynamic until the price reaches all the safety orders unlike the other two SL options).
Note: This indicator programmed to be compatible with '3COMMAS' platform, but I added more options that came to my mind.
'3COMMAS' DCA bots uses 'SL From Base Price'.
- 'Use TP': Activate to use take profit percentage.
- 'TP %': Take profit percentage.
- 'Pure TP,SL': This feature was created due to the differences in the method of calculations between API tools trading platforms:
If the feature is not activated and (for example) the TP is 5%, this means that the price must move upward by only 5%, but you will not achieve a net profit of 5% due to the trading fees. but If the feature is activated, this means that you will get a net profit of 5%, and this means that the price must move upward by (5% for the TP + the equivalent of trading fees). The same idea is applied to the SL.
Note: '3COMMAS' DCA bots uses activated 'Pure TP,SL'.
- 'SO. Price Deviation %': Determines the decline percentage for the first safety order from the trade start entry price.
- 'SO. Step Scale': Determines the deviation multiplier for the safety orders.
Note: I'm using the same method of calculations for SO. (safety orders) levels that '3COMMAS' platform is using. If there is any difference between the '3COMMAS' calculations and the platform that you are using, please let me know.
'3COMMAS' DCA bots minimum 'SO. Price Deviation %' is (0.21)
'3COMMAS' DCA bots minimum 'SO. Step Scale' is (0.1)
- 'SO. Volume Scale': Determines the base order size multiplier for the safety orders sizes.
ex: If you used 10$ to buy at the trade start (base order size) and your 'SO. Volume Scale' is 2, then the 1st SO. size will be 20, the 2nd SO. size will be 40 and so on.
- 'SO. Count': Determines the number of safety orders that you want. If you want to trade without safety orders set it to zero.
'3COMMAS' DCA bots minimum 'SO. Volume Scale' is (0.1)
- 'Exchange Min. Size': The exchange minimum size per trade, It's important to prevent you from setting the base order Size less than the exchange limit. It's also important for the backtest results calculations.
ex: If you setup your strategy settings and it led to a loss to the point that you can't trade any more due to insufficient funds and your base order size share from the strategy becomes less than the exchange minimum trade size, then the indicator will show you a warning and will show you the point where you stopped the trading (It works in compatible with the initial capital). I recommend to set it a little bit higher than the real exchange minimum trade size especially if you trade without safety orders to not stuck in the trade if you hit the stop loss
- 'BO. Size': The base order size (funds you use at the trade entry).
- 'Initial Capital': The total funds allocated for trading using your strategy settings, It can be more than what is required in the strategy to cover the deficit in case of a loss, but it should not exceed the funds that you actually have for trading using this strategy settings, It's important to prevent you from setting up a strategy which requires funds more than what you have. It's also has other important benefits (refer to 'Exchange Min. Size' for more information).
- 'Accumulative Results': This feature is also called re-invest profits & risk reduction. If it's not activated then you will use the same funds size in each new trade whether you are in profit or loss till the (initial capitals + net results) turns insufficient. If it's activated then you will reuse your profits and losses in each new trade.
ex: The feature is active and your first trade ended with a net profit of 1000$, the next trade will add the 1000$ to the trade funds size and it will be distributed as a percentage to the BO. & SO.s according to your strategy settings. The same idea in case of a loss, the trade funds size will be reduced.
D) 'RSI Strategy' Section:
- 'Buy': RSI technical condition to start a trade. Has no effect if you don't choose 'RSI' option in 'Buy Strategies'.
- 'Exit': RSI technical condition to exit a trade. Has no effect if you don't choose 'RSI' option in 'Exit Strategies'.
E) 'TV Strategy' Section:
- 'Buy': TradingView Crypto Screener technical condition to start a trade. Has no effect if you don't choose 'TV' option in 'Buy Strategies'.
- 'Exit': TradingView Crypto Screener technical condition to exit a trade. Has no effect if you don't choose 'TV' option in 'Exit Strategies'.
F) 'BB %B Strategy' Section:
- 'Buy': BB %B technical condition to start a trade. Has no effect if you don't choose 'BB %B' option in 'Buy Strategies'.
- 'Exit': BB %B technical condition to exit a trade. Has no effect if you don't choose 'BB %B' option in 'Exit Strategies'.
G) 'Plot' Section:
- 'Signals': Plots buy and exit signals.
- 'BO': Plots the trade entry price (base order price).
- 'AVG': Plots the trade average price.
- 'AVG options box': Your choice to plot the trade average price type:
'Avg. With Fees': The trade average price including the trading fees, If you exit the trade at this price the trade net profit will be 0.00
'Avg. Without Fees': The trade average price but not including the trading fees, If you exit the trade at this price the trade net profit will be a loss equivalent to the trading fees.
- 'TP': Plots the trade take profit price.
- 'SL': Plots the trade stop loss price.
- 'Last SO': Plots the trade last safety order that the price reached.
- 'Exit Price': Plots a mark on the trade exit price, It plots in 3 colors as below:
Red (Default): Trade exit at a loss.
Green (Default): Trade exit at a profit.
Yellow (Default): Trade exit at a profit but this is a special case where we have to calculate the profits before reaching the safety orders (if any) on that candle (compatible with the idea of getting strategy results at the worst case).
- 'Result Table': Plots your strategy result table. The net profit percentage shown is a percentage of the 'initial capital'.
- 'TA Values': Plots your used strategies Technical analysis values. (Green cells means valid condition).
- 'Help Table': Plots a table to help you discover 100 safety orders with its deviations and the total funds needed for your strategy settings. Deviations shown in red is impossible to use because its price is <= 0.00
- 'Portfolio Chart': Plots your Portfolio status during the entire trading period in addition to the highest and lowest level reached. It's important when evaluating any strategy not only to look at the final result, but also to look at the change in results over the entire trading period. Perhaps the results were worryingly negative at some point before they rose again and made a profit. This feature helps you to see the whole picture.
- 'Welcome Message': Plots a welcome message and showing you the idea behind this indicator.
- 'Green Net Profit %': It plots the 'Net Profit %' in the result table in green color if the result is equal to or above the value that you entered.
- 'Green Win Rate %': It plots the 'Win Rate %' in the result table in green color if the result is equal to or above the value that you entered.
- 'User Notes Area': An empty text area, Feel free to use this area to write your notes so you don't forget them.
The indicator will take care of you. In some cases, warning messages will appear for you. Read them carefully, as they mean that you have done an illogical error in the indicator settings. Also, the indicator will sometimes stop working for the same reason mentioned above. If that happens then click on the red (!) next to the indicator name and read the message to find out what illogical error you have done.
Please enjoy the indicator and let me know your thoughts in the comments below.
